
Abstract
Estimating prescription medicine use is challenging due to recall bias associated with surveys and coverage bias in administrative data. This study assesses how making operational improvements and combining both survey and administrative data sources can increase data quality on filled prescriptions. We use data from the Medicare Current Beneficiary Survey (MCBS) and administrative data from the Centers for Medicare and Medicaid Services (CMS). First, we investigate improvements from a prescription medicine lookup (PMLU) tool integrating a commercial medicine database into the MCBS. We then examine impacts of matching survey-reported medicines to Part D claims. We find that the PMLU improves accuracy and reduces measurement bias. Claims matching identifies additional medicines, especially for beneficiaries with more chronic conditions and medicines. This study shows that integrating a commercial database and supplementing with administrative data improves data quality and reduces sources of error.
Introduction
Regular use of prescription medicines is common among older Americans (Tan et al. 2016). Accurate estimation of prescription medicine use for this population is essential to health care policy but is challenging because there is no comprehensive source of medicine usage across the general population (Kaufman et al. 2002). The most common sources are representative sample surveys that provide self-reported data and administrative records. However, neither source offers complete coverage of all prescribed medicines or populations, leaving gaps in knowledge (Zuvekas 2017). In this study, we use a representative sample survey of Medicare beneficiaries linked to administrative claims to assess how a combined approach may improve the quality of reporting and reduce measurement bias for subpopulations, increasing the accuracy of population-level estimates of filled prescription medicines in the Medicare population.
We draw on the conceptual framework of total survey error (TSE) to assess prescription medicine data quality. The accuracy of a survey estimate is determined by the difference between the estimate and true value within the population of interest, where that difference represents the summed impact of multiple sources of error. The TSE framework (Groves et al. 2009; Groves and Lyberg 2010) divides sources of error into two categories: sampling and non-sampling. Sampling error occurs whenever population characteristics are estimated based on a sample of that population and varies by sample size and survey design. Non-sampling error includes: • measurement error resulting from recall problems or poor questionnaire design. • non-response error when some sample members skip questions or do not participate. • coverage error where a subset of the population is excluded or some units sampled do not belong in the population, resulting in discrepancies between the population of interest and the sampling frame.
Survey researchers use TSE as an indicator of data quality and attempt to minimize it in survey designs (Biemer 2010).
In this study, we address several sources of non-sampling error in estimating filled prescriptions based on survey and administrative data. We outline an approach for mitigating these errors by combining data sources. Survey-based approaches are often subject to measurement error and non-response error due to recall problems, respondent burden, mode effects, and interviewer effects. In contrast, administrative data sources primarily suffer from coverage error. Combining survey and administrative data can lead to higher quality estimates by compensating for the respective errors in each data source. We believe an approach informed by the TSE framework is a useful extension of prior methodological work comparing respondents’ self-reported survey data and administrative data (Sjahid et al. 1998). Such comparisons provide insight into only one aspect of non-sampling error (recall bias in self-reports) and do not address coverage issues with administrative data. Our combined approach sheds light on the scope of potential coverage issues. It also addresses non-response bias that results from differential reporting of prescription medicines by beneficiary characteristics.
Representative surveys are often used to collect self-reported medicine data (Mitchell et al. 2006). The National Social Life, Health, and Aging Project (NSHAP), National Health and Nutrition Examination Survey (NHANES), and Medical Expenditure Panel Survey (MEPS) use household surveys to collect these data from nationally representative samples (CDC 2021; Cohen et al. 2009; Kantor et al. 2015; Qato et al. 2016). Survey data can help identify prescription medicines and provide context on sociodemographic and health characteristics. However, self-reports are vulnerable to error stemming from recall issues and difficulties collecting accurate medicine names and classifications, like high missingness, incomplete reporting, duplication, inaccurate names, and logical inconsistencies (Gnjidic et al. 2017; Zhang and Koru 2020). Additionally, the lack of standardization in data collection protocols, like the use of verbatim responses of medicine names, means that self-reported data can be difficult to compare across surveys (Klungel et al. 2000). These errors are likely spread unevenly across populations. Previous studies have shown underreporting for heavy health care consumers (Ritter et al. 2001) and inconsistent reporting among low literacy respondents (Schönfeld et al. 2021).
Some estimates of prescription medicine use rely exclusively on administrative records like claims or pharmacy records to avoid recall bias and misclassification associated with self-reporting. Administrative data are standardized with fewer missing or inaccurate values. Exclusive use of administrative data can, however, introduce coverage error if the full population is not included. Medicare Part D claims data exclude beneficiaries without Part D coverage—an estimated 30% of the Medicare population (CMS 2020a). Claims data are often not timely and do not capture medicines taken as needed (Dolja-Gore et al. 2013) or provided by federal pharmacies (Hill et al. 2011). Claims data also lack the sociodemographic and health information collected in surveys and therefore cannot provide context surrounding medicine use. Moreover, both claims and pharmacy data represent prescriptions filled, but not necessarily used.
Pharmacy data like the IQVIA Total Patient Tracker used by the Centers for Disease Control and Prevention (CDC) for prescription medicine surveillance offer coverage of the medicine market (IQVIA 2021). These databases do not, however, capture medicines filled through the Veterans Health Administration or mail order (CDC 2019). State-based databases exist as part of the Prescription Drug Monitoring Program but are typically limited to controlled substances and may not support national estimates since implementation and data sharing does not occur across states (D’Souza et al. 2020; Office of National Drug Control Policy 2011).
An alternative to relying exclusively on survey versus administrative data is an approach combining the two. Linkage to administrative data can supplement survey data by filling in data gaps and increasing reporting accuracy (Riley 2009). For example, MEPS asks participants for permission to contact pharmacies to fill survey data gaps (Cohen et al. 2009). NHANES survey data have been linked to claims data (CDC 2021; Kantor et al. 2015). While data linkage can be complicated by missing identifiers or data inaccuracies (Riley 2009), successful linkage can improve data quality.
This study uses data from the Medicare Current Beneficiary Survey (MCBS) to illustrate the strengths of a combined survey and administrative data approach in improving reporting quality and reducing measurement error. The MCBS allows for direct linkage between survey responses and Medicare Part D claims and is useful to assess how linking these data sources can ameliorate reporting error. We also highlight how operational changes in data collection improved the accuracy of self-reported medicines.
The MCBS is a continuous, longitudinal survey of a nationally representative sample of the Medicare population, conducted by the Centers for Medicare & Medicaid Services (CMS) through a contract with NORC at the University of Chicago. The MCBS is a premier source of prescription data for Medicare populations, informing policies and program advancements. Survey data are collected from longitudinal panels of beneficiaries at three points per year over four years for beneficiaries living in community residential and facility (long-term care) settings. These three data collection points are known as data collection rounds. Five consecutive rounds are combined to account for time gaps at the beginning or end of the calendar year and produce annualized data for each data year. Because MCBS data collection differs between community and facility settings, this analysis is limited to community-dwelling beneficiaries. Interviewers conduct the survey with the beneficiary or a knowledgeable proxy respondent and collect medicine name, strength, and form for all prescriptions filled by beneficiaries. The medicine data then undergo claims matching during data processing. The final MCBS data files released annually by CMS have two sources of information about medicines: survey reports and Medicare Part D claims.
Survey-collected prescription medicine data rely on respondent recall aided by documentation. Interviewers ask if beneficiaries filled any prescriptions since the prior interview and if they have documentation (e.g., prescription bottles) for their medicines. Interviewers use documentation to enter details into the questionnaire; otherwise, details are entered based on respondent recall. Surveys that attempt to match survey-reported medicines to standardized medicine list either conduct matching during or after data collection. While some surveys like MEPS and NSHAP use the latter approach—linking to a commercial medicine database in data processing (Davis et al. 2017; Qato et al. 2016)—the MCBS uses the former, which may lead to quality improvements.
Before the fall 2017 round, the MCBS questionnaire included a medicine lookup tool powered by a commercial database with a fixed set of search capabilities. Its use was optional, so interviewers used it inconsistently or entered medicines manually instead, resulting in data quality issues like misspelled names. To improve recall, reduce manual data entry, and standardize responses, the MCBS introduced the Prescription Medicine Lookup (PMLU) tool in 2017. The PMLU is a powerful search tool that leverages a commercial data source: the First Databank (FDB) MedKnowledge™ database, a comprehensive list of medicines approved by the U.S. Food and Drug Administration (USFDA) (FDB 2017).
Integrating the FDB database within the questionnaire enables matching of self-reported details to specific medicine records during data collection. The PMLU’s dynamic search options dramatically simplify this process compared to the “pre-PMLU” tool. It searches for medicines as interviewers start typing the name, displaying potential matches and making it easier to select the medicine and avoid misspellings. Once a name is entered, the tool presents corresponding medicine strengths and forms. If the interviewer cannot locate a medicine or the respondent cannot provide complete medicine details, the tool allows for manual entry of medicine name and “don’t know” responses for specific details. While the PMLU does not always ensure accuracy, as respondents may misremember their prescriptions, it does aid in recall when respondents may not remember complete details or correct spelling. Questionnaire paradata capture whether medicine details are retrieved from the PMLU.
For beneficiaries enrolled in Medicare Part D, survey-reported medicines and accompanying statements are matched to claims by CMS. Claims matching helps fill in details not reported in the survey, adds records for medicines missed in the survey, and identifies medicines and expenses that may not have been covered by Medicare. First, a hierarchical, sequential, and iterative match process is performed using medicine name, dosage, form, quantity, and cost (Eppig and Chulis 1997). The final MCBS data files include both survey-reported medicines with claims matches and medicines that were only present in one of the two sources: survey-only medicines and claims-only medicines. Second, because prescription fill dates are not collected in the survey and survey reference periods can span calendar years, the process removes medicines obtained outside the year of interest.
Of note, while the MCBS collects some information about the recommended and actual use of medicines, this study focuses on filled prescriptions, not medication adherence. Because the MCBS aims to quantify health care costs for the Medicare population, the survey and claims match process are designed to provide a full accounting of the cost of beneficiary prescriptions—regardless of medication adherence.
This study illustrates the impact of the PMLU tool and claims matching on MCBS data quality, specifically the extent to which the survey data suffer from quality issues and measurement error; how measurement error varies by beneficiary and medicine characteristics; and how the combined approach mitigates sources of error. We address three research questions:
1. Can a questionnaire lookup tool powered by a commercial database improve the quality of self-reported prescription medicine data by improving recall and reporting accuracy? 2. What does Part D claims matching in post-processing reveal about improvements to survey data quality after the addition of the PMLU tool? What gaps in recall remain, and what gaps are discovered when medicines are present in claims data but not reported in the survey? 3. What do these gaps reveal about potential measurement bias among beneficiaries with different sociodemographic and health characteristics?
Methods
We use different data sources, analytic universes, and measures for our research questions. Because these investigations are methodological and the MCBS does not create weights for these subsets of the Medicare population, analyses are unweighted, so inference to the general Medicare population is not possible.
Medicare Current Beneficiary Survey Prescription Medicine Data Processing
Our analysis uses three data sources, most of which are standard products of MCBS data processing. Because the MCBS involves multiple interviews per year, the first step of prescription medicine data processing occurs at the end of each data collection round. To produce the final round-based data, data are combined with the other rounds that comprise the “data year” for annual processing. We use the 2016–2018 final round-based medicine data, which include the survey-reported data and PMLU paradata, to answer our first question regarding the PMLU’s impact on data quality.
In standard processing, the final round-based data are combined into annual files, matched to Part D claims by CMS, and released annually as the MCBS Cost Supplement Limited Data Set (LDS) Prescription Medicine Event (PME) segment (CMS 2018a). These data include survey-reported medicines and medicines found in claims data. CMS releases beneficiary sociodemographic and health-related data annually in the MCBS Survey File LDS (CMS 2018b). We use the 2018 MCBS Cost Supplement LDS PME segment and Survey File LDS to address our second and third questions.
Analytic Dataset Creation
To assess changes over time after the introduction of the PMLU, we use final 2016–2018 round-based data. The 2016 MCBS used the pre-PMLU tool, while the 2018 MCBS used the new PMLU. The 2017 MCBS included a combination of both since the PMLU was introduced partway through the year; two rounds of 2017 data were collected using the pre-PMLU, while the third round was collected with the new PMLU. These data include 14,920 beneficiaries for 2018, 14,518 for 2017, and 14,430 for 2016.
For the remaining research questions, we combine 2018 MCBS Cost Supplement PME data and Survey File data. Because we focus on annual medicine use, we limit the analytic universe to 8,110 community-dwelling beneficiaries who completed at least two MCBS interviews during 2018 and were included in the 2018 Cost Supplement. While three interviews per year is most common, beneficiaries can miss an interview and remain in the MCBS if they do not miss two consecutive interviews (CMS 2020b). Our analysis includes beneficiaries who missed one interview because they were unreachable, moved to a facility, or lost entitlement or died before their third interview.
Impact of Questionnaire Lookup Tool Our first question is how introducing the PMLU affected data quality. The measure of interest is the proportion of medicines for which interviewers can use respondent-reported details to locate a matching medicine within the PMLU, or the rate at which medicines were “found” within the PMLU. Having complete medicine information increases the likelihood that medicine records are matched to claims during data processing and then used in the pricing tool to assess costs of beneficiary medicines. Our analysis for this question uses final round-based MCBS data rather than annualized data publicly released by CMS. This is necessary to understand medicines found in the PMLU over time because paradata are only in the former, not the latter. The round-based data are combined into annual estimates to align with our other research questions. Given that the PMLU was implemented in fall 2017, we present results for both 2017, representing partial year implementation, and 2018, when all data were collected using the PMLU.
Impact of Claims Matching To assess the impact of augmenting survey-reported medicine data with claims, we use 2018 Cost Supplement and Survey File data. We use the paradata variable PDEFLAG to answer two questions about the proportion of medicines present in either data source. PDEFLAG has three values indicating the data source: (1) survey only; (2) claims only; and (3) survey and claims. First, we assess the proportion of survey-reported medicines successfully matched to claims (represented by the count of “survey and claims” records divided by the summed counts of “survey only” and survey and claims records). This outcome reflects the availability of claims data for subsets of the Medicare population and quality of survey-reported medicine data. The administrative data used in CMS matching are limited to Part D claims, so medicines are only matched to claims for beneficiaries with Part D coverage. Survey-reported medicines are usually only matched to claims if they have complete medicine name, strength, and form information, although matches with partial information are possible. Second, we assess the proportion of medicines “discovered” in claims data. These medicines were missing in the survey likely due to poor recall or intentional underreporting. This is measured by the count of “claims only” records as a proportion of all records. Additional medicines found in claims reduce undercounting in estimates.
Differential Claims Matching Impact Based on Beneficiary Characteristics We use a multivariate model to understand how underreporting differs by beneficiary characteristics and whether claims matching reduces measurement bias for subsets of the population. The dependent variable is the number of medicines not reported in the survey but discovered during claims matching for each beneficiary. This is represented by the count of beneficiary medicine records flagged as “claims only” in PDEFLAG. We include sociodemographic and health-related factors as predictors. We did not include a predictor for Part D coverage, but we do include dual eligibility to identify beneficiaries covered by Medicare and Medicaid (including Part D coverage). We use a negative binomial regression model, which is appropriate for modeling count data and includes a parameter that accounts for over-dispersed count data, meaning that the conditional variance exceeds the conditional mean.
Results
Impact of Questionnaire Lookup Tool
Proportion of Survey-reported Medicines Found in PMLU Tool by Year, 2018 MCBS.
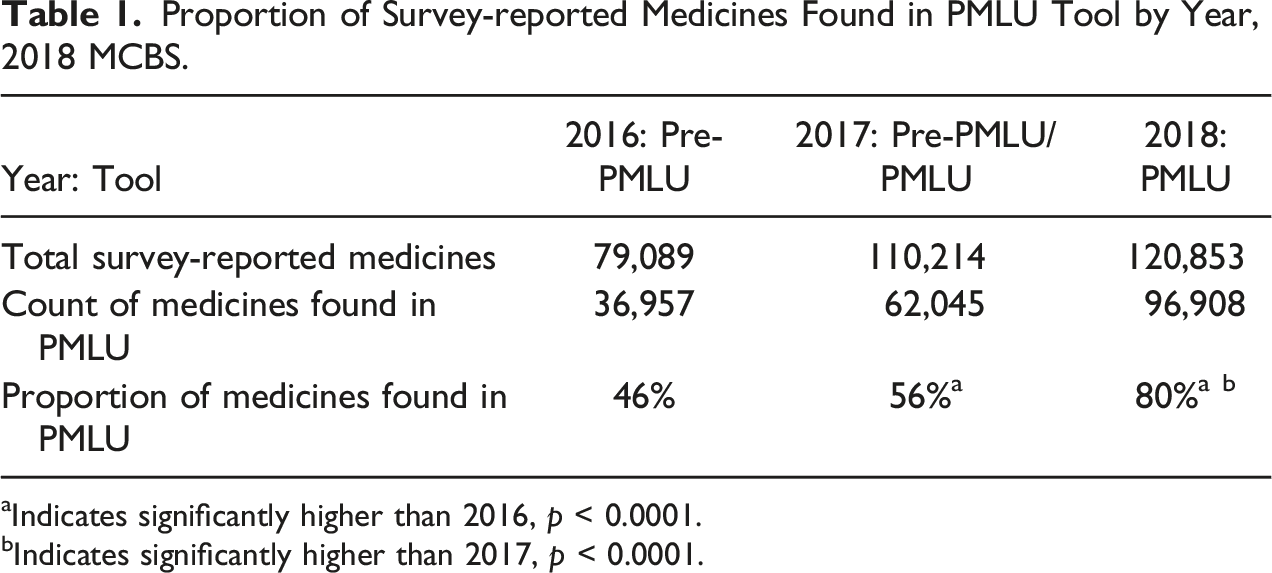
aIndicates significantly higher than 2016, p < 0.0001.
bIndicates significantly higher than 2017, p < 0.0001.
Proportion of Survey-reported Medicines Found in PMLU by Utilization Level, 2018 MCBS.
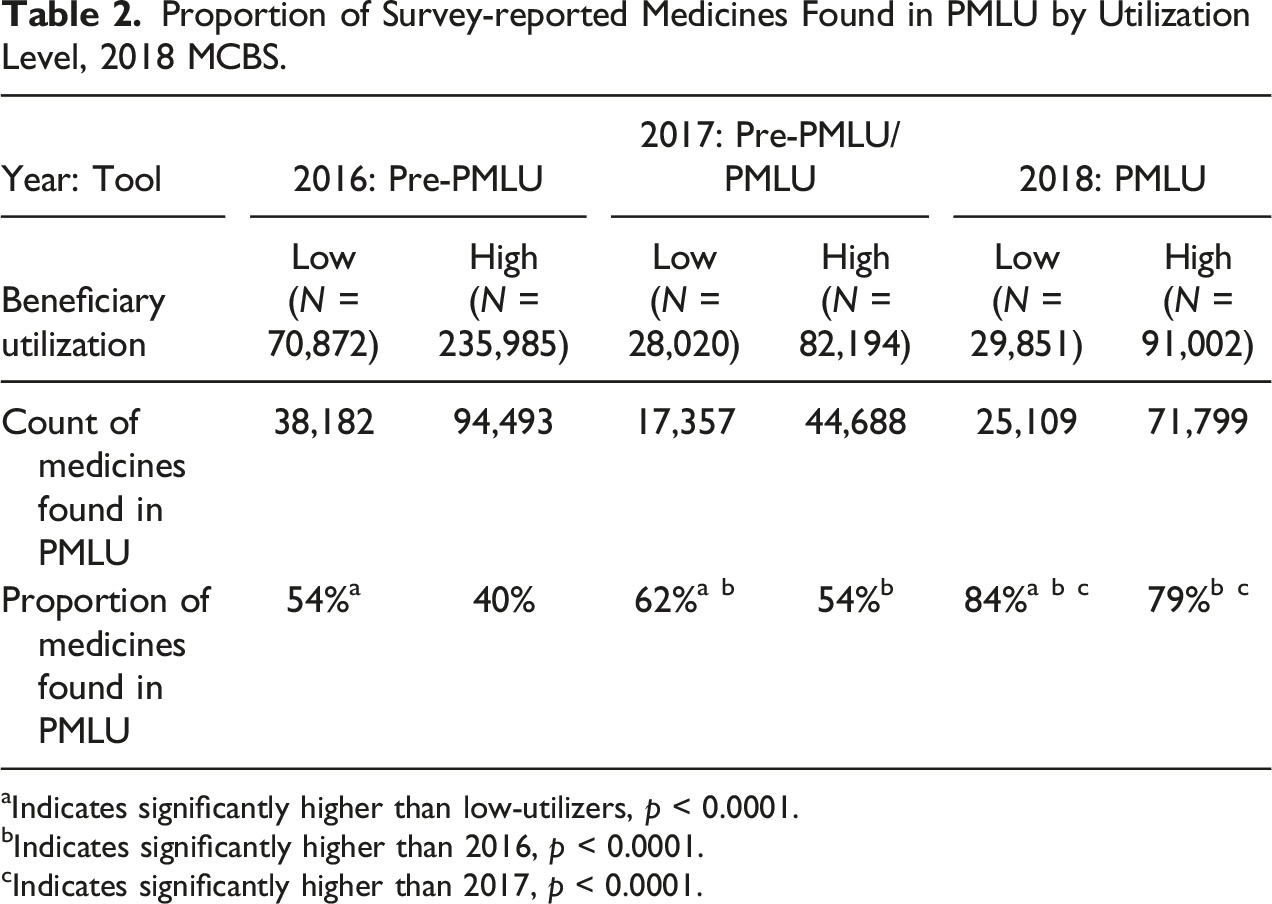
aIndicates significantly higher than low-utilizers, p < 0.0001.
bIndicates significantly higher than 2016, p < 0.0001.
cIndicates significantly higher than 2017, p < 0.0001.
Impact of Claims Matching
Among the 8,110 beneficiaries included in the 2018 Cost Supplement who completed at least two MCBS interviews, 80% had Part D coverage for at least 1 month, meaning claims data should be available for 80% of beneficiaries. We find that two-thirds (67%) of all medicines for Part D beneficiaries are categorized as “survey and claims,” meaning that the medicine was reported in the survey and matched to claims, 12% are only in survey data, and the remaining 20% are only in claims data. This finding is assessed in two ways.
First, for Part D beneficiaries, 85% of survey-reported medicines matched to claims. Since claims are not available for beneficiaries without Part D, 100% of medicines for those without Part D were unmatched. Second, for every seven medicines reported for Part D beneficiaries in the survey, two more medicines were added during claims matching. This suggests that claims matching improves reporting overall. We are, however, unable to adjust for underreporting of medicines for those without Part D. If underreporting rates are similar between beneficiaries with and without Part D, then we would expect that 20%–25% of medicines for beneficiaries without Part D are not captured by the MCBS.
After claims matching, the number of medicines reported for all beneficiaries in 2018 increased by 21%. This means that 17% of all medicines were discovered in claims matching.
Differential Claims Matching Impact Based on Beneficiary Characteristics
Negative Binomial Model Results for Number of Medicines Discovered in Part D Claims Data, 2018 MCBS.
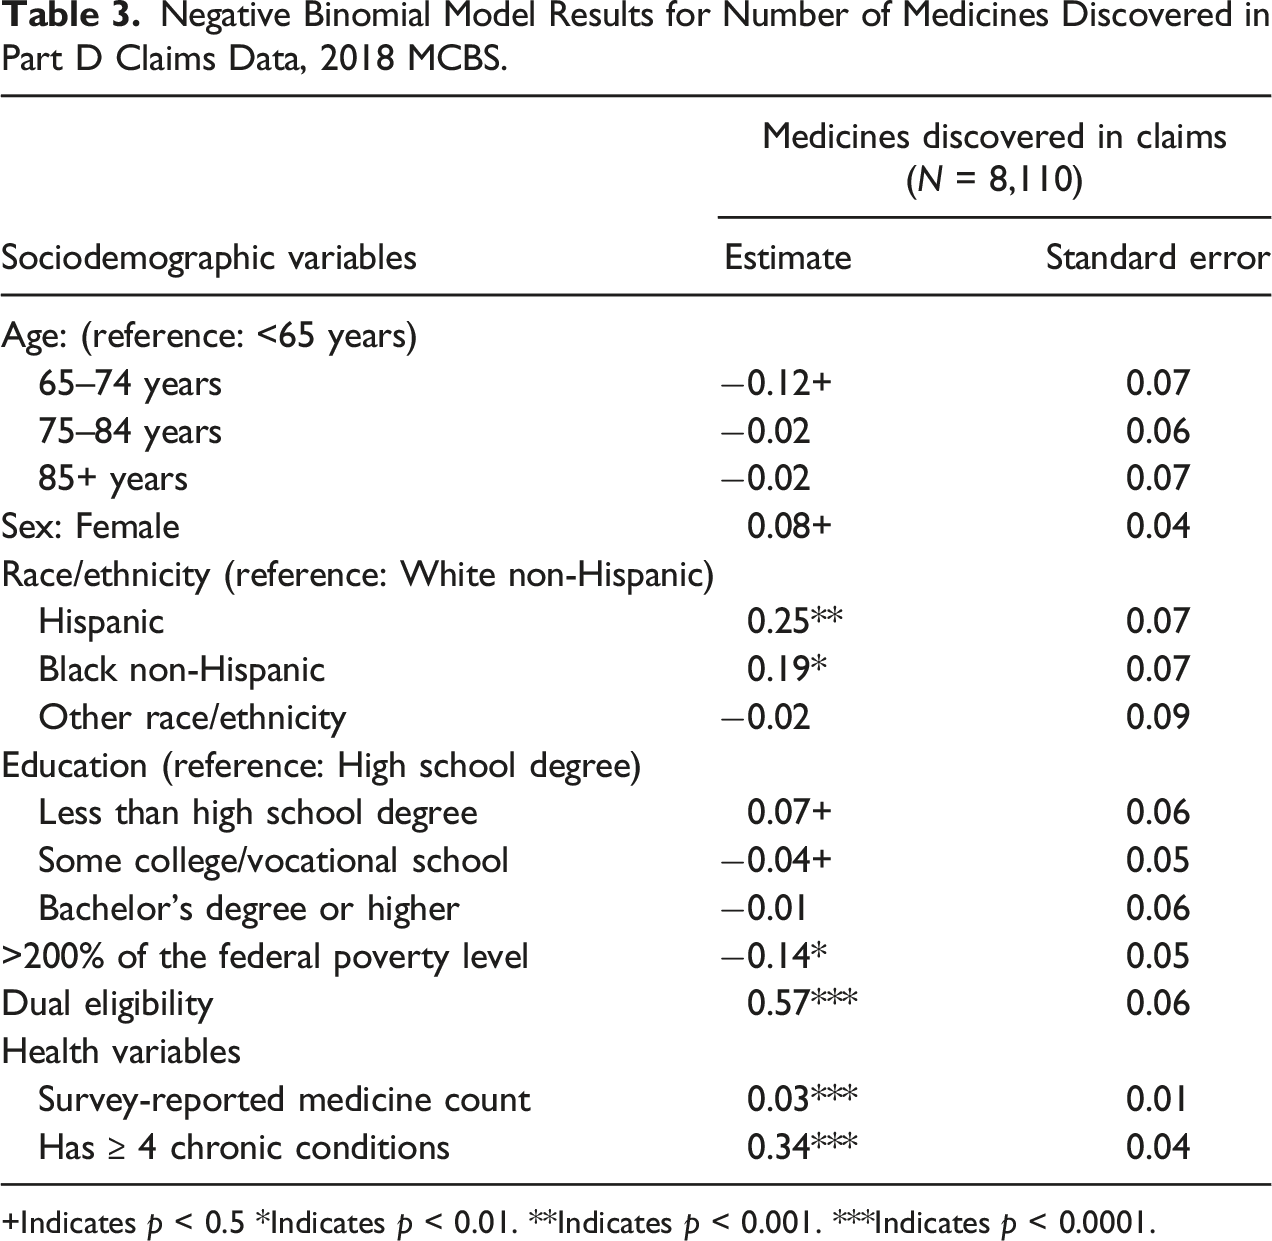
+Indicates p < 0.5 *Indicates p < 0.01. **Indicates p < 0.001. ***Indicates p < 0.0001.
Discussion
This study demonstrates several benefits of a prescription medicine data collection approach that uses survey reports supported by a lookup tool and claims data. This blended approach appears to improve data quality and reduce measurement bias, offering advantages over methodologies focused exclusively on either self-reports or administrative data (Dolja-Gore et al. 2013; Zhang and Koru 2020).
Results suggest that introducing the PMLU increased the likelihood that survey-reported medicines were found within the tool, leading to more consistent and robust MCBS data. We speculate that the tool’s ability to populate medicine names as interviewers typed made it easier to find matching medicines during the interview, supported respondent recall, reduced burden, increased efficiency, and prevented misspellings, leading to an overall increase in accuracy of survey-reported data. The increased ease of entering medications into the PMLU reduced non-response bias by enabling those who could not remember or could not spell medicine details to enter accurate information. The existing difference in data quality between high- and low-utilizers narrowed with the PMLU, suggesting that the tool was particularly effective for beneficiaries with many medicines overall—an important population to capture for Medicare policies.
While previous studies have used ancillary data to assess accuracy of self-reported data (DiSogra et al. 2010; Pasek et al. 2014), we examine how including ancillary data can enhance self-reported data and provide insight into the magnitude of recall bias among beneficiaries for whom ancillary data are not available. Overall, claims matching increases the number of medicines reported in the MCBS. Among Part D beneficiaries, the average number of medicines increased from seven to nine. Across all beneficiaries, the number of medicines increased by 21% after claims matching. While this illustrates that claims matching helps provide a more complete image of beneficiaries’ medicine use, the improvements are limited to those enrolled in Part D, so coverage issues remain, and this analysis did not attempt to account for medicines not reported by MCBS respondents.
Claims matching was most likely to yield additional medicine information for those with more chronic conditions and prescriptions. Claims matching proves to be an important addition to the survey-reported data to narrow gaps in reporting for vulnerable populations. The addition of claims data significantly increased the number of medicines reported for these subpopulations, reducing bias across the instrument. In our analysis, we did not investigate which classes of drugs are more likely to be underreported or overreported, which may shed additional light on accuracy of estimates.
This analysis uses the introduction of a commercial database and administrative claims matching to MCBS prescription medicine data collection and data processing as an example. However, this effort can inform other attempts to integrate survey-collected, commercial, and administrative data. Commercial data are widely available to researchers and may offer cost- and time-savings. The largest potential benefit may be substantial improvements in data quality. The addition of a commercial database and administrative claims matching can increase the accuracy and consistency of prescription medicines reported and uncover additional information that might otherwise go unreported by respondents.
Footnotes
Declaration of Conflicting Interests
The author(s) declared no potential conflicts of interest with respect to the research, authorship, and/or publication of this article.
Funding
The author(s) disclosed receipt of the following financial support for the research, authorship, and/or publication of this article: This work was supported by the Centers for Medicare & Medicaid Services.