
Abstract
Qualitative comparative analysis (QCA) is an empirical research method that has gained some popularity in the social sciences. At the same time, the literature has long been convinced that QCA is prone to committing causal fallacies when confronted with non-causal data. More specifically, beyond a certain case-to-factor ratio, the method is believed to fail in recognizing real data. To reduce that risk, some authors have proposed benchmark tables that put a limit on the number of exogenous factors given a certain number of cases. Many applied researchers looking for methodological guidance have since adhered to these tables. We argue that fears of inferential breakdown in QCA due to an “unfavorable” case-to-factor ratio are without foundation. What is more, we demonstrate that these benchmarks induce more fallacious inferences than they prevent. For valid causal inference, researchers are better off relying on the current state of knowledge in their respective fields.
Introduction
Qualitative comparative analysis (QCA) is a configurational research method that has gained some popularity in the social sciences, particularly in business, management, sociology, and political science (Rihoux et al. 2013; Thiem 2022a; Wagemann et al. 2016). At the same time, the methodological literature on QCA has long been convinced that the method is prone to committing causal fallacies when confronted with non-causal data. 1 In a widely noted symposium, Lieberson (2004:13–14), for instance, had hypothesized about 20 years ago that “[QCA’s] procedures do not rule out the possibility that the observations are all a random matter and/or that none of the causal variables were even measured.” Ten years later, Lucas and Szatrowski (2014:61) noted critically that the method “detects complex causality even though the data are noncausal,” a result that raises “serious doubts about QCA’s ability to avoid certifying spurious causal patterns.” 2 Such statements and other similar ones have since nurtured grave misgivings that the models inferred by QCA from a set of data would be nothing but algorithmic artefacts.
To minimize the risk of QCA committing causal fallacies, Marx (2010) as well as Marx and Dușa (2011) (the latter hereafter MD) have proposed comprehensive benchmark tables of case-to-factor ratios. For a given number of cases researchers may have in their data, these tables list an upper limit on the number of exogenous factors beyond which the models returned by QCA should not be trusted any more. Many applied researchers looking for methodological guidance on how to conduct a QCA study have since adhered to these tables (e.g., Avdagic 2010; Fagerholm 2016; Ide 2018; Muriaas et al. 2022). In contrast, we argue that such fears of a declining ability of QCA to properly uncover causal structures due to unfavorable case-to-factor ratios are without foundation. This argument is based on two pillars. First, every set of data generated by any proper causal structure can always be duplicated by an identical set of data generated by a purely random process. Demanding that a method abstain from inferences when the data could be non-causal is, therefore, futile. Instead, the expectation must be that a method presents an inference whenever the analyzed data could have been generated by a proper causal structure. The difference appears subtle, but its implications are consequential. Second, yet more importantly, we demonstrate, using extensive simulations and case-based evidence, that adherence to MD’s benchmarks tends to induce more fallacious inferences than it prevents. In other words, if their goal is valid causal inference with QCA, then applied researchers are better off not following MD’s benchmarks but, instead, should rely on the current state of knowledge in their respective field.
The structure of our article is as follows. First, we briefly contextualize and summarize MD’s argument. We then identify two consequential problems in their simulation design. Subsequently, we demonstrate the repercussions for causal inference with QCA when relying on MD’s benchmark tables.
The Context of Marx and Duşa’s Benchmark Tables
In a widely noted symposium comment on the use and utility of QCA, Harvard sociologist Stanley Lieberson (2004:14) had once hypothesized that the method would infer causal claims even from non-causal data, and would, therefore, be of no help to applied researchers interested in analyzing cause-effect relations. In reaction to this assertion, Marx (2010) carried out simulations with up to 50 cases and eight exogenous factors to test whether QCA would really be prone to derive consistent solutions from such data. The results led him to conclude that, given a certain number of cases, there indeed exists an upper limit on the number of exogenous factors that can be safely included in an analysis. 3 Beyond this limit, QCA would lose its power to recognize real data.
In a follow-up study, MD then extended the simulations implemented by Marx (2010) to 300 cases and 13 exogenous factors with the goal of establishing more comprehensive benchmark tables. To this end, the authors simulated no fewer than 5,382,000 data sets, 1,500 for each combination of a number of cases between two and 300, and a number of exogenous factors between two and 13. 4 Based on the results of these simulations, they reconfirmed Marx’s (2010) earlier findings that “[g]iven any particular number of cases, there is a ceiling to the number of conditions which can be included safely in an analysis” (MD 2011:121). For instance, users of QCA are cautioned against including more than four exogenous factors when they do not have more than 13 cases in their data (pp. 114–15). Many applied researchers from areas as diverse as education, management, political science, and sociology have since adhered to MD’s benchmarks when carrying out their empirical analyses (e.g., Avdagic 2010; Boogaerts and Drieskens 2020; Fagerholm 2016; Grauvogel and von Soest 2014; Holvoet and Dewachter, 2013; Ide 2018; Marques and Salavisa 2017; Misangyi 2016; Muriaas et al. 2022; Schneider and Sadowski 2010; Zhu et al. 2019). Somewhat surprisingly, however, no methodological interest in these tables at all has been observable yet. Since their publication more than 10 years ago, they have been accepted as authoritative by course instructors of QCA, by applied users of QCA, and by journal reviewers of QCA manuscripts. The remainder of the present article is devoted to challenging this received wisdom.
Evaluating Marx and Duşa’s Benchmark Tables
Problems in Design
As means of assessment, MD invoke the two related concepts of contradiction and consistency because “contradictions will always occur if the explanatory model is not correctly specified” (2011:104) and “ill-specified models will generate very low consistency results” (p. 110). Thus, they deduce that “[i]f random data results in the absence of contradictions and high levels of consistency it indicates that csQCA is not able to distinguish real from random data” (p. 121). Whether an application of QCA is marked by contradictions is measured by the presence of at least one contradictory row in the truth table (p. 111), whether an application of QCA is beset by the problem of inconsistencies by the ratio of the number of cases in all non-contradictory truth table rows to the total number of cases (p. 113). As a contradiction simply refers to a situation in which the consistency of a truth table row is larger than 0 but smaller than 1, we do not treat contradictions and inconsistencies separately. 5
Two problems beset the simulation design set up by MD, the first of which is relatively peripheral yet still worth being pointed out, whereas the second one is centrally important. The first problem occurs when the authors argue that “ill-specified models will generate very low consistency results. Consequently, a csQCA analysis on random data should result in low consistency results” (p. 110). This statement has two problematic components. First, it is not true that an ill-specified model will necessarily produce low consistency scores. For instance, when a causally relevant factor that does not share a path to the outcome with any other causally relevant factor that is included in a QCA run is omitted from an analysis, the model is ill-specified but can still show high consistency scores (see Baumgartner and Thiem 2020:294–96; Thiem 2015:728). Second, the decreasing rate of occurrence of contradictions over decreasing diversity index values in MD’s benchmark tables is not a consequence of QCA’s decreasing ability to distinguish causal from non-causal data. Instead, it simply confirms some basic principles of probability theory.
To see this, pay attention to the rule whereby MD (p.126) create their data sets: for a given combination of a number of cases n and a number of factors
When going beyond two cases, the formula becomes more complex, but all that is still required is basic probability theory. None of QCA’s defining features, such as truth tables or Boolean minimization, need be involved at any stage. 6 For interested readers, we have put the technicalities of our argument in Appendix 1 and corresponding replication code is available in the accompanying replication script in Appendix 2. To summarize, what MD (pp. 114–15) propose, having run almost 5,400,000 simulations, is not a table that testifies to the decreasing capability of csQCA to distinguish causal from non-causal data, but a table that confirms that QCA behaves in full accordance with what basic laws of probability theory require. Such behavior can, of course, hardly count against the method. For arguing that QCA is deficient in recognizing real causal structures beyond a certain case-to-factor ratio, some specific procedural or algorithmic component of QCA would have to be proven deficient in some sense.
While the first problem of MD’s simulation design is relatively peripheral, the second is not. It relates to the assumption that QCA should not infer any model from the data when their source could be a random process. As we show in the following, such a requirement is completely futile as every set of data generated by any proper causal structure can always be duplicated by an identical set of purely random data, that is, a set of data that is completely indistinguishable from the set of data a causal structure generates. That being the case, researchers must instead expect a method to always return all those models that could have generated the data. The difference appears subtle, but its implications are consequential.
To illustrate this, we present an experiment whose insights can be reconfirmed using any other parallel set-up. In this experiment, we first randomly generate 100 proper causal structures involving four exogenous factors Number of draws to match randomly and structurally generated data.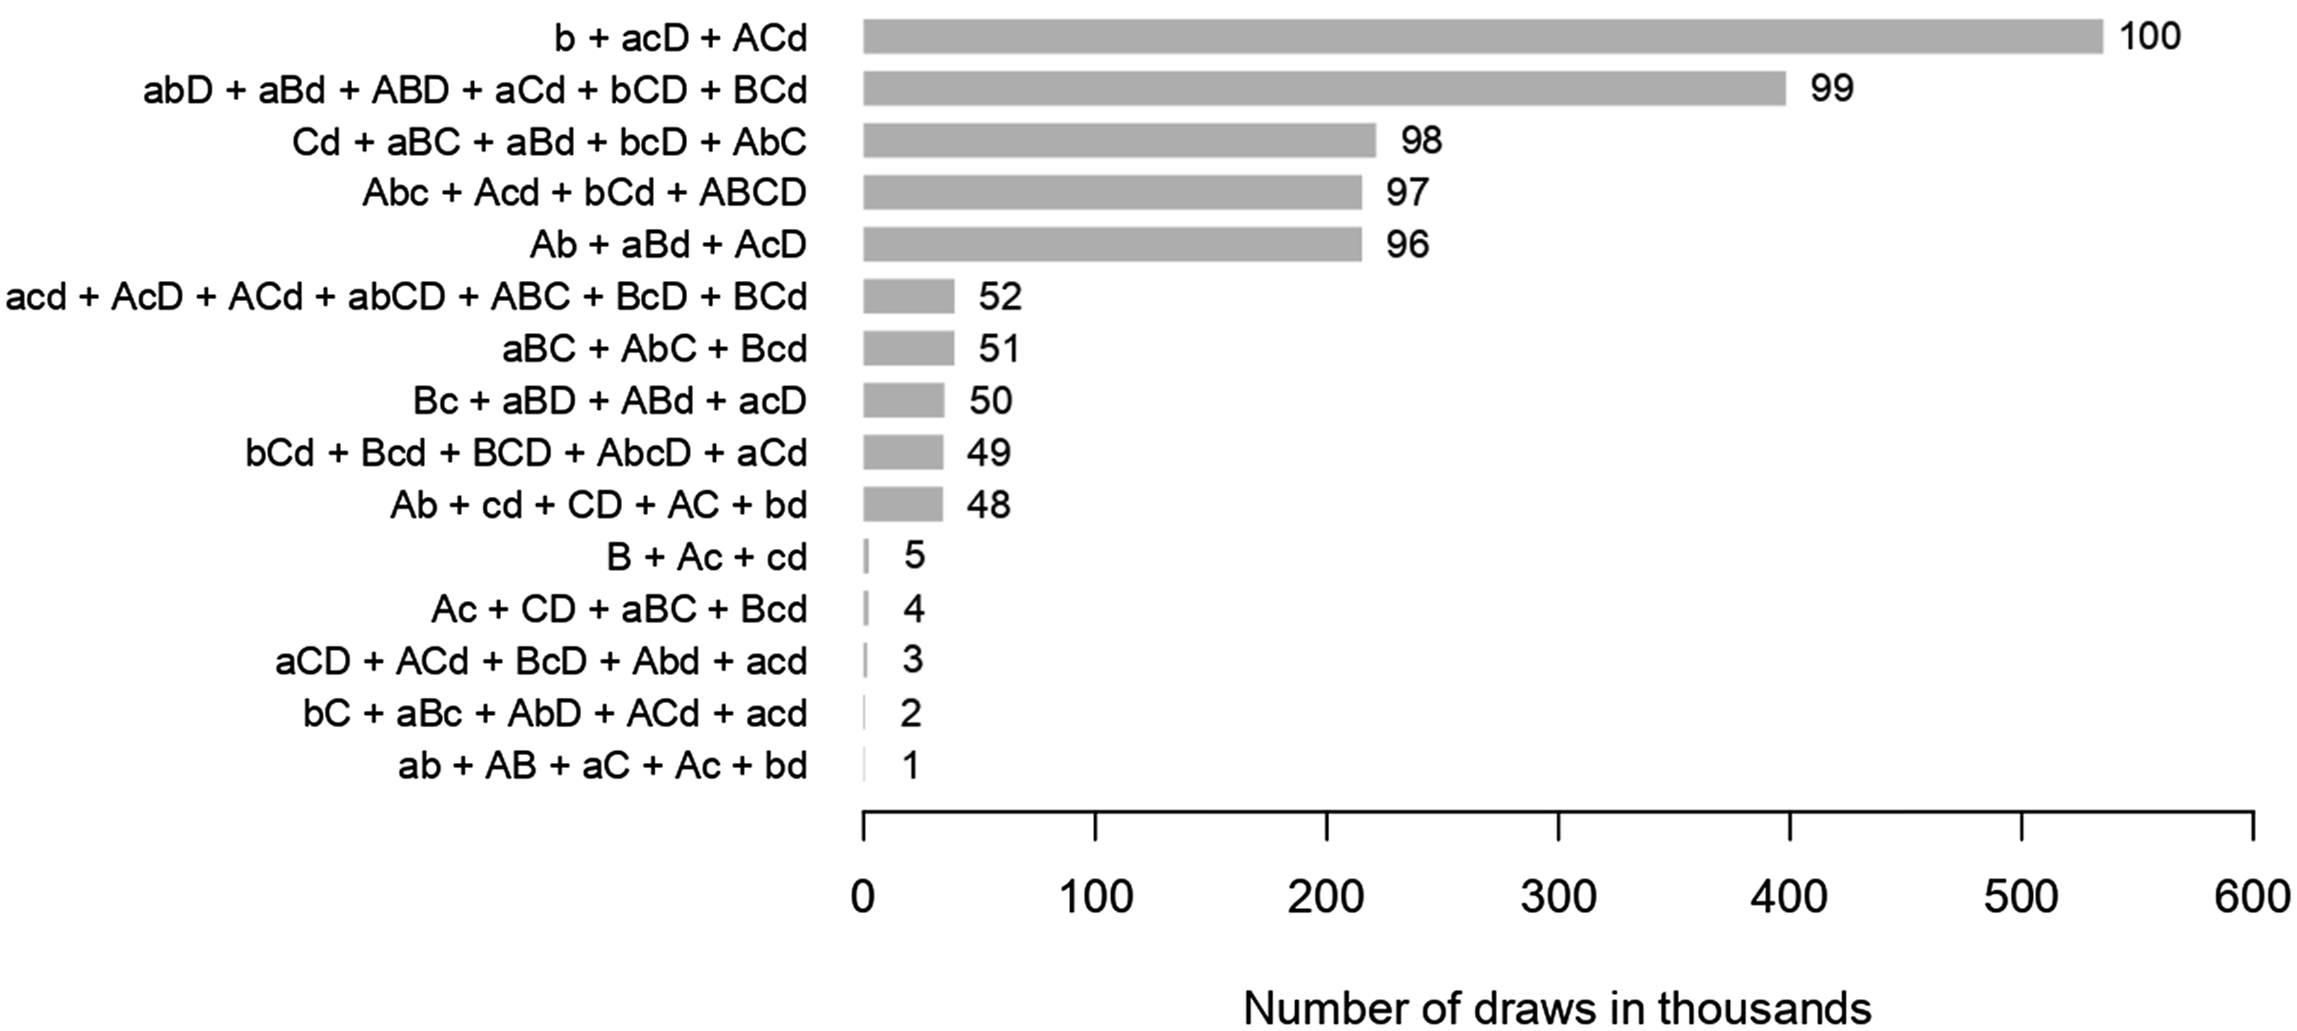
Presented are the five structures with the fewest required draws (structures 1–5), the five structures around the median number of draws (structures 48–52), and the five structures with most draws required (structures 96–100). At the lower end, not even 400 were needed to randomly generate data identical with the data generated by the proper causal structure
Consequences for Causal Inference
Worse than the two problems of MD’s simulation design, which merely relate to the criteria under which QCA’s properties should be evaluated, are the repercussions that follow from the eventual application of their benchmark tables in empirical research. That is because the ratios provided in these tables implicitly condition the complexity some independent causal structure can have on the available data, thereby effectively introducing a configurational form of omitted variable bias. To see this, consider the following two scenarios, the first of which has deliberately been set up with extreme parameters to bring out as clearly as possible the gist of the argument.
Ideal Situation of Configurational Difference-Making.
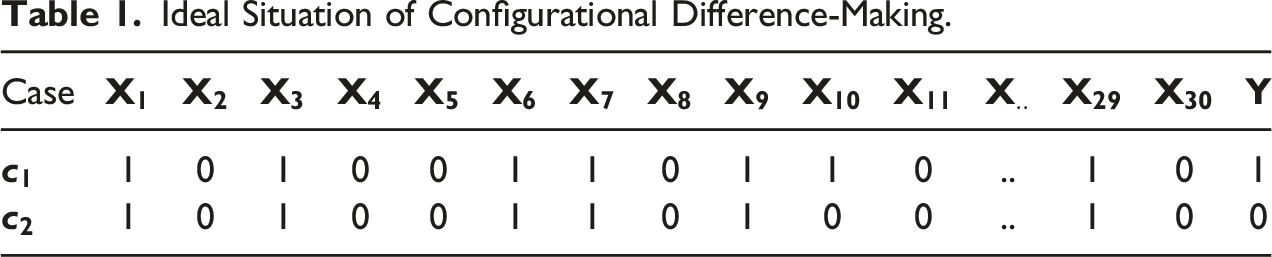
According to MD’s benchmarks, any analysis with fewer than seven cases is futile whatever the number of exogenous factors, and having 30 exogenous factors—13 is the limit in their tables— would require tens of thousands of cases.
8
Clearly, software is dispensable here; it is visible to the naked eye that
Let us first consider what consequences a limit on the number of factors, given any number of cases Doe may have data on, could have for the inferences Doe presents in published work. Generally, there are two classes of scenarios, one markedly worse than the other: first, Doe may present fewer correct inferences than he could have presented on the basis of the available data but does not present any false inferences; second, Doe may present false inferences and may or may not present some correct inferences that could have been presented based on the available data. In the first group of situations, relevant information is not leveraged. In the second case, not only may information not be leveraged but the inferences that are presented are incompatible with the causal structure being searched for.
Example of Realistic Data Set for Use in QCA.
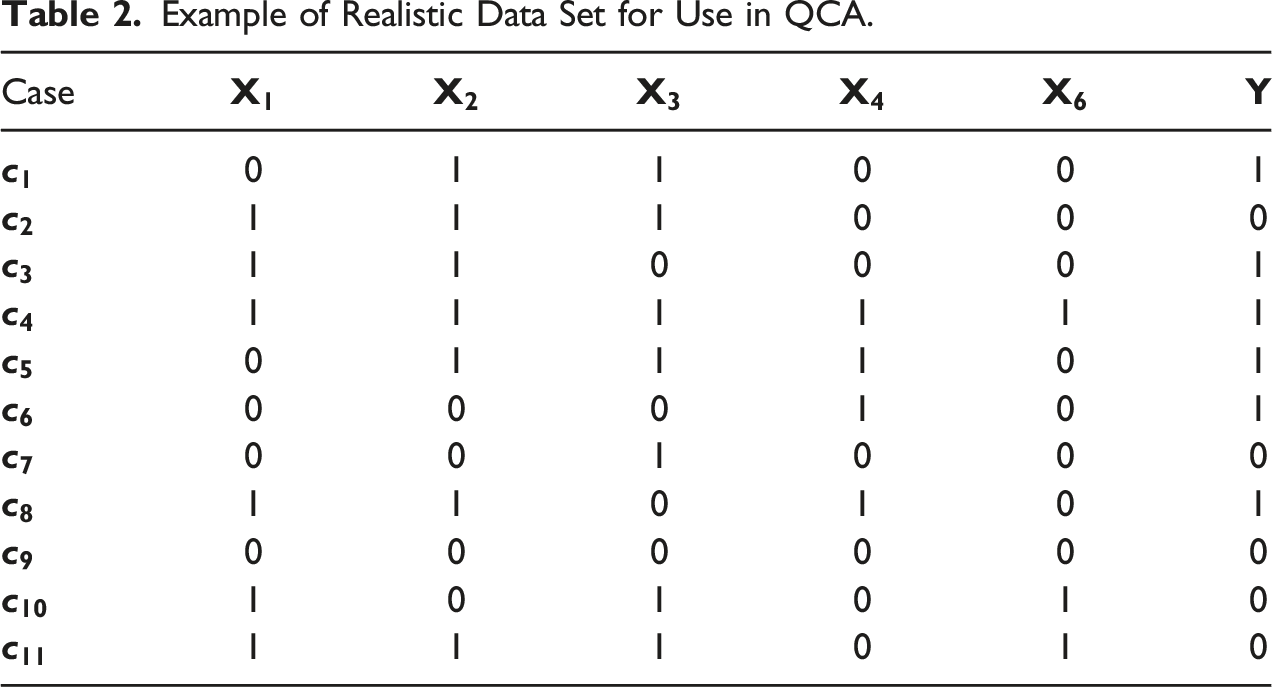
MD’s benchmarks warn researchers against using more than three exogenous factors with 11 cases. Doe heeds this warning and thus needs to make a choice. He decides to drop
Finally, let us see what happens when Doe decides to disregard MD’s benchmark tables, and to drop none of the factors he has gathered data on. In this case, QCA will produce the model
In summary, Doe has not been put on a wrong path in the first scenario, but disregarding MD’s benchmarks would have led him closer to the truth. In contrast, under the second scenario, QCA is forced to commit a causal fallacy when adhering to MD’s benchmarks, which could have been prevented had Doe decided not to use them. More generally, unless researchers drop causally irrelevant factors only, it seems, inferences based on all potentially relevant factors tend to inferentially outperform inferences based on a proper subset of those factors.
To test whether this hypothesis receives support, we conduct another simulation that generalizes the research situation of John Doe laid out above. In this simulation, we randomly generate 20 causal structures based on six exogenous factors
As an example, consider a situation in which the true causal structure to be uncovered is given by
There are
Figure 2 visualizes the correctness ratios (in percent) for all 20 causal structures across all scenarios. The abscissa lists all 20 randomly generated causal structures (for improved readability, only the antecedent is given) ranked according to their sum total of correctness ratios (increasing), the ordinate the number of exogenous factors included in the set of analyses. The number of four exogenous factors recommended by MD’s benchmark tables is marked in bold. Completely black indicates an average correctness ratio of less than 10%; completely white indicates a correctness ratio of at least 90%. In other words, the brighter the rectangle, the better. Correctness ratios, in percent, across 20 different causal structures.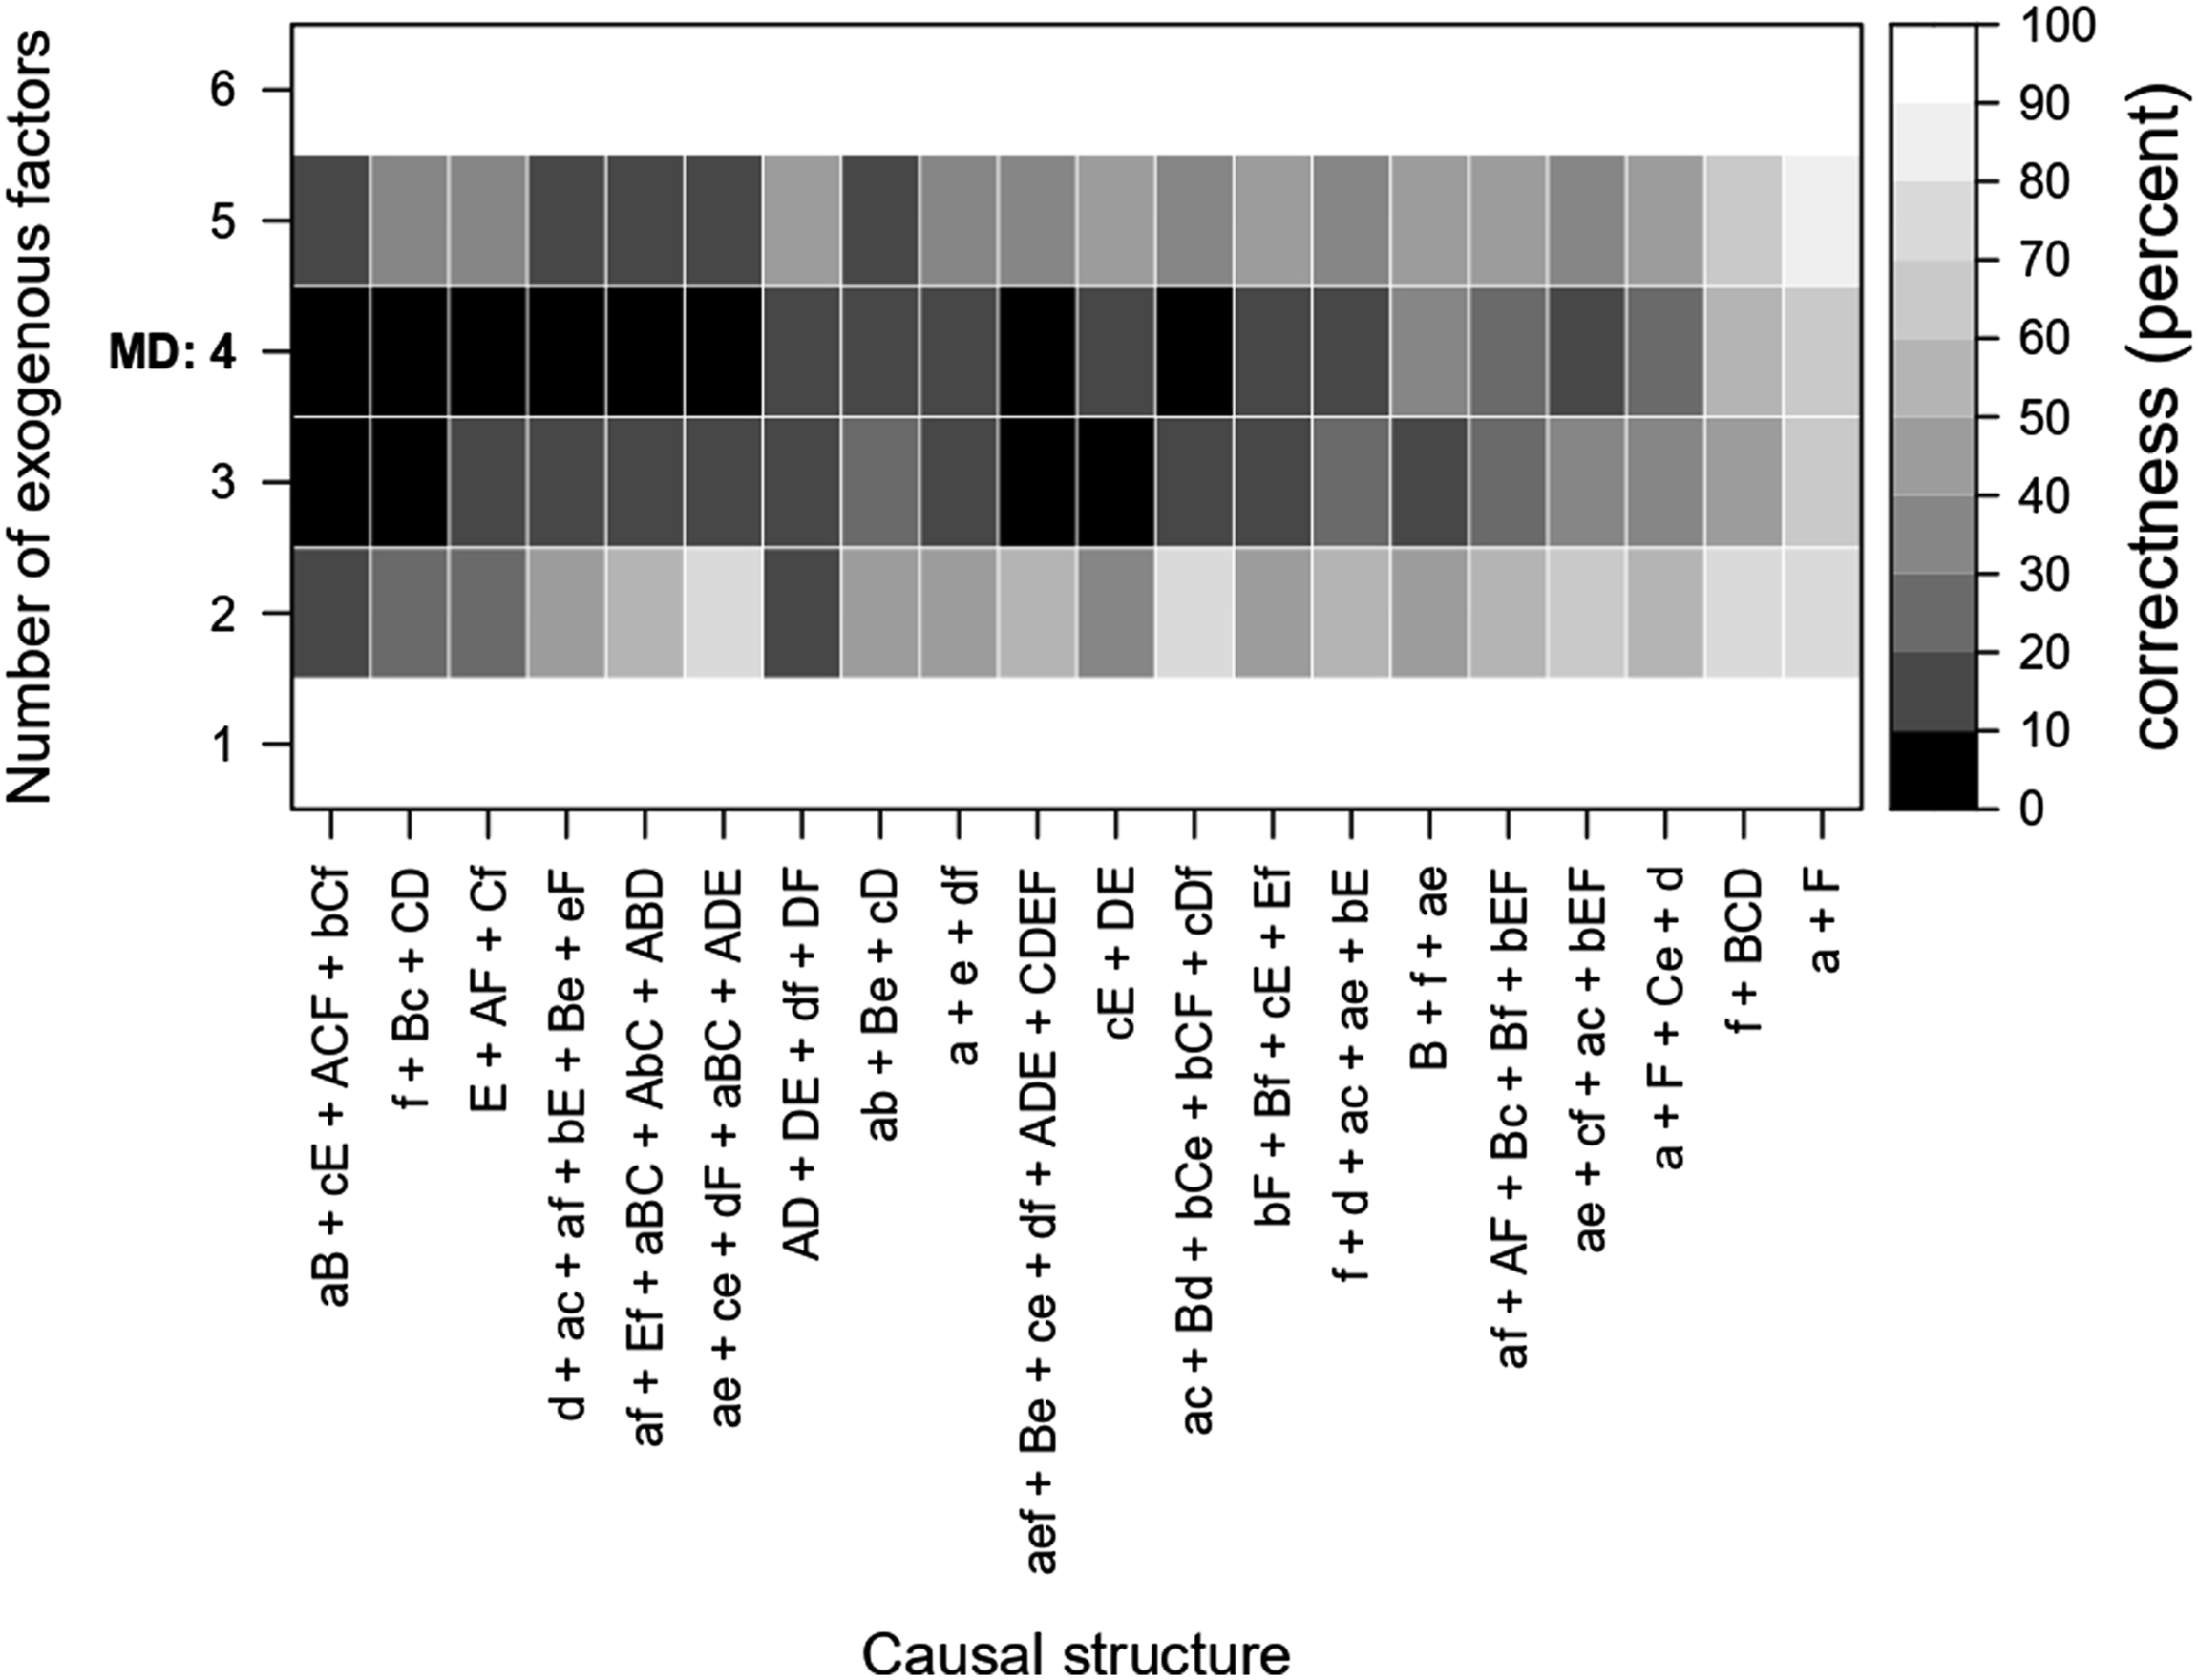
There are a few situations in which it is preferable to choose four instead of three exogenous factors. This is the case, for example, for the causal structures
In the first QCA-based study published in the American Political Science Review, Muriaas et al. (2022) use QCA to examine the interplay between gendered electoral financing (GEF) and other factors in democratic elections to determine whether these mechanisms help achieve gender balance in national parliaments. The six exogenous factors the authors include are whether GEF is state driven (SD), whether there is a quota in action at the time of GEF implementation (Q), whether there is a PR electoral system in place (PR), whether there is centralized candidate selection (CCS), whether political parties are publicly funded (PF), and whether there is a 15% minimum level of women members of parliament (WMP). The outcome to be explained is success (SUC), which refers to a significant increase in gender balance in parliament following a national election.
Before going into the analysis, the authors mention that “[w]ith 31 observations, only a maximum of six conditions may be included [...]” according to MD’s benchmark tables (Muriaas et al. 2022:504). However, at the same time, they point out that “[t]he six conditions to be considered in the QCA are by no means the only factors [...] that may combine with GEF implementation to enhance gender balance in representation. [...] the omitted factors [...] should be considered in any future study of GEF” (Muriaas et al. 2022:506).
The authors list six omitted factors, but their replication data set includes only two of them: whether GEF was directed toward the candidate or the party (PD) and whether GEF was a party penalty rather than a payment (PP). Given the purpose of our replication, we neither seek to interpret the authors’ findings from a substantive perspective nor do we want to comment on methodological issues unrelated to the core argument of our own article.
14
All we are interested in is whether the two omitted factors would have changed the QCA solution in significant ways had the authors not felt obliged to exclude them. Expression (1) summarizes the authors’ main QCA solution, which comprises five causal paths to success (Muriaas et al. 2022:509)
With the two omitted exogenous factors PD and PP added to the analysis, QCA returns 22 rival models that fit the data equally well. That the number of explanatory models has increased should be no surprise. It is a cost often incurred by a higher number of dimensions of variation (see Baumgartner and Thiem 2017:975–79). 16 However, particularly noticeable across these models is the presence of factor PD—one of the factors dropped by the authors. In 21 models, it features in at least one path to the outcome; in 10 models, in at least two paths. Thus, when compared to the original findings presented in Expression (1), the likelihood that at least one model that not only correctly reflects the truth behind the authors’ data is among those 22, but that also includes the factor PD should have increased. However, since, of course, the true causal structure can never have been known for sure in empirical research, we cannot tell whether the possibly true inference about the factor PD has merely been absent from the original solution in Expression (1), or whether the original solution in Expression (1) is partly or even entirely incorrect. Our aim was only to see how, based on the clear results of our simulations, the findings of Muriaas et al. (2022) would have changed if they had included all factors that they strongly believed to be relevant in explaining a significant increase in parliamentary gender balance. And our results suggested that PD, one of the factors dropped because of adherence to MD’s benchmark tables, represents an important component in explaining significant increases in parliamentary gender balance following national elections. How this result is to be interpreted substantively must be left to the experts in the field of political representation.
Conclusions
Methodological literature has long declared that QCA is prone to committing causal fallacies beyond a certain case-to-factor ratio by failing to recognize real data. Consequently, applied users of QCA have been worried that the explanatory models presented to them would be nothing but algorithmic artefacts. We have shown herein that these worries are misplaced, for two reasons. First, the data generated by any proper causal structure can always be regenerated by a purely random process. Demanding that a method abstain from inferences when the data could be non-causal is, therefore, futile. Instead, the expectation should be that a method presents an inference whenever the analyzed data could have been generated by a proper causal structure.
Second, yet more importantly, we have demonstrated that there is nothing in the algorithmic machinery of QCA that puts an upper limit on the number of exogenous factors given a certain number of cases. Our argument did not imply that low case-to-factor ratios incur no costs whatsoever, but we showed that the inferential capabilities of QCA are not at all threatened in the way suggested by MD. In fact, our extensive simulations suggested the exact opposite: If their goal is valid causal inference with QCA, then applied researchers are better off not following MD’s benchmarks but, instead, relying on the current state of knowledge in their respective field.
Footnotes
Acknowledgments
Previous versions of this article have been presented at the 1st Joint Political Methodology Meeting of the Methods of Political Science Section of the German Political Science Association and the Empirical Methodology Working Group of the Swiss Political Science Association, the 9th Annual Conference of the European Political Science Association, the 14th Conference of the European Sociological Association, and the General Conference of the European Consortium for Political Research. We thank all conference participants whose comments helped improve this article. We also thank the three reviewers at Field Methods for their constructive feedback. The authors acknowledge generous financial support from the Swiss National Science Foundation, grant award number PP00P1 170442. To view appendices and replication material for this article, please visit ![]() .
.
Declaration of Conflicting Interests
The author(s) declared no potential conflicts of interest with respect to the research, authorship, and/or publication of this article.
Funding
The author(s) disclosed receipt of the following financial support for the research, authorship, and/or publication of this article: This work was supported by the Schweizerischer Nationalfonds zur Förderung der Wissenschaftlichen Forschung, grant award number PP00P1 170442.