
Abstract
Even though the proportion of individuals who are not equipped to participate in online surveys is constantly decreasing, many surveys face an under-representation of individuals who do not feel IT literate enough to participate. Using experimental data from a probability-based online panel, we study which recruitment survey mode strategy performs best in recruiting less IT-literate persons for an online panel. The sampled individuals received postal invitations to conduct the recruitment survey in a self-completion mode. We experimentally vary four recruitment survey mode strategies: one online mode strategy, two sequential mixed-mode strategies, and one concurrent mode strategy. We find the recruitment survey mode strategies to have a major effect on the sample composition of the recruitment survey, but the differences between the strategies vanish once respondents are asked to proceed with the panel online.
Introduction
With the rise of the Internet in the late 20th century, the use of nonprobability-based online surveys rose as they are a fast and cheap method for recruiting people. However, research suggests that findings from nonprobability-based online surveys might not be generalizable or biased for characteristics under study that are related to the online mode of data collection. This, for example, applies to all topics that are related to the Internet. (Hargittai and Shaw 2020). In line with the research strand of representativeness of online surveys, Blank and Lutz (2017) point out that no social media platform is representative of the general population and so are samples drawn from these platforms. Accordingly, nonprobability-based online surveys are not generalizable to the general population and they are biased regarding research questions that are related to the use of the Internet.
To avoid this kind of bias in sociodemographic and substantive variables of nonprobability online surveys, probability-based online panels became a prominent vehicle for longitudinal studies of the general population (see, e.g., Blom et al. 2015; Revilla et al. 2016). This type of online panels acknowledges that (for most countries) no sampling frames exist on a general population level that include information to contact individuals online (e.g., email-address sampling frames). Consequently, for probability-based online panels it is necessary to sample and invite sampled individuals in an offline mode (i.e., face-to-face, by phone, or postal mail, to counteract potential biases). Yet it is unknown whether offline recruitment strategies succeed in avoiding or diminishing problems regarding the sample composition found by Hargittai and Shaw (2020), for example.
While postal survey recruitments are well suited to invite the general population to take part in a survey, it is yet unclear how to best integrate all population subgroups equally to an online panel. For this purpose, we investigate whether different postal recruitment strategies to a probability-based online panel lead to different compositions of the sample of recruited individuals regarding levels of IT literacy (which we operationalized with characteristics of accesses to and usage of the Internet). We experimentally vary the mode (online and/or paper and pencil) of the recruitment survey, after which all respondents are asked to proceed online. The experimental conditions allow us to investigate whether the mode of the recruitment survey attracts different people with different levels of IT literacy. For example, giving the respondents the option to fill in the recruitment survey on paper (despite explicitly not offering an offline mode in the panel) might lower the participation burden for less IT-literate individuals. Having an offline interaction with the survey conductor before asking for participating in an online survey might allow individuals who are suspicious toward the Internet to build trust in the survey conductor. In this sense, the paper-and-pencil questionnaire is meant as a foot in the door strategy to establish contact and build trust such that hesitant respondents could be convinced to move online in a second step. Conversely, offering only a paper-and-pencil questionnaire in the invitation mailing might have a negative effect for sampled individuals who are IT literate and who are willing to participate online. However, offering both survey modes simultaneously might balance the potential benefits and risks. Our study continues in the tradition of research on online surveys by shedding light on selective nonresponse during the recruitment for an online panel of the general population.
Literature Overview and Research Questions
In recent years, Internet coverage has constantly been increasing. Only a small (but possibly highly selective) minority of the general population in Western societies do not have the hardware or Internet connection to participate in an online survey (OECD and Eurostat 2018). Coverage bias due to (slow) access or Internet unavailability might, however, still be of concern for certain subgroups or areas (Helsper and Reisdorf 2017; Mossberger et al. 2013). Furthermore, some people are disconnected by choice or motivational reason because they have data protection concerns or the use of Internet does not seem beneficial for them (Büchi et al. 2022; van Deursen and Helsper 2015). Motivational reasons, such as data protection concerns, might be the cause for some people who are connected to the Internet not to participate in an online study.
Under-representing population subgroups who do have Internet access in principle but might decide against participation in online surveys because they do not feel IT literate enough or have concerns about the Internet (Büchi et al. 2022; Roberts et al. 2022) might lead to nonresponse bias in Internet-related characteristics. Herzing and Blom (2019) showed that different Internet usage patterns were predictive of panel participation and attrition. From mixed-mode studies, it is also known that independent of having the ability to participate in an survey online, some people do prefer to use an offline mode (Pforr and Dannwolf 2017). The findings suggest that even people who are connected to the Internet are at risk to not participate in an online panel.
If survey nonresponse depends on IT literacy, all variables related to the nonresponse mechanism might be subject to nonresponse bias. Previous research has shown that Internet usage and frequency of use are associated with media consumption and political attitudes (Blank and Lutz 2017; DiMaggio et al. 2001; Herzing and Blom 2019; van Deursen and van Dijk 2014). Accordingly, a potential underrepresentation of less IT-literate individuals might bias survey variables correlated with IT literacy, such as associations between social media usage and political communication or public opinion (see Edgerly and Thorson 2020; Murphy et al. 2014).
In addition, research on digital inequality has shown that individual factors influence Internet use (e.g., Festic et al. 2021) and that these individual factors translate into different levels of socioeconomic status and socioeconomic inequalities (see Scheerder et al. 2017). (Social) inequality measures related to the socioeconomic situation of individuals especially might suffer from nonresponse bias in online panels that underrepresent individuals with low IT literacy. Selective nonresponse due to digital inequality can severely challenge the quality of an online panel.
Little research has been conducted so far on the extent of nonresponse of less IT-literate people, and no research has yet examined whether different postal recruitment strategies result in online panels with different sample compositions regarding IT literacy. Studying different postal recruitment strategies for an online panel in their ability to include persons with various levels of IT literacy, this article is guided by the following research questions: 1. How do different recruitment strategies affect the recruitment survey’s sample composition regarding IT literacy? 2. How does the sample composition regarding IT literacy evolve throughout the online panel registration survey and the first online panel wave?
Data and Methods
Data
The German Internet Panel (GIP) is a probabilistic online panel study of the general population of German residents aged 18 to 75 (Blom et al. 2015). The GIP has been conducted bi-monthly since 2012 and covers topics on political economics and reforms. The original sample and the 2014 refreshment sample were recruited via face-to-face interviews (Blom et al. 2015; Blom et al. 2017). In 2018, the GIP changed its recruitment strategy for its second refreshment sample from face-to-face recruitment to postal mail invitation. The recruitment survey was either conducted in an online or paper-and-pencil mode. For this purpose, a sample of 180 primary sample units (PSUs) was drawn from a list of all municipalities in Germany stratified by region and degree of urbanity (for more details on the sampling process, see Cornesse et al. 2021). A mixed-mode online and paper-and-pencil recruitment experiment including 9,600 sampled individuals was conducted to find the best recruitment strategy regarding response rates and nonresponse bias in sociodemographic characteristics (Cornesse et al. 2021).
The present study evaluates the success of each recruitment strategy in recruiting less IT- literate respondents. Regardless of the experimental groups, the 2018 recruitment to the GIP consisted of several consecutive steps: Sampled individuals are first invited to participate in a recruitment survey by postal mail. The respondents to the recruitment survey who indicated their willingness to participate in the panel were then asked to participate in the online registration survey. Only after completing the registration survey were respondents considered to be new panel members and invited to the regular GIP waves.
Experimental Design
In the recruitment experiment, sampled individuals received different postal invitations and reminder letters varying the mode of the recruitment survey. The recruitment survey was implemented as an online survey and a paper-and-pencil questionnaire. The online and paper-and-pencil surveys were kept as similar as possible. Both survey versions contained the same questions on age, gender, education, and IT literacy.
Description of the Different Postal Mailings by Experimental Condition.
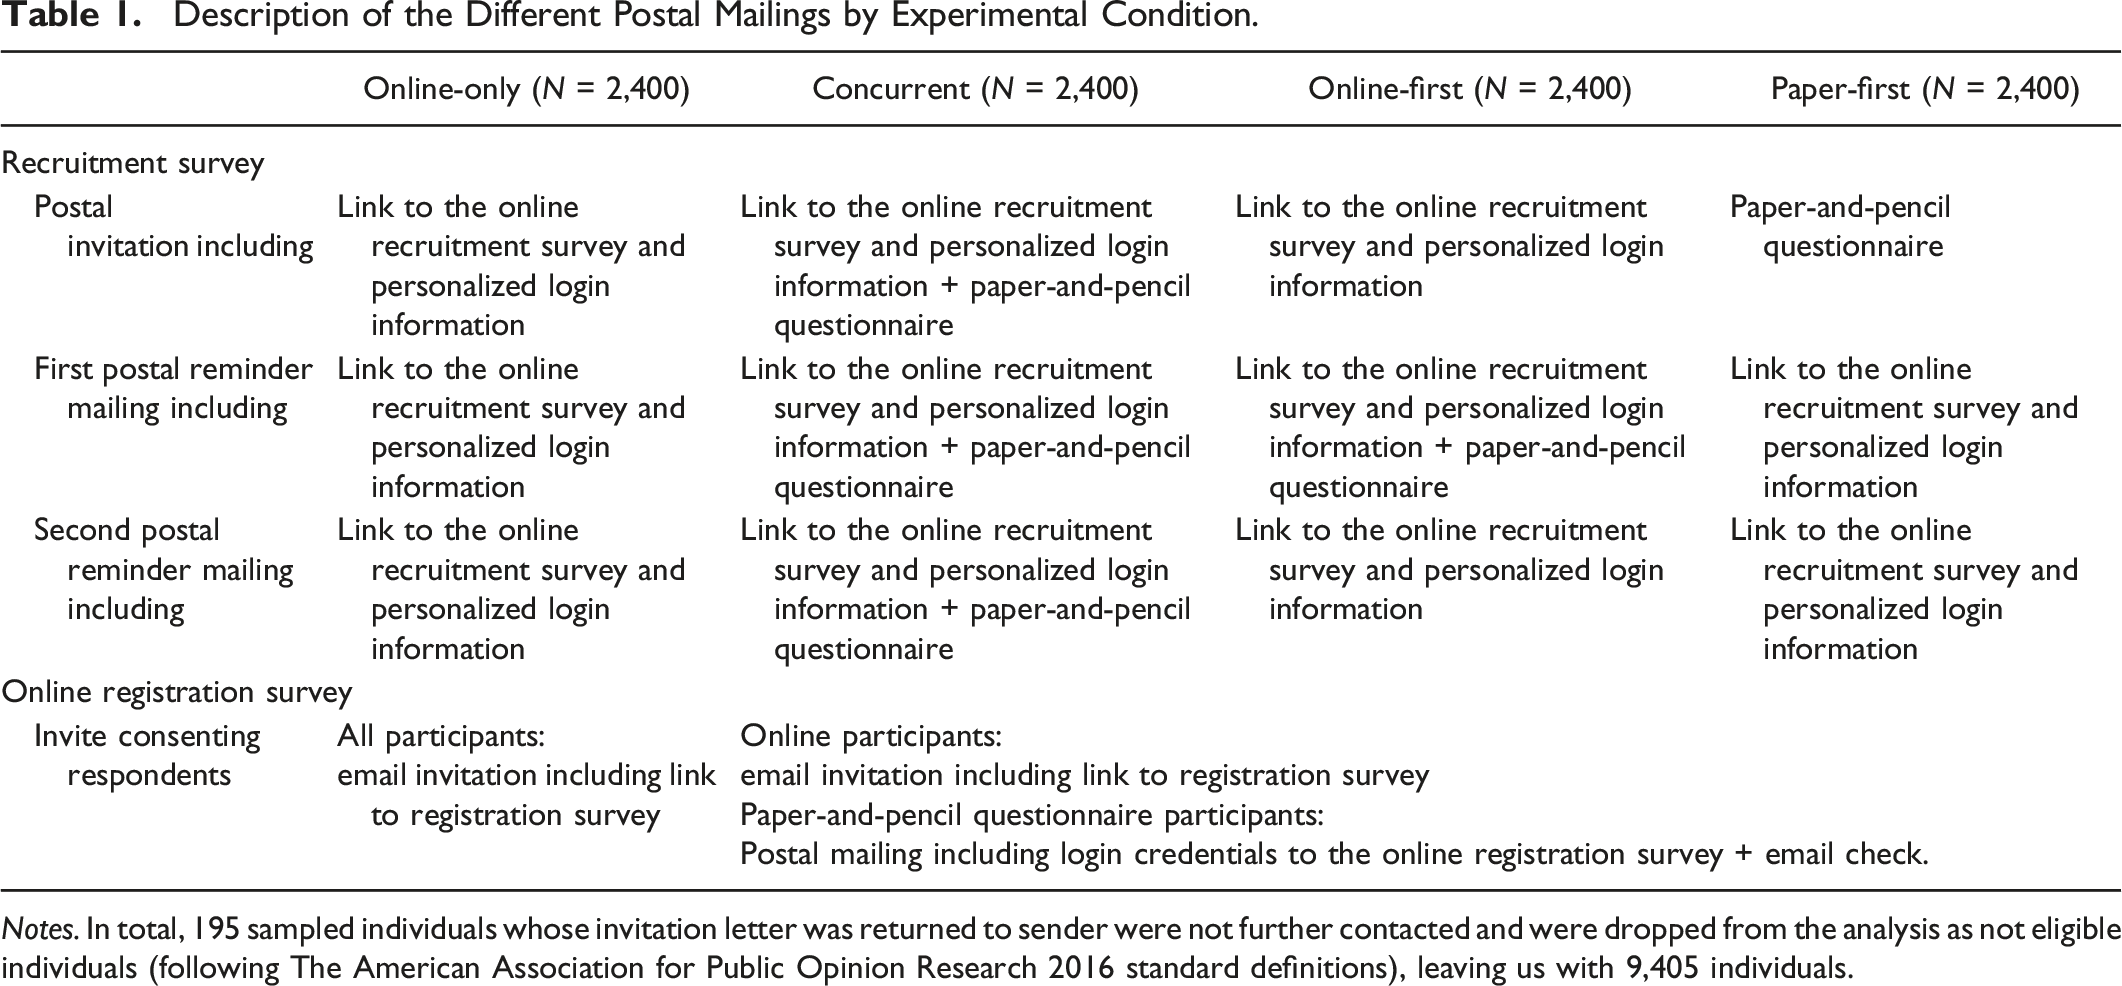
Notes. In total, 195 sampled individuals whose invitation letter was returned to sender were not further contacted and were dropped from the analysis as not eligible individuals (following The American Association for Public Opinion Research 2016 standard definitions), leaving us with 9,405 individuals.
Respondents to the online or paper-and-pencil version of the recruitment survey were asked to consent to be contacted again for the online registration survey. Consenting respondents to the online survey were sent a link to the registration survey by email. In contrast, consenting respondents who participated in the paper-and-pencil recruitment survey received a letter with login credentials to participate online. After logging into the online registration survey, respondents were first asked to fill in their email address. A validation email, including a link to the online registration survey, was sent immediately after this registration.
Operationalization of IT Literacy
While we do not have measures of specific IT skills, we use the access to the Internet and the Internet activities as proxies for level of IT literacy (see Mossberger et al. 2012), as it can be assumed that IT skills facilitate different types of Internet use (van Deursen et al. 2017). We know from previous literature that IT skills relate to measures of social inequality (see Scheerder et al. 2017).
Access to the Internet is operationalized through the frequency of Internet usage and the devices used to access the Internet (Blank and Groselj [2014] call this the amount and variety of Internet use). We asked respondents how often they used the Internet in nine categories ranging from several times a day to never and no Internet access. Respondents were further asked whether they used a desktop PC, smartphone, tablet, notebook, or other devices to enter the Internet within the last 3 months in a check-all-that-apply question (English translations of the question wordings can be found in Online Appendix B).
Usage of the Internet is measured by asking respondents which kinds of Internet activities they performed within the last 3 months (see Blank and Groselj 2014; Brandtzæg 2010; Holmes 2011). Based on Blank and Groselj’s (2014) typology, a selection of 12 Internet activities was used for the questionnaire of the recruitment survey. We grouped the 12 Internet services into five types of Internet services according to their purpose: entertainment (listen to music, play games), content production (create videos, maintain a blog), information seeking (look up information, read news, read blog), social use (emailing, social networks), and e-commerce (online banking, online shopping, compare prices). We assume that certain Internet activities that are conceived to be more difficult (e.g., content production) are related to a higher level of Internet skills than Internet activities that are conceived to be less difficult (e.g., entertainment). In addition, the number of Internet activities is used as proxy measure for general skills or capacities (Mossberger et al. 2012; Mossberger et al. 2013).
Analysis Plan
To answer our first research question on the sample compositions in the recruitment survey, we compare the means and proportions of the measures of IT literacy between the four different recruitment strategies. We test for differences between the recruitment strategies by using F-tests for equality in all groups for binary variables (for example, using a mobile phone, yes \ no) and a χ2-test for multi-categorical variables (for example, frequency of Internet usage).
We apply two analysis strategies for the second research question on the evolution of sample composition over time. First, we test whether the sample composition differs between the groups in both the registration survey and the first online wave using the same test as for the recruitment survey. This way, we study whether existing differences vanish over time or new differences emerge. Second, to investigate whether sample composition significantly changes over time within each experimental group, we test whether the recruited respondents, who complete the registration survey, differ from those who do not complete the registration survey. Tests are performed using independent t-tests. Since we observe very low attrition from the registration survey to the first panel wave, we do not test the differences between respondents and nonrespondents at this stage.
The recruitment survey, in which the variables we analyzed were fielded, shows item nonresponse rates of less than 5%. We exclude missing cases and report proportions for each variable based on available information by variable.
Results
The highest recruitment rate was achieved in the concurrent recruitment strategy (43.9%), followed by paper-first (41.1%), online-first (36.6%), and the online-only (29.7%) recruitment strategy. (See Table A.1 in the online Appendix for an overview of the sample sizes and completion rates of the recruitment and registration surveys as well as the response rates of the first regular panel wave
In the following two sections, we analyze whether different response rates translate to different sample compositions regarding IT literacy between the experimental groups. A comparison of the basic sociodemographics between the groups at every survey stage can be found in Table A.2 in the online Appendix. We find the groups to differ significantly for age and education in the recruitment survey, but groups do not differ for the registration survey and first panel wave.
How Do Different Recruitment Strategies Affect the Recruitment Survey’s Sample Composition Regarding IT Literacy?
We compare recruitment survey respondents' Internet access and Internet usage between the experimental groups (see Table A.3 in the Online Appendix) to answer our first research question. We find the frequency of Internet usage to significantly differ between the experimental groups: In all groups, most respondents report accessing the Internet daily. However, we find remarkable differences between the groups, ranging from 74.6% of the respondents in the paper-first mode to 85.6% in the online-only group. In all groups, less than 5.0% of the respondents to the recruitment survey reported either never using the Internet or not having Internet access. However, the proportions differ strongly from only 0.1% in the online-only group to 4.8% in the paper-first group. The low rates of respondents who do not have Internet access even in the mixed-mode group greatly support the need to study IT literacy more closely.
Turning to the types of devices used to access the Internet, we find smartphones to be most common in all groups, followed by notebooks and PCs. Tablets are less common than PCs in all groups. However, the proportion of respondents using each device differs between the groups significantly, except for notebooks. The online-only group uses PCs, tablets, smartphones, and other devices more often than all other groups. Consequently, the online-only group shows the highest average number of devices used to access the Internet. The paper-first group shows the highest proportion of respondents who do not use any device. Our results show great Internet access and Internet device coverage across all recruitment groups. They also show that the three mixed-mode groups are very similar but strongly differ from the online-only group.
Turning to the Internet services respondents use in each experimental group, we find information seeking to be the most common type of Internet usage in each experimental group, followed by social use and E-commerce. The three services show significant differences between the groups for the average number of services used, using at least one service and for each of the single services except reading blogs. The proportions are higher for the online-only group than for the other groups (which are similar to each other). The same relative differences are found for using the Internet for entertainment. Differences are not significant for content production. We find substantial differences in the proportions of respondents using the Internet services between the experimental groups but find the relative importance of the services to be the same across groups. The two most important services in each experimental group are looking up information and emailing.
Summarizing our results regarding the access to and usage of the Internet, we find the mixed-mode groups to be very similar but different from the online-only group. The recruitment survey was completed by less IT literate respondents (i.e., not using any Internet services, or not having Internet access in the paper-first, online-first, and concurrent mode group than in the online-only group).
How Does the Sample Composition Regarding IT Literacy Evolve Throughout the Online Panel Registration Survey and the First Online Panel Wave?
We compare the IT literacy indicators for the recruitment survey, the registration survey and the first panel wave to answer our second research question. Tables containing means and proportions as well as the results of significance tests as described in Analysis Plan can be found in Table A.4 and Table A.5 in the online Appendix. For the frequency of Internet usage (see Figure 1), it can be seen that the differences between the groups found for the recruitment survey strongly decrease once the respondents are asked to proceed online with the registration survey. For the mixed-mode groups, respondents to the registration survey significantly differ from nonrespondents (p < 0.05). At the same time, we do not find significant differences for the online-only group. This finding implies that response to the registration survey depends on IT literacy for the mixed-mode groups. The sample compositions do not substantively change from the registration survey to the first panel wave for any group. Access to the Internet—Frequency of Internet usage in percent within the last 3 months among the respondents across recruitment strategies and panel evolution.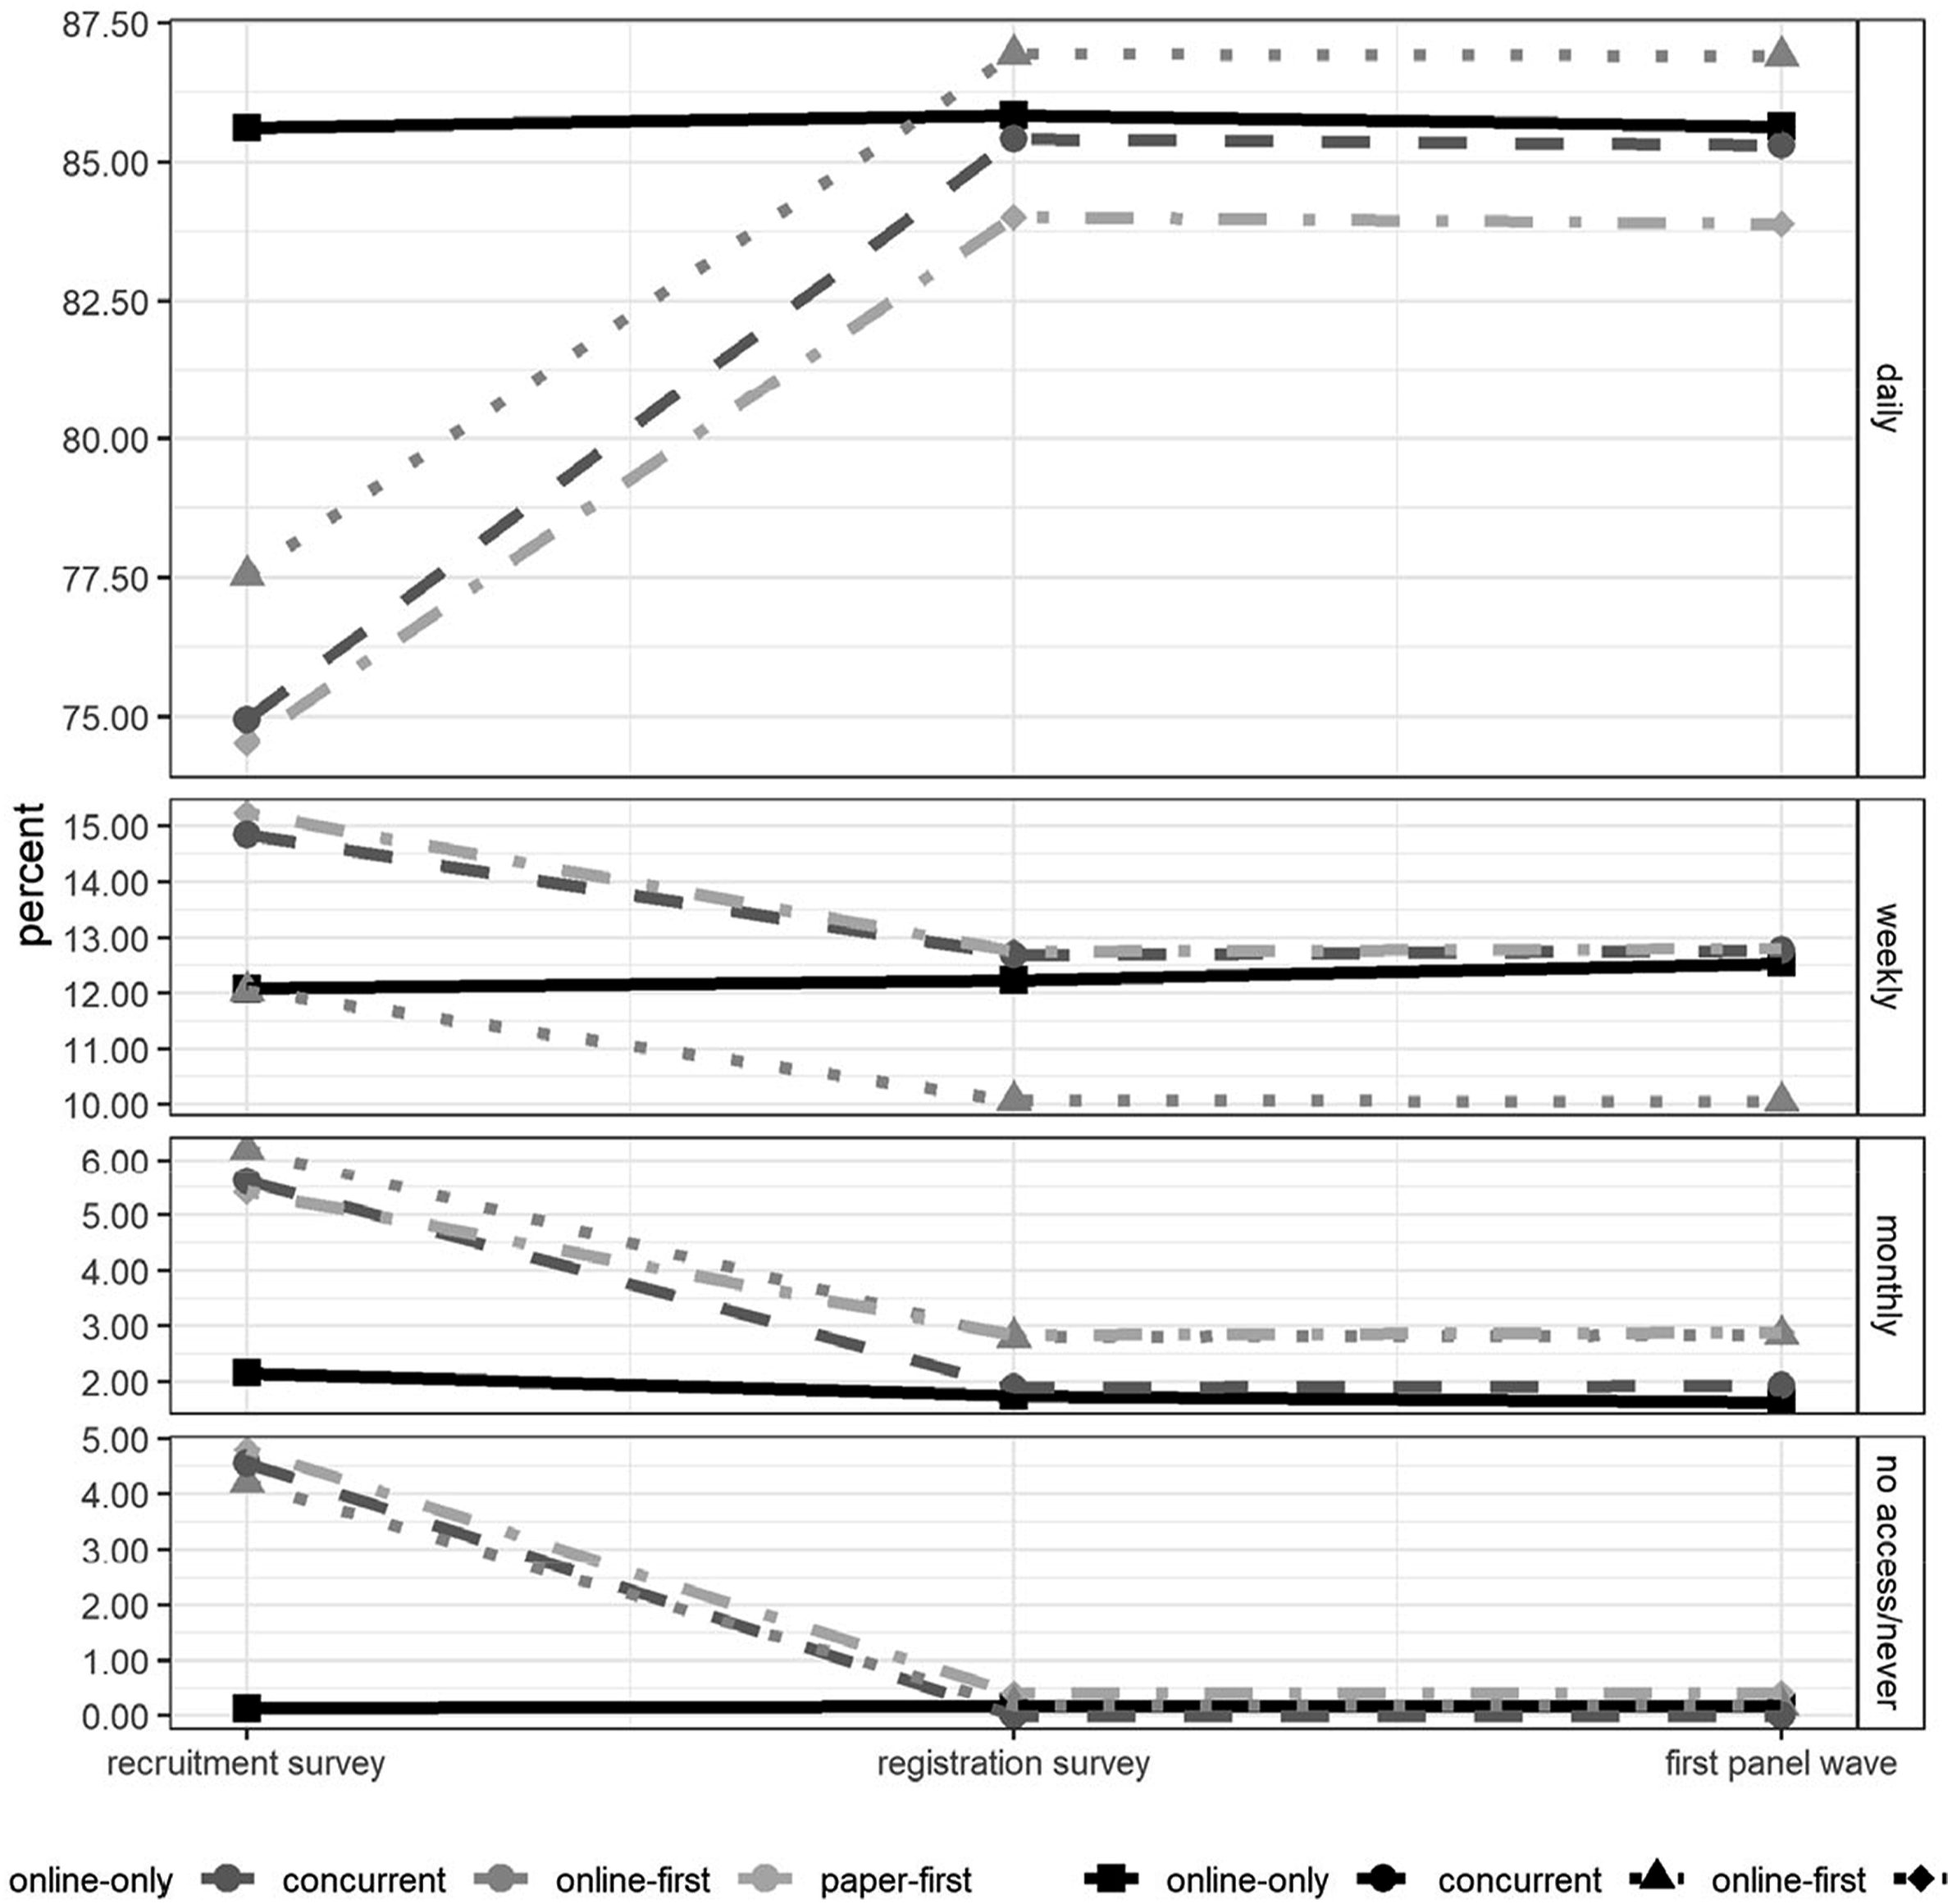
Turning to the devices used by the respondents, Figure 2 shows the evolution of PC and smartphone usage, which are most common in all experimental groups, as well as using no device at all. We find the same picture for the devices used by the respondents as for the Internet usage: The differences between the experimental groups strongly decrease once all respondents are asked to proceed online and no further changes can be observed from the registration survey to the first online wave. For the registration survey, the device usage does not significantly differ between groups except for “other device.” Comparing respondents and nonrespondents to the registration survey, we find all devices (expect other device in the online-first group) to be used at a significantly higher rate by respondents than nonrespondents for all mixed-mode groups. Access to the Internet—Percent of PC and smartphone usage (mostly used device types) within the last 3 months among the respondents across recruitment strategies and panel evolution.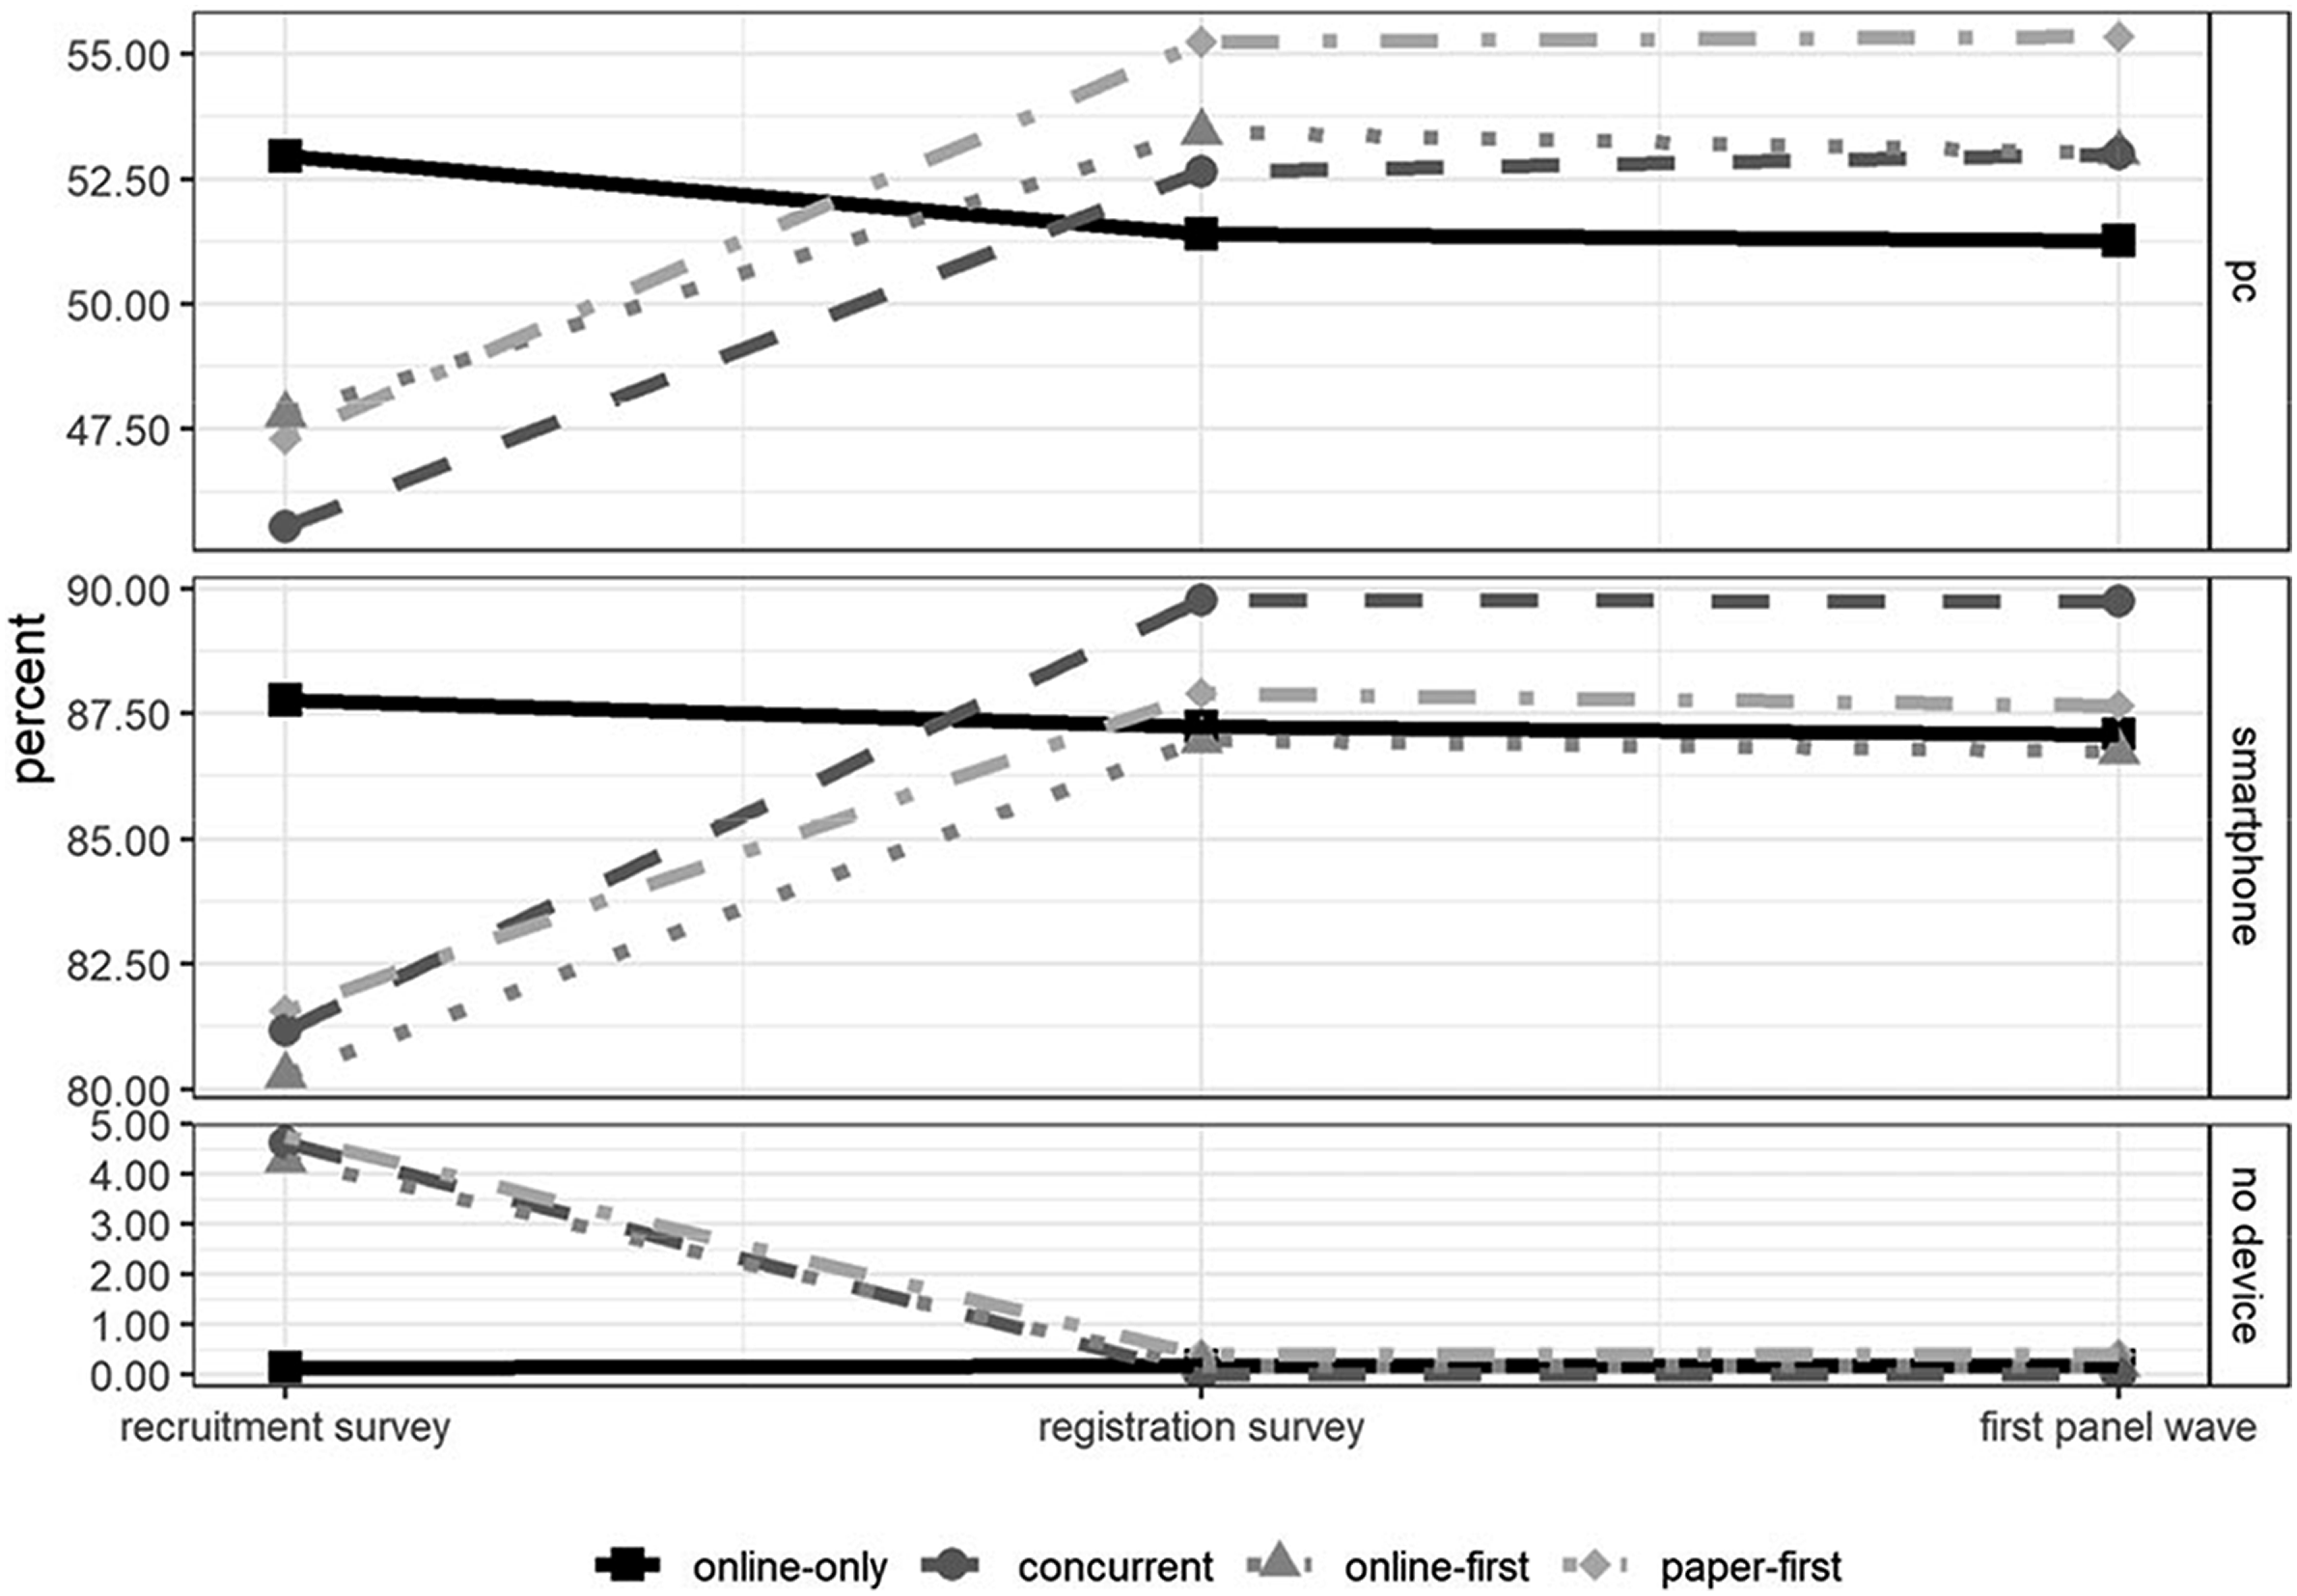
Turning to the usage of the Internet, Figure 3 shows the proportion of respondents who use at least one service of each service category. We do not find significant differences between the experimental groups for using at least one service of entertainment, information seeking and E-commerce for the registration survey. Significant differences are found between respondents and nonrespondents for the mixed-mode groups for these service categories. We find small but significant differences in social use, specifically emailing between the groups that persist throughout the recruitment process. From the registration survey onwards, emailing within the last 3 months is more common for the paper-first and concurrent group than for the online-only and online-first group. Respondents and nonrespondents to the registration survey show significant differences for the social use service category implying that response is more likely for those who use the Internet for social use more often. Usage of the Internet—Percent of at least one Internet service used among the respondents within the last 3 months across recruitment strategies and panel evolution.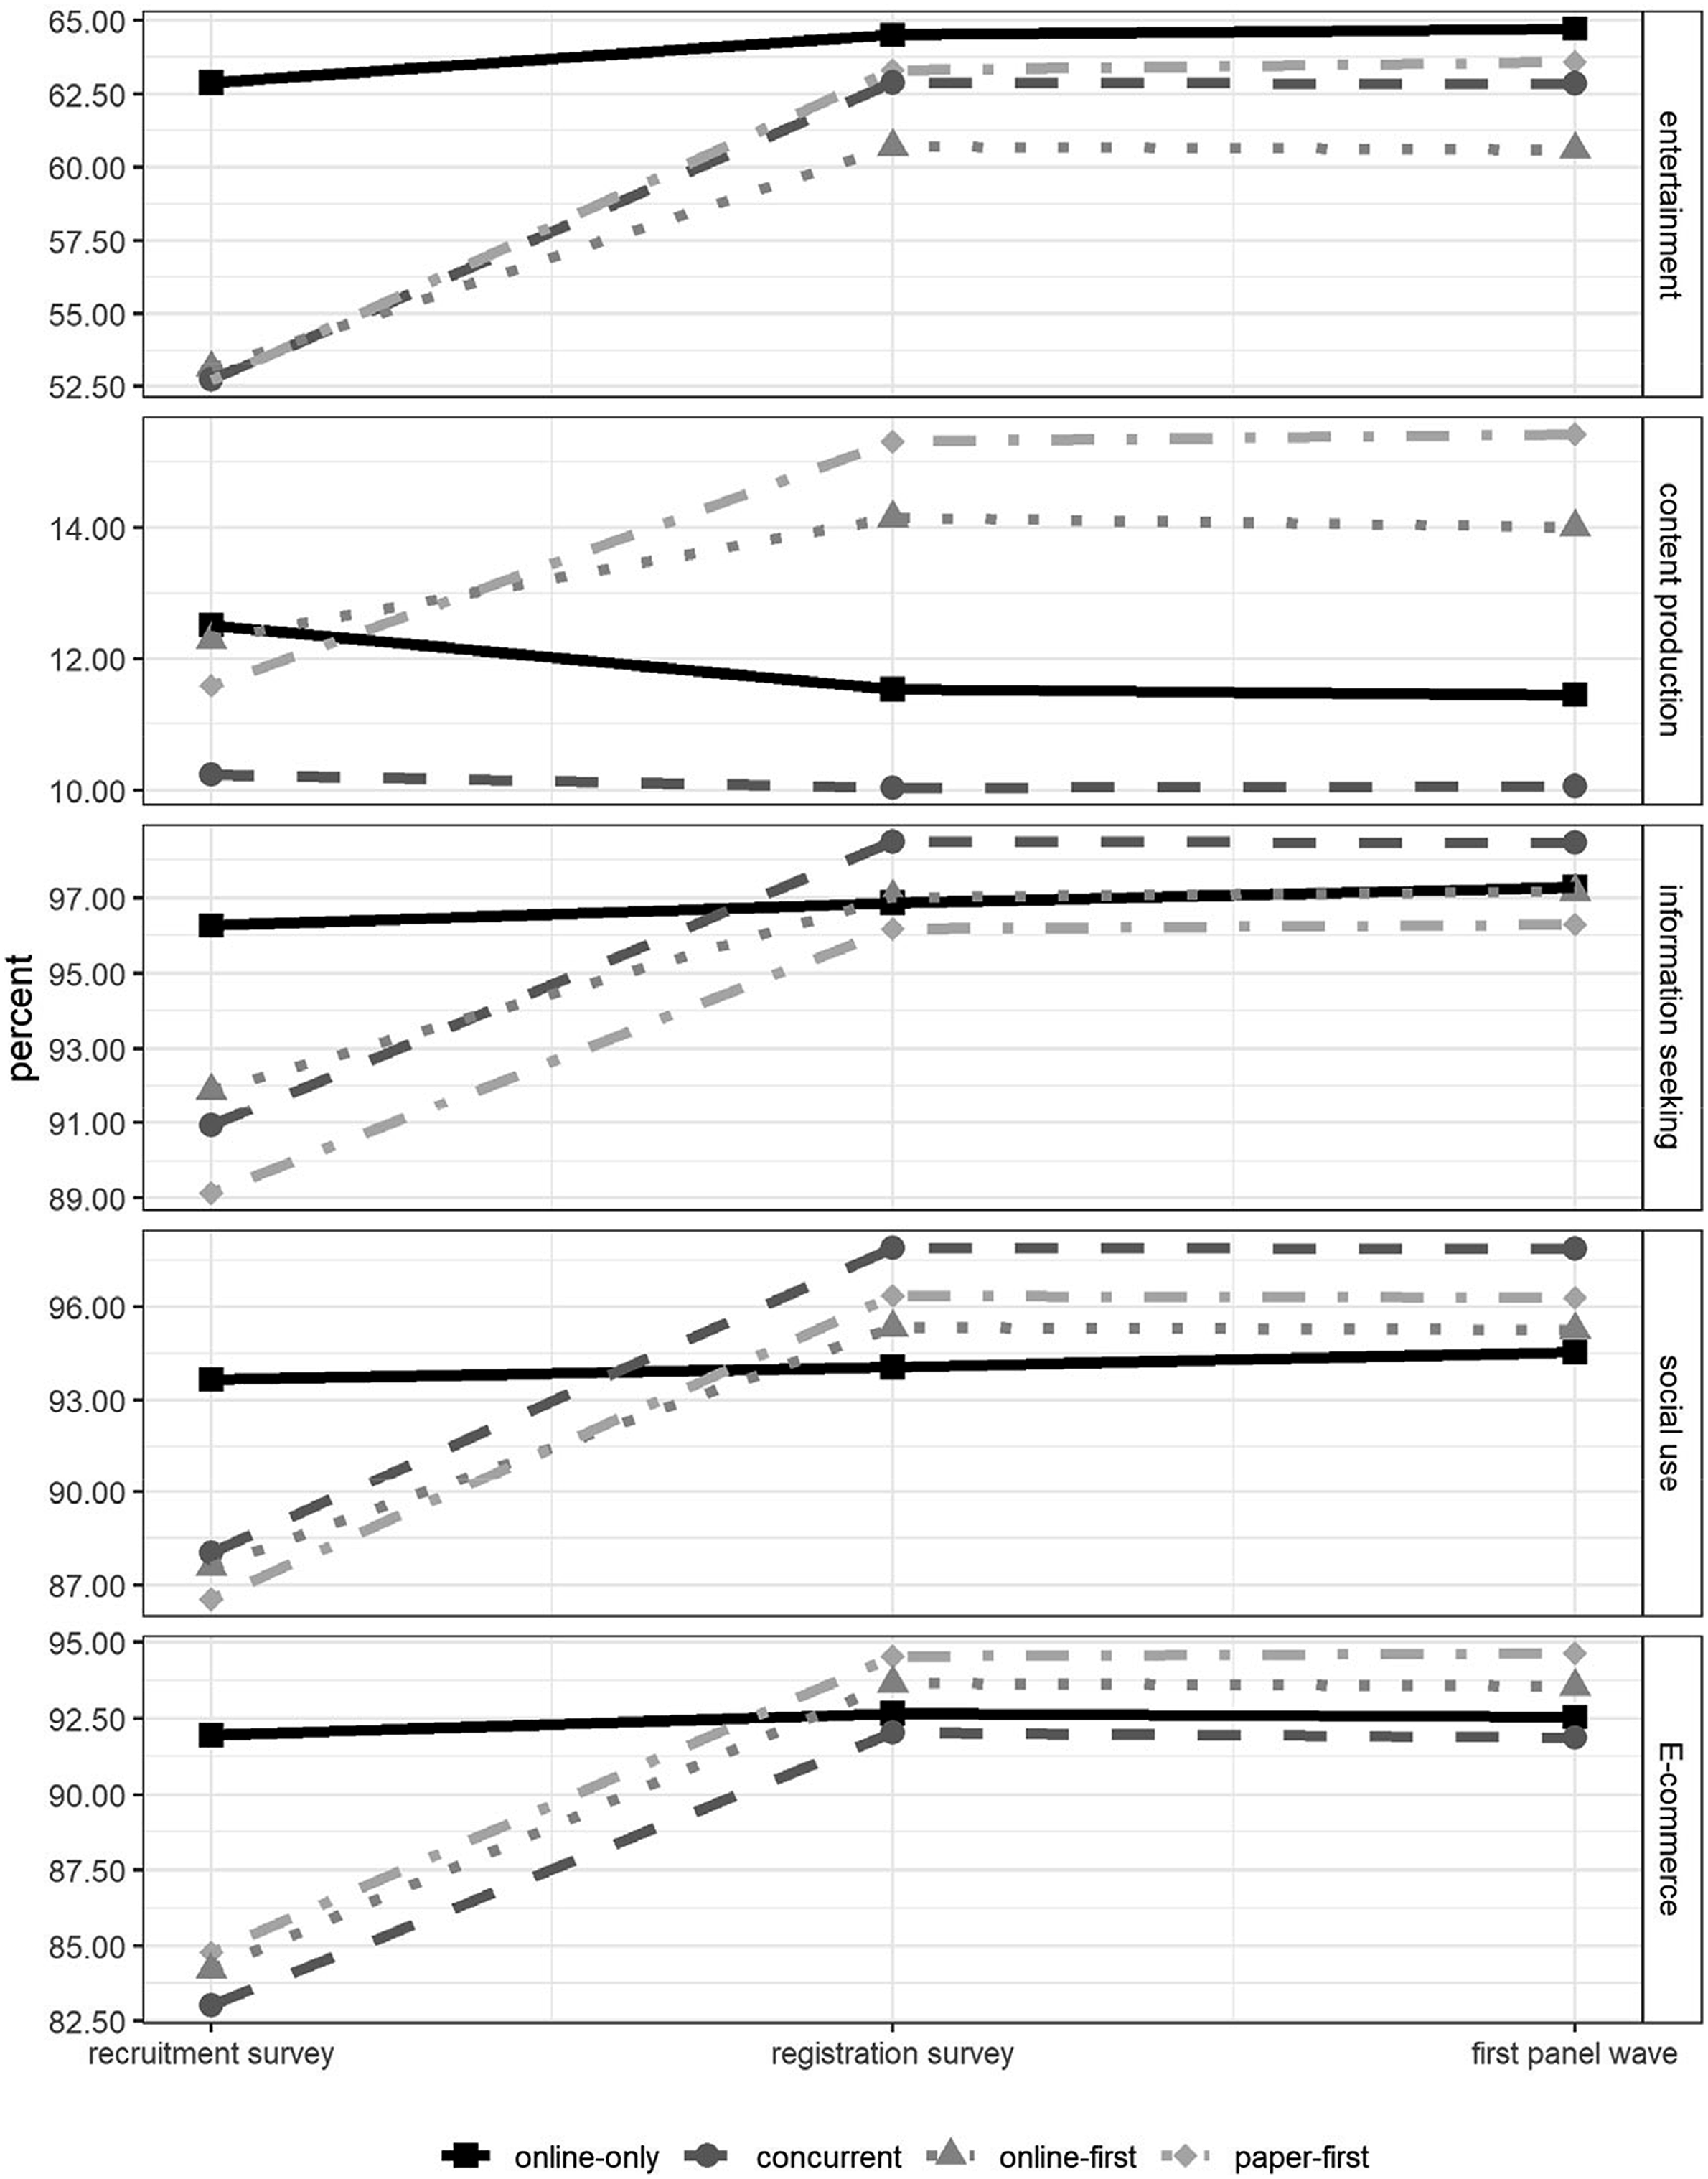
Given that the invitation to the registration survey was sent by email, it is not surprising to find emailing behavior to affect the propensity to respond to the survey. We find the compositions of respondents using content production services—especially maintaining a blog—to become more different from the recruitment to the registration survey. The proportion of respondents engaging in content production activities significantly increases from the recruitment to the registration survey for the paper-first and online-first groups, while it does not change substantially for the online-only and concurrent groups. The group differences persist for the first panel wave.
Overall, the sample compositions of the experimental groups become very similar for the registration survey and stay similar for the first panel wave. Only a few differences between the experimental groups can be observed for the first panel wave (see Table A.5).
Discussion and Conclusions
Studying how four different recruitment strategies to an online panel affect the panel’s sample composition regarding respondents’ IT literacy, we find significant differences in the (mixed-mode) recruitment surveys. The differences vastly disappear once all respondents are asked to proceed with the registration survey online. We find slight but persistent differences even in the first panel wave, mainly concerning Internet services used by the respondents. In all four experimental groups, very few respondents report not having Internet access. This finding shows that some respondents prefer to respond in an offline mode even though they are, in principle, equipped to respond online. Higher dropouts after the switch to the online mode among the mixed-mode groups support this result. Comparing respondents and nonrespondents to the registration survey, we find strong differences for the mixed-mode groups for the IT literacy measures, indicating a relationship between IT literacy and online survey participation even among individuals who have Internet access.
Although there is some debate about the accuracy of the operationalization of Internet skills by measuring Internet activities (van Deursen and van Dijk 2010), there are instances in the literature where the range of Internet activities or the conceived difficulty is used as an indicator of the level of skills (Mossberger et al. 2013). Future research might gain from using a more precise scale to measure Internet skills (see van Deursen et al. 2014). However, for example, self-assessment of Internet skills faces measurement error in terms of over- or underrating of the skills possessed (Hargittai 2005; van Deursen and van Dijk 2010). Future research might gain from investigating the same research question with a measure of IT or Internet skills and not Internet use.
We did not ask how comfortable respondents are with going online. We argue, however, that less IT-literate respondents might have concerns about responding online, do not feel secure enough, or find it too burdensome. More research needs to be conducted on strategies to prevent nonresponse of less IT-literate respondents, for example, by targeted designs that aim at lowering the burden of responding online and increasing trust. Finding that the respondents to the registration survey are very similar across the experimental groups, we conclude that offering paper-and-pencil questionnaires did not succeed in building trust in the survey agency and motivating less IT-literate individuals to proceed online.
Not being able to recruit less IT-literate individuals to a probability-based online panel might have severe implications for substantive research based on such panels. Especially, findings on topics associated with IT literacy, like media use, information seeking for political campaigns, or attitudes toward digitization might suffer from severe nonresponse bias. However, findings for topics unrelated to IT literacy might not be biased by the underrepresentation of less IT-literate individuals at all. Researchers must carefully consider whether their specific research is likely to be affected by (survey mode specific) nonresponse and how this affects the interpretation of their findings.
Our findings are limited to Germany, and more research is needed on how they can be transferred to other countries with similar Internet coverage and usage. Feelings of insecurity when using the Internet or data privacy concerns might differ between cultures, thus nonresponse bias in IT literacy-related measures might differ as well. This needs to be kept in mind when conducting cross-cultural comparisons of findings from online studies.
Finding that all postal recruitment strategies led to panel samples that are very similar regarding IT literacy and sociodemographic composition (see also Cornesse et al. 2021) of the respondents, it is not clear which recruitment strategy to prefer. Considering that the paper-and-pencil questionnaires create additional costs for the mixed-mode groups, one could argue that they are outperformed by the online-only strategy. This argument, however, ignores that the paper-and-pencil questionnaires might be very useful for studying nonresponse bias in an online survey. Moreover, the information collected using the paper-and-pencil questionnaires might be used to create nonresponse weights. More research is needed on whether it is worth collecting such information in an offline mode to adjust survey estimates (e.g., for different types of non-Internet users) (see Dutwin and Buskirk 2022). Improving survey estimates by accounting for the underrepresentation of less IT-literate respondents will increase the generalizability and thus the quality of findings from online surveys.
Supplemental Material
Supplemental Material - What about the Less IT Literate? A Comparison of Different Postal Recruitment Strategies to an Online Panel of the General Population
Supplemental Material for What about the Less IT Literate? A Comparison of Different Postal Recruitment Strategies to an Online Panel of the General Population by Barbara Felderer, and Jessica M. E. Herzing in Field Methods
Footnotes
Declaration of Conflicting Interests
The author(s) declared no potential conflicts of interest with respect to the research, authorship, and/or publication of this article.
Funding
The author(s) disclosed receipt of the following financial support for the research, authorship, and/or publication of this article: This work was supported by the Deutsche Forschungsgemeinschaft (SFB 884 and project number 491156185). We thank the GIP team, especially Annelies Blom, Carina Cornesse, Ulrich Krieger and Marina Ungefucht for their support in planning and conducting this study. We are especially grateful to Marina for her help with data access.
Supplemental Material
Supplemental material for this article is available online.
References
Supplementary Material
Please find the following supplemental material available below.
For Open Access articles published under a Creative Commons License, all supplemental material carries the same license as the article it is associated with.
For non-Open Access articles published, all supplemental material carries a non-exclusive license, and permission requests for re-use of supplemental material or any part of supplemental material shall be sent directly to the copyright owner as specified in the copyright notice associated with the article.