
Abstract
Although list-style open-ended questions generally help us gain deeper insights into respondents’ thoughts, opinions, and behaviors, the quality of responses is often compromised. We tested a dynamic and a follow-up design to motivate respondents to give higher quality responses than with a static design, but without overburdening them. Our results showed that a follow-up design achieved longer responses with more themes and theme areas than a static design. In contrast, the dynamic design produced the shortest answers with the fewest themes and theme areas. No differences in item nonresponse and only minor differences in additional response burden were found among the three list-style designs. Our study shows that design features and timing are crucial to clarify the desired response format and motivate respondents to give high-quality answers to list-style open-ended questions.
Introduction
The use of open-ended questions is often discussed as a trade-off between response quality and response burden. Narrative open-ended questions ask respondents to write long and detailed answers in a large answer box. Advantages are, among others, that respondents can give more spontaneous, detailed, and varied answers in their own words without being influenced or restricted by predefined response alternatives (Reja et al. 2003; Schuman and Presser 1979). Narrative open-ended questions are beneficial when we know too little about an issue to provide respondents with a set of meaningful response alternatives (Schuman and Presser 1979; Singer and Couper 2017). A major disadvantage is that narrative open-ended questions generally lead to more missing data and more inadequate answers than closed ones (Reja et al. 2003; Schuman and Presser 1979), which is often explained by the higher effort involved in answering as well as the necessary ability and motivation of respondents to formulate their thoughts in their own words (Schmidt et al. 2020; Scholz and Zuell 2012; Schuman and Presser 1979). As a special kind of open-ended question, list-style open-ended questions consist of several small answer boxes instead of one large answer box. List-style open-ended questions encourage respondents to provide a response covering several aspects, each of which is relatively short (Keusch 2014). However, they also often suffer from item nonresponse or too short, incomplete, or otherwise inadequate answers (Meitinger and Kunz 2022; Smyth et al. 2007).
Web surveys offer various ways to improve response quality and convey the desired format of responses to open-ended questions using verbal and visual design features and interactive elements (e.g., Couper et al. 2011). Key findings are briefly described.
Verbal Information
Motivational statements (e.g., “Please give your answer in as much detail as possible”) may encourage longer responses with more topics or aspects mentioned (Chaudhary and Israel 2016; Metzler et al. 2015; Smyth et al. 2009) and reduce item nonresponse (Chaudhary and Israel 2016; Oudejans and Christian 2010; Zuell et al. 2015). Similarly, interactive follow-up probes provided after respondents have submitted their initial answers and requesting further information on this question (e.g., “Are there any other topics you are interested in?”) have been promising to increase the number of characters or words written and the number of themes mentioned. Item nonresponse remained unaffected (Holland and Christian 2009; Oudejans and Christian 2010).
Visual Information
For open-ended questions, increasing the answer box size can promote longer answers (Baier and Fuchs 2018; Maloshonok and Terentev 2016) and more topics (Baier and Fuchs 2018). Other studies, however, found such effects only under certain circumstances (Chaudhary and Israel 2016; Smyth et al. 2009) or not at all (Chaudhary and Israel 2016; Emde and Fuchs 2012; Traugott and Antoun 2015). In some instances, larger answer box sizes may lead to more item nonresponse (Zuell et al. 2015), although in most cases, no significant effects were found on item nonresponse (Baier and Fuchs 2018; Chaudhary and Israel 2016; Maloshonok and Terentev 2016; Smyth et al. 2009). For list-style open-ended questions, where several themes should preferably be listed in a few words, increasing the number of answer boxes leads to more themes or aspects mentioned (Keusch 2014; Smyth et al. 2007); these themes are then described with fewer details, explanations, or descriptions (Hofelich Mohr et al. 2016; Smyth et al. 2007). However, item nonresponse increased with multiple answer boxes (Fuchs 2009, 2013; Smyth et al. 2007). The use of interactive answer boxes could solve this dilemma: By starting with a single answer box, respondents may be more inclined to answer; and by dynamically adding more answer boxes once a response is given, respondents may be encouraged to mention additional topics or aspects. However, findings showed that respondents reported fewer themes or aspects when the answer boxes were dynamically provided. Item nonresponse remained largely unaffected (Fuchs 2009, 2013).
Previous studies have tested various verbal and visual design features in different survey contexts, based on diverse question content and formats, and discussed response quality primarily regarding the number of characters and themes mentioned. To achieve better comparability and draw conclusions about which design features most improve response quality in list-style open-ended questions without overburdening respondents, we tested different designs in a single survey based on the same questions. We used different indicators to assess response quality and response burden.
The Current Study
This study systematically compares two interactive list-style open-ended question designs (i.e., dynamic and follow-up design) with a conventional list-style open-ended question design (i.e., static design). We asked whether using different interactive verbal and visual design features in web surveys can promote higher response quality than a static design without unreasonably increasing the response burden.
As we know from previous research, a higher number of answer boxes for list-style open-ended questions can increase response length and the number of themes mentioned. However, more answer boxes also often increase item nonresponse, which suggests “that [several] answer boxes may have appeared too difficult for some respondents” (Smyth et al. 2007:13). So, instead of providing all answer boxes at once, we can offer them dynamically one after another. As only one small answer box is visible when respondents first see the question, the initial hurdle to answer the question should be lower. Therefore, we would expect a decrease in item nonresponse in the dynamic design.
A step-by-step display of additional answer boxes should signal to respondents that multiple answers are desired. This repeated implicit request would motivate the respondents to write longer responses and list more themes. However, previous studies suggested that respondents form their answers based on what they initially see. Even when additional answer boxes are provided, respondents are unwilling to adjust their initial response to the changed context (Fuchs 2009). In our scenario, this would mean that respondents form their answers based on a single answer box that is initially visible, thus keeping their answers rather succinct. An alternative explanation is that respondents become fatigued or even frustrated by the additional answer boxes that appear unexpectedly for them. As respondents become increasingly tired and impatient with each additional answer box displayed, they may be unwilling to exert the effort required to retrieve additional information (Ben-Nun 2008; Marton 2005). Both mechanisms led us to expect shorter responses and a smaller number of themes mentioned with the dynamic design. Since we expected that respondents would not be willing to retrieve additional information, we also expected a lower number of different theme areas to which the mentioned themes were assigned.
Although interactive follow-up probes help promote longer responses and more themes with open-ended questions, we are not aware of any study to date that has tested them with list-style open-ended questions. A follow-up design for list-style open-ended questions allows for the same number of answer boxes spread across multiple pages. The smaller number of answer boxes that respondents initially see on the first page should also lower the initial hurdle for answering the question. Therefore, we would expect lower item nonresponse in the follow-up design. The explicit request on the second page should motivate respondents to retrieve additional information and write down further aspects, resulting in longer responses overall with more themes and theme areas in the follow-up design.
Writing a substantive response that is longer and covers multiple themes and theme areas also requires more effort. However, this higher response burden seems justified given higher response quality. Apart from this “justified” effort, we did not expect any additional or unreasonable burden on the respondents when using a dynamic or follow-up design.
These considerations led us to the following hypotheses: 1. The dynamic (H1a) and follow-up (H1b) design are less susceptible to item nonresponse than a static design. 2. The dynamic design (H2a) leads to shorter answers and fewer themes and theme areas than a static design. In contrast, the follow-up design (H2b) results in longer answers with more themes and theme areas than a static design. 3. The dynamic (H3a) and follow-up (H3b) design do not entail an additional “unjustified” response burden compared with a static design.
Methods
Sample
We embedded our experiment in a web survey on “Politics and Work,” conducted among respondents from a German non-probability online access panel in October 2018. The quota sample was based on gender, age, and education. We invited 5,563 active panel members, 824 of whom were screened out due to age restrictions of 18–69 years or because the quotas were full. The participation rate was 92% (n = 4,371; AAPOR 2016), and the overall breakoff rate was 5% (n = 238; Callegaro and DiSogra 2008). Fifty percent of the respondents were female, the average age was 45 years, and 33% had a (subject-related) higher education entrance qualification. We used a responsive questionnaire design where the layout of the questions dynamically adapts to different screen sizes; 25% of the respondents completed the survey on their smartphone and 7% did it on their tablet.
Experimental Design
In a between-subjects design, respondents were randomly assigned to either the control group or one of two experimental groups (see Figure 1). In the static design (CG), six answer boxes were displayed on one page. In the dynamic design (EG1), one answer box was initially displayed. When respondents clicked in the first answer box, a second answer box appeared, followed by a third, and so on, providing up to six answer boxes on the same page. In the follow-up design (EG2), three answer boxes were displayed on the first page. When respondents clicked Continue, three additional answer boxes were provided on a second page along with the question “Are there any other aspects?” giving a total of six answer boxes on two pages. Experimental design based on two experimental questions (Q1/Q2) and three list-style designs (CG/EG1/EG2). ➥The arrow symbolizes the dynamic mechanism in EG1, where clicking on the first answer box brings up a second answer box, followed by a third, and so on (up to six answer boxes).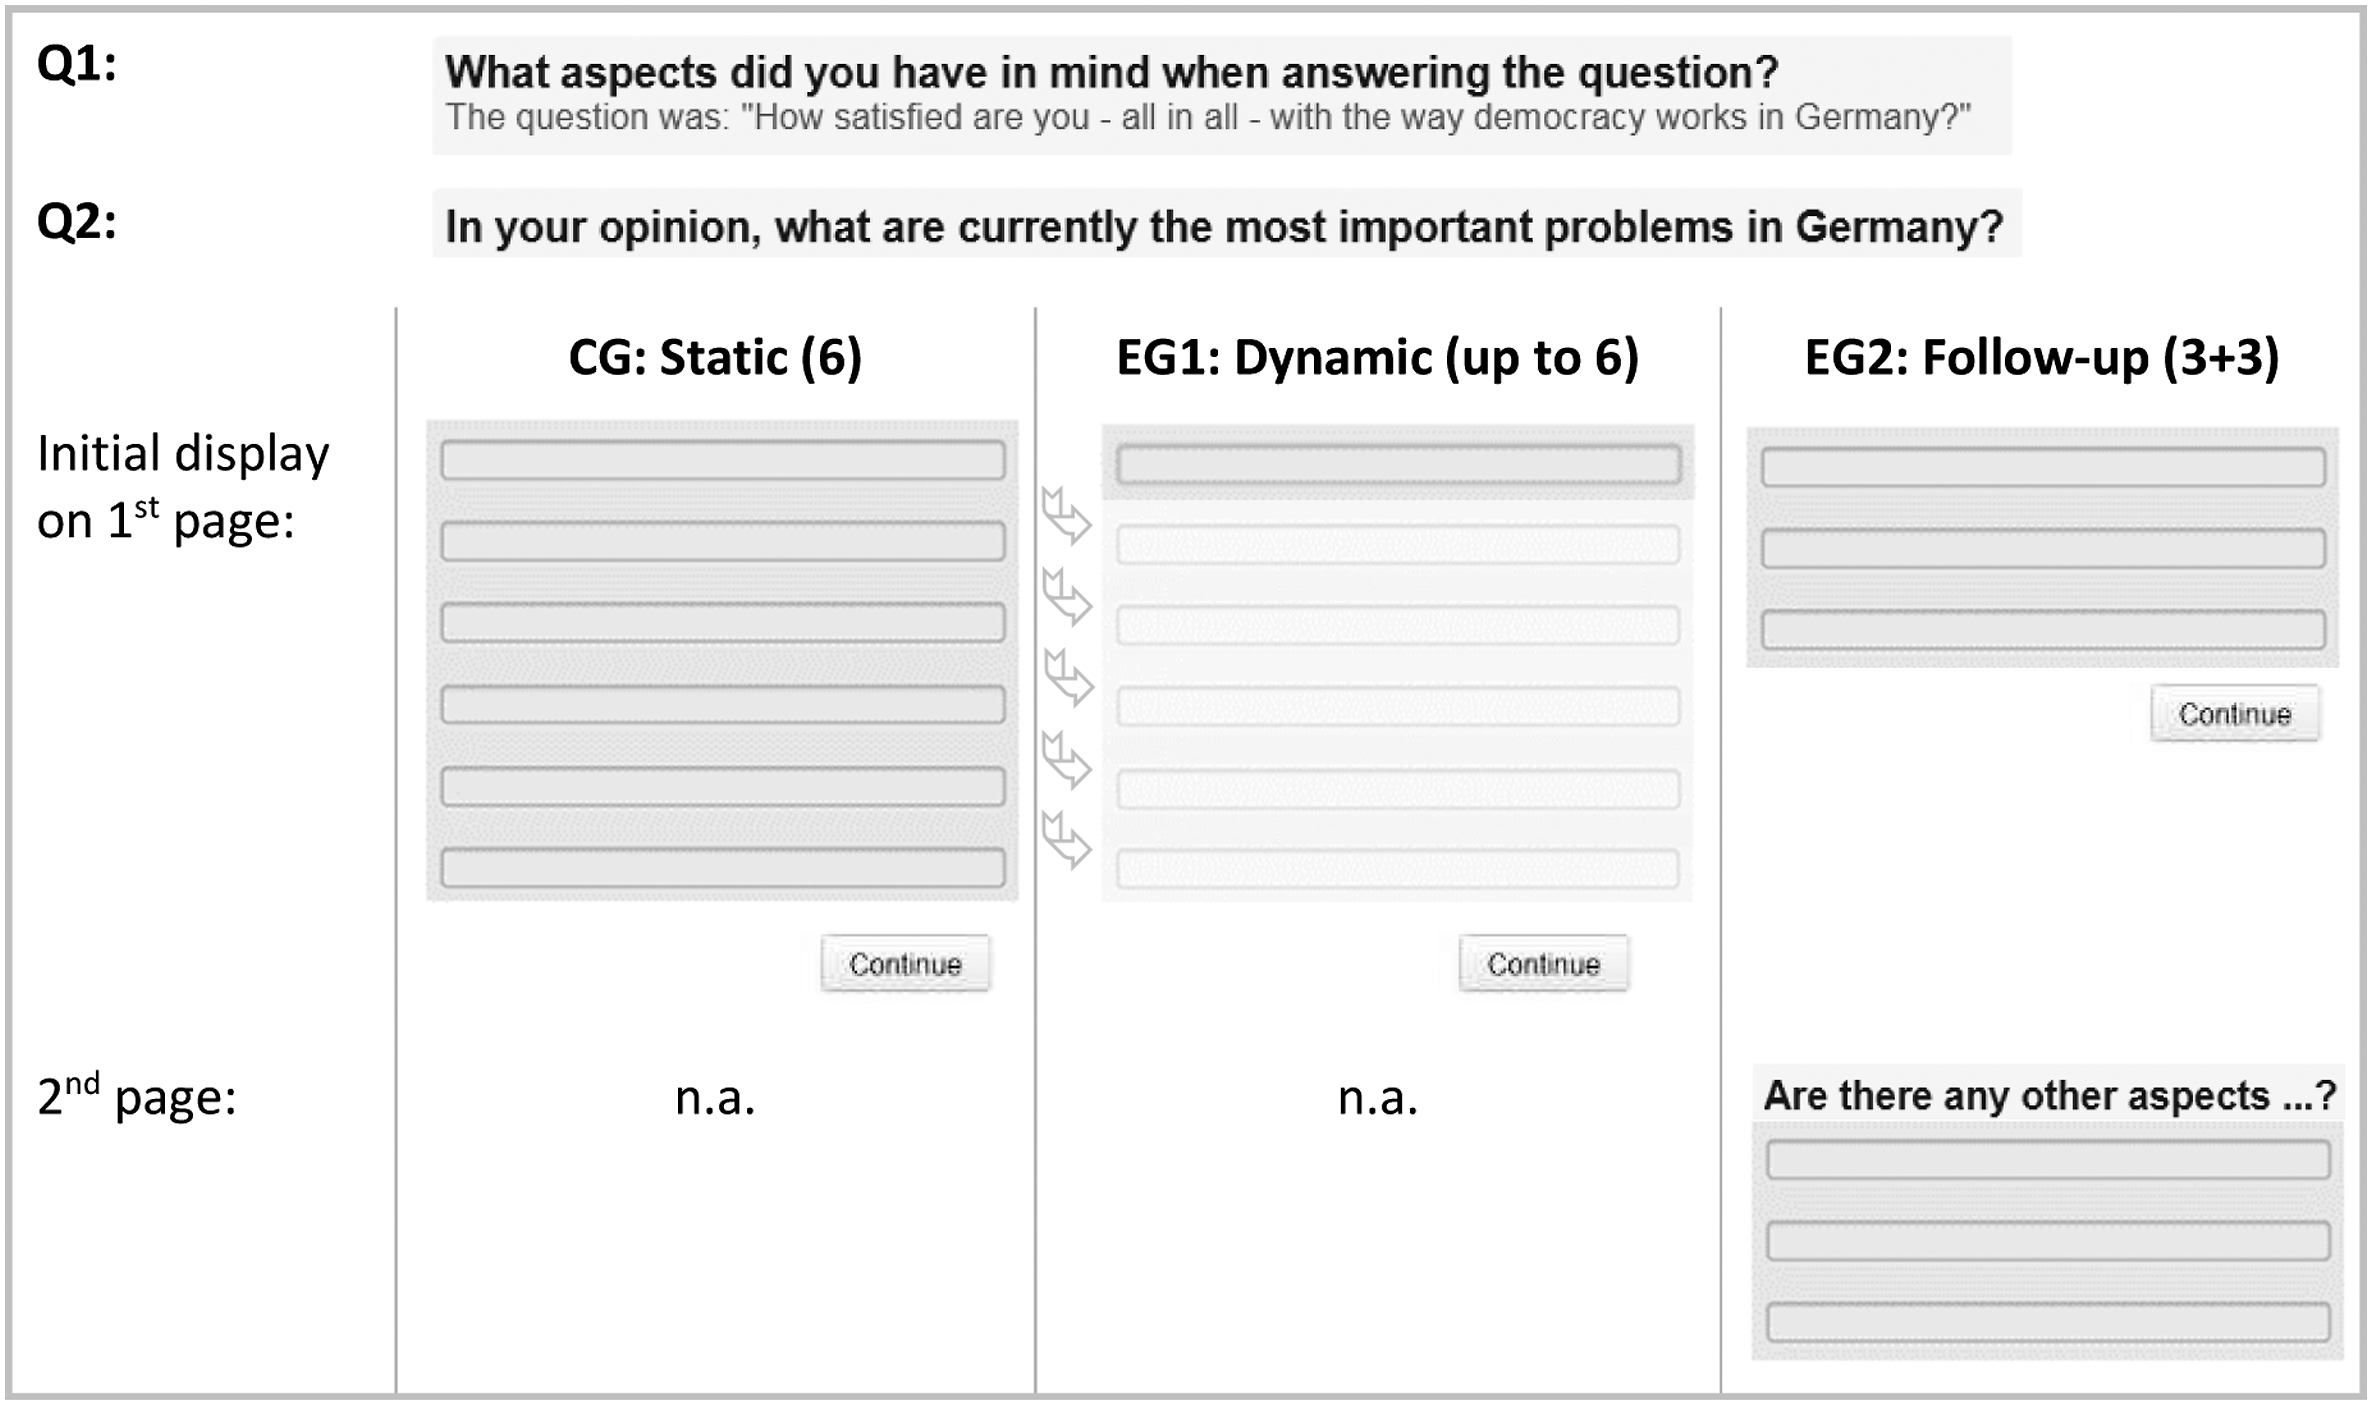
We tested our experimental design based on two list-style open-ended questions (see Figure 1). Respondents were asked only one of the two experimental questions. Assignment to the experimental questions was random and independent of the assignment to the three list-style designs. The first experimental question on “Satisfaction with democracy” (Q1) was a special kind of list-style open-ended question; a specific probe that asked, “What aspects did you have in mind when answering the question?” (in German, “An welche Aspekte haben Sie bei der Beantwortung der Frage gedacht?”). The initial closed question was, “How satisfied are you—all in all—with the way democracy works in Germany?” (in German, “Wie zufrieden sind Sie—alles in allem—mit der Art und Weise, wie die Demokratie in Deutschland funktioniert?”). The second experimental question on “Current problems” (Q2) was a common list-style open-ended question asking, “In your opinion, what are currently the most important problems in Germany?” (in German, “Was sind Ihrer Meinung nach gegenwärtig die wichtigsten Probleme in Deutschland?”).
Coding Procedure
Coding of the open-ended responses to Q1 and Q2 was performed by two human coders using a coding plan. We distinguished different codes, grouping thematically related codes into code families (e.g., the two codes “Securing the subsistence minimum” and “Old-age security” are assigned to the code family “Social security”). The coding plan included 50 codes assigned to five code families for Q1 and 24 codes assigned to eight code families for Q2 (each with a residual category for substantive responses not covered by other codes). In addition to substantive codes, the coding plans included several codes for different forms of item nonresponse (e.g., no answer at all, “don’t know” answer, nonsense answer such as “xxx,” and unspecific answer such as “all”).
In principle, the same code could be assigned multiple times per response if a respondent mentioned several aspects that were all covered by the same code (e.g., “no support for families” and “lack of support for single parents” were both coded as “730—family policy and childcare”). Simple repetitions of the same aspect (e.g., “politicians,” “politicians,” “politicians”) and aspects split across multiple answer boxes (e.g., “disorientation of,” “the,” “government”) were coded only once. Most responses consisted of short entries, often comprising keywords or brief descriptions to which a code could easily be assigned (e.g., “child poverty,” “excessively high rents,” “refugee crisis,” “gap between rich and poor”). Both coding plans are available from the authors upon request.
Measures
We distinguished four indicators of response quality. Item nonresponse rates measured the percentage of cases with an empty answer box or with “don’t know,” nonsense (e.g., “fdjkgfg”), or unspecific answers (e.g., “there are too many”) that could not be meaningfully interpreted and coded, among all cases (Holland and Christian 2009; Kaczmirek et al. 2017; Kunz et al. 2021; Oudejans and Christian 2010). The number of characters per response was automatically counted using the SPSS string function CHAR. LENGTH. The number of themes mentioned was counted based on the codes extracted from the open-ended responses. Multiple mentions of the same code were counted multiple times per respondent answer. The number of theme areas was counted based on the code families. Multiple mentions of the same code family were counted only once per respondent answer.
As an indicator of the response burden, we examined the absolute response time that the respondents took to answer the list-style open-ended questions. We used the embedded client side paradata (ECSP) script to capture page-wise response times (Schlosser and Höhne 2020). Moreover, we calculated relative response times per character, theme, and theme area. By controlling for the number of characters, themes, and theme areas, and thus the amount of effort the respondents expended to answer the question, these measures were better suited to determine the potential additional burden imposed by the interactive list-style designs.
Analysis
Response Quality and Response Burden in Three Designs for List-style Open-ended Questions on “Satisfaction with Democracy” (Q1) and “Current Problems” (Q2).
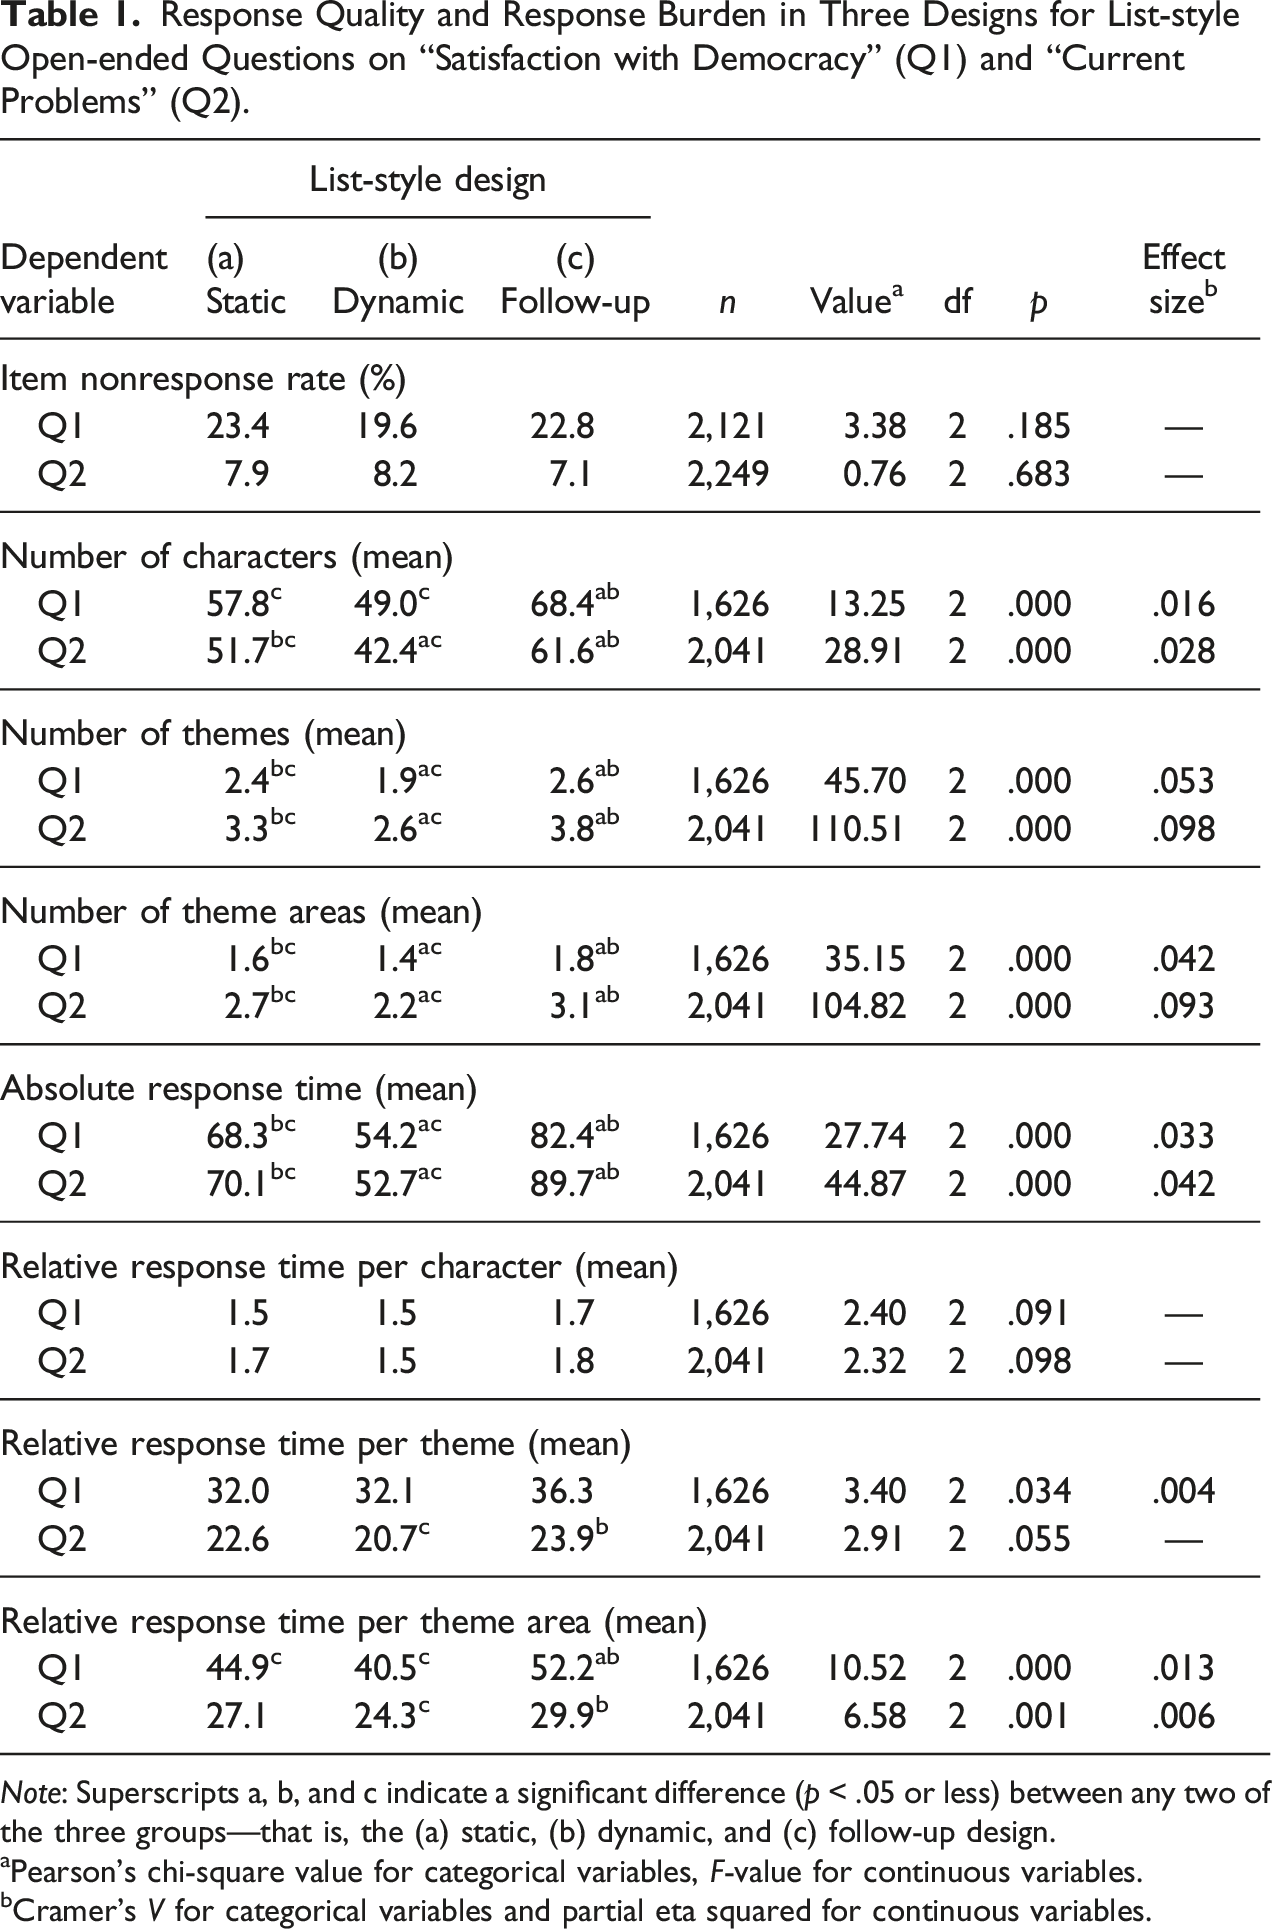
Note: Superscripts a, b, and c indicate a significant difference (p < .05 or less) between any two of the three groups—that is, the (a) static, (b) dynamic, and (c) follow-up design.
aPearson’s chi-square value for categorical variables, F-value for continuous variables.
bCramer’s V for categorical variables and partial eta squared for continuous variables.
Results
Table 1 summarizes our findings regarding response quality and response burden for the three designs for list-style open-ended questions.
Response Quality
Item nonresponse rates in the two experimental questions did not differ between the three list-style designs. This finding was contrary to our assumption that the dynamic and follow-up designs are less prone to item nonresponse than a static design (H1a and H1b not supported). Comparing the three list-style designs in terms of the mean number of characters showed that the follow-up design produced the longest answers and the dynamic design the shortest answers for both experimental questions. Considering the mean number of themes, respondents mentioned most themes in the follow-up design, while the dynamic design resulted in the fewest themes mentioned in both experimental questions. Besides, if we look at the mean number of theme areas, respondents reported the most theme areas in the follow-up design. In contrast, the fewest theme areas were mentioned in the dynamic design. To rule out that longer answers with more themes and theme areas in the follow-up design were due to the different numbers of answer boxes on the first page instead of the follow-up probe on the second page, we conducted the analyses based solely on the answers that respondents provided on the first page. In this case, we found significantly shorter answers with fewer themes and theme areas mentioned in the follow-up design compared with the static design in both experimental questions (see Table A1 in Appendix). This finding shows that the larger number of characters, themes, and theme areas was due to the follow-up probe on the second page. According to our expectations, the dynamic design resulted in shorter answers with fewer themes and theme areas mentioned (H2a supported) than a static design. Also consistent with our assumptions, the follow-up design resulted in longer responses with more themes and theme areas mentioned (H2b supported).
Response Burden
When analyzing absolute response times, we found the longest response time when the experimental questions were presented in the follow-up design and the shortest response time for the dynamic design. Results on relative response times showed that the differences between the three list-style designs became smaller when the number of characters, themes, and theme areas was taken into account. Significant effects were found for relative response times per theme area, primarily due to longer response times in the follow-up design for Q1. However, effect sizes were small. Performing the same analysis with log-transformed response time data to account for skewed distributions led to comparable results. Therefore, we concluded that the dynamic and follow-up design did not excessively or “unjustifiably” increase the response burden compared to a static design (H3a and H3b supported).
Discussion
This study examined the effects of three design variants for list-style open-ended questions on response quality and response burden in web surveys. We compared a dynamic design (i.e., additional answer boxes appear one after the other on a page once the respondents click in the previous answer box) and a follow-up design (i.e., additional answer boxes are provided on a second page after respondents have already submitted their initial answers, along with an explicit verbal request to mention further aspects) with a static design (i.e., all answer boxes are displayed on one page at once). We investigated whether dynamic and follow-up designs can achieve higher response quality than a static design without unduly increasing response burden.
Concerning our response quality indicators, we found that respondents receiving a follow-up design wrote longer responses and mentioned more themes and theme areas than respondents receiving a static design. In contrast, the dynamic design had adverse effects on response quality and resulted in the shortest answers with the fewest themes and theme areas. No differences were found between the three list-style designs concerning item nonresponse. And we found only a few differences in the extent of response burden, as measured by the response time, taking into account the answers’ length and scope.
Our results suggest that interactive design features in list-style open-ended questions can provide additional benefits to the quality of responses without overburdening respondents. However, we also found that their effectiveness depends on how the verbal and visual design features are implemented. It seems that an explicit verbal “call to action” using a follow-up probe is necessary to motivate respondents to give longer answers and mention more themes and theme areas. A rather implicit visual prompt by dynamically providing one answer box after another seems insufficient for this purpose.
Our findings may be explained by the respondents’ cognitive processing of survey questions. Respondents first perceive a list-style open-ended question, including the question text and the provided answer boxes (Jenkins and Dillman 1997; Redline and Dillman 2002). Then they read the question text, retrieve information from memory, form an answer, and finally write down their answers (e.g., Groves 1989; Sudman et al. 1996; Tourangeau et al. 2000). In our dynamic design, respondents initially see a single answer box, and only after they start writing their answer do they see a second (and third and so on) answer box. So, it is reasonable that if additional answer boxes are displayed after respondents have started writing, they are no longer willing to deviate from their already formed answers. In other words, “respondents had already decided how to answer the question and did not change their initial response strategy” (Fuchs 2009:9). Alternatively, the unexpected appearance of more and more answer boxes could cause respondents to become fatigued or frustrated and therefore unwilling to write down additional answers. However, with our experimental design, it was not possible to clarify which of the two mechanisms is determinant. In the follow-up design, the additional probe on the second web page is framed as a separate question that explicitly asks respondents to reconsider and add to their previously given answers. In this case, respondents view the follow-up question as a stand-alone question. They are willing to go through the question–answer process one more time to provide additional aspects that cover thematic areas not previously addressed. Besides more themes, follow-up designs also offer more diverse themes, contributing to greater response variety.
We see further optimization potential regarding follow-up probes, which can be tailored interactively to the respondents’ previous response behavior. In our experiment, all respondents received the same request (i.e., “Are there any further aspects…”), regardless of how many and which aspects they mentioned in their initial answer. More tailored follow-up probes that take account of the responses to the initial question could be, for example, “You have already mentioned aspect a, b, and c. We appreciate your effort. Can you think of other aspects?” Or, for respondents who left the initial question unanswered, “You have not yet mentioned any aspects. Please think again carefully and name at least one aspect.” (For a similar approach, see Kaczmirek et al. 2017).
Another aspect that needs to be investigated when using interactive design features in web surveys is a possible wear-out effect. When follow-up probes are increasingly used, respondents may no longer be willing to reconsider their previously formed answers. Instead, in anticipation that there will be a follow-up question, they may already split their answer into two answers, mentioning only some of their aspects in the first question and “saving” the others for the anticipated follow-up question. This response strategy would ensure that both questions, the first and the follow-up, are answered. However, it does not result in more themes or theme areas being mentioned overall.
We should also investigate the optimal positioning of a follow-up probe in a questionnaire. In our study, the two list-style open-ended questions were placed relatively at the beginning of the questionnaire. In general, the assumption is that the respondents’ level of motivation decreases as the survey progresses (Galesic 2006; Neuert 2021). Therefore, it is conceivable that the follow-up probes are particularly effective at the beginning of the questionnaire when respondents are still motivated to mention other aspects and themes. Conversely, it could also be argued that the follow-up probes are especially helpful toward the end of the questionnaire and motivate the respondents to mention several themes if they are not willing to do so without additional prompting.
A more general aspect we would like to conclude on is the measurement of response quality and response burden in (list-style) open-ended questions and the potential to examine them in a broader perspective. In our study, we looked at the number of theme areas in addition to the common indicators of response quality for open-ended questions (i.e., number of characters and themes) to provide a more qualitative assessment of respondents’ answers to list-style open-ended questions. Unlike the traditional indicator, the number of themes, our indicator number of theme areas implicitly down weights additional themes if they cover a theme area already mentioned. This indicator discards “more of the same,” and instead considers only “new” content. Accordingly, the number of characters and number of themes primarily allow conclusions to be drawn about the quantitative scope of a response, while the number of theme areas reflects the qualitative variety of the responses to a list-style open-ended question. Concerning the measurement of response burden, it is generally assumed that two dimensions can be distinguished: actual and perceived burden. Both aspects of response burden can affect response quality, with perceived burden having at least as crucial, if not more significant, an impact on response quality than actual burden (Haraldsen 2004; Plewes 2016). In our study, however, we could only address the extent of actual burden as measured by the time it takes respondents to complete a question. Therefore, in future studies investigating questionnaire design features, we should pay more attention to the fact that whether a question is burdensome depends not only on how much time respondents take to answer the question, but also on how respondents subjectively perceive the process of answering.
Footnotes
Declaration of Conflicting Interests
The author(s) declared no potential conflicts of interest with respect to the research, authorship, and/or publication of this article.
Funding
The costs for the open access publication were funded by the Deutsche Forschungsgemeinschaft (DFG, German Research Foundation) ‐ Project number 491156185.
Appendix
Response Quality in Three Designs for List-style Open-ended Questions on “Satisfaction with Democracy” (Q1) and “Current Problems” (Q2)—Limited to Responses Given on the First Page. Notes: Superscripts a, b, and c indicate a significant difference (p < .05 or less) between any two of the three groups—that is, the (a) static, (b) dynamic, and (c) follow-up design. aPearson's chi‐square value for categorical variables, F‐value for continuous variables. bCramer’s V for categorical variables and partial eta squared for continuous variables.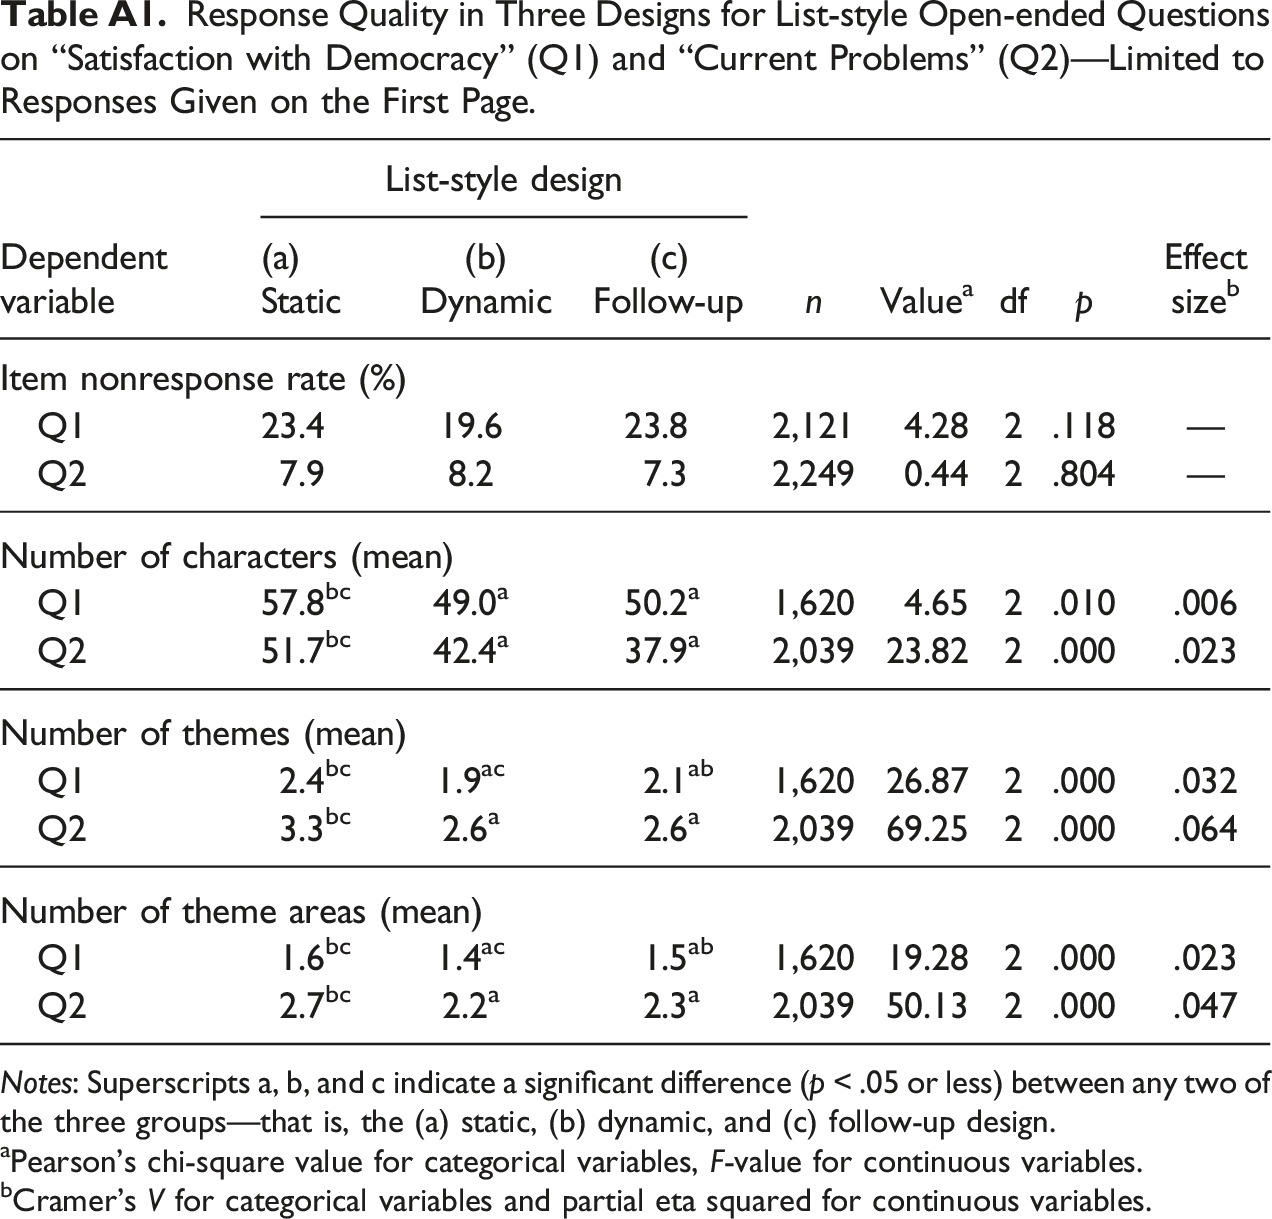
Dependent variable
List-style design
n
Value
a
df
p
Effect size
b
(a) Static
(b) Dynamic
(c) Follow-up
Item nonresponse rate (%)
Q1
23.4
19.6
23.8
2,121
4.28
2
.118
—
Q2
7.9
8.2
7.3
2,249
0.44
2
.804
—
Number of characters (mean)
Q1
57.8bc
49.0a
50.2a
1,620
4.65
2
.010
.006
Q2
51.7bc
42.4a
37.9a
2,039
23.82
2
.000
.023
Number of themes (mean)
Q1
2.4bc
1.9ac
2.1ab
1,620
26.87
2
.000
.032
Q2
3.3bc
2.6a
2.6a
2,039
69.25
2
.000
.064
Number of theme areas (mean)
Q1
1.6bc
1.4ac
1.5ab
1,620
19.28
2
.000
.023
Q2
2.7bc
2.2a
2.3a
2,039
50.13
2
.000
.047