
Abstract
Attention checks detect inattentiveness by instructing respondents to perform a specific task. However, while respondents may correctly process the task, they may choose to not comply with the instructions. We investigated the issue of noncompliance in attention checks in two web surveys. In Study 1, we measured respondents’ attitudes toward attention checks and their self-reported compliance. In Study 2, we experimentally varied the reasons given to respondents for conducting the attention check. Our results showed that while most respondents understand why attention checks are conducted, a nonnegligible proportion of respondents evaluated them as controlling or annoying. Most respondents passed the attention check; however, among those who failed the test, 61% seem to have failed the task deliberately. These findings reinforce that noncompliance is a serious concern with attention check instruments. The results of our experiment showed that more respondents passed the attention check if a comprehensible reason was given.
Introduction
With the introduction of web surveys in the late 1990s, conducting surveys online has become relatively easy and inexpensive (Couper 2000). Many commercial companies and academic institutions have launched their own web-based (access) panels (Callegaro et al. 2014). These panels consist of people who agreed to fill in surveys on a regular basis and, commonly, receive a small incentive as compensation. While this development has created many research opportunities, there are wider concerns regarding the response quality of often self-selective web panels (e.g., Baker et al. 2010, 2013).
To assess response quality in a survey, a variety of indicators have been proposed. These indicators include counting the number of item nonresponses, checking for speeders, assessing non-differentiation or long string responses, measures of acquiescence, and responses consistency assessments. Such indicators can be calculated without adding questions as they are computed from respondents’ answers. Previous studies suggested that these indicators capture careless responding (e.g., Krosnick 1991; Meade and Craig 2012; Roßmann et al. 2018; Tourangeau et al. 2004). As a more direct approach of assessing how careful respondents answer questions, attention checks have been suggested (e.g., Berinsky et al. 2014; Gummer et al. 2021; Jones et al. 2015; Meade and Craig 2012; Oppenheimer et al. 2009).
Attention checks are instruments that aim to capture whether respondents thoroughly read, comprehend, and answer questions. They are also employed to identify bots and respondents who use scripts to automatically respond for them (e.g., Amaya et al. 2020; Dupuis et al. 2019; Kennedy et al. 2020). Different forms of attention checks exist: instructional manipulation checks (e.g., Oppenheimer et al. 2009), bogus items (e.g., Meade and Craig 2012), and instructed response items (e.g., Gummer et al. 2021). Instructional manipulation checks ask respondents to ignore the response options and instead provide proof that they have read the question instruction (e.g., by selecting a specific element on the screen). Bogus items require respondents to answer statements for which a correct answer exists (e.g., “dogs are animals”). Instructed response items are a special form of attention checks in which respondents are asked to select a specific response category (e.g., “select strongly disagree”).
Since even the presence of a low proportion of careless respondents can produce important spurious effects on substantive results (Arias et al. 2020; Maniaci and Rogge 2014), attention checks are increasingly implemented to assess respondents’ attentiveness. However, compared to their frequent usage, only a limited number of methodological studies exist that investigate the properties of attention checks and their measurement quality (e.g., Anduiza and Galais 2017; Berinsky et al. 2014; Gummer et al. 2021; Jones et al. 2015; Shamon and Berning 2020). In survey practice, attention checks are usually recommended in experimental and non-experimental settings. However, Hauser et al. (2018) and Hauser and Schwarz (2015), who applied attention checks in an experimental setting, noted that respondents might be aware of the use of attention checks for “catching” inattentive respondents. Thus, respondents may perceive attention checks as taxing, which could have an impact on subsequent response behavior. However, previous studies on this issue have shown limited spill-over effects of attention checks (e.g., Berinsky et al. 2014; Gummer et al. 2021; Hauser et al. 2016). To alert respondents that attention checks will be implemented, researchers have investigated the effectiveness of forewarnings about the checks (e.g., Berinsky et al. 2016; Clifford and Jerit 2015; Huang et al. 2012; Liu and Wronski 2018), which often successfully increased the engagement levels of the respondents.
Related research points out that respondents may even mindfully and intentionally choose to not comply with the instruction and, thus, fail the test (Gummer et al. 2021). In line with this reasoning, a recent study showed that approximately one-third of respondents who noticed an attention check reported to have failed it on purpose (Liu and Wronski 2018). Similarly, Curran and Hauser (2019) showed, in two laboratory studies with students, that false-positive rates between attention check questions can vary between 2% and 17%. 1 If these findings generalize, then decisions to exclude respondents from substantive analyses (e.g., Jones et al. 2015; Oppenheimer et al. 2009) or attempts to train respondents to become more attentive (Berinsky et al. 2016) may be based on premature evidence.
To address this research gap, we investigated the issue of noncompliance when answering attention checks in two studies. In Study 1, we implemented a series of questions about attention checks to explore how respondents think about them and whether respondents deliberately decide against complying with instructions. Based on those insights, in Study 2, we implemented an experiment in a web survey to test whether noncompliance can be reduced through changes in the wording of the attention checks. Altogether, we investigated two research questions and one hypothesis:
What attitudes do respondents hold toward attention checks?
Do respondents notice attention checks and comply with the instructions?
Providing an explanation why attention checks are implemented reduces the number of false positives.
The Issue of Noncompliance
The cognitive process of answering a survey question involves four cognitive steps: question comprehension, retrieval of relevant information, judgment, and providing a response (Tourangeau et al. 2000). Attention checks test whether respondents shortcut this cognitive process, particularly with respect to the step of question comprehension. Omission or superficial processing in this initial step might seriously affect the remaining steps in the response process. Respondents will either shortcut the information retrieval and judgment steps altogether and not provide a response at all, or they retrieve incomplete or irrelevant information, which will ultimately result in biased judgments and responses.
The fundamental assumption for reliable and proper functioning of attention checks requires that under any circumstances attentive respondents will comply with the instructions in the instrument. We argue that this very strong assumption may not hold in many survey settings due to several reasons. Attentive respondents might be confused by the instruction and therefore not be motivated or willing to respond as instructed. Respondents further may perceive attention checks as taxing or intrusive, which could result in reactance in the form of item nonresponse (Abbey and Meloy 2017; Peer et al. 2014). Thus, when confronted with an attention check question, some respondents will thoroughly pass all steps of the cognitive response process but, ultimately, arrive at a decision against following the instruction. In this case, an attention check would indicate inattentiveness, and a respondent would falsely be attributed to shortcutting the response process. This issue is even more problematic as noncompliance constitutes a deliberative act of defying the instructions of an attention check. Since processing of all question information is necessary to be able to decide not to comply, noncompliance is exactly the opposite of what attention checks are intended to measure.
Study 1
Study 1 aimed at exploring the respondents’ attitudes toward attention checks (RQ1) and whether they comply with the instructions if they notice the attention check (RQ2).
Data
Data were collected in a web survey on political issues, fielded between June and July 2018 in Germany. Respondents were selected from a nonprobability online access panel using quotas matching the German population at that time with respect to gender, education, and age. The questionnaire was about 20 minutes long, and the attention check, as well as a battery of attitudes toward attention checks, were both placed in the second half of the questionnaire. Overall, 4,299 persons started the questionnaire, of whom 7.1% did not complete the survey. The final sample for our analyses included 3,993 respondents. Respondents were randomly assigned to complete the survey on different types of devices to control for device effects: 48.4% of the respondents answered the survey with their personal computer, notebook, or tablet, and 51.6% on their smartphone. 2
Measures
The attitude battery included eight items with statements about attention checks, which respondents answered on a 5-point agree–disagree response scale (strongly agree, agree, neither nor, disagree, strongly disagree).
3
We designed the instrument to cover the most important characteristics that survey respondents associate with attention checks. Besides theoretical considerations, we relied on respondents’ comments on attention check questions from previous surveys when developing the items: 1. “Such requests annoy me.” 2. “I find such requests confusing.” 3. “I feel controlled by such requests.” 4. “Such requests increase my attention.” 5. “I find such requests motivating.” 6. “I feel manipulated by such requests.” 7. “I do not want to be instructed on how to answer.” 8. “I understand such requests.”
As an attention check, we used an instructed response item (IRI) (Gummer et al. 2021; Meade and Craig 2012), which instructed respondents to select a specific response option. The IRI was placed between the fourth and fifth item of a 5-item battery on political attitudes and instructed respondents to select “agree” for that item. All items of the battery used the same response scale (strongly agree, agree, neither nor, disagree, strongly disagree).
We included a follow-up question after the attention check (Liu and Wronski 2018), which asked respondents the following: “We have just asked you to click “agree” to check the functioning of our questionnaire. Have you noticed this request?”
Respondents could either select “yes” or “no” as their response to the follow-up question.
Results
The number of respondents who agreed (by selecting “agree” or “strongly agree”) to each of the eight attitude questions about attention checks depended heavily on the statement itself. While most respondents (81.6%) stated they understood the requests and many thought they increased attention (50.8%), a nontrivial proportion of respondents found them annoying (16.8%), confusing (10.1%), or manipulating (10.4%). About a fourth of the respondents stated that they perceived attention checks as controlling (25.0%) and that they don’t want to be instructed (24.3%). Not surprisingly, only about a third of the sample (31.4%) classified attention checks as motivating.
Our second research question asked whether people notice attention checks. While 10.9% of the respondents failed the attention check, 94.1% reported that they noticed the attention check. Strikingly, this is a discrepancy of 5.0% percentage points. Given that some respondents may have passed by arbitrarily answering without reading the instructions, we see it as a conservative estimate. 4 We found that of those respondents who passed the attention check, 1.9% reported that they did not notice it, and of all respondents who failed it, 61.1% stated that they noticed the attention check (see Table A1 in the Online Appendix). The percentage in our study is higher than the numbers reported by Liu and Wronski (2018), who reported that between 32% and 44% showed this response behavior. Both studies together strengthen the notion that noncompliance is an important consideration when including attention checks in surveys.
Since it is reasonable to assume that some respondents who were actually inattentive, wrongfully claimed to have seen the attention check, we conducted three additional analyses to better understand the group of respondents who failed the attention check but reported to have noticed it. First, we compared bivariate correlations (Meade and Craig 2012) between the remaining items of the grid across (1) attentive and compliant (i.e., noticed and passed); (2) inattentive (i.e., did not notice and failed); and (3) noncompliant respondents (i.e., noticed and failed) (see Table A2 in the Online Appendix). While the correlations between substantially related items were high for all three groups, inattentive respondents also showed high correlations for unrelated item pairs, whereas attentive and compliant respondents did not show correlations between unrelated item pairs. Noncompliant respondents showed small correlations between unrelated item pairs, a pattern that was close to the attentive and compliant respondents but not zero.
Second, we compared alpha values across the three groups (1–3) (Carden et al. 2019), including all substantive items of the grid question. Since the grid consisted of items from different scales, we expected low alpha values for attentive and high alpha values for inattentive respondents. Confirming this expectation, alpha was the highest for inattentive respondents (α = 0.852) and the lowest for attentive and compliant respondents (α = 0.597). The α of 0.682 for noncompliant respondents was closer to the attentive group.
Third, we compared attitudes toward attention checks across the three groups (see Table A3). Noncompliant respondents held attitudes similar to inattentive respondents, whereas attentive and compliant respondents held more positive attitudes. Overall, these three analyses suggest that with respect to response quality noncompliant respondents are similar to attentive respondents, whereas with respect to attitudes toward attention checks, they are more similar to inattentive respondents.
To gain further insights, we computed a multinomial logistic regression model to explore whether noncompliant respondents differed from attentive and compliant, and inattentive respondents. This model allows us to investigate characteristics that impact compliance while also controlling for the fact that respondents could be inattentive. Following prior research (Gummer et al. 2021; Meade and Craig 2012), we included variables capturing respondents’ cognitive ability, task-related motivation, device of survey participation, and basic sociodemographic variables. We also included a sum score based on the attitudes toward attention checks. The results presented in Figure 1 (see Online Appendix Table A4 for the full model) show that respondents with higher levels of education were more likely to comply than respondents with lower levels of education, and younger respondents were less likely to comply with attention check instructions than older respondents. Similarly, respondents with more positive attitudes toward attention checks were more likely to comply with the instructions. The device used to answer the survey, the respondents’ gender, and their topic interest, as measured by their interest in politics, did not influence compliance. Yet, we found that noncompliant respondents differed from inattentive respondents in their interest in the survey’s topic. Explaining inattentiveness and noncompliance in Study 1. Note. The results are based on a multinomial logistic regression (0 = noticed and passed the check; 1 = did not notice the test “inattentiveness”; 2 = noticed and failed the test “noncompliance”). See Table A4 for the full model.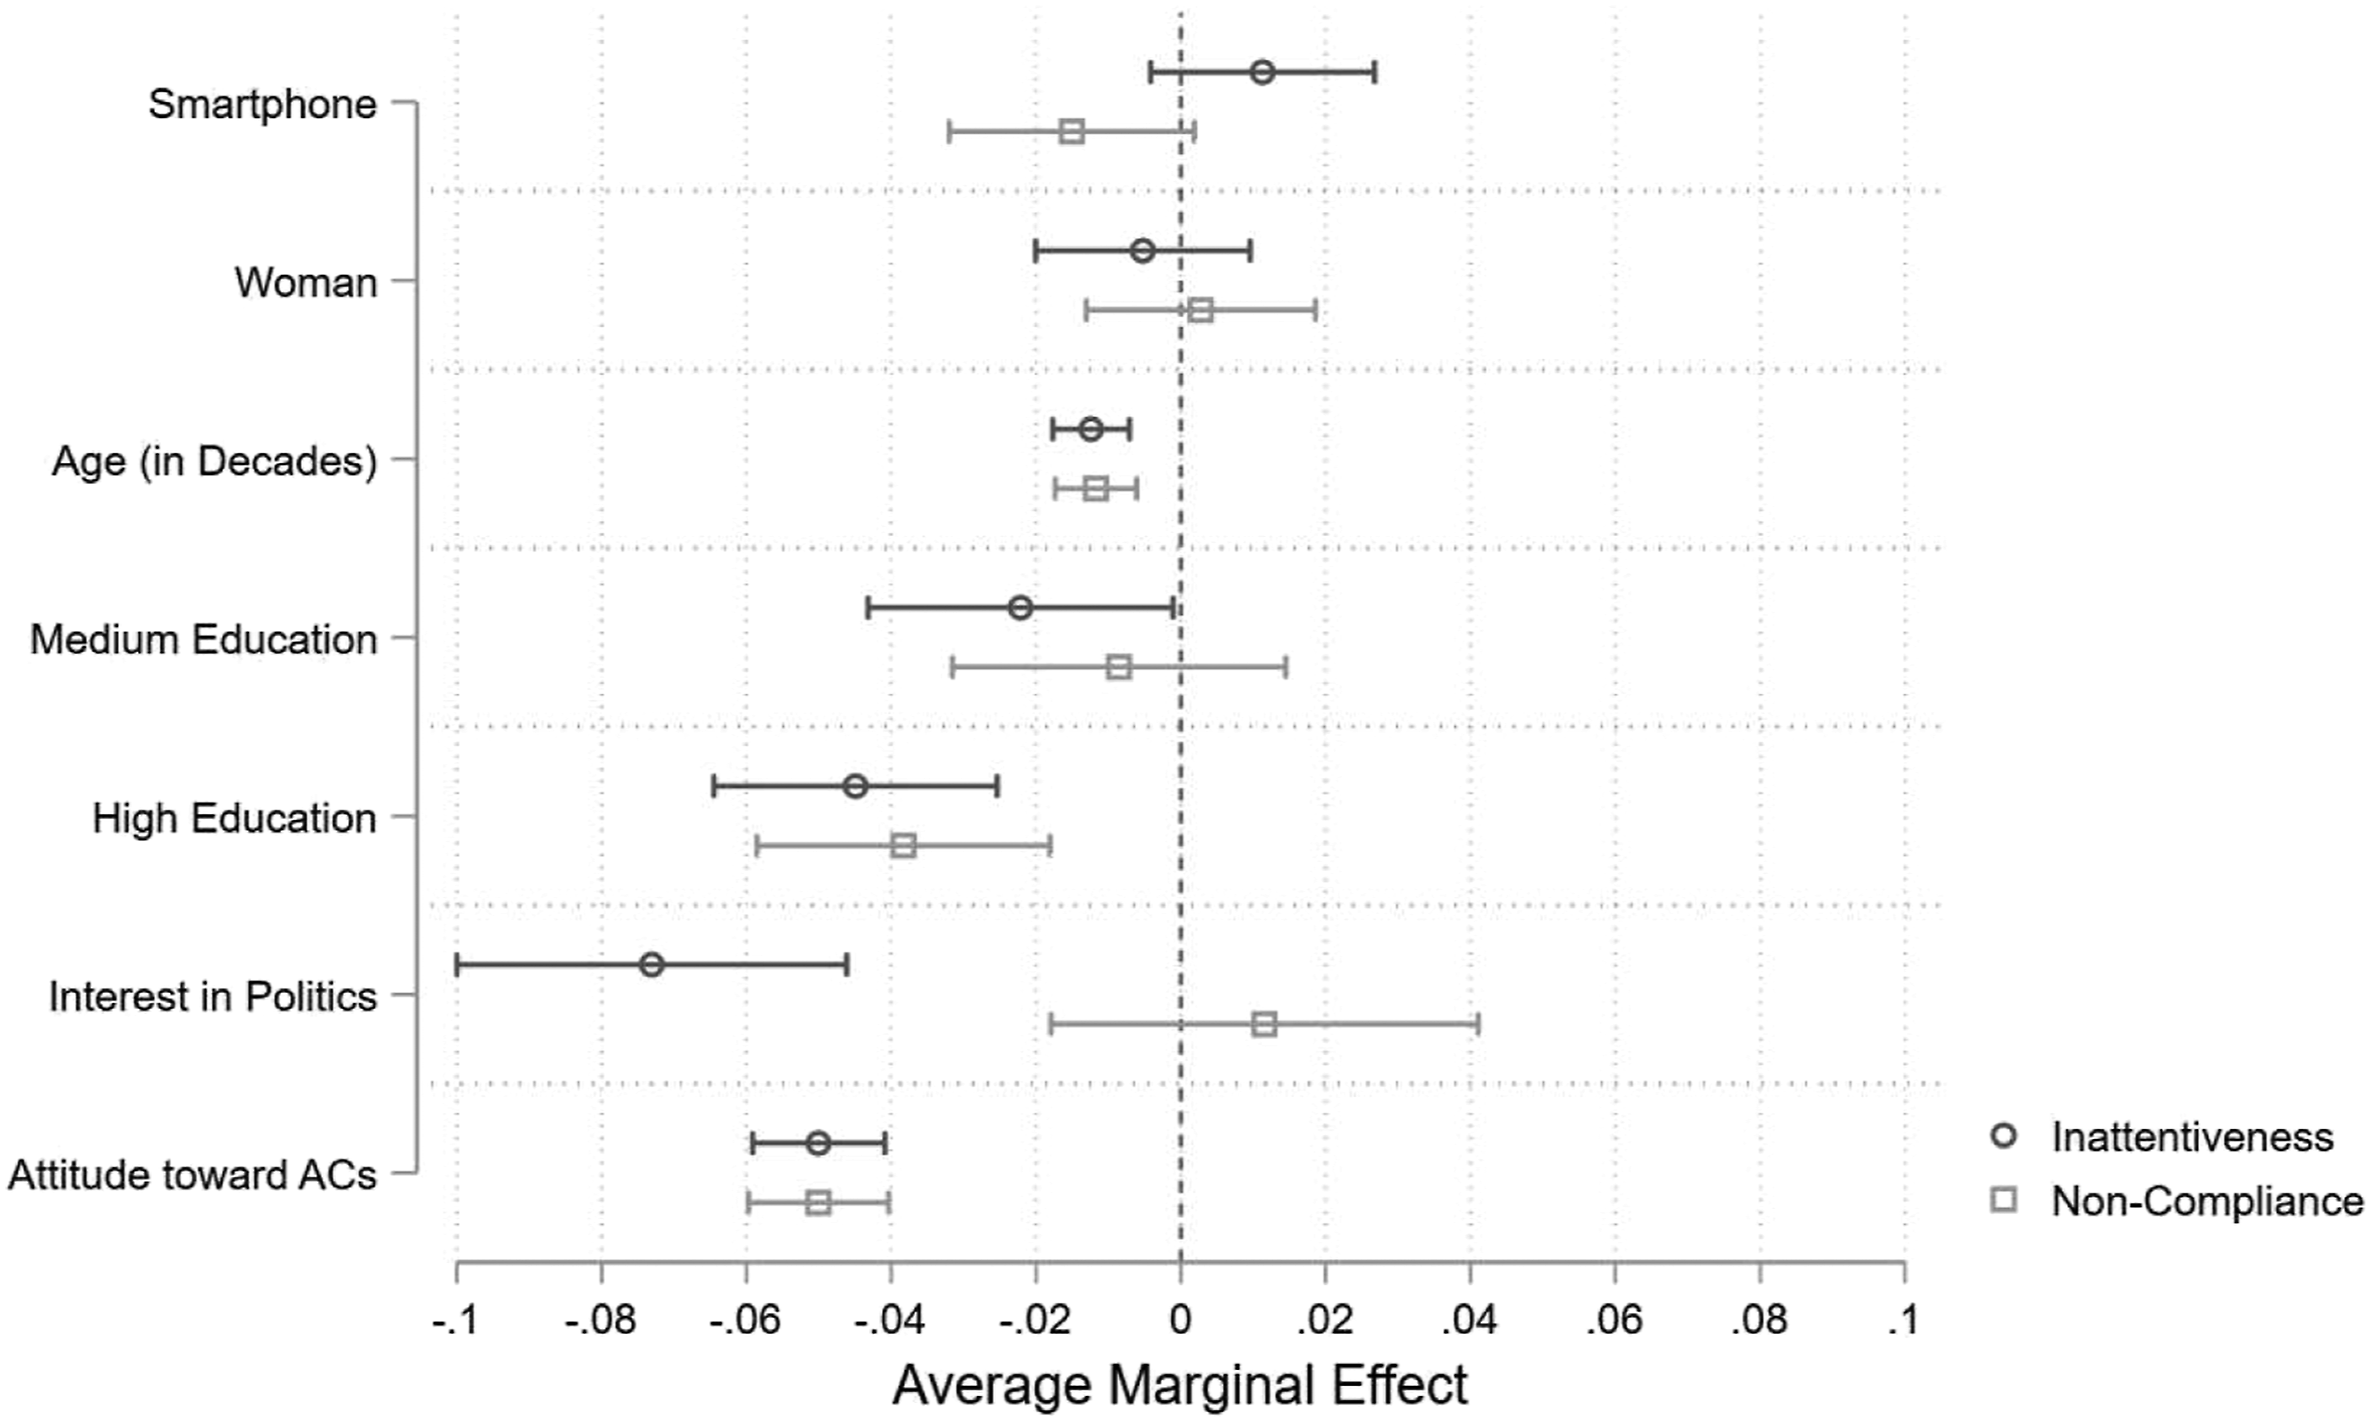
Summary
The results of our explorative first study suggested that a non-ignorable proportion of the respondents held negative attitudes toward attention checks. However, at the same time, many respondents reported that they understood the purpose behind attention checks and agreed with the statement that such tests might increase attention to survey questions. We further found that most respondents detected the attention check. Among those who detected the test, we found younger respondents and those with lower education to be more likely to not comply with the instructions. The proportion of respondents who failed the attention check, but we assume to be noncompliant, amounts to 61% of all inattentive respondents (6.6% of the full sample).
Study 2
Based on the findings of our first study, we set out to test the hypothesis that providing an explanation for why attention checks are implemented in a survey reduces the number of respondents not complying with instructions. Specifically, we utilized the finding from Study 1 where respondents reported to understand why attention check questions were used. Thus, in Study 2, we conducted an experiment in which we varied the wording of the attention check.
Data
We collected data via a German web survey on social networks, political attitudes, leisure time, and data sharing between July and August 2018. We used quotas matching the German population at that time with respect to gender, education, age, and region of residency for selecting respondents of a German nonprobability online access panel. The questionnaire was about 30 minutes long and the attention check experiment was placed in the first half of the questionnaire. More than three thousand respondents (in all 3,473) started the survey; 4.2% did not complete it, resulting in a final sample of 3,327 respondents. Less than two thousand (1,787) answered the survey on their PC and 1,550 on their smartphone. As in Study 1, respondents were experimentally assigned to complete the survey on the two devices. A mobile first design was used to display the questions, thus optimizing the survey for completion via smartphones.
Measures
Similar to Study 1, we used an IRI within an 8-item battery on attitudes toward the environment. 5 The IRI was placed between Item 4 and 5 of the battery. A 5-point agree–disagree scale was used for this entire battery (strongly agree, agree, neither nor, disagree, strongly disagree).
Respondents were randomly allocated to four experimental groups (
To gain additional insights on the impact of the wording of the attention check on respondents’ answers, the questionnaire included an additional IRI as an attention check. This IRI was implemented prior to the attention check that featured the wording experiment. This item was also included in an 8-item battery on attitudes toward the environment and the placement was randomized within the battery. Based on a 5-point agree–disagree response scale ranging from “strongly agree” to “strongly disagree,” respondents were instructed to “disagree.” We drew on this prior attention check to test whether respondents who did not comply with the instructions of an attention check could be motivated to comply in the next attention check if a proper explanation was given. 7
Results
We found that in the neutral version, 7.7% failed the attention check. In line with H1, the proportion of failed answers was smaller if a reason was given: 6.4% of the respondents failed the attention check in the “questionnaire test” condition, 6.1% in the “attention test” condition, and only 4.8% failed when the “bot test” reason was presented. However, only the difference between the neutral version and the “bot test” version was statistically significant (p = .029).
Predicting Passing or Failing an Attention Check in Study 2.
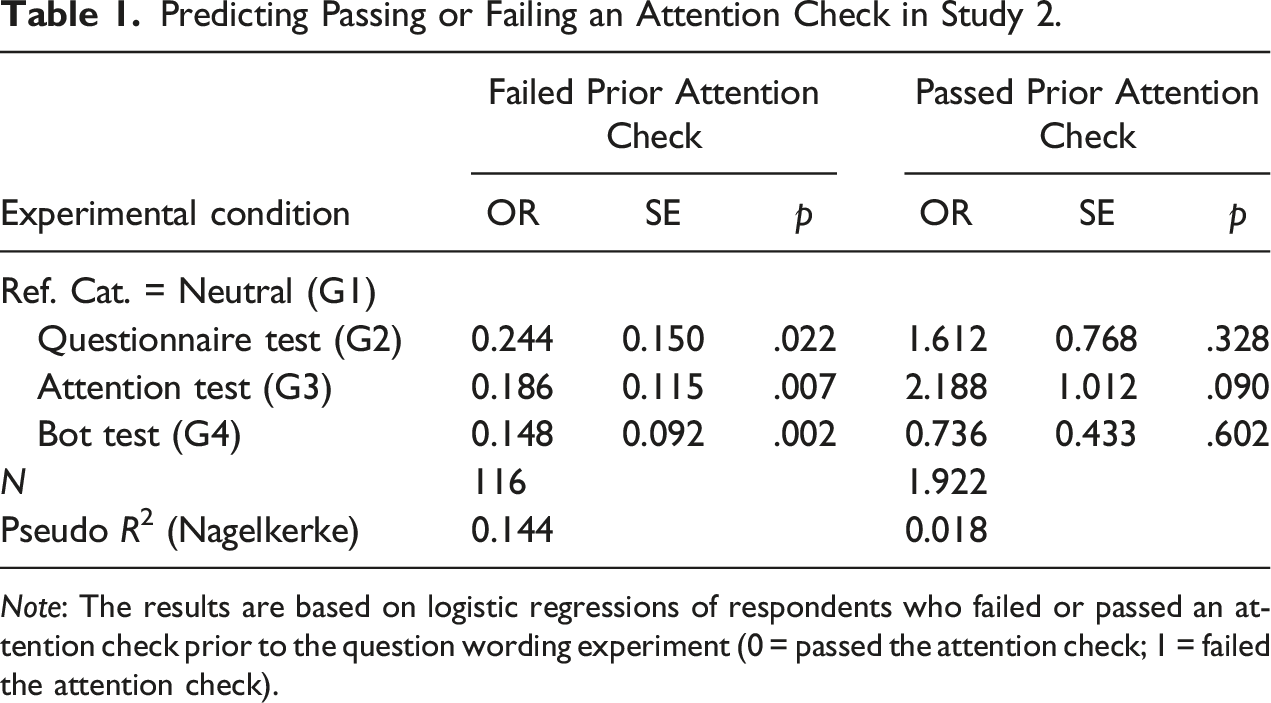
Note: The results are based on logistic regressions of respondents who failed or passed an attention check prior to the question wording experiment (0 = passed the attention check; 1 = failed the attention check).
Summary
The results of Study 2 provide further support that attention checks are likely to suffer from the issue of noncompliance. The results also suggest that the degree of noncompliance might be linked to how respondents comprehend the reasons behind conducting attention checks. Analyzing the entire sample, we found that particularly the externally phrased question wording (“bot test”) seemed to be comprehensible to respondents. For those respondents who failed a prior attention check (i.e., the high-risk group), providing any plausible explanation helped reduce the degree of noncompliance, whereas for those who passed a prior attention check (i.e., low-risk group), giving an explanation had no effect.
Discussion
In our two studies, we showed that noncompliance with attention checks can be a fundamental problem that should not be ignored when using these instruments. While most respondents understand why those tests are conducted, we found that a nonnegligible part of our sample held negative attitudes toward these tests. Our findings indicate that 61% of the respondents (6.6% of the sample) who failed the IRI attention check seem to have failed it on purpose. Even if some respondents may have wrongly reported having noticed the test, this finding is alarming as attention checks are intended to identify inattentiveness. Also note that another study likewise has reported substantial, albeit smaller shares of noncompliance (between 32% and 44% in Liu and Wronski 2018), which warrants further investigation in the magnitude of the issue. Having said that, noncompliance requires respondents to be attentive and to choose deliberately to not act in accordance with survey instructions. Altogether, our findings provide strong evidence that IRI attention checks are confounded by noncompliance.
The findings of this research have implications for practical research. Attention checks are commonly used to identify respondents that are then omitted from analyses or retrained to change their behavior (e.g., Berinsky et al. 2014; Jones et al. 2015; Oppenheimer et al. 2009). However, based on an IRI, we showed that attention checks can be confounded with noncompliance. Accordingly, when intervening based on attention checks, many respondents might be wrongly treated. In the case of retraining procedures, respondents may be asked to conduct taxing tasks. For instance, in one study, respondents were asked to repeatedly answer the same instructional manipulation check until they passed it (Oppenheimer et al. 2009). Attentiveness measures appear even more problematic when considering our finding that noncompliant respondents seem to be a group of respondents that differs in certain characteristics, both from inattentive respondents and attentive but compliant respondents. Omitting these cases without further exploration may bias the sample. Therefore, when assessing response quality, we recommend relying on multiple data quality indicators to identify careless respondents, especially when making invasive decisions such as omitting cases from substantive analyses (see also Curran 2016).
Our research adds to the literature on attention checks as it indicates that providing a comprehensive reason for the attention checks can reduce noncompliance. In line with previous research on forewarnings (e.g., Berinsky et al. 2016; Clifford and Jerit 2015; Huang et al. 2012; Liu and Wronski 2018), we found that an explanation focusing on external reasons (“bot test”) seems to increase compliance for the entire sample. This issue warrants further research to develop better ways of explaining attention checks to respondents.
The present study is not without limitations and holds opportunities for future research. First, our two studies were implemented in web surveys that drew on nonprobability samples. While the use of attention checks seems especially frequent when working with online panels or other convenience samples, replication with a probability-based sample is needed. Second, with respect to the measurement of noncompliance, we perceive our non-experimental measure of self-reported compliance as a starting point for future studies that may be able to identify the exact biases due to confounded attention checks. For example, future studies might benefit from applying eye-tracking methodology to gain insights into how respondents process attention checks. Third, we focused on investigating the potentials of question wording to motivate respondents to comply with an attention check. While our approach seemed to successfully have impacted noncompliant respondents, alternative approaches should be tested. Fourth, our study tested the issue of noncompliance only for instructed response items and there are many other types of attention checks. Comparing noncompliance between these different types seems sensible. For example, Curran and Hauser (2019) reported bogus items to produce less false positives (between 0% and 3%) than instructed response items in a lab setting (between 2% and 17%). Fifth, our study did not counterbalance the order of the attention check and the perception of attention check items. We invite future research to remedy this shortcoming.
Supplemental Material
Supplemental Material—The Issue of Noncompliance in Attention Check Questions: False Positives in Instructed Response Items
Supplemental Material for The The Issue of Noncompliance in Attention Check Questions: False Positives in Instructed Response Items by Henning Silber, Joss Roßmann, and Tobias Gummer in Field Methods The so-called environmental crisis is greatly exaggerated. The balance of nature is very delicate and easily disturbed. Despite our special abilities, we humans are still subject to the laws of nature.
Footnotes
Declaration of Conflicting Interests
The author(s) declared no potential conflicts of interest with respect to the research, authorship, and/or publication of this article.
Funding
The author(s) received no financial support for the research, authorship, and/or publication of this article.
Supplemental Material
Supplemental material for this article is available online.
Notes
References
Supplementary Material
Please find the following supplemental material available below.
For Open Access articles published under a Creative Commons License, all supplemental material carries the same license as the article it is associated with.
For non-Open Access articles published, all supplemental material carries a non-exclusive license, and permission requests for re-use of supplemental material or any part of supplemental material shall be sent directly to the copyright owner as specified in the copyright notice associated with the article.