
Abstract
Frequency of behaviors or amounts of variables of interest are essential topics in many surveys. The use of heuristics might cause rounded answers, resulting in the increased occurrence of end-digits (called heaping or digit-preference). For web surveys (or CASI), we propose using a conditional prompt as input validation if digits indicating heaping are entered. We report an experiment, where respondents in an online access panel (n = 2,590) were randomly assigned to one of three groups: (1) no input validation; (2) conditional input validation if rounding was presumed; and (3) input validation every time a numerical value was entered. Conditional input validation reduces heaping for variables with high proportions of heaped values. Unconditional input validation seems to be less effective.
Introduction
Blair and Burton (1986, 1987) were the first to extensively review the problems associated with asking for the frequency of certain behaviors from respondents in an open-ended question. Respondents tend not to answer such questions in as much detail as intended by researchers. Instead, the answers often are multiples of certain numbers, mostly five or 10. Such behavior on the part of the respondent is termed heaping (also called digit-preference).
Vaske and Beaman (2006) provided an overview of heaping in surveys and its implications. For instance, response heaps do not only occur at 0 and 5, but potentially at any number and gaps between response heaps increase with a growing range of responses (Vaske and Beaman 2006:286–91). An example of the occurrence of heaping has been recognized as a problem in demography (evident in census counts), where questions asking for a person’s age often yield nonuniform distributed terminal digits (Hobbs 2004). Furthermore, Wang and Heitjan (2008) showed that heaping could lead to biased descriptive statistics by distorting the underlying distribution, and it can affect inferences.
Heaping might be seen as the consequence of not counting each and every occurrence of the behavior to be reported. Problems due to heaping can be approached in two ways: Either by preventing during data collection or correcting already available data. Most of the literature is dedicated to attempts for correcting available data (see, e.g., Allen et al. 2017; Bar and Lillard 2012; Crawford et al. 2015; Wolff and Augustin 2003; Zinn and Würbach 2015). For example, Zinn and Würbach (2015) used a zero-inflated log-normal distribution for self-reported income. In contrast, attempts at preventing heaping during data collection have been rare. One of the few examples is Becker and Diop-Sidibé (2003), who proposed using a calendar to reduce heaping when recording durations.
Tourangeau et al. (2004:235) list three causes for rounding: (1) imprecise encoding of the information in memory; (2) indeterminacy in the underlying quantities (e.g., the actual price of a house is unknown until it is being sold); and (3) the burden of retrieving numerous specific pieces of information. 1 From the perspective of a survey designer, only the last mechanism can be used to reduce heaping since the other two are properties of the memory encoding or correspond to the true state of nature. In some contexts, the subjectively perceived burden can be reduced by increasing the motivation of respondents, for example, by emphasizing the importance of the answer (Cannell et al. 1981:404). Therefore, to increase motivation, prompts have been used, for example, to reduce nonresponse (DeRouvray and Couper 2002) or improve the quality of the given answer (Conrad et al. 2005). 2
This article reports on a randomized experiment, where two different input validation prompts are used to reduce heaping during data collection in a general population web survey (n = 2,590). Respondents are either (1) not prompted; (2) prompted if rounding was detected; or (3) prompted every time a numerical answer was given. The conditional feedback on rounding behavior could be seen as an external motivation to increase the cognitive effort. Therefore, an input validation prompt should reduce heaping.
Methods
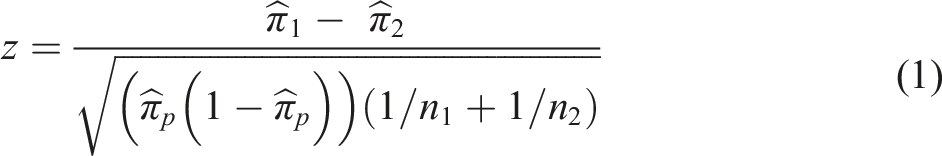
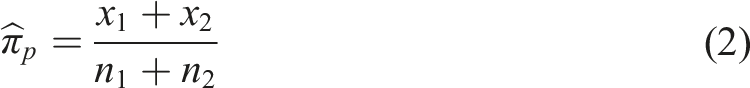
The proportions of rounded answers are compared between groups using a test for differences in proportions. The test statistic is
The statistical effect size for the difference between two proportions (p1 and p2) is usually evaluated using Cohen’s h which is defined as (Gleser and Olkin 2009:364)

Data
Results reported here are based on an experiment using all panel members of an academically managed non-probability online panel (WiSo Panel, Göritz 2014). As with many other non-probability online surveys (Callegaro et al. 2015), this panel has used different online recruitment methods such as banner ads, search engines, online networks, and newsletters. In addition, panel members are encouraged to recruit further panel members (Crutzen and Göritz 2012:196). Of course, non-probability samples should not be used for point estimates for a population (Baker et al. 2010), but estimating experimental effects is widely considered as legitimate within bounds given by the heterogeneity of the sampled population (Kohler et al. 2019:166).
Educational Level in the Sample (Unweighted, in Percent). Census Data for People above 14 Years of Age. The Sample Contains a Larger Proportion of Highly Educated People than the General Public.
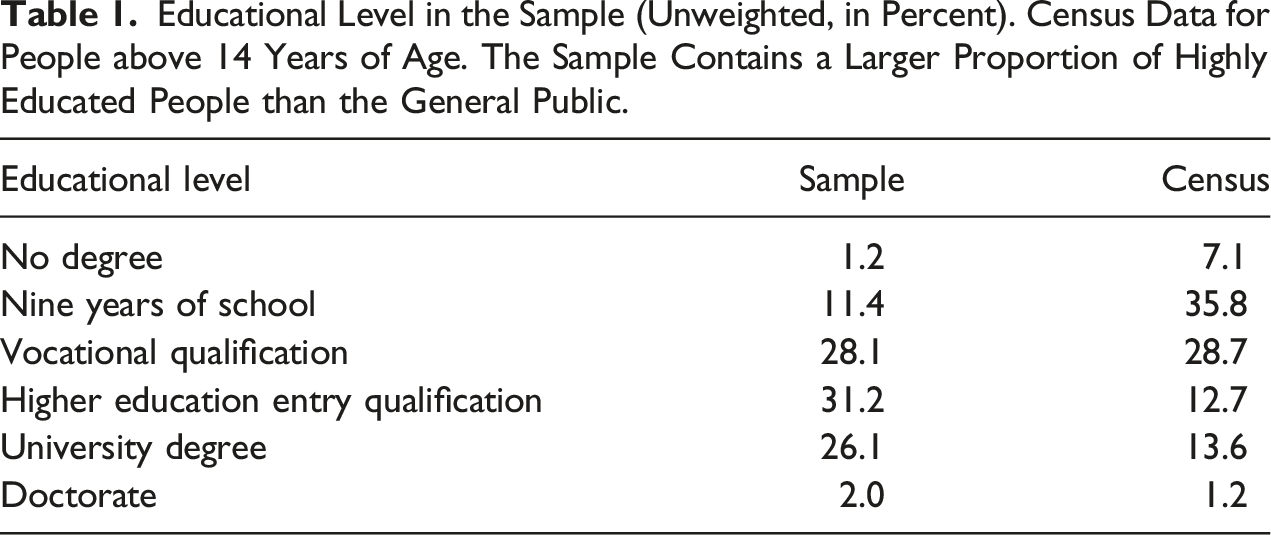
The survey contained questions on: (1) the number of alcoholic beverages per week, (2) the number of cigarettes smoked per day, (3) kilometers driven by car per week, (4) expenses in euros for clothing in the previous month, (5) the number of orders of electronic items in the previous 12 months.
4
The questions were presented in random order. The respondents were (disproportionately) randomly assigned to one of three groups: (1) no input validation (n = 653, ≈25%), (2) conditional input validation, that is, a prompt whenever an answer given to a question was probably rounded (n = 1,293, ≈50%), (3) input validation with a prompt for every question (unconditional input validation) if a number larger than zero was entered (n = 644, ≈25%).
For the conditional input validation, an answer was seen as rounded if it was a multiple of five for alcohol consumption, cigarettes, and order of electronic items. Additionally, for alcohol consumption, a weekly reoccurrence (multiple of seven) and for order of electronic items a monthly reoccurrence (multiple of 12) was considered a rounded answer. For kilometers driven and clothing expenses, an answer was seen as rounded if it was a multiple of 50.
The input validation prompt read: “If you guessed this answer, please can you give a precise answer” (translated from German). 5
After editing for incomplete, zero, and implausible responses, 2,590 cases with 1,594 responses for alcohol consumption, 775 responses for cigarette counts, 2,190 responses for kilometers driven by car, 1,987 responses for clothing expenses, and 1,411 responses for orders of electronic items remained. 6
Results
Proportions of Responses of Multiples for Each Input Validation Group: Conditional (C), Unconditional (UC), No Input Validation (No). Conditional Input Validation Shows Lower Proportions of Heaped Responses than No, as Well as Unconditional Input Validation.
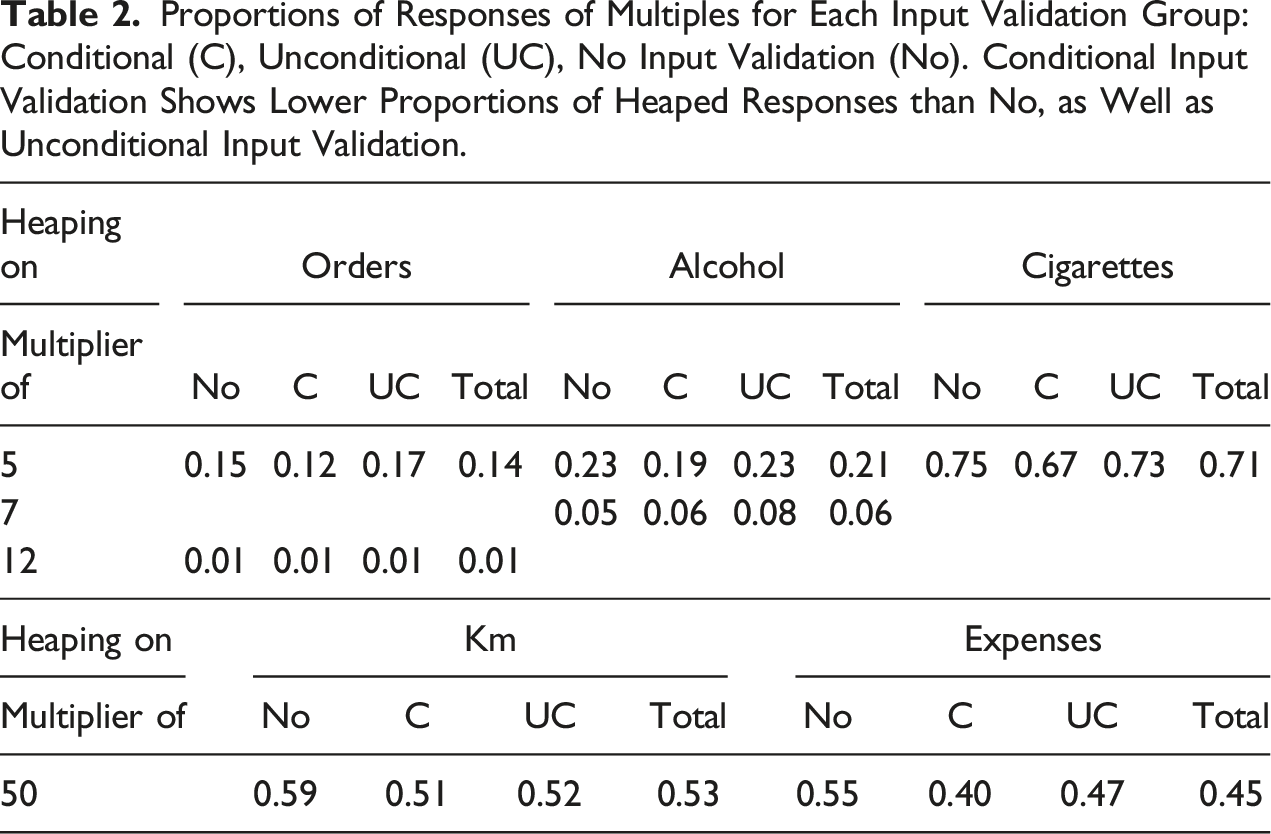
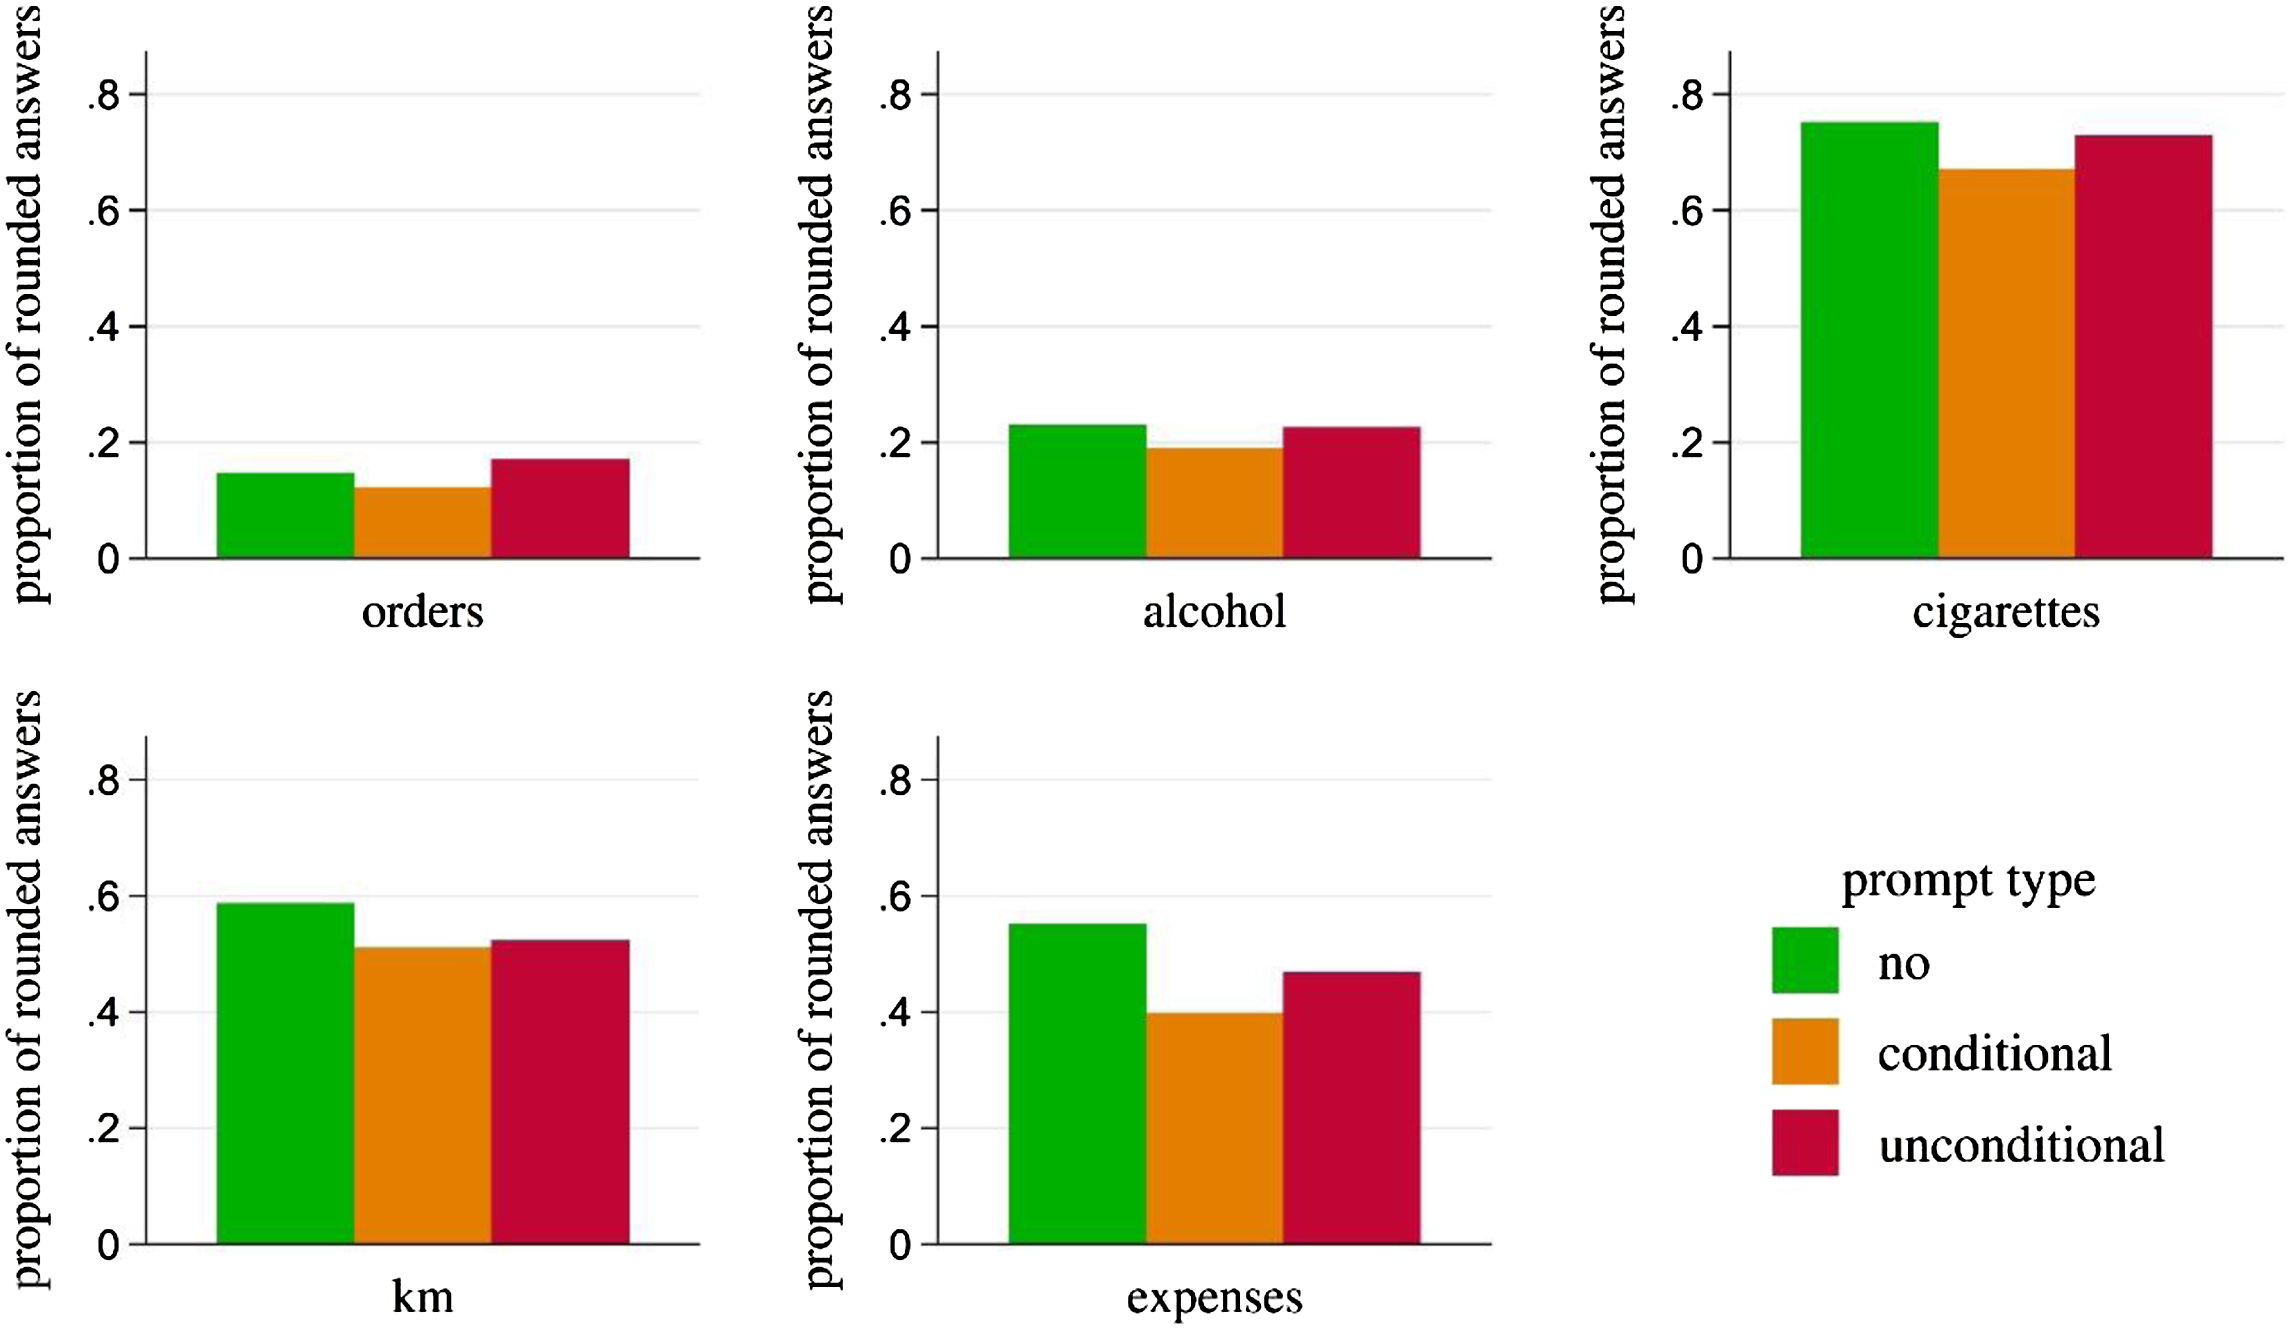
Proportions of rounded answers (five for electronic orders, alcoholic beverages, and cigarettes; 50 for driven kilometers, and expenses). Conditional input validation always yields lower proportions than no or unconditional input validation.
The experimental results (see Table 2) correspond to the theoretically expected order of the amount of heaping. For four variables of interest, the largest proportion of rounded answers is found in the group with no input validation (the exception is electronic orders, where the largest proportion is found in the unconditional prompting group).
For all five variables, a conditional input validation resulted in lower proportions of rounded answers than in the other two groups. In contrast, the unconditional reminder resulted for three variables in a decrease. Furthermore, on all five variables, the decrease is smaller for unconditional than the decrease for the conditional prompt.
Z Statistics: Pairwise Comparison of Proportions of Rounded Answers of Experimental Groups (Unweighted; One-sided). Variables Are Ordered According to Median Values for all Respondents. All Observed Differences Correspond to Theoretical Expectations: Prompting Reduces Heaping, Larger Reductions Are Observed for Conditional Prompting. for Both Experimental Conditions, the Size of the Effect Increases from Top to Bottom (i.e., with Increasing Median Value of the Variable).
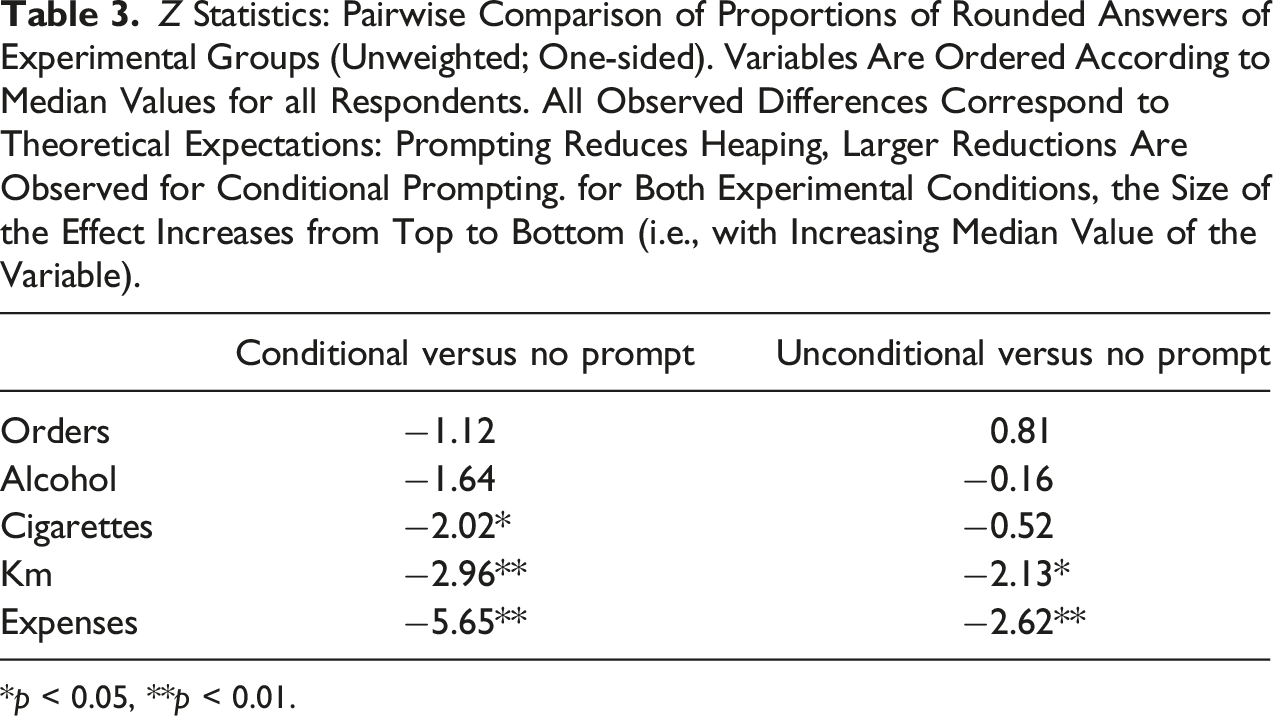
*p < 0.05, **p < 0.01.
For three variables (cigarettes, kilometers, and expenses), the decrease in heaping was significant for the conditional prompt. For the unconditional prompt, the decrease was significant for two variables (kilometers and expenses). As can be seen in Figure 1, the three variables that showed a significant reduction in heaping for conditional prompts are those variables with the largest amount of heaping in all experimental groups. 7
The literature repeatedly reported more heaping with increasing magnitude of the response (Vaske and Beaman 2006:291). Due to the high skewness of the answers to many behavioral frequency questions, we considered the median response given as a better indicator for the magnitude than the range or the maximum. Therefore, we ordered the variables according to the median value of the variable of interest (disregarding experimental groups in the computation of the median). For both experimental conditions, the size of the experimental effect increases with an increasing median value of the variable (note the decreasing value of the test statistic in Table 3 from top to bottom in both columns). Thus, prompting seems to have a larger effect if higher values of response variables are to be expected.
Effect Size (Cohen’s h) for the Difference between Experimental Groups and Control Group.
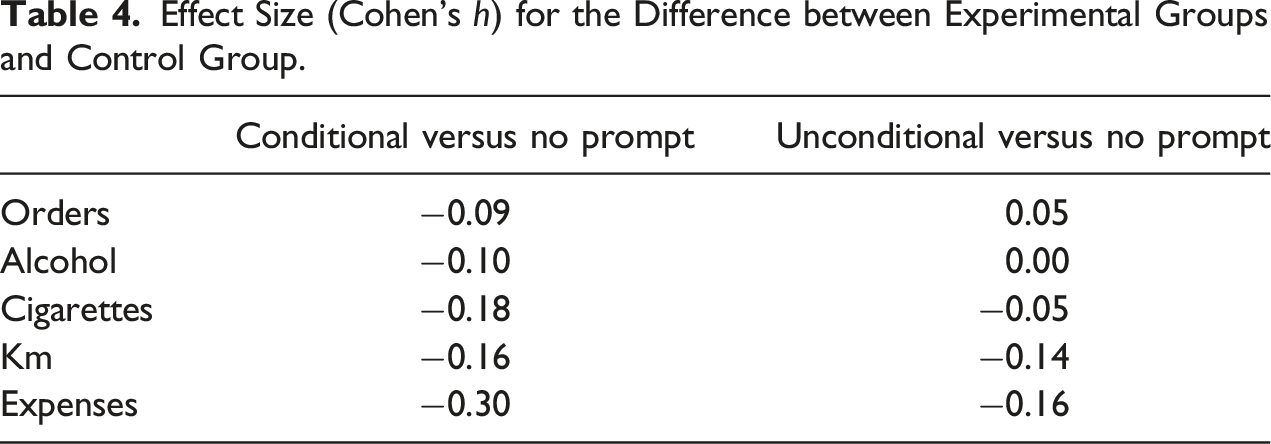
In summary, for all variables, the conditional prompt resulted in a higher amount of decrease than the unconditional prompt, and the difference between both prompts increases with the magnitude of the response. Therefore, given the small additional costs due to the conditional prompt, we would recommend using conditional prompts in behavioral frequency questions in web surveys.
Discussion
Behavioral frequency questions and questions asking for numerical estimates tend to produce multi-modal frequency distributions due to heaping. Therefore, statistical modeling might be more difficult and might even result in biased estimates (Wang and Heitjan 2008).
Although most of the literature focuses on correction methods after the data collection, here we proposed a method to reduce heaping during the data collection. The conditional prompt after presumed rounded answers significantly reduced the amount of heaping in all three variables with severe rounding. Conditional input validation reduces heaping for variables with high proportions of heaped values. Unconditional input validation seems to be less effective.
This diminishing result of repetitive and unreliable warnings and alarms might be similar to the long-known “cry wolf” effect in engineering alarm systems (Bliss et al. 1995; Breznitz 1984). If the goal of the alarm is perceived as important and the alarm has a high positive predictive value, the cry wolf effect is not to be expected. However, if neither iss present, the cry wolf effect will be seen (Johnson et al. 2017). Therefore, the success of the input validation will depend on whether the respondent task was perceived as important and if the prompt is perceived as legitimate. Later research should examine if this mechanism is actually the cause of the observed differences in the effectiveness of the prompts.
However, prompting seems to reduce heaping and larger reductions have been observed for conditional prompting. Therefore, a prompt motivated by a presumed rounded answer might be the best design option for reducing heaping in numerical answers to behavioral frequency questions.
The results reported here are based on behavioral frequency questions. If this effect also applies to other questions that might lead to rounding (Holbrook et al. 2014) such as personal characteristic questions, questions about age at the time of an event, questions about percentages, or feeling-thermometers remains to be studied.
A limitation of this between-subjects experiment is due to the software used for implementation. The program does not allow the storage of the initial answers after a changed response following a prompt. In further research, the initial answer should be recorded and compared to later corrections. In addition, at least a subsample of respondents correcting their previous answer should receive a follow-up question if the updated answer is considered an accurate response or a measure to prevent further prompts. A further limitation of this study is common in research on heaping: The lack of external validation data, particularly for behavioral frequency questions, makes the evaluation of measures to reduce heaping difficult. The mentioned follow-up question might partially compensate for the absence of external validation data to evaluate the correctness of the given response. Furthermore, in a sequence of numerical questions, the optimal time spacing of conditional prompts needs to be determined.
Another limitation is due to the non-probability sampling. However, most web surveys (Baker et al. 2010) are based on non-probability sampling methods. The panel used here holds participants from all walks of life who were recruited from a variety of sources. Although the treatment effect in a general population survey might be different (Kohler et al. 2019), it is unlikely that the effect will not be detected in a general population survey. Whether a given non-probability sample is fit for the purpose of the study depends on the purpose and the sampling methods used (Baker et al. 2013). The statistical conditions necessary for the generalization of experimental results are described by Kohler et al. (2019). An overestimated treatment effect would be due to a high correlation between the selection probability for the web survey and the size of the motivational effect of the prompt. Since we found no effects of education, gender, and age on the size of the effect, we see no evidence for an overestimation due to non-probability sampling. Therefore, we consider the sample as fit for the purpose of this study.
Finally, replications of the experiment in other general population surveys seem to be necessary.
Footnotes
Acknowledgments
We thank the four anonymous reviewers for the detailed reviews and helpful comments to improve this article.
Declaration of Conflicting Interests
The authors declared no potential conflicts of interest with respect to the research, authorship, and/or publication of this article.
Funding
The authors received no financial support for the research, authorship, and/or publication of this article.