



Abstract
Despite the widespread use of examples in survey questions, very few studies have examined their impact on survey responses, and the evidence is mainly based on data collected in the United States using questionnaires in English. This study builds on previous research by examining the effects of providing examples using data from a cross-national probability-based web panel implemented in Estonia (n = 730), Great Britain (n = 685), and Slovenia (n = 529) during Round 8 of the European Social Survey (2017/18). Respondents were randomly assigned a survey question measuring confidence in social media using Facebook and Twitter as examples, or another condition in which no examples were offered. The results show that confidence in social media was significantly lower in the example condition, although the effect size was small. Confidence in social media varied across countries, and the effect of providing examples was heterogeneous across countries and education levels. The implications of these findings are discussed.
Introduction
Optimally answering survey questions often demands substantial cognitive effort from respondents. They are required to (1) interpret the intended meaning of the question, instructions, and response options; (2) retrieve relevant information from memory; (3) integrate the information into a judgment; and (4) map the judgment onto the response options provided to them (Tourangeau 2017; Tourangeau et al. 2000). Multiple strategies are implemented to facilitate this process, from improving the design of the questionnaire (e.g., shortening reference periods to reduce recall biases) to planning the administration (e.g., randomizing the order in which response options are shown to minimize response-order effects) (Dillman et al. 2014). One of the strategies used to assist respondents in the response process is the use of clarifications features, such as providing examples, in survey questions.
Providing examples mostly affects the processes involved in comprehension and retrieval. To comprehend a question, respondents must understand their meaning and scope in a way that ensures the item is measuring the intended concept. Questions that are conceptually or linguistically complex are more likely to produce greater comprehension difficulties (Holbrook et al. 2006; Lenzner et al. 2011; Olson et al. 2019). In surveys involving multiple populations, comprehension difficulties might differ across groups, introducing different levels of measurement error that threaten the comparability of the findings (Aizpurua 2020; Harkness et al. 2010; Smith 2018). Some behavior-coding studies conducted in the United States have shown that interviews conducted in languages other than English result in more requests for clarification (Harkness et al. 2010; Kapousouz et al. 2020). Also in the United States, it has been found that, when interviews are conducted in English, minority populations tend to express more comprehension difficulties than non-Hispanic Whites (Johnson et al. 2006). These findings warrant caution in the use of examples when surveying multiple populations, as they could increase comparability error if processed differently across cultural or linguistic groups.
Examples, however, can help clarify the scope or the specificity of a question, minimizing comprehension difficulties. This might be particularly helpful in self-administered surveys where interviewers are not available to provide clarification, minimizing the risk of respondents misinterpreting the intent meaning of the question, which increases measurement error. An early study from the U.S. Census Bureau comparing two questions measuring ethnicity revealed that offering examples of nationalities (e.g., Colombian, Salvadoran, Spaniard) resulted in significantly more respondents providing specific nationalities as a response than the version using general descriptors (i.e., Hispanic/Latino) (Martin 2002). Other studies examining the impact of question characteristics, however, have found that including definitions in the question stem has little impact on response behaviors (Olson et al. 2019). In a telephone survey, Olson and colleagues (2019) found that providing examples was unrelated with non-substantive responses or requests for clarification from respondents, although they increased the risk of un-codable answers.
Examples can also influence the retrieval stage by stimulating recall, serving as reminders of instances that might, otherwise, be overlooked. In a study by Tourangeau and colleagues, it was found that respondents who received examples of food categories (i.e., dairy, poultry, vegetables, and grain) reported consuming more servings than those who did not receive examples (Tourangeau et al. 2014). Another study conducted with university applicants in Germany provided evidence that adding a wide range of examples to four questions resulted in higher reports of physical impairment symptoms (e.g., headaches), sources of information about college (e.g., websites), and perceived challenges associated with college (e.g., grades) than the same questions with no examples (Metzler et al. 2015).
The risk, however, is that examples introduce bias by enhancing recall for the example items while reducing recall for non-examples. Evidence of this phenomenon, referred to as the “focusing hypothesis,” was obtained in a study analyzing the impact of providing examples on a question about multitasking. While providing examples did not increase the number of secondary activities reported by respondents, it switched the focus to the activities used as examples. Respondents who received example activities were more likely to report them, while those who did not receive examples more frequently listed activities outside of the examples. This meant there was no difference in the average number of activities mentioned, but significant differences in the specific activities reported by the two groups (Aizpurua et al. 2021).
In this regard, excessive focus on examples represents a form of satisficing, as it implies spending minimum effort to provide a satisfactory response. Similar to other forms of weak satisficing, such as response-order effects or acquiescence, respondents would execute the four stages of processing (i.e., comprehension, retrieval, mapping, and retrieving), but engaging in them (particularly the retrieval stage) in a superficial manner. According to the theory of satisficing, factors such as cognitive ability and motivation would encourage engagement in optimal behavior while task difficulty would promote satisficing (Krosnick 1991).
Present Study
Despite examples being included in survey questions, few studies have analyzed their impact on responses. This body of research suggests that respondents are generally more likely to select the examples which are provided to them both in open- and close-ended questions (Aizpurua et al. 2021; Tourangeau et al. 2014, 2016). One of the weaknesses of previous research is that they are mostly derived from studies conducted in the United States, with questionnaires administered in English. The extent to which the findings from those studies replicate in places outside of the United States and languages other than English is unknown. Although some of these prior studies have been conducted using web surveys (Tourangeau et al. 2014, 2016), their findings are based on non-random samples, limiting the generalizability of the results.
We contribute to this literature by analyzing the results of a randomized experiment examining the impact of providing examples on confidence in social media. This experiment was included in the first wave of a cross-national, probability-based panel implemented in three European countries (Villar et al. 2018). Based on previous research, the following hypotheses were proposed:
Levels of confidence in social media will differ depending on whether the question includes examples.
The number and specific social media platforms considered by re-spondents will differ depending on whether the question includes examples. We will find support for the “focusing hypothesis” if examples do not result in respondents recalling more social media platforms, but rather shifting their focus to the instances mentioned to them. Conversely, finding that respondents in the example condition select a greater number of social platforms would signal that using examples assists by triggering the retrieval process more generally and that respondents use the examples as non-exhaustive cues.
Providing examples will have heterogeneous effects across educa-tional levels and countries. Based on the theory of satisficing (Krosnick 1991; Roberts et al. 2019), we would expect examples to have stronger effects among respondents with lower education levels (proxy for cognitive ability; see Roberts et al. 2019). Considering the existence of large differences in Internet penetration and social media use among Estonia, Slovenia, and the United Kingdom at the time of data collection, we anticipated differences in the effect of the examples across these countries. The United Kingdom had the highest proportion of Internet and social media users (95% and 71% in the last 12 months, respectively), followed by Estonia (with figures similar to the average in the EU28 at 89% and 60%, respectively), and Slovenia (80% and 45%) (Eurostat 2017a, 2017b).
Methods
Data
Key Characteristics of ESS R8 and CRONOS.
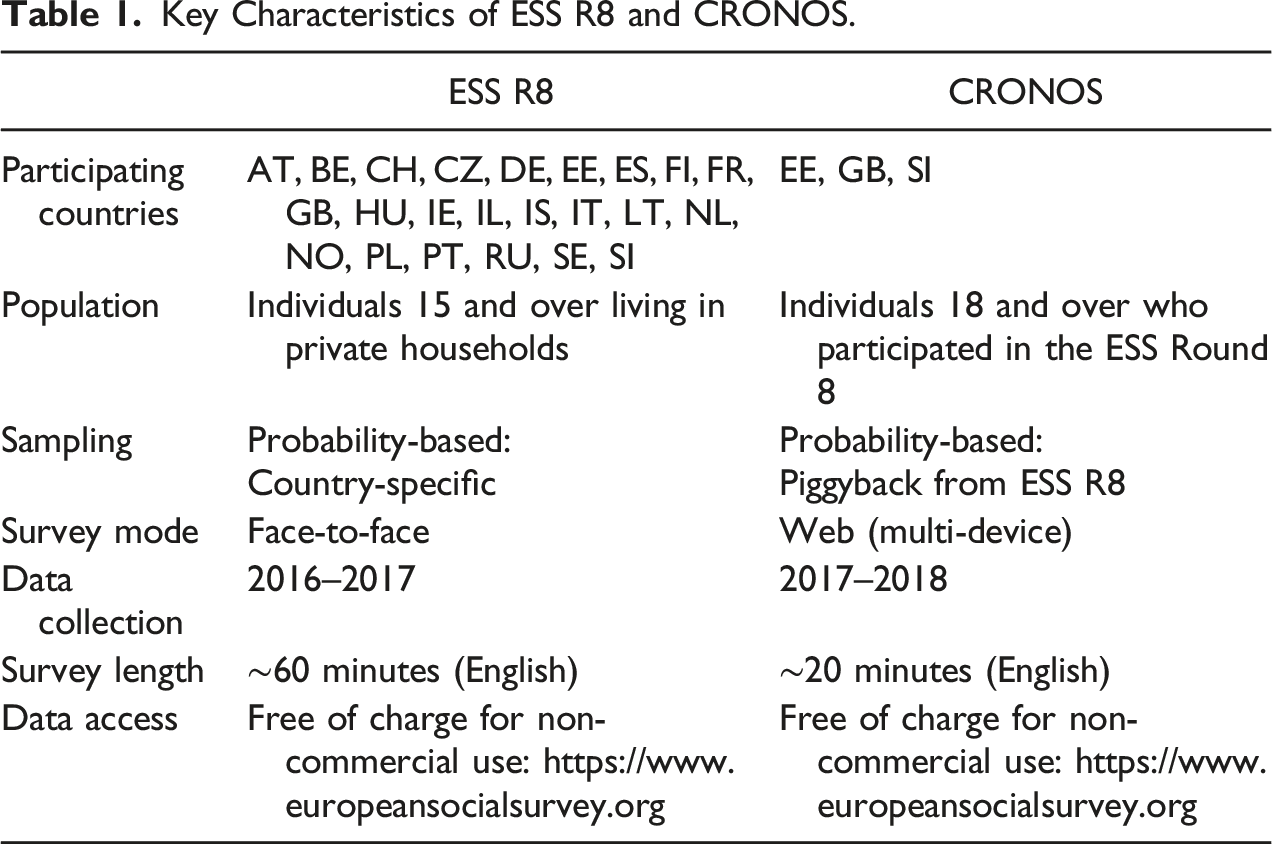
The cross-national web panel was the first attempt to develop a cross-national, probability-based panel following an input-harmonized approach from the recruitment to data processing stages. In total, six waves of data were collected between February 2017 and February 2018. Surveys took approximately 20 minutes to complete and were administered in English (Great Britain), Slovenian (Slovenia), Estonian and Russian (Estonia).
In this article, we analyze data from individuals who participated in the first wave of CRONOS, making use of their corresponding information from the main ESS. All eligible respondents were provided with 5€/£5 unconditional incentives each wave. 1 Response rates 2 ranged from 15% in Great Britain to 25% in Estonia (Slovenia = 23%), while participation rates 3 were all above 50% (56% in Great Britain, 67% in Slovenia, and 78% in Estonia) (Villar et al. 2018).
Experimental Design and Measures
Wave 1 of CRONOS comprised 99 items adapted from the European Values Study. Several randomized experiments were part of wave 1, including the one analyzed in this article. 4 This between-subjects experiment was embedded in a question assessing levels of confidence in social media. Respondents were randomly assigned to a condition in which “Facebook and Twitter” were used as examples, or a condition in which no examples were provided. The question (“How much confidence do you have in social media [like Facebook and Twitter”]) was measured using a four-point, unipolar scale ranging from “a great deal” to “none at all.”
As expected, there were no differences in the proportion of respondents allocated to each condition by country (Examples condition: 50.5% EE, 49.9% GB, 49.0% SI,
To increase the precision of the estimates, several covariates were incorporated in the multivariate models, including age (measured in years and then recoded into age groups), sex (male, female), level of education (output harmonized into seven categories, which were grouped distinguishing among lower and upper secondary education and tertiary education), and Internet usage (never, occasionally/a few times a week, most days, and every day). The wording of all questions is provided in the Appendix. These models are fully consistent with those estimated with no covariates, which are available in the Appendix (Table A2)
Analytical Strategy
Our analysis was organized in three steps. We first examined whether providing examples influenced levels of confidence in social media by comparing the responses between the groups using chi-square tests. The magnitude of the differences was assessed using Cramer’s V. Then, we investigated whether the platforms considered to assess confidence in social media varied by experimental condition by using chi-square tests and computing effect sizes (Cramer’s V). To test whether providing examples improved recall, a count variable was created by summing the number of platforms selected by respondents (range = 0–15). Differences in the average number of platforms between the groups were explored using an independent-samples t-test.
To further analyze the impact of the examples on social media confidence, ordinal regression models were estimated. Confidence in social media was regressed on the experimental condition while controlling for the country where the survey was fielded, the age, sex, and education level of the respondent, and their frequency of Internet use. There was no indication of multicollinearity in the model (VIF <1.50). Finally, to assess whether the effect of the examples was moderated by the respondents’ education level or country, two additional models were estimated including interaction terms between the experimental condition and these two variables. All analyses were computed using weighted data, adjusting the post-stratified ESS R8 design weight for nonresponse at wave 1 of CRONOS.
Results
Description of the Sample
Sample Composition (Weighted Data).

Note: M = mean; SD = standard deviation. Unweighted number of observations and weighted proportions are displayed. Internet usage was measured before being recruited to CRONOS.
Respondents’ ages ranged from 18 to 91 (M = 48.09, SD = 17.86), and roughly half of the sample were females (50.8%) (see Table 2). In terms of education levels, approximately half of respondents (50.7%) had completed upper secondary and post-secondary education (ISCED 6 levels 3, 4, and 5), with the remainder having tertiary education (27.2%, ISCED levels 6 and 7) and lower secondary education and below (22.1%, ISCED levels 1 and 2). Internet use was common, with seven in 10 respondents using it every day (70.8%).
Social Media Confidence by Experimental Condition
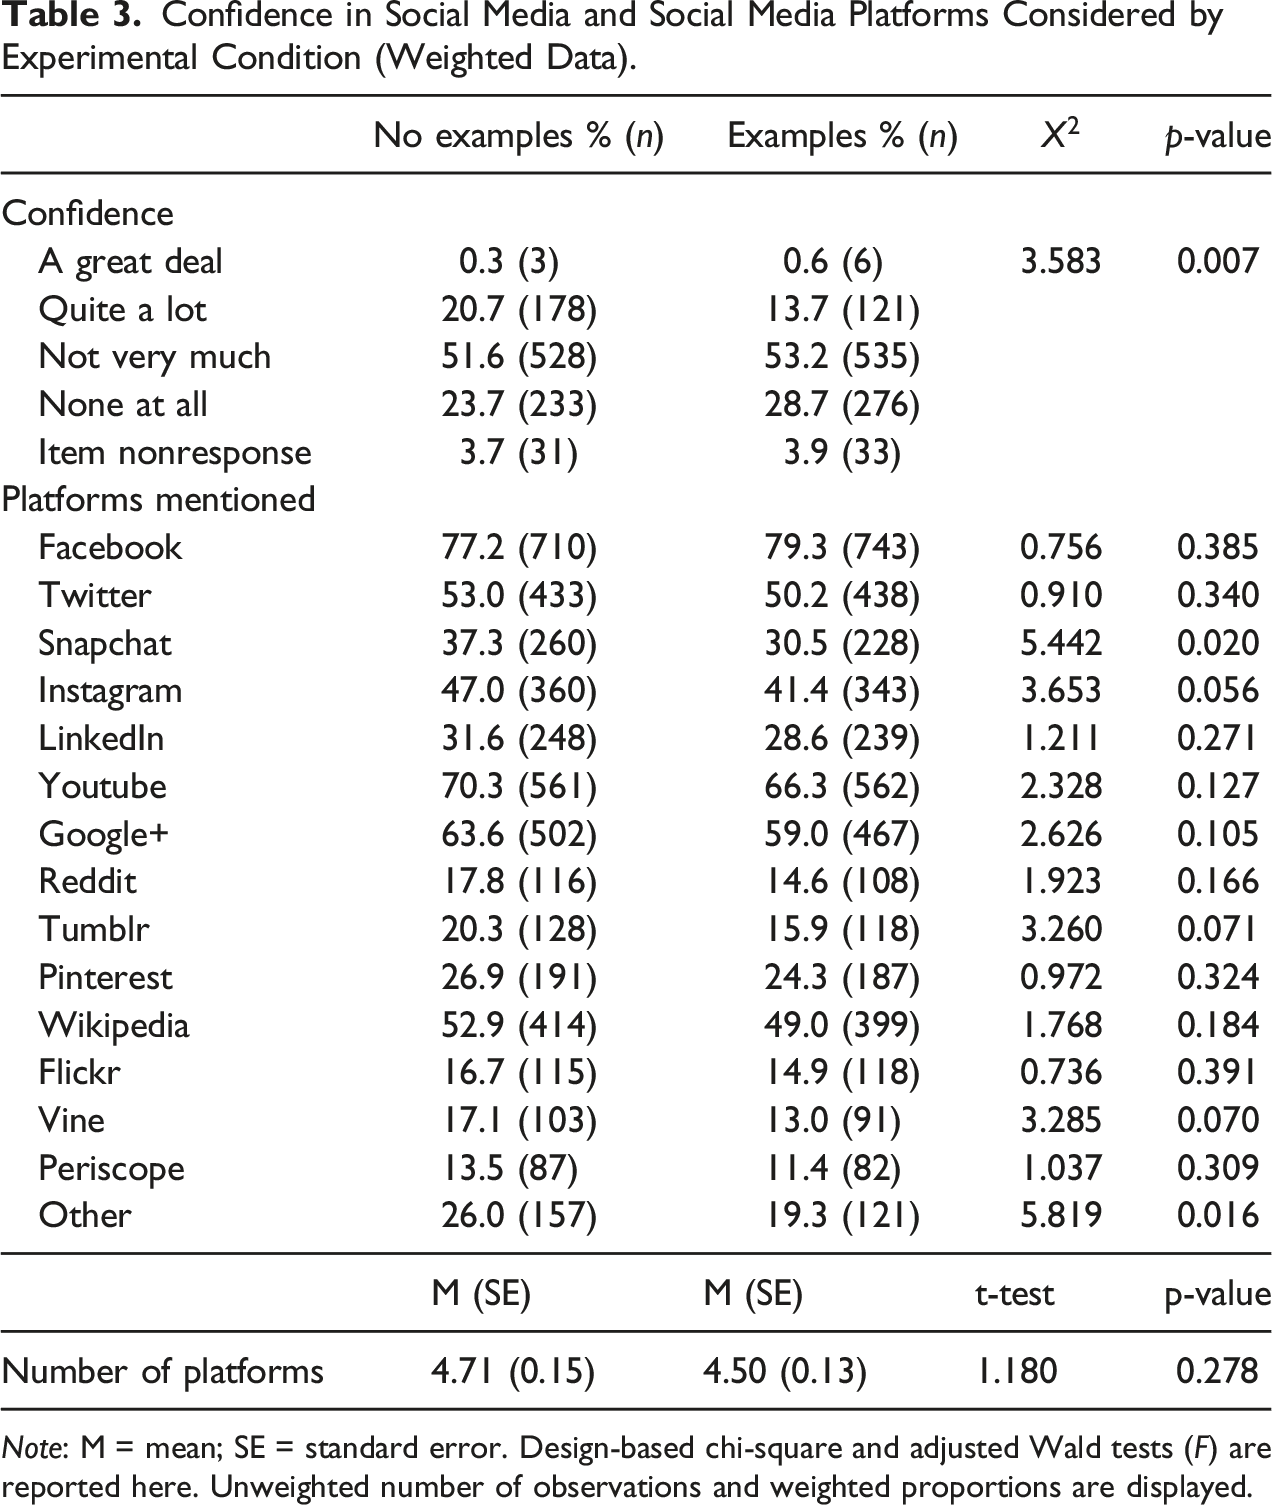
Confidence in Social Media and Social Media Platforms Considered by Experimental Condition (Weighted Data).
Note: M = mean; SE = standard error. Design-based chi-square and adjusted Wald tests (F) are reported here. Unweighted number of observations and weighted proportions are displayed.
To examine potential differences in the platforms that respondents considered when reporting their confidence in social media, we compared both the percentage of respondents who selected each platform and the total number of platforms by experimental condition. As shown in Table 3, the overall number of platforms considered by respondents was comparable between the groups. On average, respondents reported between four and five different platforms
Very few differences were identified in the platforms that respondents considered when responding to the question about confidence in social media. Of the 15 platforms under consideration, only two showed significant differences between the two conditions: Snapchat and “other.” In both cases, the proportion of respondents indicating having considered them was lower in the group receiving the examples (30.5% vs 37.3% for Snapchat and 19.3% vs 26.0% for “other”). Respondents who were not given examples were as likely as those receiving Twitter and Facebook as examples to indicate having considered these platforms in their responses. In fact, Facebook was the social media platform that most people selected regardless of the condition, with nearly eight in 10 participants indicating having considered it when reporting their confidence in social media.
Social Media Confidence: The Role of Examples, Country, and Education
Ordinal Regression Models Predicting Confidence in Social Media by Experimental Condition (Weighted Data).

Note: OR = odds ratio; SE = standard error; CI = confidence interval.
*p < .05; **p < .01; ***p < .001.
To assess whether the effect of the experimental manipulation was comparable across education levels, an interaction term was included in Model 2, while we adjusted for all other variables (i.e., country, sex, age, and Internet use). The results were significant, suggesting that the effect of the examples differed depending on respondents’ education levels (see Table 4). As can be seen in Figure 1, the experiment produced no differences among respondents with tertiary education, while those with secondary education (both lower and upper) were more sensitive to the experimental manipulation. Predicted probabilities—Confidence in social media by experimental condition and education level.
To assess whether the effect of providing examples was comparable across countries, an interaction term between these two variables was added in Model 3. The results suggest that the effect was different in Slovenia (OR = 0.509, p = .022). As can be seen in Figure 2, overall differences were mostly driven by this country. Whereas in Great Britain and Estonia predicted probabilities were very similar across conditions, in Slovenia, respondents who received no examples were more likely to report the highest level of confidence in social media (light gray dotted line), and less likely to report the lowest level of confidence (black dotted line). Predicted probabilities: Confidence in social media by experimental condition and country.
Discussion
There has been little empirical research into the impact that offering examples in survey questions has on the answers provided by respondents. We have contributed to addressing this gap in the literature by examining the results of a randomized experiment implemented in a probability-based, cross-national web survey fielded in three European countries. Our results show that levels of confidence in social media vary depending on whether the question stem included Facebook and Twitter as examples. When these examples were offered, confidence was reduced, although the effect size was small. This is consistent with the hypothesis that examples influence the comprehension stage of the response process, making the examples more salient.
Beyond this global effect, our findings suggest that the effect of examples on survey responses might vary across education levels. While those with tertiary education showed comparable levels of confidence in social media regardless of the condition they were assigned to, respondents with lower levels of education were more affected by the inclusion of examples. This is consistent with the satisficing hypothesis positing that lower respondent ability increases the risk of measurement error (Krosnick 1991). If respondents are optimizing and interpreting the examples as a non-exhaustive list of instances, the use of different sets of examples would result in small differences. On the contrary, if respondents complete the tasks involved in the response process superficially, they might excessively focus on the examples, failing to infer from the examples or to retrieve information pertaining to other instances.
When analyzing the impact of the examples across countries, significant differences were found, with Slovenia—the country with the lowest Internet penetration and social media use at the time—driving the overall differences. This finding suggests that the effect of providing examples might vary across cultural or linguistic groups. In such a case, the use of examples in the context of cross-national research might increase comparison error (Smith 2018). Finding examples that are meaningful across cultures and display the same intensity and meaning can be challenging. Our results suggest that even when the examples might be relevant in all participating countries, their effects might be heterogeneous, introducing different levels of measurement error. If examples are included in cross-cultural surveys, carefully pre-testing the questions with different groups of the population and in as many countries as possible is strongly recommended.
Consistent with previous research (Aizpurua et al. 2021), we did not find evidence that the use of examples improves the recall process. If this were the case, respondents in the example condition would have reported a greater number of platforms than those in the no example condition. On average, respondents in both groups indicated having considered between four and five different platforms, with Facebook, YouTube, Google+, and Twitter being the most reported among both groups. The fact that the examples provided to respondents were among the most well-known social media platforms might explain these findings. A study conducted by Tourangeau and colleagues in the United States showed that atypical examples had greater impact on survey responses than typical examples, perhaps because respondents are likely to consider the typical examples regardless of whether they are presented to them (Tourangeau et al. 2014). Our results are consistent with this hypothesis, with individuals in the no example condition being as likely to report Facebook and Twitter as those in the example group. This finding provides no support to the “focusing hypothesis,” according to which respondents would have been more likely to report the examples that were provided to them.
Our question examining the specific platforms that respondents had considered when reporting their confidence in social media displayed 15 social media outlets and asked panelists whether they have considered each one when reporting their levels of confidence. Previous research suggests that response options are endorsed at higher rates when using yes–no questions, such as the ones we used, when compared to alternative formats such as “mark-all-that-apply” (Neuert 2020). Because of this, and taking into account the relatively high number of platforms reported by respondents (Mdn = 4), further studies testing the focusing hypothesis with alternative question formats (e.g., mark-all-that-apply, open-ended) are warranted. Similarly, confidence in social media represents a salient topic for many people and understanding the impact of examples in topics with different levels of interest, and various types of questions (e.g., attitudinal vs behavioral) deserves further consideration.
The results of this study suggest that examples influence the way respondents process survey questions and respond to them, although their effects are small. There are, however, a number of limitations of the current work. First, only one set of examples was used, and they were typical, representing two of the most commonly used social media platforms at the time of data collection. Although our study includes three countries, and the survey was administered in four languages, further cross-cultural research, with a wider and more diverse set of countries is needed. 7 Third, we use educational level as a proxy for respondent ability, mindful that this represents an imperfect indicator of this construct. Future research would benefit from including indicators of task difficulty and respondent motivation, given their potential additive or multiplicative effect (Roberts et al. 2019). Finally, because panelists were recruited off the back of the ESS, the response rate was lower than that of the ESS, increasing the risk of nonresponse bias. Recent studies, however, provide evidence that the CRONOS sample is not extremely divergent from the target population or to the data from the main ESS (Bottoni and Fitzgerald 2021; Maslovskaya and Peter Lugtig 2022).
Conclusion
Examples are widely used in survey questions to clarify their intended scope, indicate the type of expected responses, and/or remind respondents of instances that might otherwise go unnoticed. The current study suggests that examples influence the cognitive process involved in answering questions, with responses being different depending on whether examples were provided. Although our study does not provide an answer to the question of which version of the item produces higher data quality, it suggests that confidence in social media is reduced when examples are offered, and that this effect is stronger in Slovenia than in the Great Britian. Because measurement quality varies greatly across countries (Bosch and Revilla 2021), it is possible that providing examples, even when they have differential effects, might result in measurement errors being more comparable. However, using examples can also amplify existing differences, increasing comparability error. This requires caution when it comes to including examples in the context of cross-national surveys. If examples are included, carefully pre-testing the questions to ensure that they are interpreted as intended across countries and groups is necessary to be confident that differences or similarities found are not an artifact of measurement error. Studies using multitrait-multimethod experiments could also be used to estimate the measurement quality of questions with and without examples, providing much needed guidance for survey researchers and practitioners.
Footnotes
Acknowledgments
The authors thank those who made CRONOS possible, including those who designed and implemented this experiment (in particular Ana Villar, Angelica Maineri and Ruud Luijkx) and the respondents who kindly gave their time to take part in the survey. A special thanks to the ESS National Coordinators in Estonia, Great Britain, and Slovenia, and those working on the CRONOS Central Team (City, University of London, Norwegian Center for Research Data, University of Ljubljana, and Universitat Pompeu Fabra). We are also grateful for the feedback received at AAPOR on an earlier version of this work, and the input provided by the reviewers and editors of Field Methods.
Declaration of Conflicting Interests
The author(s) declared the following potential conflicts of interest with respect to the research, authorship, and/or publication of this article: Although the article was written in its entirety while all authors were working at the European Social Survey Headquarters, the first author joined Facebook (one of the two platforms used in the examples) after submitting the manuscript to Field Methods.
Funding
The author(s) disclosed receipt of the following financial support for the research, authorship, and/or publication of this article: Horizon 2020 Framework Programme.

Notes
Appendix
Question Wording. Note: the source questionnaires for all CRONOS waves and all ESS rounds are available at https://www.europeansocialsurvey.org/
Question stem
Response options
Outcome variables (CRONOS)
Confidence in social media (Example condition)
A great deal
Quite a lot
Not very much
How much confidence do you have in social media like Facebook or Twitter?
None at all
Don’t know
Prefer not to answer
Confidence in social media (No example condition)
A great deal
Quite a lot
Not very much
How much confidence do you have in social media?
None at all
Don’t know
Prefer not to answer
In the previous question, you were asked about social media. Please indicate whether you considered each of the following social media platforms
Please select yes or no for each example.
Facebook
Twitter
Snapchat
Instagram
Yes
Linkedin
No
Youtube
Google+
Reddit
Tumblr
Pinterest
Wikipedia
Flickr
Vine
Periscope
Other
Covariates (from the main ESS)
Sex
Male
Interviewer-coded
Female
Education (output harmonized)
ES-ISCED I, less than lower secondary
ES-ISCED II, lower secondary
ES-ISCED IIIb, lower tier upper secondary
ES-ISCED IIIa, upper tier upper secondary
ES-ISCED IV, advanced vocational, sub-degree
ES-ISCED V1, lower tertiary education, BA level
ES-ISCED V2, higher tertiary education, ≥ MA level
Other
Frequency of Internet use
Never
People can use the internet on different devices such as computers, tablets and smartphones. How often do you use the internet on these or any other devices, whether for work or personal use?
Only occasionally
A few times a week
Most days
Every day
Refusal
Don’t know
Missing Data by Variable.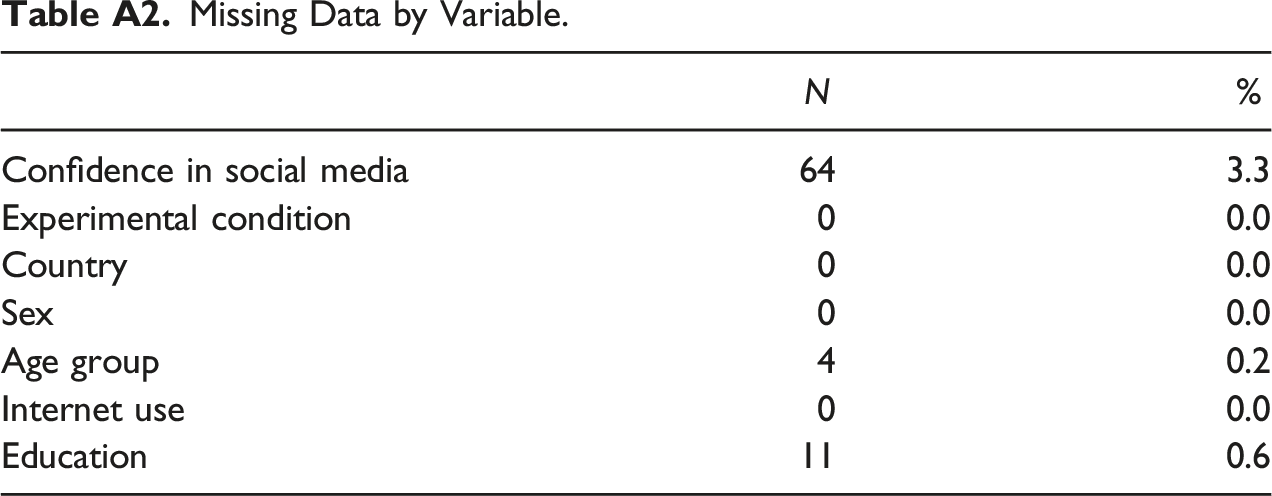
N
%
Confidence in social media
64
3.3
Experimental condition
0
0.0
Country
0
0.0
Sex
0
0.0
Age group
4
0.2
Internet use
0
0.0
Education
11
0.6
Ordinal Regression Models Predicting Confidence in Social Media with no Covariates (Weighted Data). Note: OR = odds ratio; SE = standard error; CI = confidence interval. *p < .05; **p < .01; ***p < .001.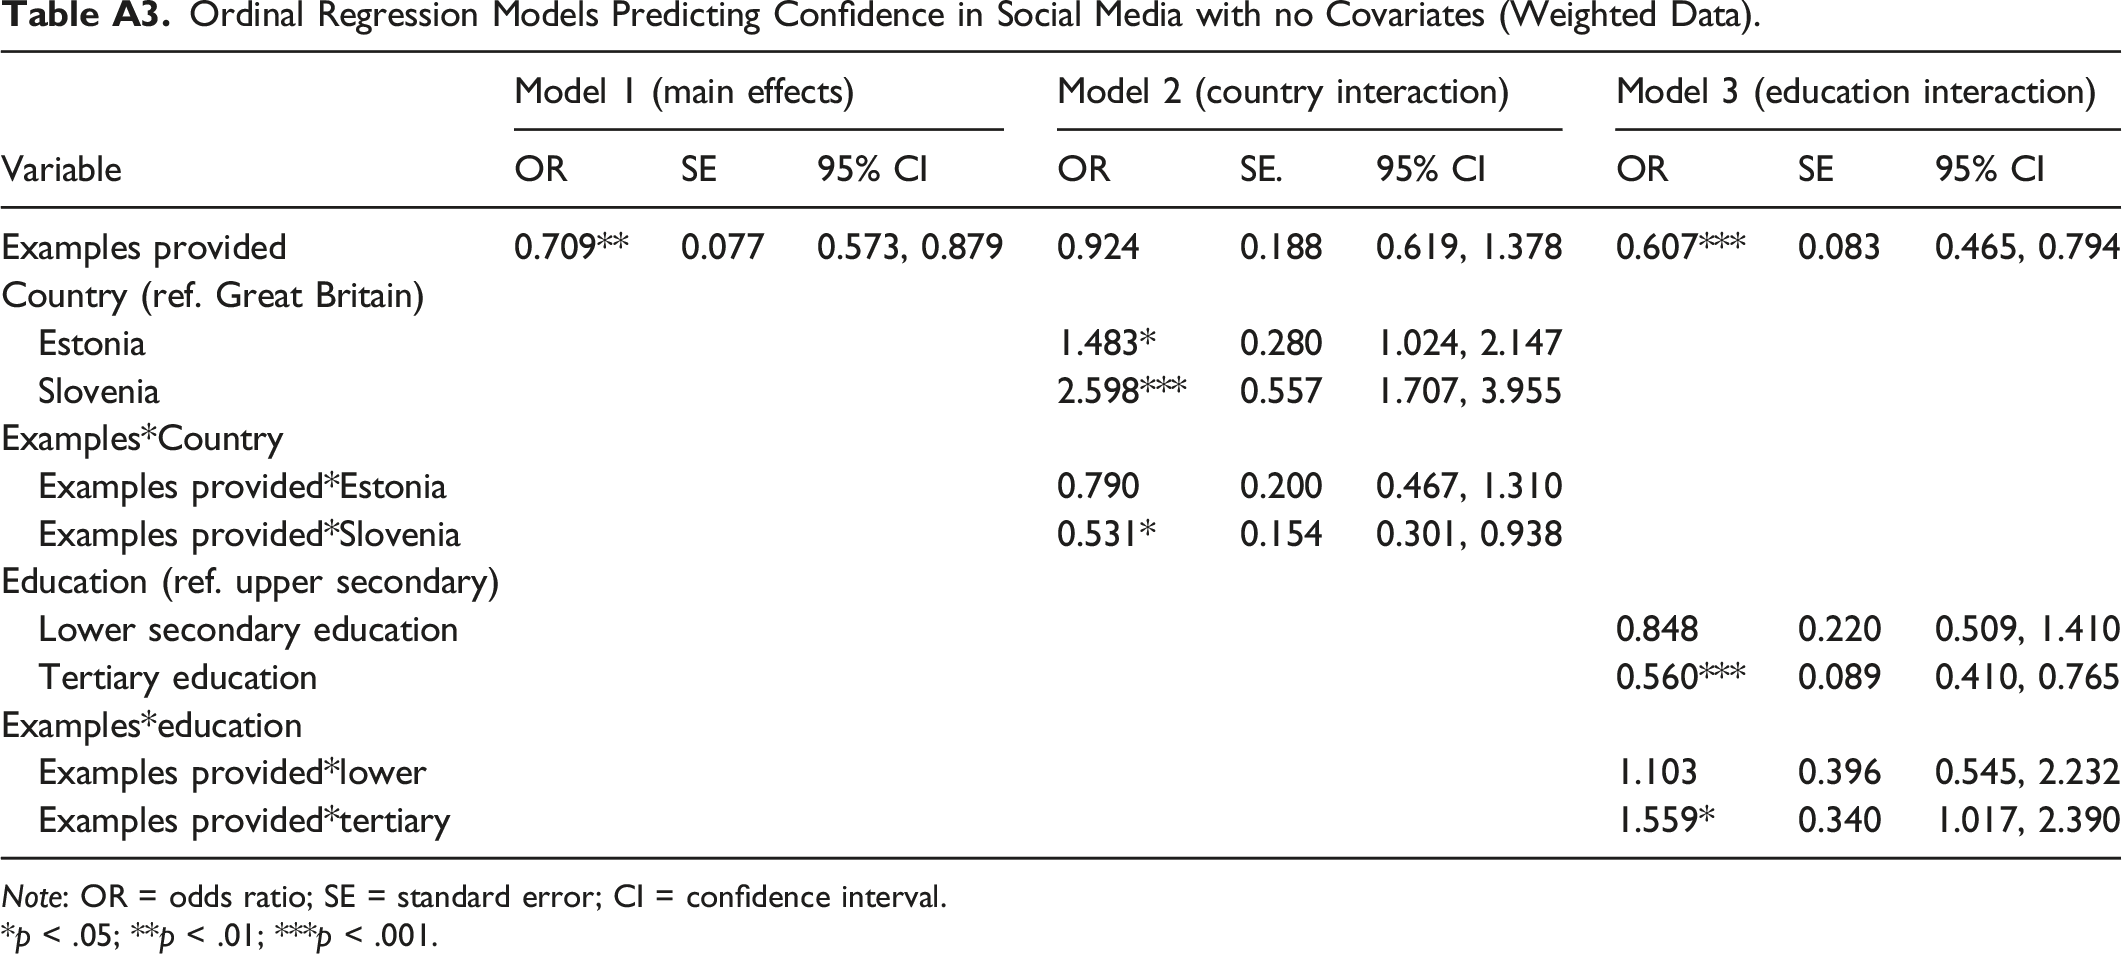
Model 1 (main effects)
Model 2 (country interaction)
Model 3 (education interaction)
Variable
OR
SE
95% CI
OR
SE.
95% CI
OR
SE
95% CI
Examples provided
0.709**
0.077
0.573, 0.879
0.924
0.188
0.619, 1.378
0.607***
0.083
0.465, 0.794
Country (ref. Great Britain)
Estonia
1.483*
0.280
1.024, 2.147
Slovenia
2.598***
0.557
1.707, 3.955
Examples*Country
Examples provided*Estonia
0.790
0.200
0.467, 1.310
Examples provided*Slovenia
0.531*
0.154
0.301, 0.938
Education (ref. upper secondary)
Lower secondary education
0.848
0.220
0.509, 1.410
Tertiary education
0.560***
0.089
0.410, 0.765
Examples*education
Examples provided*lower
1.103
0.396
0.545, 2.232
Examples provided*tertiary
1.559*
0.340
1.017, 2.390