
Abstract
Increasingly surveys are using interviewers to collect objective health measures, also known as biomeasures, to replace or supplement traditional self-reported health measures. However, the extent to which interviewers affect the (im)precision of biomeasurements is largely unknown. This article investigates interviewer effects on several biomeasures collected in three waves of the National Social Life, Health, and Aging Project (NSHAP). Overall, we find low levels of interviewer effects, on average. This nevertheless hides important variation with touch sensory tests being especially high with 30% interviewer variation, and smell tests and timed balance/walk/chair stands having moderate interviewer variation of around 10%. Accounting for contextual variables that potentially interact with interviewer performance, including housing unit type and presence of a third person, failed to explain the interviewer variation. A discussion of these findings, their potential causes, and their implications for survey practice is provided.
Introduction
Social surveys are increasingly supplementing (or replacing) self-reported health measures with objective health measurements, also known as biomeasures (Jaszczak et al. 2009; Sakshaug et al. 2015). These “biosocial surveys” often collect a variety of biomeasures including anthropometric (e.g., height, weight), cardiovascular function (e.g., blood pressure, pulse rate), physical performance (e.g., timed movements), among others. A key advantage of coupling biomeasures with traditional survey measures is they enable researchers to identify complex substantive relationships between a person’s physiological state and their social behavior and health outcomes (National Research Council 2010). As such, substantive researchers have used biosocial survey data to make important discoveries in several disciplines, including economics, aging, biodemography, and public health (Crimmins et al. 2010; Lindau et al. 2008; McDade et al. 2010; Yang et al. 2016).
Survey-based biomeasures also have important methodological advantages. First, they are less susceptible to respondent self-report errors, including recall error and social desirability bias, which can reduce the accuracy of traditional survey measurements (Tourangeau 2000; Tourangeau and Yan 2007). Second, biomeasures are useful for identifying undiagnosed health conditions or conditions that are unknown to the respondent. Furthermore, when collected from population-representative samples, the data may be used to make inferences about the broader population unlike selective clinical samples (Smith et al. 2004).
However, there are also methodological drawbacks associated with collecting biomeasures in surveys. Biomeasures can be invasive and administering them requires adequate medical equipment and medical training that is usually afforded only to certified medical professionals working in clinical settings. Transporting survey respondents to medical facilities or sending medical professionals (e.g., nurses) to respondents’ homes—a common approach in some European countries—is expensive and can lead to nonresponse, especially if there is a long gap in-between the survey interview and the biomeasure collection (Cernat et al. in press; Cernat and Sakshaug 2020a; Sakshaug et al. 2015).
An alternative model—the focus of the present study—is to use lay interviewers to collect biomeasures during the interview (Fisher and Ryan 2018; Harris et al. 2019; Herd et al. 2014; Jaszczak et al. 2009; Malter and Börsch-Supan 2017). On the one hand, this model is less expensive because it circumvents the need to hire medical professionals or perform the measurements in a medical facility. It is also more convenient for respondents as it combines the traditional interview and biomeasure collection into a single visit. On the other hand, this model requires interviewers to undergo sufficient training on using the measurement equipment, following administration protocols, and preparing for possible medical scenarios that go above and beyond traditional interviewer duties.
Some studies have assessed the effects of interviewers on respondent participation in household biomeasure collection (Guyer et al. 2017; Jaszczak et al. 2009; Korbmacher 2014; McFall et al. 2014; Sakshaug et al. 2010), but studies assessing interviewer effects on the measurement quality of biomeasures are rare. We address this research gap. Most of the available evidence on measurement effects in biomeasures comes from nurse-led studies. This literature shows that nurses are a source of measurement error for specific biomeasures such as height, weight, waist and hip circumference, and blood pressure (Ali and Rouse 2002; Andersen et al. 2002; Bogan et al. 1993; Cernat and Sakshaug 2020b; Dickson and Hajjar 2007; Grim and Grim 1995; Selenta et al. 2000; Trilling and Froom 2000; Ulijaszek and Kerr 1999; Ulijaszek and Lourie 2005).
Measurement imprecision, or intraobserver variation, is the most widely cited source of measurement error in biomeasure-based studies (Cernat and Sakshaug 2020b; Ulijaszek and Kerr 1999; Ulijaszek and Lourie 2005). This source of measurement error is particularly important as it has the potential to inflate variances and lead to incorrect inferences (Groves et al. 2009; West and Blom 2017). The approximate factor of variance inflation is estimated by
Intranurse variation (or “nurse effects”) have been found to be rather small for relatively straightforward biomeasures like height and weight, and moderate for more complex measures like blood pressure and physical performance measures, which require more action and more subjective decision making by the observer (Cernat and Sakshaug 2020b; Ulijaszek and Kerr 1999). Disparities in training, digit rounding, and inadequate measurement techniques have all been cited as possible causes of nurse effects (Armstrong 2002; Baguet et al. 2013; Baillie and Curzio 2009; Bur et al. 2003; Dickson and Hajjar 2007; Kay 1998; Maxwell et al. 1982; Ulijaszek and Kerr 1999). But the extent to which these small-to-moderate nurse effects translate to lay interviewers, who have cumulatively less medical training and experience compared to nurses, is unknown.
There are multiple potential causes of interviewer variation (“interviewer effects”) in biomeasures, and some biomeasures may be more susceptible to interviewer variation than others. As the nurse literature suggests, biomeasures that are relatively straightforward to administer (e.g., weight, height) are likely to be less susceptible to interviewer variation than more complex measures that rely more heavily on the experience of the interviewer (e.g., waist/hip circumference, blood pressure, physical performance). Likewise, interviewers may vary in how they set up and use the measurement equipment, how they explain and demonstrate the measurements, and how they administer the measurement to respondents who are uncomfortable or nervous about a potentially poor result. Even for sensory function measures, interviewers may vary: (1) the intensity with which they apply the sensory stimulus (e.g., touch pressure); (2) the amount of dialogue with respondents during and after the measurement; and (3) their willingness to allow respondents to repeat the measurement or think about (and possibly edit) their answer to the sensory identification question.
In addition, interviewers may vary as to how they adapt the measurement to the household context. Poor lighting, space restrictions, and the presence of bystanders may put additional pressure on the interviewer and/or the respondent. For instance, smaller households (e.g., apartments) may pose space constraints that restrict the interviewer’s ability to administer the biomeasures in a standardized way. The presence of other household members might also interfere with the standardization of measurement, as some interviewers may allow for a modified procedure (or suboptimal measurement) to avoid embarrassing the respondent. If interviewers vary in how they handle these situations, then household contextual factors may partially explain interviewer effects.
Assessing the magnitude of interviewer effects in biomeasurements is a pressing topic, as the demand for biosocial survey data continue to grow. Users of these data should have a general sense of their measurement quality when drawing substantive conclusions. This information also helps guide survey institutes in their decision whether to keep/drop certain biomeasures or focus more resources on improving their collection. For longitudinal studies, it is especially important to know whether interviewer effects are decreasing (or increasing) over time, which would suggest that measurement quality is improving (or worsening).
In this article, we examine the magnitude of interviewer effects for several biomeasures collected in a U.S. nationally representative longitudinal household biosocial survey of older adults. Consistent with the nurse literature, we expect that biomeasures that require more interviewer involvement and experience will yield larger interviewer effects than those that are more straightforward to administer (e.g., height, weight). Further, we expect that household contextual factors will explain at least a portion of the interviewer variation.
In summary, we address the following research questions: What is the overall magnitude of interviewer effects for biomeasures collected within and across waves of a longitudinal biosocial survey? Does the amount of interviewer variation vary by biomeasure type (anthropometric, cardiovascular, physical performance, and sensory function) and study wave? To what extent are interviewer effects explained by the household context, including type of housing unit and presence of another person during the interview?
Data Source
We utilize data from the first three waves of the National Social Life, Health, and Aging Project (NSHAP). NSHAP is a nationally representative panel survey that aims to understand the health and well-being of community-dwelling persons between the ages of 57 and 85. The survey collects data on physical health, illness, cognitive functioning, emotional health, health behaviors, and social connectedness. Wave 1 was based on a multistage area probability sample of 4,400 community-residing adults born between 1920 and 1947, including an oversample of Blacks and Hispanics. In-home interviews were conducted from July 2005 to March 2006 with 3,005 respondents, yielding a response rate of 75.5% (O’Muircheartaigh et al. 2009). Wave 2 interviews were conducted from August 2010 to May 2011 with 3,377 respondents, including wave 1 nonrespondents and spouses or co-resident partners, for a response rate of 74% (O’Muircheartaigh et al. 2014). Wave 3 was conducted from September 2015 to November 2016 with 4,777 respondents, including wave 2 respondents (n = 2,409) and a new cohort consisting of adults born between 1948 and 1965 and their spouses or co-resident partners (n = 2,368), yielding a response rate of 71% (Hawkley et al. 2019). We analyze all respondents and do not distinguish between target respondents, spouses/partners, or new cohort members.
The biomeasure component was administered by interviewers in each study wave. Interviewer biomeasure training consisted of completing a home study packet, a four-day centralized in-person training hosted by the survey institute, and booster trainings throughout the field period. The booster trainings were implemented by email and group phone calls with a subset of interviewers to improve field efficiency and maximize respondent cooperation. In the present analysis, we focus on 14 biomeasures: weight, height, waist circumference, hip circumference, blood pressure, pulse rate, timed “Get Up and Go,” timed walk, timed chair stands, timed balance, distance vision, taste, smell, and touch. Some of these biomeasures were collected only in certain waves and/or from subsamples of respondents. Blood pressure (diastolic and systolic) and pulse rate measurements were performed twice. We include both the single and averaged measurements in the analysis. Altogether 33 biomeasurements are analyzed (Table 1). Further details regarding the administration of each biomeasure are provided in the online supplement.
Biomeasures Analyzed in the NSHAP.
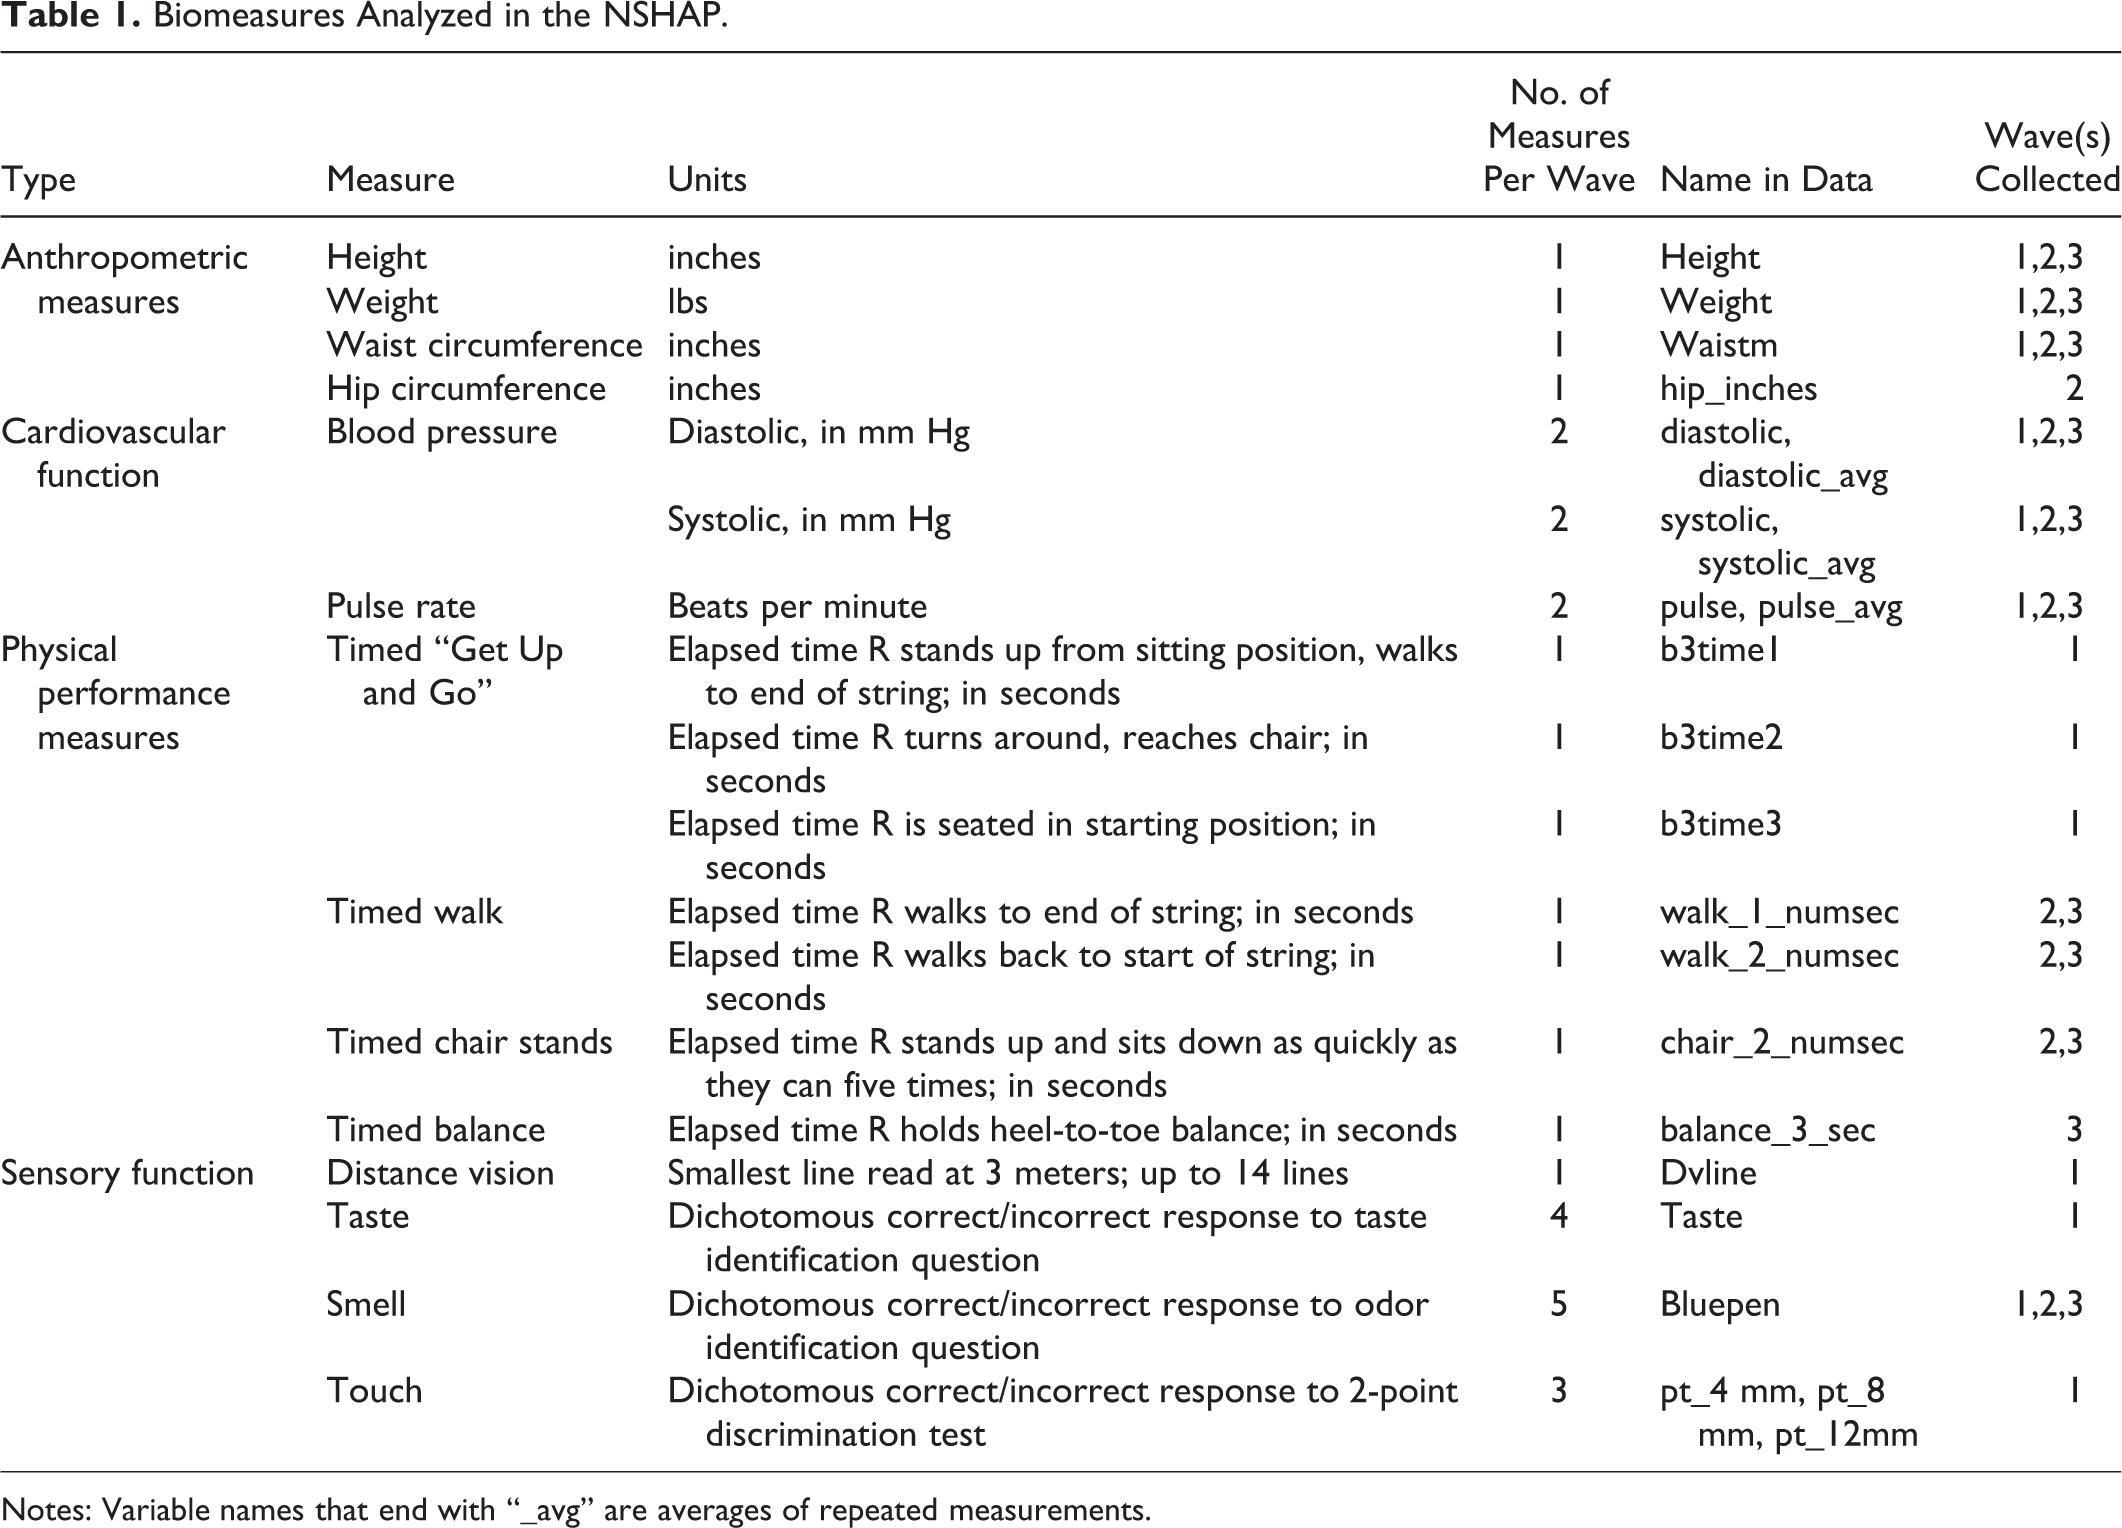
Notes: Variable names that end with “_avg” are averages of repeated measurements.
Modeling Approach
To estimate the magnitude of measurement variation due to interviewers, we use a cross-classified multilevel model with random effects for interviewers and sample areas (i.e., clusters or primary sampling units). This is a common approach to estimating interviewer effects in the absence of random interpenetration (Cernat et al. 2019; West and Blom 2017).
The cross-classified multilevel model is defined as:

Here, Y, refers to the dependent variable (i.e., the biomeasurement outcome), which varies by individual (i), area (j), and interviewer (k). The model is composed of an intercept (
The interviewer effect, or amount of measurement imprecision attributable to the interviewer, is defined as the proportion of variation that comes from the interviewer random effect:
The average number of completed interviews per interviewer in waves 1, 2, and 3 were 22, 25, and 29, respectively, while the average number of interviews per cluster were 28 for wave 1, 31 for wave 2, and 22 for wave 3. The data show good interpenetration between interviewers and clusters. On average, there were about four interviewers per cluster (4.08, 4.93, and 4.25 for the three waves) and about four clusters visited by the same interviewer (3.11, 4.01, and 5.67). Distributions of the interpenetration are shown in the online supplement.
To estimate the models, we use the rstanarm package, which facilitates the use of the Stan software in R 3.6.1 (Carpenter et al. 2017; Goodrich et al. 2018; R Core Team 2014). This uses Markov Chain Monte Carlo to estimate multilevel models. We used the default non-informative priors (see http://mc-stan.org/rstanarm/articles/priors.html and http://mc-stan.org/rstanarm/articles/glmer.html) with four chains and 2,000 iterations, out of which the last 1,000 were used for estimation. The posterior estimates are presented in the online supplement.
Listwise deletion was used for the small number of missing cases (6% in wave 1, 4% in wave 2, and 5% in wave 3). This yielded analysis sample sizes of 2,822, 3,062, and 4,162 respondents, 131, 123, and 141 interviewers, and 100, 100, and 188 areas in waves 1, 2, and 3, respectively. 1
Results
Overall, interviewers have only a small effect on biomeasures in NSHAP. Across all biomeasurements and waves, interviewers explain only 3.6% of measurement variation, on average, after controlling for areas and respondent characteristics. 2 This amount is comparable to traditional interviewer effects reported in the survey literature, where values above 10% are uncommon and a cause for concern (Beullens and Loosveldt 2016; O’Muircheartaigh and Campanelli 1998). Nevertheless, this variation does fluctuate across waves: 3.9% in wave 1, 4.2% in wave 2, and 2.6% in wave 3. For the 14 measurements that were collected in all three waves, the percentages are smaller: 1.6% for wave 1, 1.8% for wave 2, and 1.2% for wave 3. The interviewer variation for each biomeasurement outcome by wave is presented in the online supplement.
Nevertheless, there are sizeable variations for individual biomeasures as depicted in Figure 1. The touch tests seem especially severe with average interviewer effects of approximately 30%. This is indeed a large effect that has the potential to substantially inflate variances and lead to incorrect inferences. Other biomeasures that show moderate interviewer effects are the smell test, timed balance, timed chair stands, and timed walk. Around 10% of the total variation for these measures are explained by the interviewers. The rest of the biomeasures show small interviewer effects, with less than 1% of the variation explained.
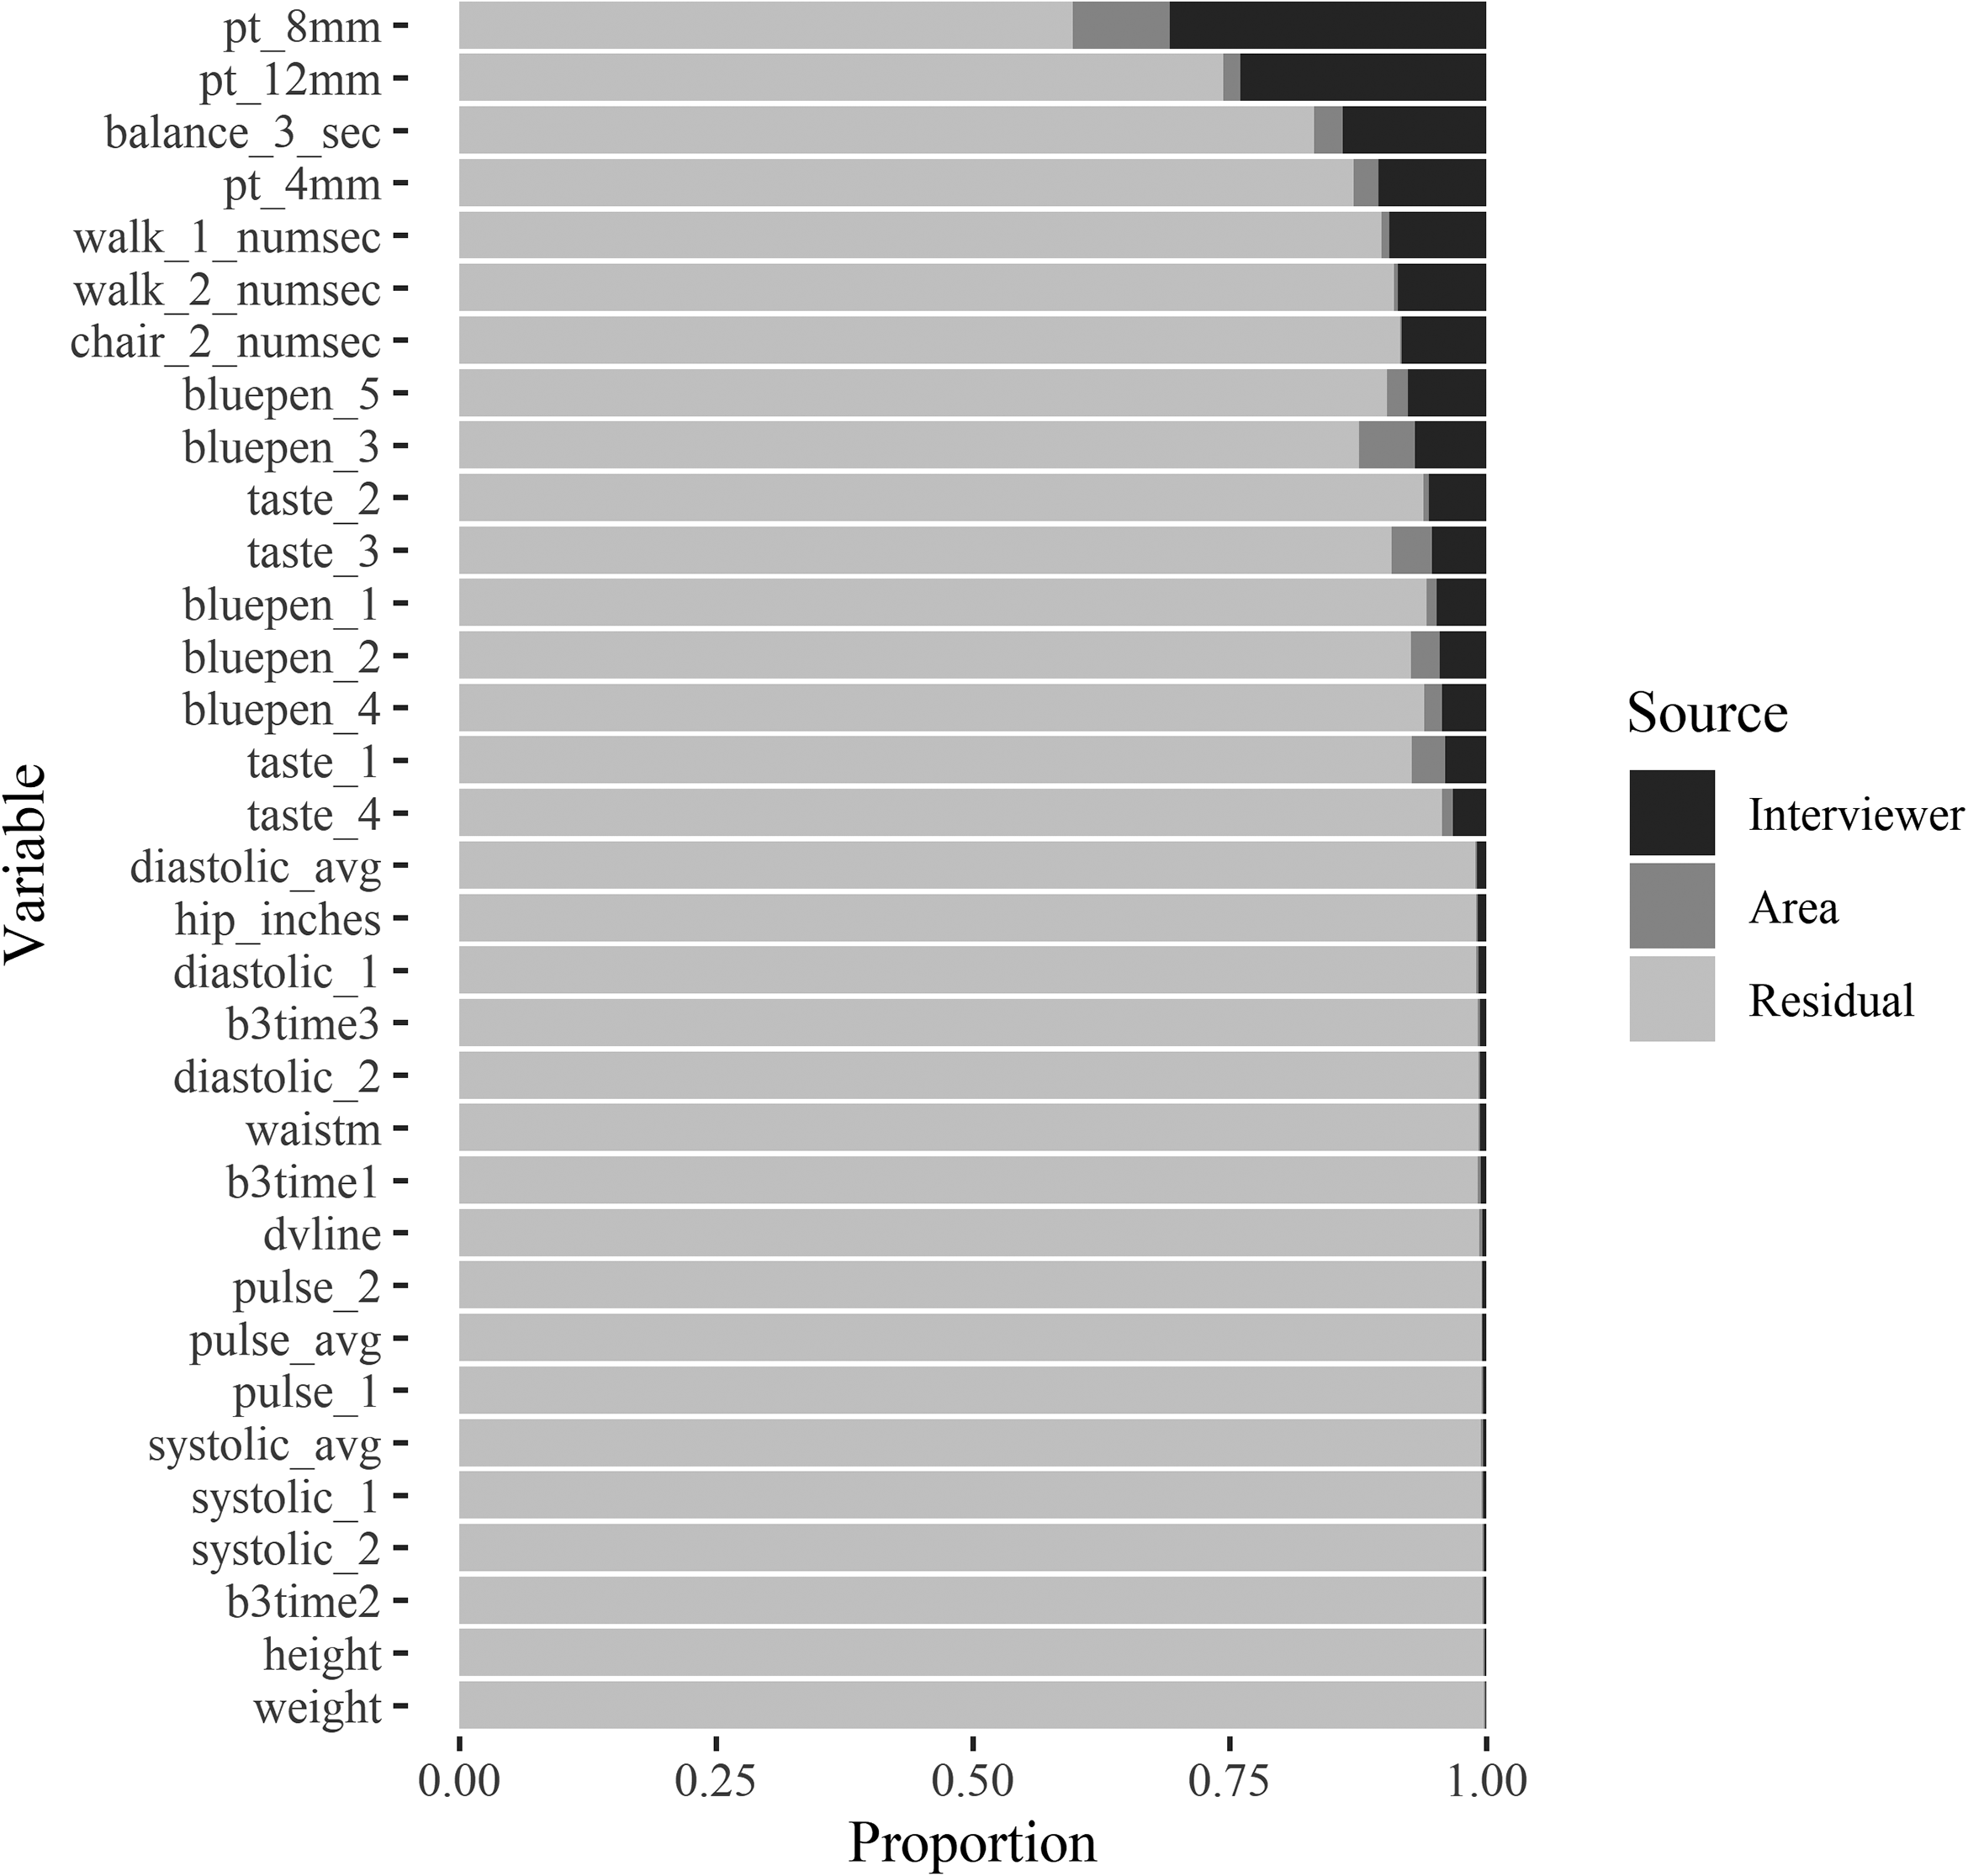
Average variance decomposition for each biomeasure across all waves.
For the biomeasures that are collected in multiple waves, interviewer variation is generally stable over time (see Figure S3 in the online supplement). That being said, wave 2 shows slightly larger interviewer effects for the smell tests compared to waves 1 and 3.
To address the last research question, two household contextual variables are added to the model: type of house (detached single family house vs. all other housing types) and another person present during the interview. Adding these two extra variables explains less than 1% of the total measurement variation (across all waves) and close to 0% of the interviewer variance. Thus, these variables do not appear to interact with the interviewer nor do they explain the impacts of interviewers on the measurements (see online supplement for further model results).
Discussion
Overall, this study showed that interviewers have a limited effect on measurement variation in the majority of biomeasurements collected in the U.S. National Social Life, Health, and Aging Project (NSHAP). Around 4% of the total variation in 33 biomeasurements collected across the three study waves can be attributed to the interviewers, which is a rather small effect and comparable to interviewer effects reported for traditional survey measures (Beullens and Loosveldt 2016; O’Muircheartaigh and Campanelli 1998). Two groups of biomeasures are important exceptions. The first group are the touch tests. These have, on average, 30% interviewer variation, a large interviewer effect. One plausible explanation is that interviewers varied in the amount of touch pressure they applied. Although interviewers were instructed to “lightly touch” the respondent’s finger, some may have applied more pressure in cases where the respondent was unsure or touch sensitivity was low. Such issues may have led to discontinuing the touch test after the first wave.
The second group of biomeasures included the smell test, timed balance, timed chair stands, and timed walk, which have about 10% interviewer variation, a moderate interviewer effect. In the case of the smell test, interviewers may have varied in how closely they held the scented pen to the respondent’s nose. Furthermore, some interviewers may have been more lenient in allowing respondents to smell the pen multiple times or have additional time to consider their answer. Regarding the timed movements, interviewers may have varied when they started or stopped the stopwatch. For the timed walk, stopping the timer after the respondent’s foot is “completely across the other end of the string” could be interpreted differently, depending on whether the respondent’s foot is in mid-air or is completely planted when across. Further, it is plausible that some interviewers were more lenient about allowing respondents to redo the exercise.
There were some indications that the amount of interviewer variation is decreasing over time. For example, the timed walk and chair stand measures decreased from an average of 9.7% in Wave 2 to 7.7% in wave 3. Similarly, the average interviewer variance for all the biomeasures decreased from waves 1 to 3. This finding suggests that the measurement procedures are improving over time. Lastly, we found that the two household contextual variables, presence of another person and type of housing unit, did not explain a noticeable proportion of interviewer or residual variation.
Comparing these findings with those from the nurse effects literature suggests that both interviewers and nurses produce similarly low amounts of variation for anthropometric measurements: height, weight, and hip/waist measurements, with slightly higher variation for the latter measurements (Cernat and Sakshaug 2020b; Ulijaszek and Kerr 1999). This is reassuring for the lay interviewer model and is an important consideration for future planning of household biosocial surveys.
This study has some limitations. First, the NSHAP study does not use an interpenetrated design which randomly assigns respondents to interviewers; therefore, we relied on standard statistical models to control for possible confounders. Nevertheless, there is the potential for confounding due to unobserved covariates. Another limitation is the absence of interviewer characteristics as well as other contextual variables that might further explain interviewer variation. Additionally, it would be beneficial to compare the interviewer effects reported here with those from other biosocial surveys that use non-clinical staff. This is an area for future work.
Keeping these limitations in mind, the results point to some practical implications. First, while interviewer variation is overall rather small, some biomeasures (sensory function and timed performance measures) are especially susceptible to large interviewer effects and might benefit from further improvements. For example, embedding detailed written guidance in the questionnaire about when to start/stop the stopwatch or the appropriate amount of sensory stimulation to apply may mitigate large interviewer effects. Another recommendation is to publicly release interviewer IDs and interviewer characteristics and to encourage their use in sensitivity analysis and interviewer correction methods.
Supplemental Material
Supplemental Material, sj-docx-1-fmx-10.1177_1525822X21997231 - Interviewer Effects in Biosocial Survey Measurements
Supplemental Material, sj-docx-1-fmx-10.1177_1525822X21997231 for Interviewer Effects in Biosocial Survey Measurements by Alexandru Cernat and Joseph W. Sakshaug in Field Methods
Footnotes
Declaration of Conflicting Interests
The author(s) declared no potential conflicts of interest with respect to the research, authorship, and/or publication of this article.
Funding
The author(s) received no financial support for the research, authorship, and/or publication of this article.
Notes
Supplemental Material
Supplemental material for this article is available online.
References
Supplementary Material
Please find the following supplemental material available below.
For Open Access articles published under a Creative Commons License, all supplemental material carries the same license as the article it is associated with.
For non-Open Access articles published, all supplemental material carries a non-exclusive license, and permission requests for re-use of supplemental material or any part of supplemental material shall be sent directly to the copyright owner as specified in the copyright notice associated with the article.