
Abstract
Social connections between individuals are often an important source of information for both quantitative and qualitative anthropological research. Here, we seek to understand the relative strengths and weaknesses of sociometric and ethnographic representations of social connections. We do this by comparing network data collected using a sociometric technique (a name generator) with a network drawn by project ethnographers representing their understanding of social structure in the study population. We find many similarities in the two networks, but they offer somewhat different perspectives into the local social structure. Although the ethnographic network is shaped by the ethnographers’ deeper knowledge of a subset of network members, individuals with high degree (but not betweenness) in the sociometric network are generally present in the ethnographic network. The ethnographers’ interpretation of the factors that lead to high degree centrality in the network is broadly accurate. However, the sociometric network is characterized by a high level of transitivity not seen in the ethnographic network. We consider the importance of the differences we observe for ethnographic practice.
Representations of social structure shape how anthropologists interpret and explain social phenomena. However, different data collection methods may lead to very different depictions of social structure. One common way of studying social structure is through social network analysis. Today, most research into social networks uses formal methods for the collection and analysis of relational data. In particular, name generators (questionnaires designed to elicit the names of social partners) are often used to gather information about specific relationships in a standardized manner from potentially large samples of people. Although such methods generate data well suited to quantitative analysis, they require deciding a priori what kinds of relationships are relevant for the study. These relationships can be more or less precisely defined (e.g., “someone you used drugs with in the past 30 days” vs. “your close friends”). However, such methods may lead to problems of validity, for example, the meaning of “friend” may vary between respondents (Wald 2014). Respondents may also have difficulty providing accurate responses to some questions (e.g., “Who did you interact with the most in the past 30 days?”; Bernard et al. 1984). Furthermore, sociometric methods can be expensive and time consuming. Also, depending on the social context and the ties of interest (e.g., sexual networks), respondents can view such methods as invasive to their privacy.
Although seldom represented as a network, an ethnographer’s knowledge of patterns of interaction in a group also constitutes a form of relational data. Indeed, observation and documentation of interpersonal relationships are often core focuses of ethnographic fieldwork. Participant observers may not be able to capture as many actors and connections in the study community as researchers using questionnaire-based methods, but participant observation nevertheless has many advantages. Participant observers can observe the content and form of relationships in context and often over a prolonged time period. Ethnographic research is also generally built on longer-term relationships of trust between the researcher and their study participants. Finally, participant observers are able to evaluate the information they receive from informants in a broader social context and keep a consistent written record of their observations (Bernard 2017).
Although ethnographers use notes and formal procedures in building their arguments, they nevertheless have intuitive understandings of the worlds they study. Such understandings are shaped by human cognitive biases or the “cognitive schemas” that people use to represent social patterns (Kilduff et al. 2008). Cognitive schemas may facilitate interpreting complex information but also “exaggerate the regularities of the external world” (Freeman 1992:122). For example, considerable research has shown how network position can shape the accuracy of people’s reports of broader network structures (e.g., Bondonio 1998; Casciaro 1998; Simpson et al. 2011). Some kinds of network structures are easier for observers to learn than others. For example, when ties involve friendship or liking, people expect symmetry (i.e., mutual liking) and transitivity (i.e., that the friend of a friend is also a friend, which leads to completed triangles in undirected networks; De Soto 1960). People’s cognitive representations of social patterns also tend to cleanly partition people into groups or categories. These groups are generally much less well defined in reality (Freeman 1992). Finally, memory of recent events is often skewed toward the long-term pattern of social interaction in groups (Freeman et al. 1987).
Anthropologists have long been concerned with the situated nature of ethnographic interpretation. However, the impact of cognitive biases and of the ethnographer’s social position on anthropological interpretations of social structure remains unexplored. In this article, we compare and contrast two networks representing social connections between people who inject drugs (PWID) in rural Puerto Rico. The first network was produced using sociometric techniques (a name generator survey). The second network represents key social connections in the study population elicited from the project ethnographers. We consider this ethnographic network data to be a cognitive schema that the ethnographers used to organize their understanding of the network structure. We examine the extent to which the ethnographers’ cognitive schema accurately captures key features of the larger sociometric network, namely, actor centrality and transitivity. We also evaluate whether the ethnographers’ understanding of the factors that contribute to actor centrality in the network is reflected in the sociometric data. We consider a comparison of these different representations of social structure to be a useful exercise that may highlight potential biases and pitfalls of different data collection methods. In particular, we seek to identify how the ethnographers’ social position may skew their understanding of the network structure.
Data and Methods
Fieldwork for this study was conducted from 2015 to 2017 in four rural municipios (towns) in the mountainous interior of Puerto Rico. The total population of the study area is approximately 124,000 people. A primary goal of the project was to examine how the social network position of PWID in this rural context shapes their risk behaviors such as using shared injection equipment. Phase 1 of this study occurred between April and June 2015 and used respondent-driven sampling to recruit and interview 315 active PWID in the target region. In phase 2 (December 2015–January 2017), we first recruited a subset of phase 1 participants to serve as key respondents. Key respondents were mostly randomly chosen from the phase 1 sample. However, some key respondents were purposively sampled to ensure the inclusion of persons belonging to groups who may have distinct social and economic strategies (e.g., homeless PWID, who were more difficult to locate, and women, who are a small minority of PWID in the study region). In total, we recruited 33 key respondents. These key respondents were the focus of our ethnographic research and provided the starting points for our network interviews (described below).
The Sociometric Network
The sociometric data were collected in a survey in which respondents were asked to name the people whom they had used drugs with in the past 30 days. Several follow-up questions were then asked about the respondent’s relationship with each of the partners they named, such as whether the respondent shared needles with that partner. Respondents were allowed to name up to a maximum of nine co-use partners, although few (11%) named this many (see Figure 1). Respondents were not asked about ties between the people they named.
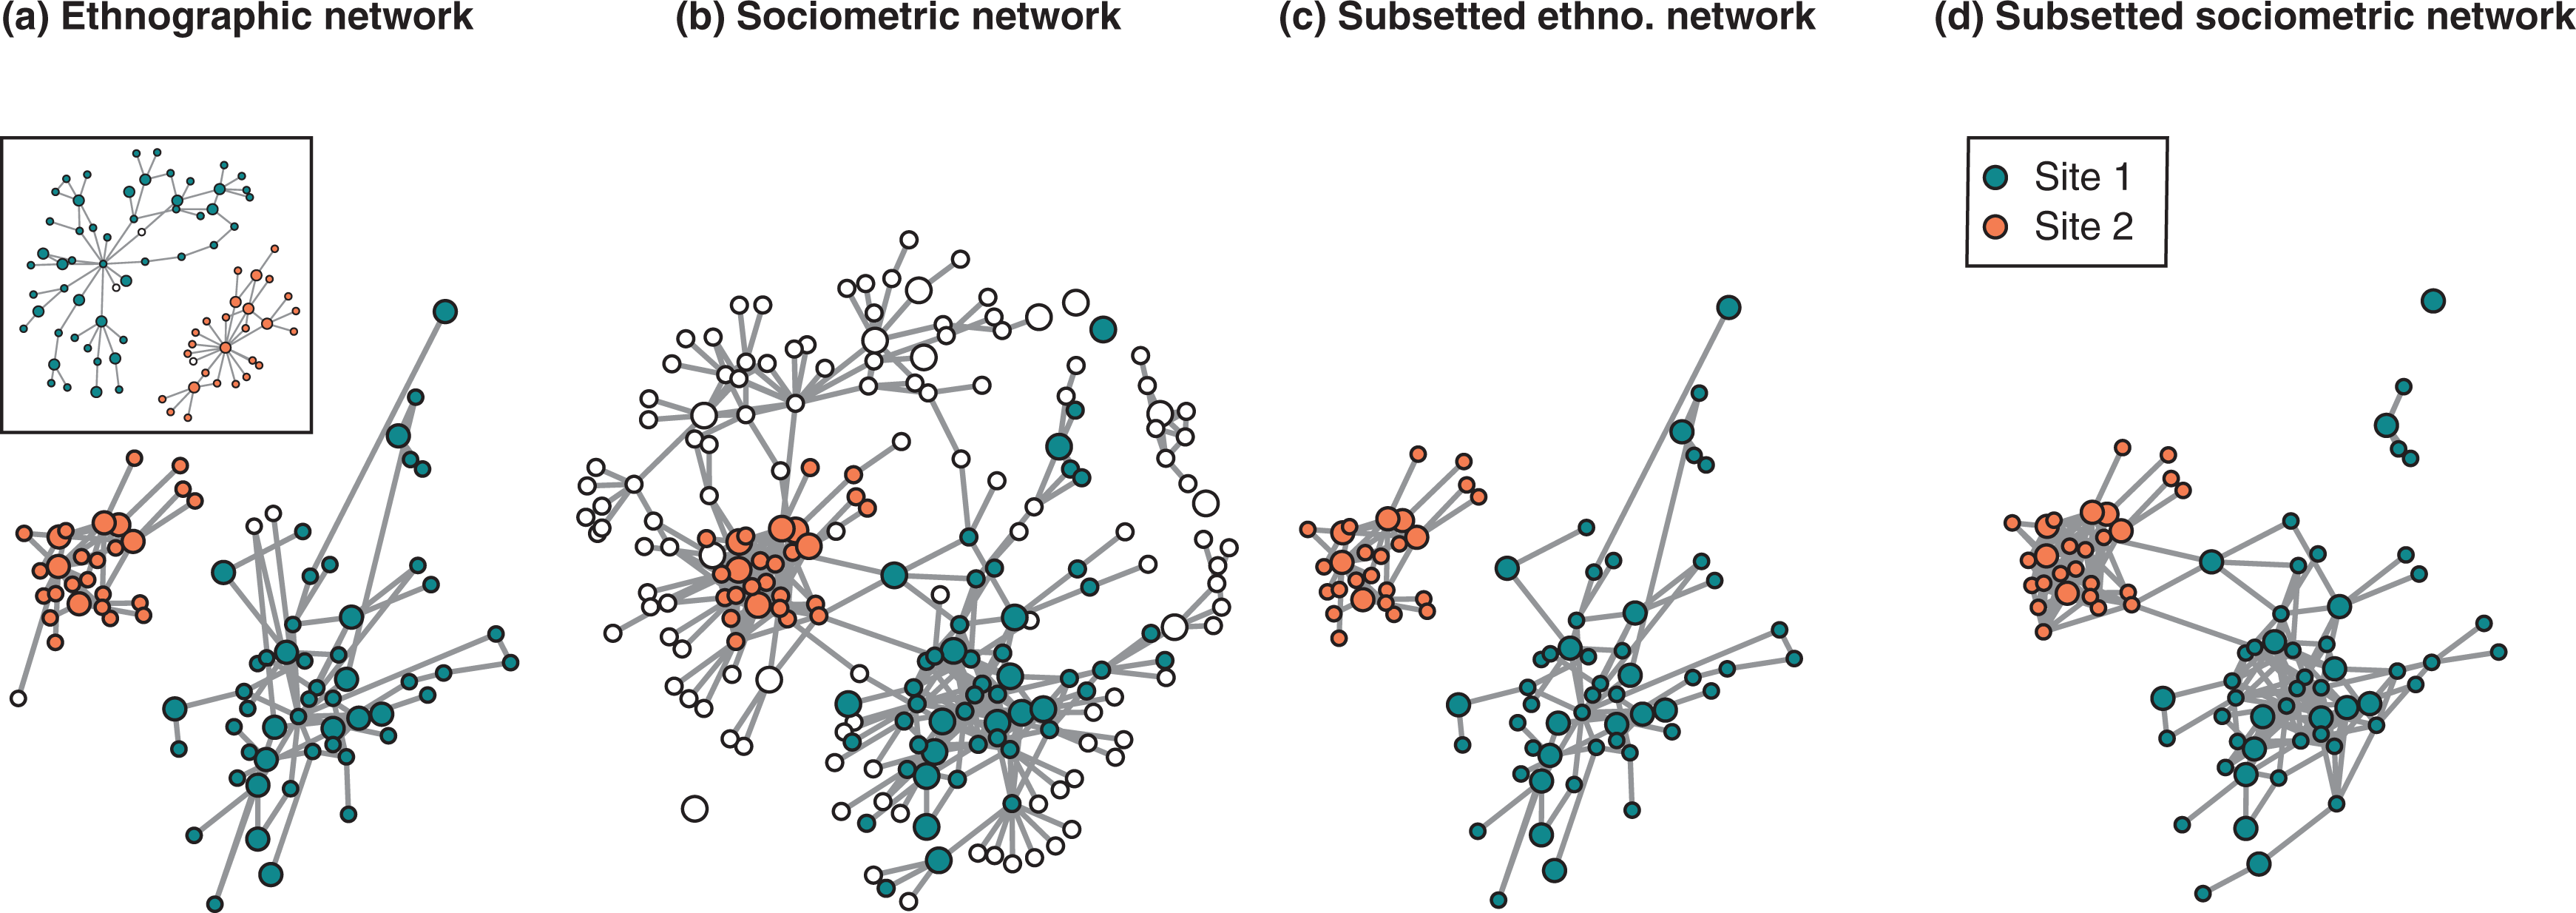
Network of ties among injection drug users in rural Puerto Rico (a) as represented by project ethnographers, and (b) based on a name generator. Unfilled nodes are individuals who appear in one dataset but not the other. Panels (c) and (d) show the networks reduced to only those individuals who appear in both datasets. Larger nodes are key respondents. Individuals are plotted in the same location in each network. The inset in panel (a) shows the original dendritic structure of the ethnographers’ network drawings.
Our survey sample began with the key respondents. Subsequently, the co-use partners of key respondents were approached and asked to complete the same survey. These individuals sometimes named new persons as co-use partners, but we did not pursue a third wave of recruitment. We repeated this process for each key respondent and their contacts (see Ready et al. [2020] for a more detailed description of the recruitment process and study methods). Individuals who were named by multiple respondents were matched using names, locations, and knowledge about PWID in the area from our previous work. A total of 117 respondents completed these interviews.
The resulting network is shown in Figure 1B. Most individuals belong to a single, large connected component, and there are four isolates (key respondents who reported no drug co-use ties). Although some division between the two main study sites (corresponding to two municipios that were hubs of PWID activity) is evident in this network, there are numerous ties that connect these clusters. Most individuals with only one tie in Figure 1B are PWID who were named as connections by the second wave of survey respondents but who did not complete the survey themselves. We call this set of individuals “nonresponding alters.”
The Ethnographic Network
Participant observation focused on the same key respondents who provided the starting seeds for the survey sample. Around the same time that each key respondent completed the network survey, members of our ethnographic team conducted “focal follows” with the key respondent for up to two weeks. The goal of these follows was to document injection practices, social contacts in the context of drug acquisition and use, and the strategies used to obtain drugs and/or money for drugs. During these periods, our team accompanied key respondents as much as possible while respecting their personal boundaries (e.g., some invited members of our team to their homes, others did not) as well as their other commitments (e.g., work). For safety reasons, fieldwork was only conducted during daylight hours. Over the course of these focal follows, a total of 119 PWID were observed.
After concluding the project, the three project ethnographers worked together to draw the social connections between research participants that they felt were most important to the structure of the regional PWID social network. This “cognitive network” was drawn by the ethnographers without using field or interview notes, providing a mental map of associations among individuals as they recalled them from their fieldwork. This network (Figure 1A) reflects the ethnographers’ understanding of the processes that organized social affiliation in the population.
In explaining how they constructed their network, the ethnographers stated that they felt that individuals with a high drug use frequency generally occupy more central positions, while those with lower drug use frequency tend to occupy more peripheral network positions. This placement reflects the fact that PWID with high injection frequency have a large demand for drugs and resources to pay for them. PWID who inject frequently—some 10 times a day or more—can need up to US$100 in a single day. Such a sum can be challenging to acquire in this rural area where rates of poverty are high (the reported mean monthly income of phase 2 survey respondents is US$551.66). The ethnographers suggested that this high demand for drugs leads to complexes of behaviors that place PWID with high injection frequency in contact with a larger number of other PWID. In particular, a practice locally known as caballo, where PWID pool their resources to acquire and jointly use drugs, is an especially important mechanism for drug acquisition and use among PWID with high injection frequency in the region.
In contrast, the ethnographers suggested that members of the network whom they considered to be more peripheral tend to have lower drug use frequency (e.g., people who might use once a day or less). Because of their lower demand for drugs, the ethnographers suggested that these PWID can often afford to buy their dose without resorting to caballo and so usually buy and use alone. Although women are a minority in this population of PWID, the ethnographers also felt that gender had an important impact on network position because women who inject frequently sometimes exchange sexual favors for money or drugs. In doing so, they may come in contact with a greater number of other PWID.
The ethnographers’ cognitive network consists of two components, each corresponding to one of the two main hubs of PWID activity in the study area (sites 1 and 2 in Figure 1). Some PWID in the study resided in other parts of the study area but were not included in the ethnographers’ network because they felt that individuals in these areas were more dispersed and had fragmented networks.
Method
In the following sections, we compare the two networks using several measures of network structure. To facilitate some comparisons, we also generate two additional subnetworks, which comprise only those individuals (n = 78) who appeared in both the ethnographic and sociometric networks (Figure 1C and D). We begin our analysis by outlining the extent to which the two data sets overlap in terms of the specific nodes and edges represented. Second, we compare patterns of centrality in the networks. Centrality is a measure of a node’s (a person’s) influence in the network. We consider degree centrality (the number of ties that people have) and betweenness centrality (the number of shortest paths in the network that pass through a person, commonly used as a measure of an individual’s influence on information flow). We then assess whether the ethnographers’ arguments about the processes that produce network centrality in the study population are consistent with the sociometric data. Finally, we compare transitivity in the networks. Based on the literature on cognitive networks (e.g., De Soto 1960; Freeman 1992; Kilduff et al. 2008), we expect that the ethnographic networks might have a higher prevalence of triangles and more clearly defined groups than the sociometric data. All quantitative analyses were conducted in R 3.6.0 (R Core Team 2019) using the packages “network” (Butts 2015), “sna” (Butts 2016), “igraph” (Csardi and Nepusz 2006), and “RVAideMemoire” (Hervé 2020).
Results
Sample Overlaps
We first examine the overlap between the networks in terms of the individuals (nodes) and ties (edges) they contain. The sociometric network has more than twice as many nodes and more than four times as many edges as the ethnographic network (Table 1). Despite this difference, the set of actors in the networks is highly overlapping (96% of nodes in the ethnographic network are in the sociometric network). Only three individuals in the ethnographic network do not appear in the sociometric network (i.e., did not complete the questionnaire and were not named by any other participants). These included one individual who arrived on the scene partway through data collection and one who was an infrequent user who was more peripherally engaged with the core network. There are 73 overlapping edges in the two networks. This implies that 79% of the ties in the ethnographic network are present in the sociometric network and that 19% of ties in the sociometric network are present in the ethnographic network.
Summary of the Networks.
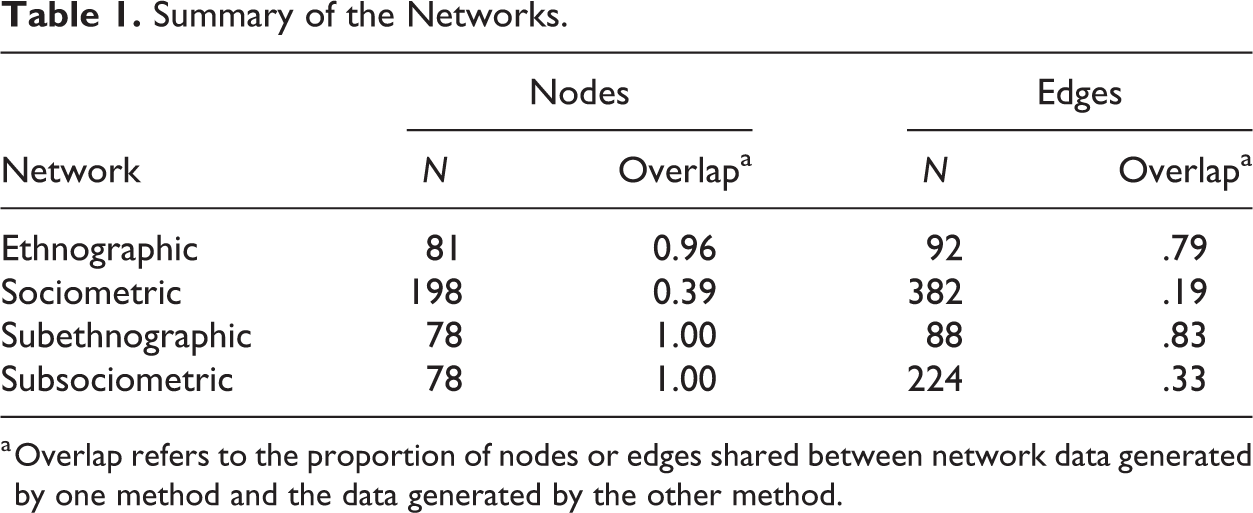
a Overlap refers to the proportion of nodes or edges shared between network data generated by one method and the data generated by the other method.
All of the 33 key respondents are, by design, part of the sociometric network. This includes four key respondents who named no co-use partners and were named by no one else. In contrast, the ethnographers’ network includes only 21 of the 33 key respondents. Some key respondents were not included in the ethnographic network because they lived in other localities, because they seemed to have no social ties to the other members of the study population, and/or because the ethnographers were less certain about whom they regularly affiliated with.
In the subsetted networks that contain the same set of 78 individuals, 83% of edges listed by ethnographers were also reported by respondents, and 33% of edges reported by respondents were listed by ethnographers. These networks are highly correlated (product–moment correlation of .49, estimated p value of 0 based on a quadratic assignment procedure test with 10,000 permutations). The ethnographers reported 15 edges between survey respondents that were not self-reported by the respondents. Overall, in terms of both the specific nodes and edges represented in the network, the ethnographic network is largely, although not exactly, a subset of the larger sociometric network.
Centrality
To compare patterns of centrality in the two networks, Figure 2 presents their degree distributions, and Table 2 provides some summary statistics of network degree. Because of the long tails of the distributions, the plots in Figure 2 are shown on the log scale to improve their legibility. The complete sociometric network has a bimodal degree distribution, where the left-hand peak reflects the nonresponding alters who have lower degree (usually a degree of one) than individuals who completed the network questionnaire. This lower peak is eliminated in the subsetted sociometric network, which better highlights the much higher average degree among survey respondents in the sociometric network. Among individuals appearing in both networks, the correlation of individual degree is positive (Pearson’s R = .50, p < .001) but far from perfect. Along with the imperfect overlap of ties between the networks, this demonstrates that the difference in degree distribution between the networks is not simply a matter of scale (i.e., that all individuals have proportionally fewer ties in the ethnographic network).
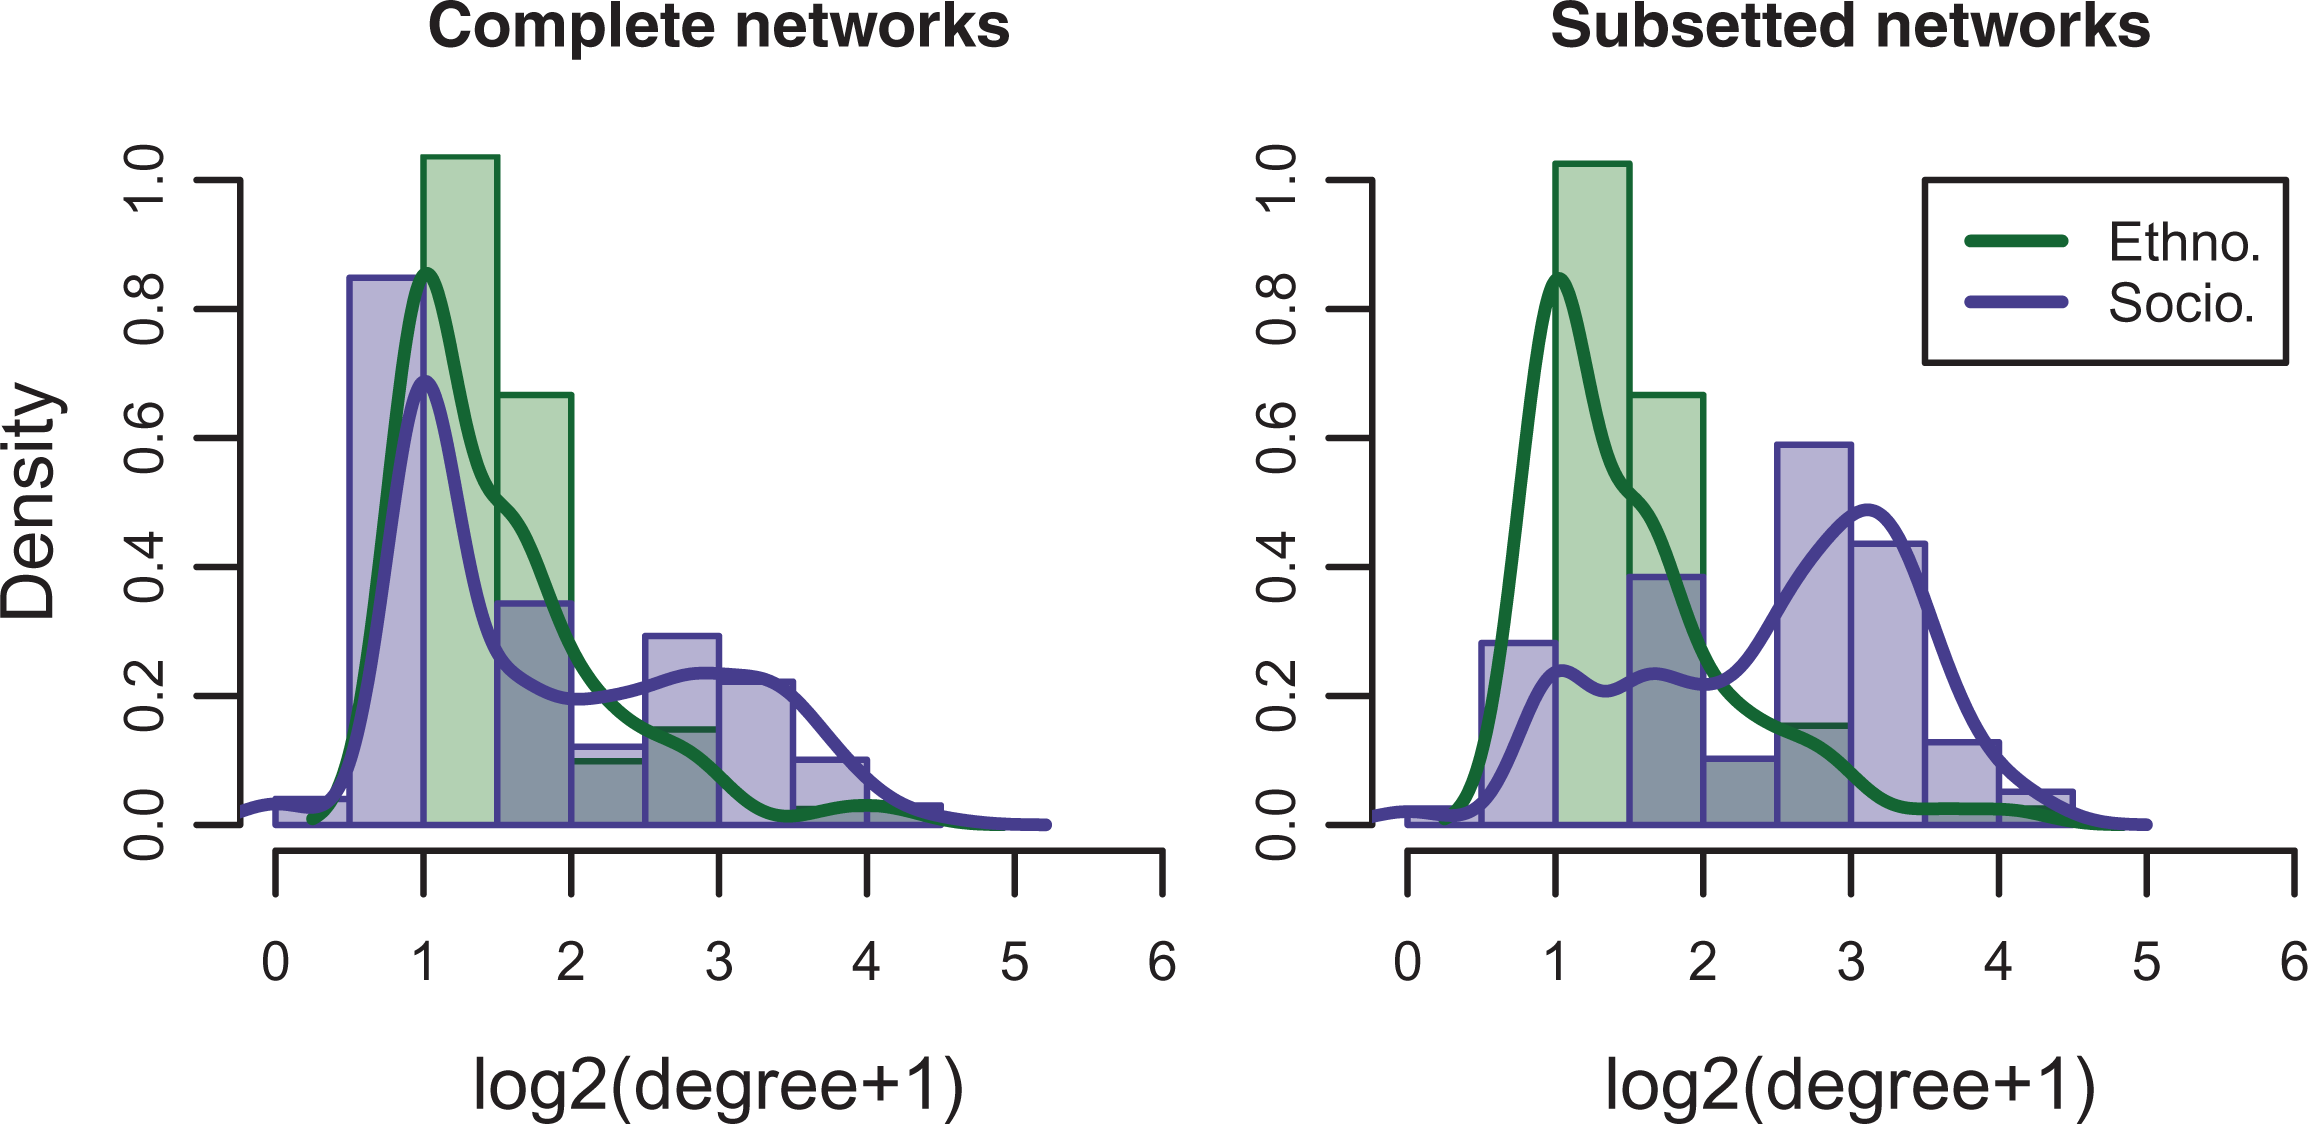
Comparisons of the degree distributions of the ethnographic and sociometric networks. The left panel shows the degree distributions of the complete networks; the right panel shows the subsetted networks (those containing only individuals appearing in both data sets).
Summary of the Network Centrality and Transitivity Measures.
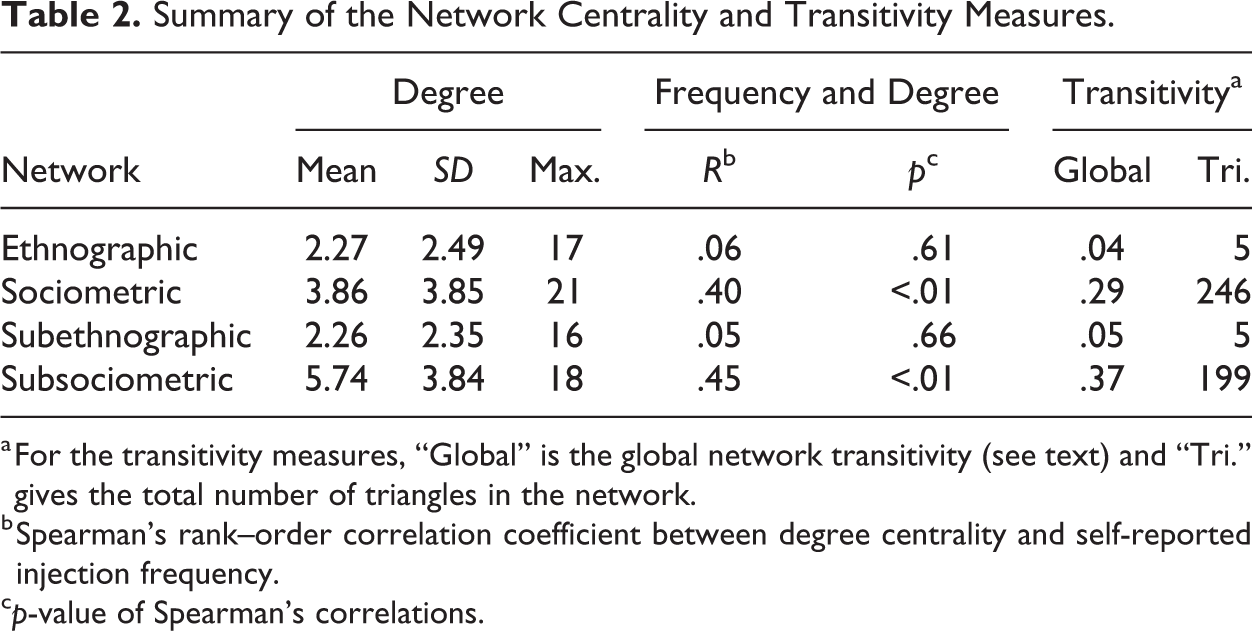
a For the transitivity measures, “Global” is the global network transitivity (see text) and “Tri.” gives the total number of triangles in the network.
b Spearman’s rank–order correlation coefficient between degree centrality and self-reported injection frequency.
cp-value of Spearman’s correlations.
We also consider whether the most central individuals in each network are the same. The top two individuals by degree in the ethnographic network are also the top two in the sociometric network (although two individuals are tied for second rank in the sociometric network). Further, the maximum degrees in the two networks are relatively similar and do not change drastically in the subsetted versions (Table 2). Of the top 10% of individuals by degree in the sociometric network, 95% (19 of 20) are in the ethnographic network; of the top 25%, 88% (44 of 50) are represented.
However, the role of our study design in the outcome described above (that high-degree individuals in the sociometric network are generally present in the ethnographic network) should be considered. In the ethnographic network, key respondents have a mean degree of 4.10, while other survey respondents have a mean degree of 1.63. This is likely because the ethnographers knew more about the social connections of key respondents. We call this effect “propinquity bias.” In the sociometric network, key respondents have a mean degree of 6.76 (excluding the four isolates; 5.94 when they are included), while individuals who completed the survey but were not key respondents have a mean degree of 5.64. The larger of these differences is not significant (one-sided permutation t test: t = 1.31, p = .09, 1,000 permutations), and a substantial part of the difference can be attributed to one key respondent with very high degree. This individual is a very high frequency user who makes money partly by selling drugs and by working as a “hit doctor” (helping others find veins to inject in) and is thus predictably well connected in the networks.
Overall, key respondents do not have significantly higher degree than other survey respondents in the sociometric data. Most of the high-degree individuals in the sociometric network were not key respondents (33 of 50 of the top 25% by degree), and as described above, the highest degree individuals in the sociometric network were mostly included in the ethnographic networks. In sum, the degree distribution of the ethnographic network is skewed by propinquity bias, but most actors with high degree in the sociometric network were nevertheless included in the ethnographers’ representation of the core network structure.
We also consider the correlation of betweenness centrality scores across the two networks. Unlike our findings for degree, betweenness scores for individuals appearing in both of the networks are not at all correlated (Pearson’s R = .06, p = .60, calculated using the full networks). This can likely be attributed to the connections between the two main study sites in the sociometric network (Figure 1), compared to the lack of such connections in the ethnographic network. Indeed, if we calculate betweenness on the networks with only “within-sample” nodes and “within-site” edges included (i.e., the subsetted networks with three cross-locality ties in the subsetted sociometric network removed), betweenness scores in the sociometric data do correlate with the ethnographic network (Pearson’s R = .61, p < .001). This suggests that the ethnographers’ network does partly capture betweenness centrality within the local groups that they defined. However, in this case, this within-group structure does not accurately reflect the betweenness of individuals in the broader network.
We also find that, compared with the results for degree centrality, fewer of the individuals with high betweenness centrality in the sociometric network are present in the ethnographic network (e.g., of the top 10% of individuals by betweenness in the sociometric network, only 75%, or 15 of 20, are present in the ethnographic network, compared to 90% for degree). These differences may reflect the tendency for groups to be more cleanly divided into cognitive social structures than in real interactions (Freeman 1992).
Accuracy of Ethnographic Interpretation
We next consider whether patterns of centrality are consistent across the two networks by examining the relationships between centrality, gender, and risk behaviors suggested by the ethnographers. Table 2 shows Spearman’s rank-order correlation results (R and associated p values) for the relationship of self-reported injection frequency (an ordinal variable) with degree. The results confirm a positive relationship between injection frequency and degree in the sociometric network (nonresponding alters are not included as we do not have data on their injection frequency). This correlation does not appear in the ethnographic network, likely because most of the individuals in this network have relatively high injection frequencies. These results suggest that the ethnographers’ intuition about the importance of injection frequency in network position is correct for the larger population of PWID in the region, even if it does not appear in their own representation of the network core.
Because women are much less common than men in our study population, it is more difficult to assess whether women have more connections with other PWID than men. There are three women in the ethnographic network, 19 in the sociometric network, and only two in the overlapping set. In the ethnographic network, the three women have a mean degree of 5.33 and men have a mean degree of 2.15. The difference persists but is greatly reduced in the sociometric network, where women have a mean degree of 4.05 and men have a slightly lower mean degree of 3.84. Overall, the results support the ethnographic interpretations regarding the positive correlation between degree centrality and drug use frequency, but the gender composition of the sample makes it difficult to assess whether women’s social network positions are consistently different than men’s.
Transitivity
Finally, we ask whether the two data sets capture similar patterns of transitivity among network members. The sociometric network has much higher global transitivity than the ethnographic network (Table 2). Global transitivity here is defined as the ratio of triangles to the number of connected triples (i.e., A ↔ B ↔ C) in the network, which gives the probability that two people who have a connection in common are also connected to each other. Triangles are clearly abundant in the sociometric network. The majority of the individuals in the sociometric network who did not belong to any triangles were nonresponding alters. We emphasize again that ties between the alters reported by respondents were not elicited in the network surveys. All triangles in the sociometric network therefore represent the self-reported ties of at least two individuals who participated in the survey.
In contrast, triangles are scarce in the ethnographic network. Unfortunately, because the networks have different densities of edges, it is not straightforward to draw conclusions based on simple comparison of the transitivity values and counts of triangles. Still, it is clear that there is substantial transitivity in the sociometric network that is not reflected in the ethnographic network. This is perhaps partly because ethnographers included fewer ties overall; nevertheless, connected triangles are evidently not a feature that the ethnographers remembered as being particularly important to the network structure.
Returning to the question of propinquity bias, individuals who responded to the survey and appeared in the ethnographic network had a mean of 13.32 triangles in their ego networks. Those who took the survey but were not included in the ethnographic network had a mean of 3.26 triangles in their ego networks. There was no significant difference in the mean number of triangles in the ego networks of key respondents and survey participants who were not key respondents: 12.31 (excluding isolates) and 9.15, respectively (one-sided permutation t test: t = 0.88, p = .20, 1,000 permutations), with the difference in this case entirely driven by one individual with an extremely dense ego network. This suggests that the individuals who were included by the ethnographers in their network representation are individuals who tend to be part of denser clusters in the network (defined here as being surrounded by more triangles).
Discussion
In terms of both nodes and edges, the ethnographic network is largely a subset of the sociometric network. While the ethnographers drew a network with substantially fewer people and ties than the sociometric network, most of the edges they recorded were also reported as active, recent ties by study participants in formal interviews. Individuals who appear in the ethnographic network tend to have higher degree and belong to denser parts of the sociometric network than individuals who participated in the project but who were not included in the ethnographic network. This was not a result of a bias toward key respondents in the sociometric data because in the sociometric data, key respondents differed relatively little from other survey participants. Thus, the ethnographers seemed to be able to home in quite readily toward individuals who formed part of the core of the local PWID network. Further, the ethnographers’ qualitative argument that centrality in the network was partly driven by injection frequency is upheld by the sociometric data.
However, the differences between the ethnographic and sociometric networks are important to consider. First, the correlation of individual degree between the networks was far from perfect. One reason for this is that the ethnographers assigned slightly higher degree to key respondents because they knew and remembered more about these individuals. This problem of propinquity bias should be considered as a potential limitation of ethnographic methods for answering some research questions about social structure (see below).
Second, a further aspect of the sociometric network that the ethnographic network fails to capture is the very high betweenness centrality of some actors who had ties to multiple clusters. These connections to multiple groups were missed or ignored by the ethnographers, perhaps because the individuals’ connection to some clusters was marginal from a social perspective. Missing such connections may be highly problematic, however, as individuals who form bridges between clusters may be particularly important in the transmission of disease (Salathé and Jones 2010) and/or information (Burt 1992), even if they are socially peripheral.
Transitivity also differed greatly between the ethnographic and sociometric networks. Based on past research on cognitive schemas, we expected the ethnographic networks might have more transitive structures than the sociometric data. However, the ethnographic network contained few triangles while the sociometric network contained a large number. The ethnographers did not, it seems, suffer from a cognitive bias toward creating transitive groups. Their bias in terms of creating distinct groups is more evident in the clear division they created between the two main localities in the study. Instead of highlighting transitivity, the ethnographers’ representation highlights stronger relationships among pairs of actors and how the clusters are organized around specific central actors. This different emphasis may have some advantages. By focusing on strong relationships, and by drawing on the added information gleaned from observing interactions, the ethnographic networks may more clearly point to the most central (and potentially influential) actors within the clusters. Nevertheless, such a structure may fail to highlight how quickly diffusion (e.g., of pathogens) might occur in this network.
Overall, the ethnographers’ cognitive network is affected by the uneven amounts of information that they had about people in the network. Further, connections across the network components and the high degree of transitivity have been filtered out in their representation, creating a more organized and defined structure. These patterns reflect some of the cognitive biases outlined by De Soto (1960), Freeman (1992; Freeman et al. 1987), and others (e.g., Kilduff et al. 2008). They also lead us to suggest some hypotheses about what aspects of social structure ethnographers may have more difficulty observing.
First, our ethnographic network suggested separate components for different localities within our study region, but the sociometric data revealed that some of the individuals in the ethnographic networks had ties across multiple local groups. This issue of “bounded communities” is, of course, a classic problem in anthropology. We suggest that the boundaries between local groups visible in the ethnographers’ network are not simply a result of a cognitive bias. In this case, this pattern may be partly attributable to our sampling of key respondents: Only one reported intergroup ties, and this was an individual the ethnographers considered relatively marginal to his local network. Individuals with ties to both the two main network clusters are clearly relatively uncommon in this sample (see Figure 1B).
Ensuring the inclusion of these individuals and their between-group ties in the ethnographic sample would require a study design intended to do so. In view of this finding, we suggest that ethnographers should pay particular attention to marginal group members and people in the study population with intergroup ties, for instance, through purposive sampling of respondents. Such a research strategy may help document social relationships at the interstices of social groupings and better define group boundaries (or the lack thereof). It should be noted, however, that sociometric methods are not immune to this issue, either. In this study, we defined our population of interest as “people who inject drugs” in a rural area of Puerto Rico—a definition of some epidemiological relevance but one that does not necessarily reflect the broader social worlds of our research participants.
Second, the extreme difference in the abundance of triangles in the ethnographic and sociometric networks leads us to suggest that the nature of participant observation may sometimes make it hard to draw conclusions about relationships beyond the dyadic level. In many fieldwork contexts, triangles may be hard to observe: An ethnographer invited to accompany individual A may see that individuals B and C are both linked to A, but for various reasons may not be able to ascertain the nature of B and C’s relationship independent of A. This means that ethnographers may have difficulty in accurately assessing network properties beyond the dyad that likely have important impacts on how people fashion livelihoods and construct community. For instance, structural holes may provide access to diverse resources (e.g., Burt 1992), while network closure may facilitate collective action (e.g., Coleman 1988). This finding highlights the complementary nature of sociometric and ethnographic data but, we think, compels ethnographers to consider how they might better explore the periphery of their informants’ social networks.
Footnotes
Acknowledgments
The content is solely the responsibility of the authors and does not represent the official views of the National Institutes of Health or the National Science Foundation.
Declaration of Conflicting Interests
The author(s) declared no potential conflicts of interest with respect to the research, authorship, and/or publication of this article.
Funding
The author(s) disclosed receipt of the following financial support for the research, authorship, and/or publication of this article: This project was supported in part by a grant from the National Science Foundation program for Enhancing Access to Radio Spectrum (#1443985 and #1638618) and in part by a grant from the National Institutes of Health (R01DA037117).