
Abstract
Most children in Australia bring a packed lunch from home for consumption at school, yet few studies have explored the environmental outcomes of lunchbox contents. This study presents a novel audit methodology that combines food photography with a custom-designed survey developed in REDCap, supported by a detailed coding guide, to assess lunchbox contents, including food, estimated waste, and packaging types. To pilot test the audit tool, two school sites in high socioeconomic regions in South Australia participated. Lunchbox photographs were captured at two time points on a single day (before and after consumption) by the student researcher at the preschool and by a class teacher at the primary school. Independent coding was completed by two researchers, with inter-coder reliability assessed. Among the 40 lunchboxes sampled, the average contents included one vegetable, one to two fruits, one to three grain or cereal items, one dairy product, and one to two snack items. Intraclass correlation coefficient estimates indicated excellent agreement between coders. Food photography on-site, combined with subsequent coding off-site, offers a practical and objective method for assessing food, waste, and packaging in school lunchboxes, while placing minimal burden on participants. Lunchboxes are essential to the nutrition of school-aged children and have sustainability implications. This dual-focus methodology lays the groundwork for future research with larger sample sizes, aiming to inform the development of interventions that improve both the quality of foods in lunchboxes and their environmental impact.
Keywords
Background
Australian children consume one-third of their daily energy intake at school, predominantly through packed lunches brought from home (Bell & Swinburn, 2004). These lunchboxes are often high in discretionary foods, such as packaged snacks and sugary treats (Manson et al., 2021). Recent school food research further highlights low intake of core foods (e.g., vegetables, dairy, and protein) and excessive consumption of discretionary foods (Lalchandani, Hume, et al., 2025). This dietary pattern contrasts sharply with national dietary guidelines (Pearson et al., 2021; Sutherland et al., 2020), making this issue not only unique to Australia. International studies across New Zealand, the United Kingdom, and the United States similarly report that packed lunches are generally less nutritious than school meals (Dresler-Hawke et al., 2009; Evans et al., 2010; Song et al., 2024). Moreover, the composition of children’s lunchboxes has environmental implications. Many discretionary foods (alias ultra-processed foods) have negative environmental impacts due to excessive packaging (Seferidi et al., 2020). Thus, encouraging consumption of less processed and packaged foods can therefore serve dual public and environmental health goals.
In the Australian context, lunch is more than just a meal as it is a culturally embedded aspect of the school day, shaped by family routines, peer dynamics, and school policies (Lalchandani et al., 2021; Lalchandani, Miller, et al., 2025). Despite its importance, recent, comprehensive audits of Australian lunchbox contents are scarce, with most studies over a decade old (Bell & Swinburn, 2004; Brennan et al., 2010; Evans et al., 2010; Kelly et al., 2010; Sanigorski et al., 2005). A more recent exception (Sutherland et al., 2020) did not assess food packaging or waste, underscoring an ongoing evidence gap. A scoping review of 10 global studies from Australia, the United States, Spain, New Zealand, and the United Kingdom further highlights the limited attention paid to packaging in school food research (Lalchandani et al., 2023), calling for updated, contextually relevant methods.
To date, digital photography has emerged as a validated and low-burden method for evaluating lunchbox contents (Elliott et al., 2021; Taylor et al., 2018). While traditional methods such as 24-hour recalls, observation-based checklists, and self-reported dietary logs provide valuable insights (Brennan et al., 2010; Farris et al., 2015; Sanigorski et al., 2005), they often involve nutrition-dense data collection, higher participant burden, and greater potential for recall bias. Combining digital photography with food weighing or disassembly has been used to gain granular detail (e.g., sandwich components), but is often disruptive and impractical for large-scale or school-based studies (Gauthier et al., 2013; Hubbard et al., 2014; Kelly et al., 2010; Mitchell et al., 2009).
Purpose and Aims
Assessing lunchbox contents from both a food and environmental perspective remains underexplored, highlighting the need for a suitable methodology. A pragmatic approach that considers lunchbox contents in terms of “whole food groups,” rather than focusing on individual micro- and macro-nutrients and the traditionally reductionist approach to nutrition research (Hoffmann, 2003), may offer an effective way to assess food, packaging, and waste using photography-based methods. Therefore, the aims of this study were to:
Develop a photography-based coding tool to assess lunchbox contents for food, waste, and packaging attributes; and
Pilot test the tool by reporting lunchbox contents and inter-coder reliability to evaluate its utility for capturing the nutritional and environmental dimensions of children’s lunchboxes in contemporary Australian primary schools.
Methods
Study Design and Setting
This study is informed by a systems-oriented nutrition and sustainability perspective. Rather than adopting a reductionist focus on individual nutrients (Hoffmann, 2003), we apply a whole-food-group lens to capture the broader patterns that drive both nutritional quality (National Health and Medical Research Council, 2013) and environmental impacts (Seferidi et al., 2020). Our theory of change assumes that developing a tool capable of assessing lunchbox contents holistically and obtaining integrated data on food, waste, and packaging can reduce data-collection burden and enable the development of more practical strategies that will benefit children’s health and planetary wellbeing.
Pilot testing of the tool was conducted at a preschool and primary school in Metropolitan Adelaide, South Australia. Demographic data included school type, socioeconomic status (SES), class year level, and age range of students. SES was derived from the Australian Bureau of Statistics’ (2018) Index of Relative Socioeconomic Advantage and Disadvantage (IRSAD). The study was approved by the Human Research Ethics Committee at the University of Adelaide (Approval Number H-2020-167). The Department for Education, Government of South Australia, also granted approval to conduct this research project and access school sites (Reference No: 2020-0036).
Recruitment
Convenience sampling was used, facilitated by KESAB environmental solutions (industry partner of this project), based on their relationships with local schools. Participating schools were sent the study information and consent form for the head of school to sign. A project information flyer was sent to parents by the school staff, along with a consent form for preschool parents (requested by the principal) and an opt-out form for primary school parents. The research emphasized that it would only collect and report broad, anonymous data on lunchbox food, waste, and packaging, without any personal identifiers. Verbal assent was obtained from students before photographing their lunchboxes before and after eating. Staff knew the audit date, but parents and students were unaware, reducing bias.
Survey Development
A survey was created using REDCap (Research Electronic Data Capture), a secure, web-based platform designed for building online surveys and managing research data (Harris et al., 2009, 2019), inspired by Kelly et al. (2010), although their methodology involved weighing food and did not include waste and packaging coding. Our survey captures food/beverage contents and packaging (Time 1 photograph), additional packaging not visible in the Time 1 photograph and unconsumed food/waste (Time 2 photograph). The data dictionary retrieved from REDCap is provided as Supplemental 1. An extensive coding manual was also created to guide the coding process (see Supplemental 2).
Data-Collection Procedure
Lunchbox photographs were taken by the researcher at a preschool in December 2020, a site that volunteered to participate in the pilot study, prior to involvement in the main study (Lalchandani, Hume, et al., 2025). Due to a subsequent COVID-19 outbreak restricting visitors on school sites, photographs at a primary school were captured by the class teacher in August 2021. Lunch orders and purchases made from the school canteen were not observed in the study.
Timing and Setup
Photographs were taken at two time points on a single day: before any food consumption at recess or morning break (Time 1) and after the lunch break when children had finished eating (Time 2). School staff decided where the photographs would be taken, either outdoors on a mat or on children’s desk in the classroom. This observational study was similar to the protocol by Hubbard et al. (2014), with the key difference being that food contents remained in the lunchboxes rather than being spread on a placemat. Children were asked to open containers or unwrap opaque packaging (e.g., aluminum foil or paper bags). Assistance by the teacher or researcher was provided upon request. Children were requested not to dispose of any uneaten food until after Time 2 photographs were taken.
Photography Process
Photographs were taken using a digital camera by the researcher, and a tablet by the teacher. It took approximately 10 minutes to photograph all lunchboxes at each time point at each site. Time 1 and Time 2 photographs for each lunchbox were paired into a combined image file, with personal identifiers (e.g., labels/stickers mentioning children’s names) blurred to maintain anonymity. No additional information was requested from the children regarding their food. However, additional notes were taken by the researcher in case items were not clearly captured in the photographs.
Data Coding and Entry
In this study, an “item” was defined as any distinct food or beverage within a category, based on its primary nutritional composition. The number of distinct food, beverage, and packaging items in the lunchbox was recorded (e.g., strawberries and apples were coded as two separate fruit items), but multiple instances of the same food item (e.g., the number of strawberries and blueberries) were not recorded. However, two apples, or two sandwiches, or two packets of potato crisps were distinctly counted as n = 2. This approach streamlined the coding process, ensuring consistent capture of the range of food and packaging, and whether items were fully eaten, partially eaten, or uneaten.
Food and Beverage Categories
Items were categorized by their predominant nutritional composition. Eight food and beverage categories were used, based on the five core food groups from the Australian Guide to Healthy Eating (National Health and Medical Research Council, 2013), and three additional categories for common lunchbox items. These categories included: (1) vegetables (excludes legumes/beans); (2) fruits; (3) grains or cereals (includes breads, cakes, biscuits); (4) protein and alternatives (includes meat, seafood, poultry, eggs, and legumes/beans); (5) dairy and alternatives (includes milk, yogurt, cheese and their alternatives); (6) snacks (or extras), that is, light foods eaten between regular meals, including pre-packaged items; (7) mixed meals, that is, dishes with multiple core ingredients; and (8) drinks (excludes reusable water bottle from home). The list of items within these eight broad categories was based on the AUSNUT (AUStralian Food and NUTrient Database), developed for the 2011–2013 Australian Health Survey (Food Standards Australia New Zealand, 2014).
Food Waste Categories
Lunchbox waste in all eight food categories was coded as “No waste,” “Some waste,” or “All waste.” In addition, two options were included, namely “Unidentifiable” (for items present but hidden/in opaque containers) and “Missing Data” (for items missing in Time 2 photo). Packaged items were assumed to have no waste if missing in Time 2 photo, as children were asked to leave uneaten items in their lunchboxes. The same assumption applied to whole fruits, as most children disposed of scraps (e.g., apple cores, banana peels) in school compost bins if available.
Packaging Categories
Packaging for each food and beverage item was coded for presence/absence and subsequently categorized by type. Three categories were established based on South Australia’s curbside waste system: “Organics” (green bins), “Recyclables” (yellow bins), and “Single-use or landfill” (red or blue bins depending on Local Government Area). An additional category, “Reusables,” was included to account for items in smaller containers, excluding the main lunchbox or bags containing multiple items. Unpackaged food items were recorded under “No packaging.” The presence/absence of organic waste (e.g., peels or cores) was also coded.
Pilot Testing
Pilot testing involved coding lunchbox contents observed in the preschool and primary school, respectively, resulting in two main version updates to the survey. Preschool photographs were coded in duplicate by NL and CJM, while primary school photographs were coded by NL and CH. Disagreements in coding were discussed, leading to the removal of redundant variables and the addition of new ones to capture additional attributes (e.g., photo status to record presence/absence of Time 1 and Time 2 photos, number of reusable containers). Food and drink categories, packaging classifications, and waste categories were refined and simplified from detailed percentages (0% [food eaten—no waste], up to 25% [some waste], up to 50% [partially uneaten], up to 75% [mostly wasted], and 100% [untouched—all wasted]) to three broad categories (“No waste,” “Some waste,” and “All waste”). Additional instructions were integrated to the tool and coding manual for a more standardized coding process. After finalizing the REDCap database, NL and JH independently coded all photographs for the assessment of inter-coder reliability.
Statistical Analysis
Descriptive statistics were used to characterize school types, children, and the number of lunchboxes. Lunchbox contents, including food and beverage items, waste, and packaging, were summarized with counts and percentages. Intraclass correlation coefficients (ICC) with 95% confidence intervals (CIs) were calculated to estimate inter-coder reliability, for food items, waste, and packaging. Indicator variables were derived for the presence/absence of items, and ICCs were calculated for each indicator.
For waste analysis, scores were assigned to each item: none (score = 0), some (0.5), all waste (1), or unidentifiable/missing (0). Higher scores indicated more waste. For packaging, scores were assigned to each item based on type: no packaging (score = 0), reusable (0.25), organic (0.5), recyclable (0.75), or single-use (1). Higher scores indicated less desirable packaging. For each waste and packaging variable, assigned scores were summed and divided by the number of items in each food and beverage category in the lunchbox to obtain an average score for waste and packaging, respectively. Total waste and packaging scores were then calculated by summing the component scores, and a single ICC estimate with 95% CIs was subsequently derived. This approach was necessary because the order in which food items are coded can lead to mismatches in the alignment of waste and packaging data with the associated item. For example, if two coders code two different snacks (i.e., Snack 1 and Snack 2) in a different order, with one coded as having recyclable packaging and the other single-use or landfill, the packaging variables assigned (i.e., “Single-use or landfill Type: Snack 1 (choice = Soft plastic or silver-lined wrapper)” and “Recyclables Type: Snack 1 (choice = Cardboard or carton)”) will not align. This occurs even if the same packaging types are selected for both items, simply due to the difference in the order in which the snacks are coded. This issue of misalignment justifies the aggregation of waste and packaging scores to prevent discrepancies and potential mismatches that could distort individual category-level reliability estimates.
ICCs were interpreted for reliability based on established criteria (Koo & Li, 2016) as follows: >0.90 (excellent), 0.75–0.90 (good), 0.50–0.75 (moderate), and <0.50 (poor). Statistical analyses were performed using STATA/MP version 17 (StataCorp, College Station, TX, USA).
Results
The pilot lunchbox audit was conducted in a high socioeconomic preschool and primary school. Table 1 shows sample characteristics. Preschool children were aged 3–5, while primary school (Year 5) children were aged 9–11. A total of 49 children were present on audit day (n = 24 [49%] preschool and n = 25 [51%] primary school), and all of them brought a lunchbox to school. Four parents opted out (8.2% non-participation rate). Forty-five lunchboxes were photographed, but only 40 were included in the analysis because 5 lunchboxes were missing Time 1 photographs (due to non-attendance in the morning/food consumption prior to audit). No lunch orders were made at the primary school on the day of the audit.
Sample Characteristics
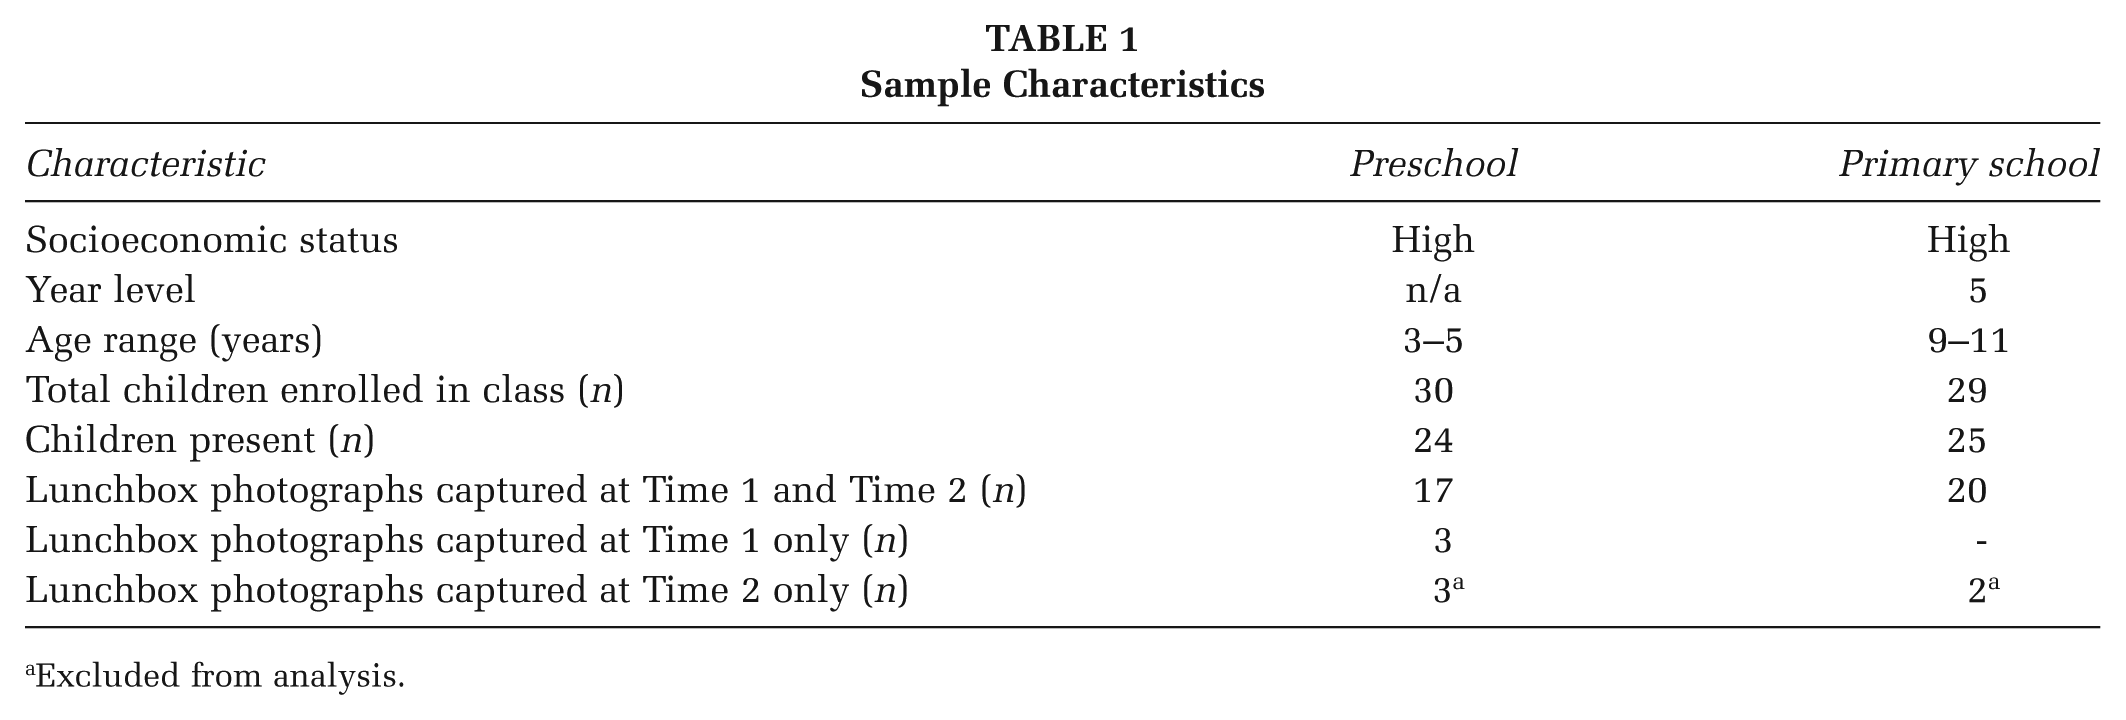
Excluded from analysis.
Lunchbox Contents
On average, lunchboxes contained one vegetable, one to two fruits, one to three grains or cereals, one dairy item, and one to two snacks. Across the 40 lunchboxes, the most common food category was grains or cereals (92.5%), followed by fruits (67.5%), vegetables (37.5%), snacks or extras (55%), and dairy. Fruits were more prevalent in preschools (85%) than primary schools (50%), while snacks were more common in primary schools (65% vs. 45%). Mixed meals (5%) and drinks (2.5%) appeared infrequently. Common items within each food and beverage category were as follows: vegetables (cucumbers, cherry tomatoes, and carrots); fruits (apples, mandarins, and strawberries); grains or cereals (sandwiches, savory biscuits, sweet biscuits, and baked products such as cakes); protein (processed meats such as ham and sausage); dairy (flavored yogurt and cheese); snacks or extras (potato crisps, popcorn, grains/cereal/fruit bars, fruit straps); mixed meals (pasta/rice-based dishes); and drinks (reconstituted fruit juice). Table 2 summarizes the frequency of items, waste, and packaging characteristics.
Description and Frequency of Food and Beverage Items Along With Food Waste and Packaging Characteristics in Sample of 40 Lunchboxes Audited
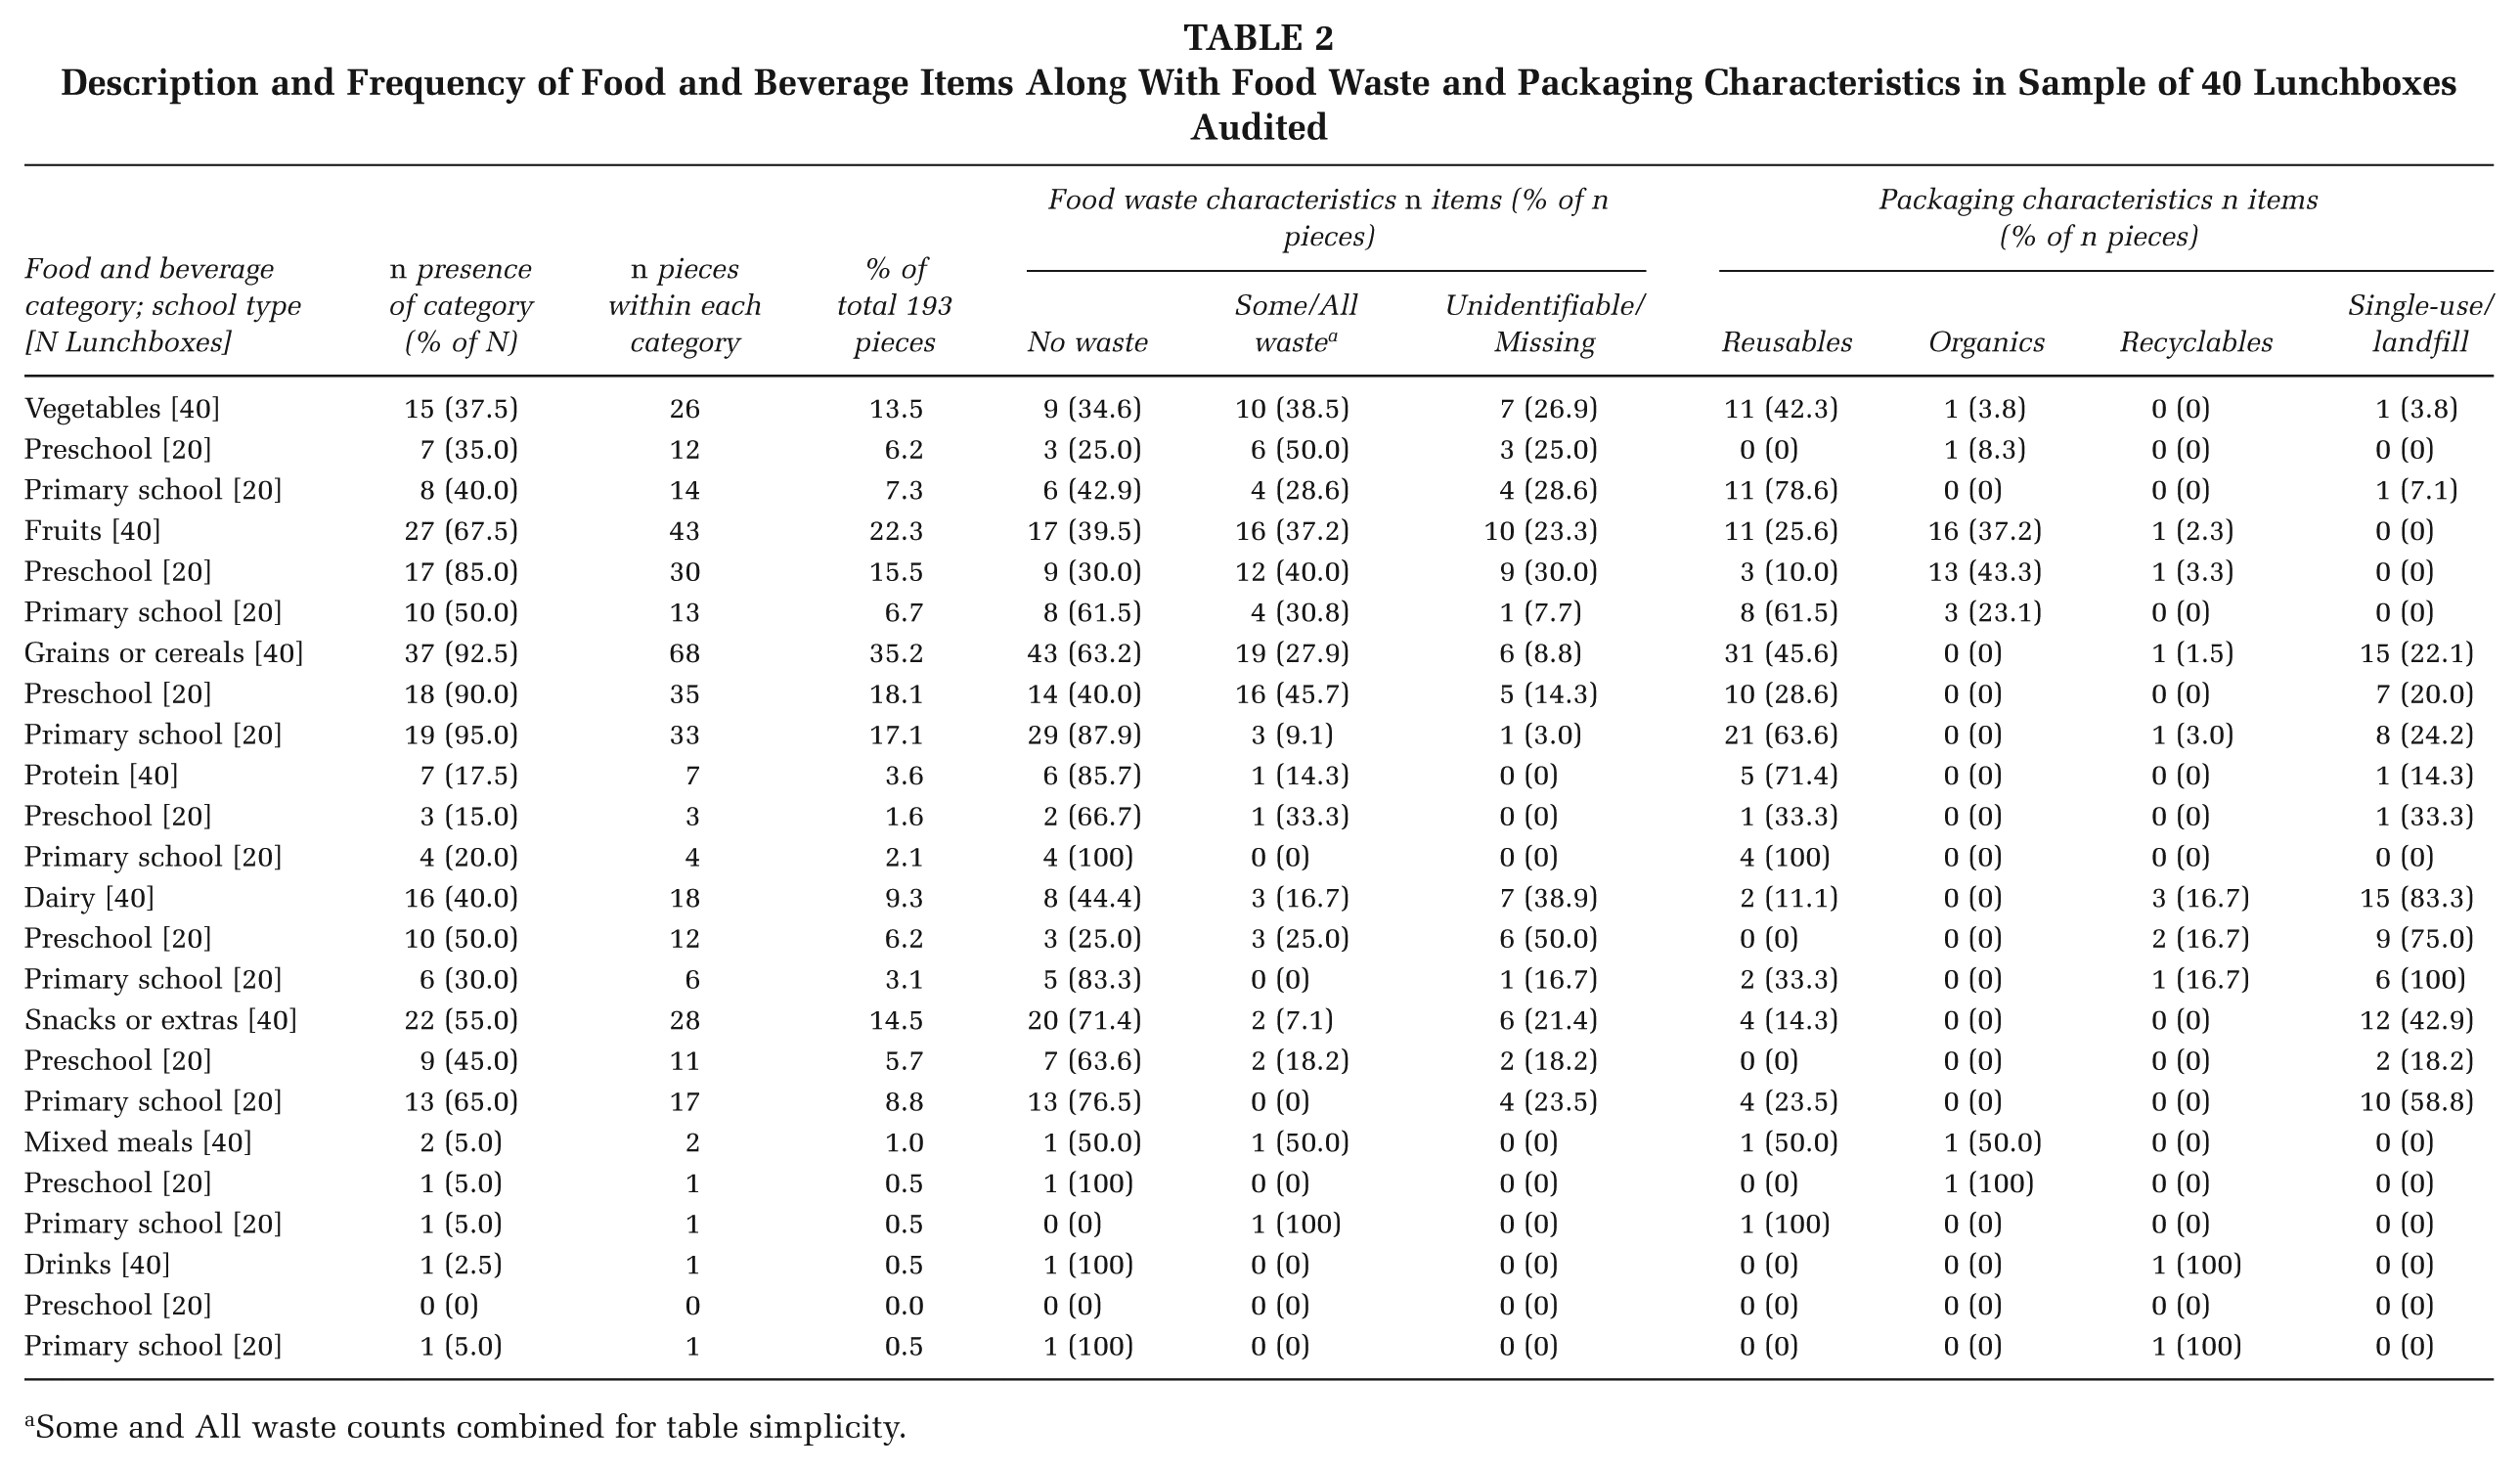
Some and All waste counts combined for table simplicity.
Food Waste
Food waste varied across categories. Grains or cereals (63.2% “no waste”), snacks or extras (71.4%) and protein foods (85.7%) were least likely to be wasted. Fruits and vegetables had higher waste rates, with only 39.5% and 34.6% categorized as “no waste,” respectively. Dairy items showed moderate waste (44.4% “no waste”).
Packaging
Lunchboxes were packed in either a compartmentalized bento-style box (45%) or a lunch bag (47.5%). Bento boxes were more common in preschools (70%) than among primary students (20%), whereas lunch bags were slightly more common in primary schools (55%) vs. preschools (40%). Reusable packaging was most frequently used for grains or cereals (45.6%) and vegetables (42.3%), while organic packaging was primarily associated with fruits (37.2%). Recyclable packaging was rare across all food categories. Single-use packaging was prevalent for dairy (83.3%) and snacks (42.9%). Compared to preschools, primary schools consistently showed greater reliance on single-use packaging, particularly for dairy (100% in primary schools vs. 75% in preschools) and snacks (58.8% in primary schools vs. 18.2% in preschools). Examples of single-use packaging included squeeze pouches for yogurt and soft plastics for discretionary snacks.
Inter-Coder Reliability
Across the 40 lunchboxes coded in duplicate, inter-coder reliability was high. Of 153 ICC estimates for food/beverage item presence and absence (see Table 3), 134 estimates showed excellent reliability (ICC > .9), seven were good (ICC = .75–.9), six were moderate (ICC = .5–.75), and six could not be calculated due to insufficient observations (n = 0–1).
Summary of Intraclass Correlation Coefficients (ICCs) for Food and Beverage Categories.
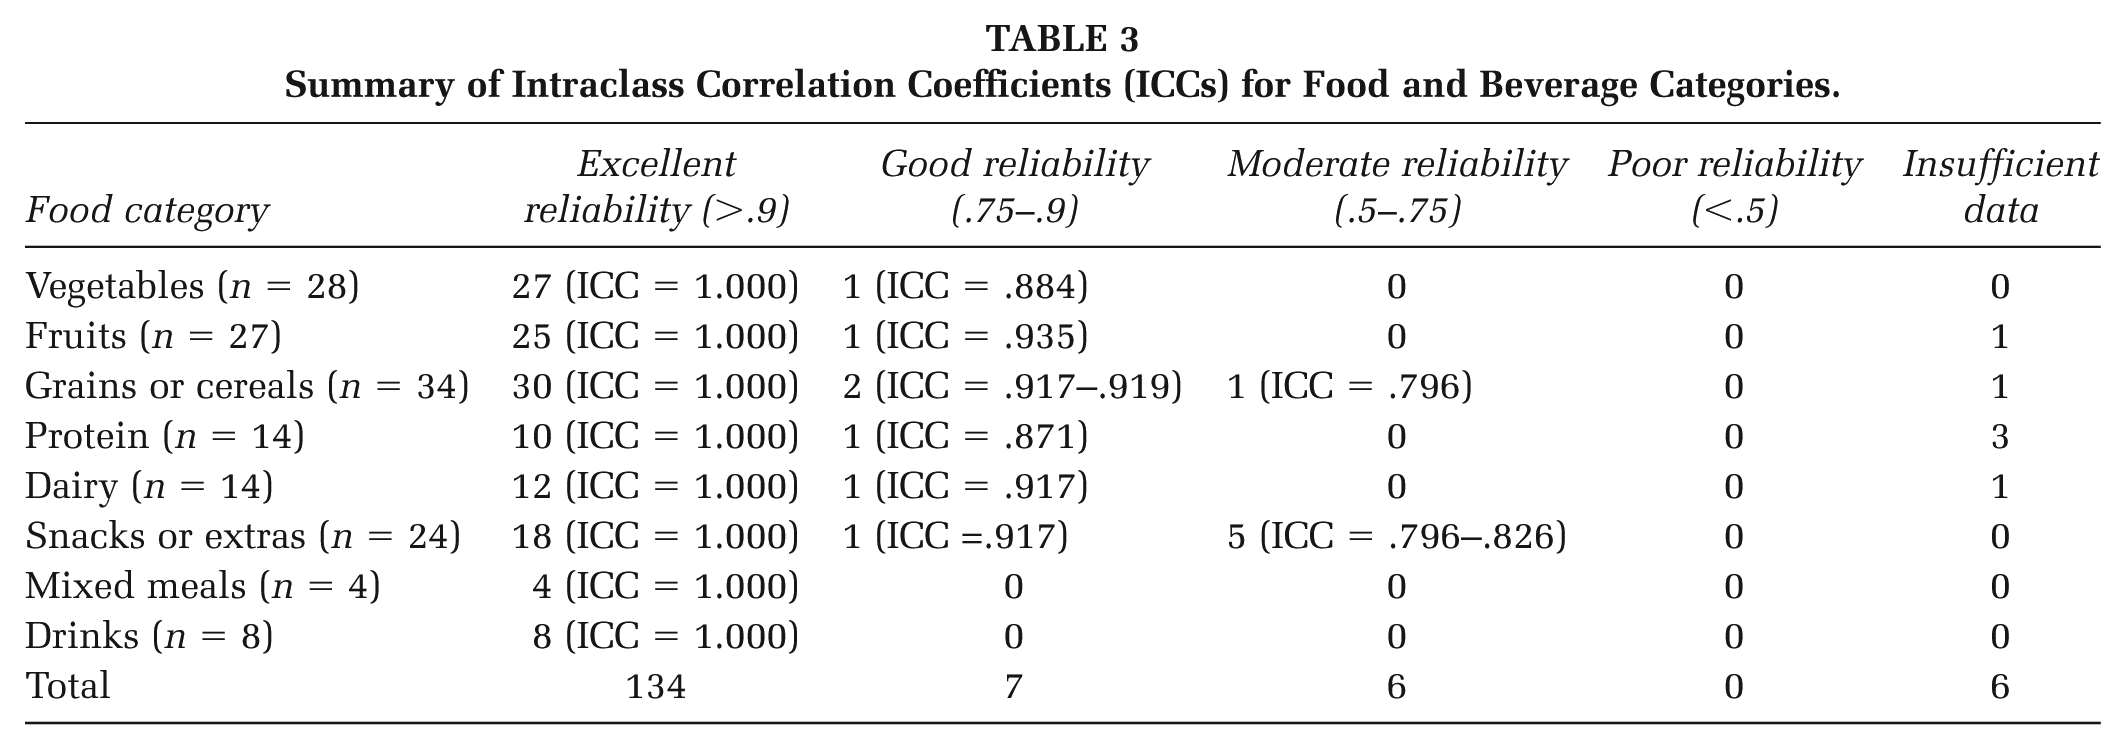
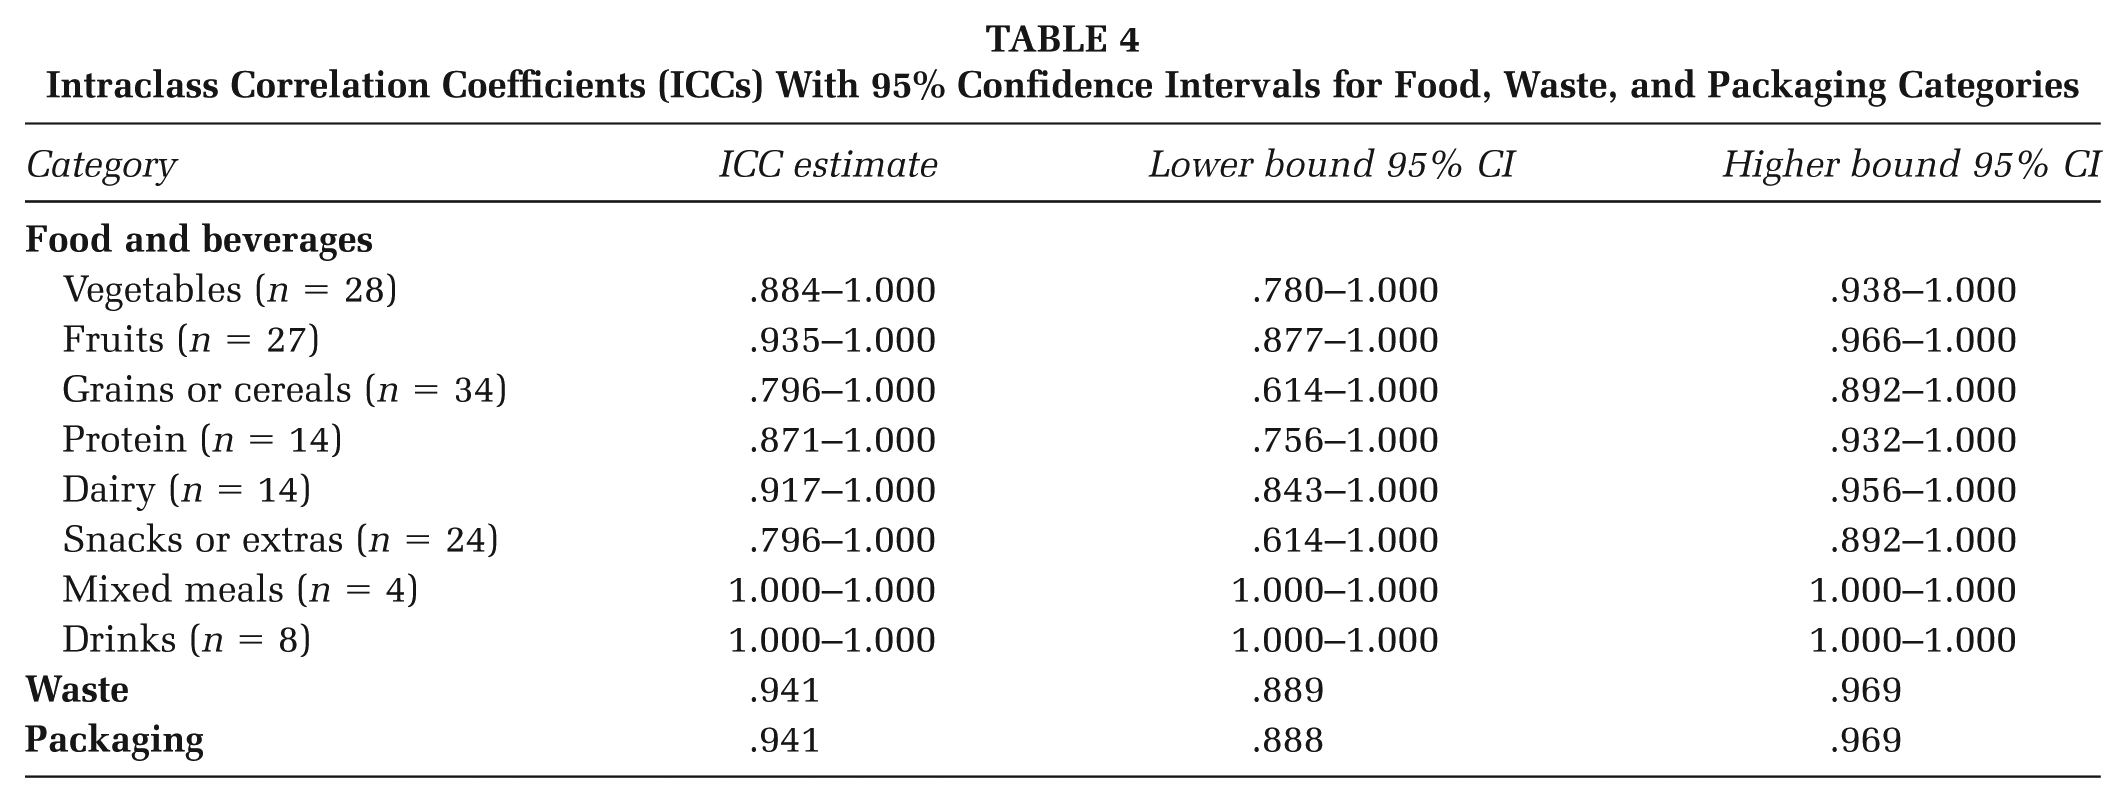
Table 4 presents the range of ICC estimates with 95% CIs for food, waste, and packaging. Reliability was consistently high across food categories (ICC = .796–1.000), with perfect agreement for mixed meals and drinks. Fruits, dairy, vegetables, and protein all showed strong to excellent reliability. Grains or cereals and snacks have slightly lower, but still strong, reliability. Aggregate ICC estimates for waste and packaging were also indicative of excellent reliability. These results demonstrate high consistency and reliability in data collection.
Intraclass Correlation Coefficients (ICCs) With 95% Confidence Intervals for Food, Waste, and Packaging Categories
Discussion
Very few studies have applied both a food and an environmental lens to school lunchbox audits, particularly assessing for packaging. While food photography has been validated in previous research (Elliott et al., 2021; Gauthier et al., 2013; Hubbard et al., 2014; Mitchell et al., 2009; Sabinsky et al., 2013), the novelty of this study lies in the integration of food waste and packaging considerations into lunchbox observations, and broadly focusing on “whole food groups.” The photographic method used here is quick, simple, and non-intrusive, preserving food presentation and reducing burden on students and staff (Mitchell et al., 2009). While it did not capture micro-levels detail such as the type of bread (e.g., white, wholemeal, wholegrain/multigrain), sandwich fillings, or dairy type (e.g., full cream or low-fat); it allowed for later-stage coding of food, packaging, and waste, avoiding the need for extensive on-site data collection during school hours (Kelly et al., 2010).
Importantly, this method offers a practical snapshot of children’s food choices, preferences, and waste patterns. Beyond practical benefits, the high inter-coder reliability further confirms the tool’s ability to capture and categorize items through photographs. While it captures only one meal and does not represent total daily intake, the findings reveal meaningful trends. For instance, discretionary snacks had the lowest waste rates, indicating higher preference compared to vegetables and fruits, consistent with previous research (Bell & Swinburn, 2004; Brennan et al., 2010; Hubbard et al., 2014; Kelly et al., 2010; Sanigorski et al., 2005). The same discretionary items, aside from being commonly “nutritionally inadequate and unnecessary,” contribute to increased environmental burden (Seferidi et al., 2020). This tool has been used to characterise the contents of South Australian lunchboxes in a relatively large sample (n = 673), delivering the most recent statistics on their food and packaging contents (Lalchandani, Hume, et al., 2025).
However, there are several limitations worth noting. The tool does not incorporate nutritional metrics and fiducial markers, preventing accurate quantification of portion sizes or determination of healthiness classification. Rather, it focuses on counting distinct items, which limits comparisons to nutritional standards. However, even broad classification into core and discretionary categories (National Health and Medical Research Council, 2013), allows for some alignment with national dietary guidelines, although it is important to note that food and drinks brought from home for consumption at school are not explicitly covered by national guidelines (Lucas et al., 2017), limiting formal benchmarking after all. In addition, sandwiches and wraps were not disassembled to analyze their fillings, likely underrepresenting protein (e.g., meats) and dairy (e.g., cheese) items. The study only captured food consumption during school hours, so uneaten food may have been consumed after school, and therefore may not have been wasted as coded. The tool also does not capture disposal behavior (e.g., composting or recycling), which limits insights into packaging diversion. Finally, the small sample size limits generalizability. Despite these considerations, this tool provides a valuable foundation for monitoring and improving school food environments by bridging nutrition and sustainability in an accessible and replicable way.
Implications for Practice
This audit tool offers a practical, scalable, and low-burden method for assessing children’s lunchbox contents across three integrated domains: food, packaging, and waste, by generating data at the whole group level, rather than focusing narrowly on nutrients. The tool can be used by health-promotion practitioners to support schools in conducting lunchbox audits to identify priority areas (e.g., high prevalence of packaged discretionary foods, limited vegetable inclusion, and excessive single-use packaging), which can then inform tailored action plans. It can also help translate audit findings into practical, family-facing communication strategies, which may include co-developing lunchbox guidelines that integrate both nutrition and sustainability principles, creating visual resources (e.g., whole food swaps, reusable packaging guides), and highlighting peer-endorsed lunchbox examples to shift norms. School-community partnerships can be facilitated by sharing audit findings with local councils, waste management services, or community nutrition programs to co-design interventions. Importantly, because the method is minimally intrusive and places a limited burden on students and families, it may be particularly suitable for low-resource settings or schools without centralized meal provision. Its adaptability makes it relevant not only in Australia but also in contexts where meals are brought from home and where centralized monitoring systems are absent.
Implications for Research
This study establishes a foundation for future research examining the nutritional and environmental dimensions of school lunchboxes using an integrated, photography-based audit methodology. Future studies can apply this tool in diverse school settings, including secondary schools, rural and remote communities, and socioeconomically disadvantaged settings where dietary inequities may be more pronounced. Lunchbox content patterns across different cultural and ethnic communities can be investigated to better understand food practices, packaging norms, and waste behaviors within varied sociocultural contexts. Seasonal and temporal variations in lunchbox contents and waste generation can be explored by conducting longitudinal studies. The effectiveness of policy and interventions can be evaluated by conducting pre- and post-assessments, such as those aimed at improving lunchbox healthiness and minimizing single-use packaging.
However, researchers using this tool should remain mindful of the method’s limitations. The reliance on photographic data presents challenges in estimating portion sizes and identifying composite foods (e.g., sandwich fillings or homemade mixed dishes). Cultural, policy, and resource differences may influence adoption and alignment with local dietary guidelines. Ongoing refinement of the coding guide, survey interface, and statistical coding may be required to enhance usability across contexts.
Conclusions
Overall, the pilot demonstrated that the photography-based coding tool effectively captured both nutritional and environmental attributes of children’s lunchboxes. Grains/cereals and fruits were the most commonly packed items, while vegetables appeared in fewer than half of lunchboxes. Waste patterns reflected children’s food preferences, with minimal waste for grains/cereals and snacks, and higher waste for fruits and vegetables. Single-use packaging was widespread, particularly for dairy and snacks, and more common among primary school children. Inter-coder reliability was consistently high across food, waste, and packaging measures, indicating strong feasibility and robustness of the tool.
Using lunchbox photographs for retrospective data coding offers an objective method to assess food, packaging, and waste without being intrusive or placing undue burden on children, parents, or school staff. Despite limitations, such as the absence of nutritional quantities and profiles of composite foods and non-assessment of disposal behaviors, the tool provides a low-burden method for capturing meaningful data on lunchbox contents and waste. As such, it holds strong potential for application in large-scale studies and intervention research aimed at improving the nutritional quality of lunchboxes while simultaneously reducing packaging.
Supplemental Material
sj-docx-1-hpp-10.1177_15248399261435623 – Supplemental material for Development and Pilot Testing of a Novel Methodology to Examine the Food, Waste, and Packaging in Australian Schoolchildren’s Lunchboxes
Supplemental material, sj-docx-1-hpp-10.1177_15248399261435623 for Development and Pilot Testing of a Novel Methodology to Examine the Food, Waste, and Packaging in Australian Schoolchildren’s Lunchboxes by Neha Lalchandani, Caroline Miller, Lynne Giles, Jo Hendrikx, Shona Crabb, Carly Moores and Clare Hume in Health Promotion Practice
Supplemental Material
sj-pdf-2-hpp-10.1177_15248399261435623 – Supplemental material for Development and Pilot Testing of a Novel Methodology to Examine the Food, Waste, and Packaging in Australian Schoolchildren’s Lunchboxes
Supplemental material, sj-pdf-2-hpp-10.1177_15248399261435623 for Development and Pilot Testing of a Novel Methodology to Examine the Food, Waste, and Packaging in Australian Schoolchildren’s Lunchboxes by Neha Lalchandani, Caroline Miller, Lynne Giles, Jo Hendrikx, Shona Crabb, Carly Moores and Clare Hume in Health Promotion Practice
Footnotes
Authors’ Note:
The authors would like to thank their industry partner KESAB Environmental Solutions for supporting this project and their assistance with the recruitment of sites. The authors also wish to acknowledge the staff, students, and parents from participating schools; without their support, this study would not have been possible. The authors also thank Danielle Proud from the Department for Education for her valuable insights. The authors disclosed receipt of the following financial support for the research, authorship, and/or publication of this article: This work was supported by the University of Adelaide Faculty of Health and Medical Sciences Divisional Scholarship awarded to Neha K. Lalchandani. CLM is supported by a National Health and Medical Research Council Investigator Grant GNT1195421.
References
Supplementary Material
Please find the following supplemental material available below.
For Open Access articles published under a Creative Commons License, all supplemental material carries the same license as the article it is associated with.
For non-Open Access articles published, all supplemental material carries a non-exclusive license, and permission requests for re-use of supplemental material or any part of supplemental material shall be sent directly to the copyright owner as specified in the copyright notice associated with the article.