
Abstract
As a critical narrative intervention, photovoice invites community members to use photography to identify, document, and discuss issues in their communities. The method is often employed with projects that have a social change mandate. Photovoice may help participants express issues that are difficult to articulate, create tangible and meaningful research products for communities, and increase feelings of ownership. Despite being hailed as a promising participatory method, models for how to integrate diverse stakeholders feasibly, collaboratively, and rigorously into the analytic process are rare. The DEPICT model, originally developed to collaboratively analyze textual data, enhances rigor by including multiple stakeholders in the analysis process. We share lessons learned from Picturing Participation, a photovoice project exploring engagement in the HIV sector, to describe how we adapted DEPICT to collaboratively analyze participant-generated images and narratives across multiple sites. We highlight the following stages: dynamic reading, engaged codebook development, participatory coding, inclusive reviewing and summarizing of categories, and collaborative analysis and translation, and we discuss how participatory analysis is compatible with creative, interactive dissemination outputs such as exhibitions, presentations, and workshops. The benefits of Visualizing DEPICT include feelings of increased ownership by community researchers and participants, enhanced rigor, and sophisticated knowledge translation approaches that honor multiple forms of knowing and community leadership. The potential challenges include navigating team capacity and resources, transparency and confidentiality, power dynamics, data overload, and streamlining “messy” analytic processes without losing complexity or involvement. Throughout, we offer recommendations for designing participatory visual analysis processes that are connected to critical narrative intervention and social change aims.
Keywords
Photovoice is a community-based participatory research method, advocacy tool, and health promotion strategy wherein participants use photography to represent their perspectives (Hergenrather et al., 2009). Informed by Freire’s (2000) concept of conscientization, photovoice participants critically take and analyze pictures to produce knowledge, exchange strategies, and develop collective action plans (Catalani & Minkler, 2010; C. Wang & Burris, 1994). Originally developed by C. Wang and Burris (1997), photovoice follows a set of predefined steps: (1) brainstorming and prompt delivery, (2) photography and ethics training, (3) photo taking and discussion, (4) group analysis, and (5) dissemination. The process can be adapted to local contexts, cultures, and settings (Castleden et al., 2008; Catalani & Minkler, 2010; Switzer et al., 2015).
C. Wang and Burris (1994) promoted the SHOWeD method to support photograph discussion, analysis, and action planning (Shaffer, 1979). The acronym stands for (1) What do you See here? (2) What is really Happening here? (3) How does this relate to Our lives? (4) Why does this condition Exist? (and) (5) What can we Do about it? This approach can generate a rich data set of participant-generated photographs and associated narratives. However, photovoice can sometimes fall short of its emancipatory aims (Nykiforuk et al., 2011; Switzer, 2019). Several comprehensive reviews (Coemans et al., 2019; Evans-Agnew & Rosenberg, 2016; Hergenrather et al., 2009) have noted that how projects move from discussion toward analysis, dissemination, and action planning is far less prescribed and often researcher (rather than participant) driven. Similarly, although many rich analytic photovoice models are beginning to surface (Capous-Desyllas & Bromfield, 2018; Chapman et al., 2017; Q. Wang & Hannes, 2020), these are often oriented toward researcher-driven analysis. This seems like a missed opportunity for a method with such participatory promise.
In this article, we describe how we adapted Flicker and Nixon’s (2015) DEPICT (Dynamic reading, Engaged codebook development, Participatory coding, Inclusive reviewing and summarizing of categories, and Collaborative analysis and Translation) model for collaborative qualitative analysis to conduct participatory visual analysis in multisite photovoice studies. Originally developed to analyze text-based data within a single site, DEPICT enhances rigor and trustworthiness by including diverse stakeholders in the analysis process (Lennie, 2006). The context of our discussion was our experience with Picturing Participation, a study that explored how stakeholders conceptualize engagement at three HIV community-based organizations. We share the analytic steps we took and the opportunities for co-theorizing afforded by creative dissemination outputs. We discuss the benefits and challenges of our model and offer recommendations for designing feasible participatory visual analysis processes that are grounded in a commitment to co-theorizing, co-analysis, and critical narrative inquiry.
Background
Study Context and Partnership
Picturing Participation was a community-based participatory research project that used case study design, along with photovoice, to explore how stakeholders within and across three HIV organizations conceptualized engagement and associated sociopolitical, ethical, and organizational issues. The three partnering organizations, all in Toronto, Canada, were (1) Casey House, Canada’s only subacute hospital for people living with HIV; (2) Toronto People with AIDS Foundation, an AIDS service organization with a large peer volunteer program; and (3) EMPOWER, a youth-led HIV prevention program. Our goal was to create a process and resources to support organizations in having more nuanced conversations about engagement within and across the HIV sector (for further details on methods and findings, see Switzer, 2019, 2020; Switzer et al., 2020; Switzer et al., 2021).
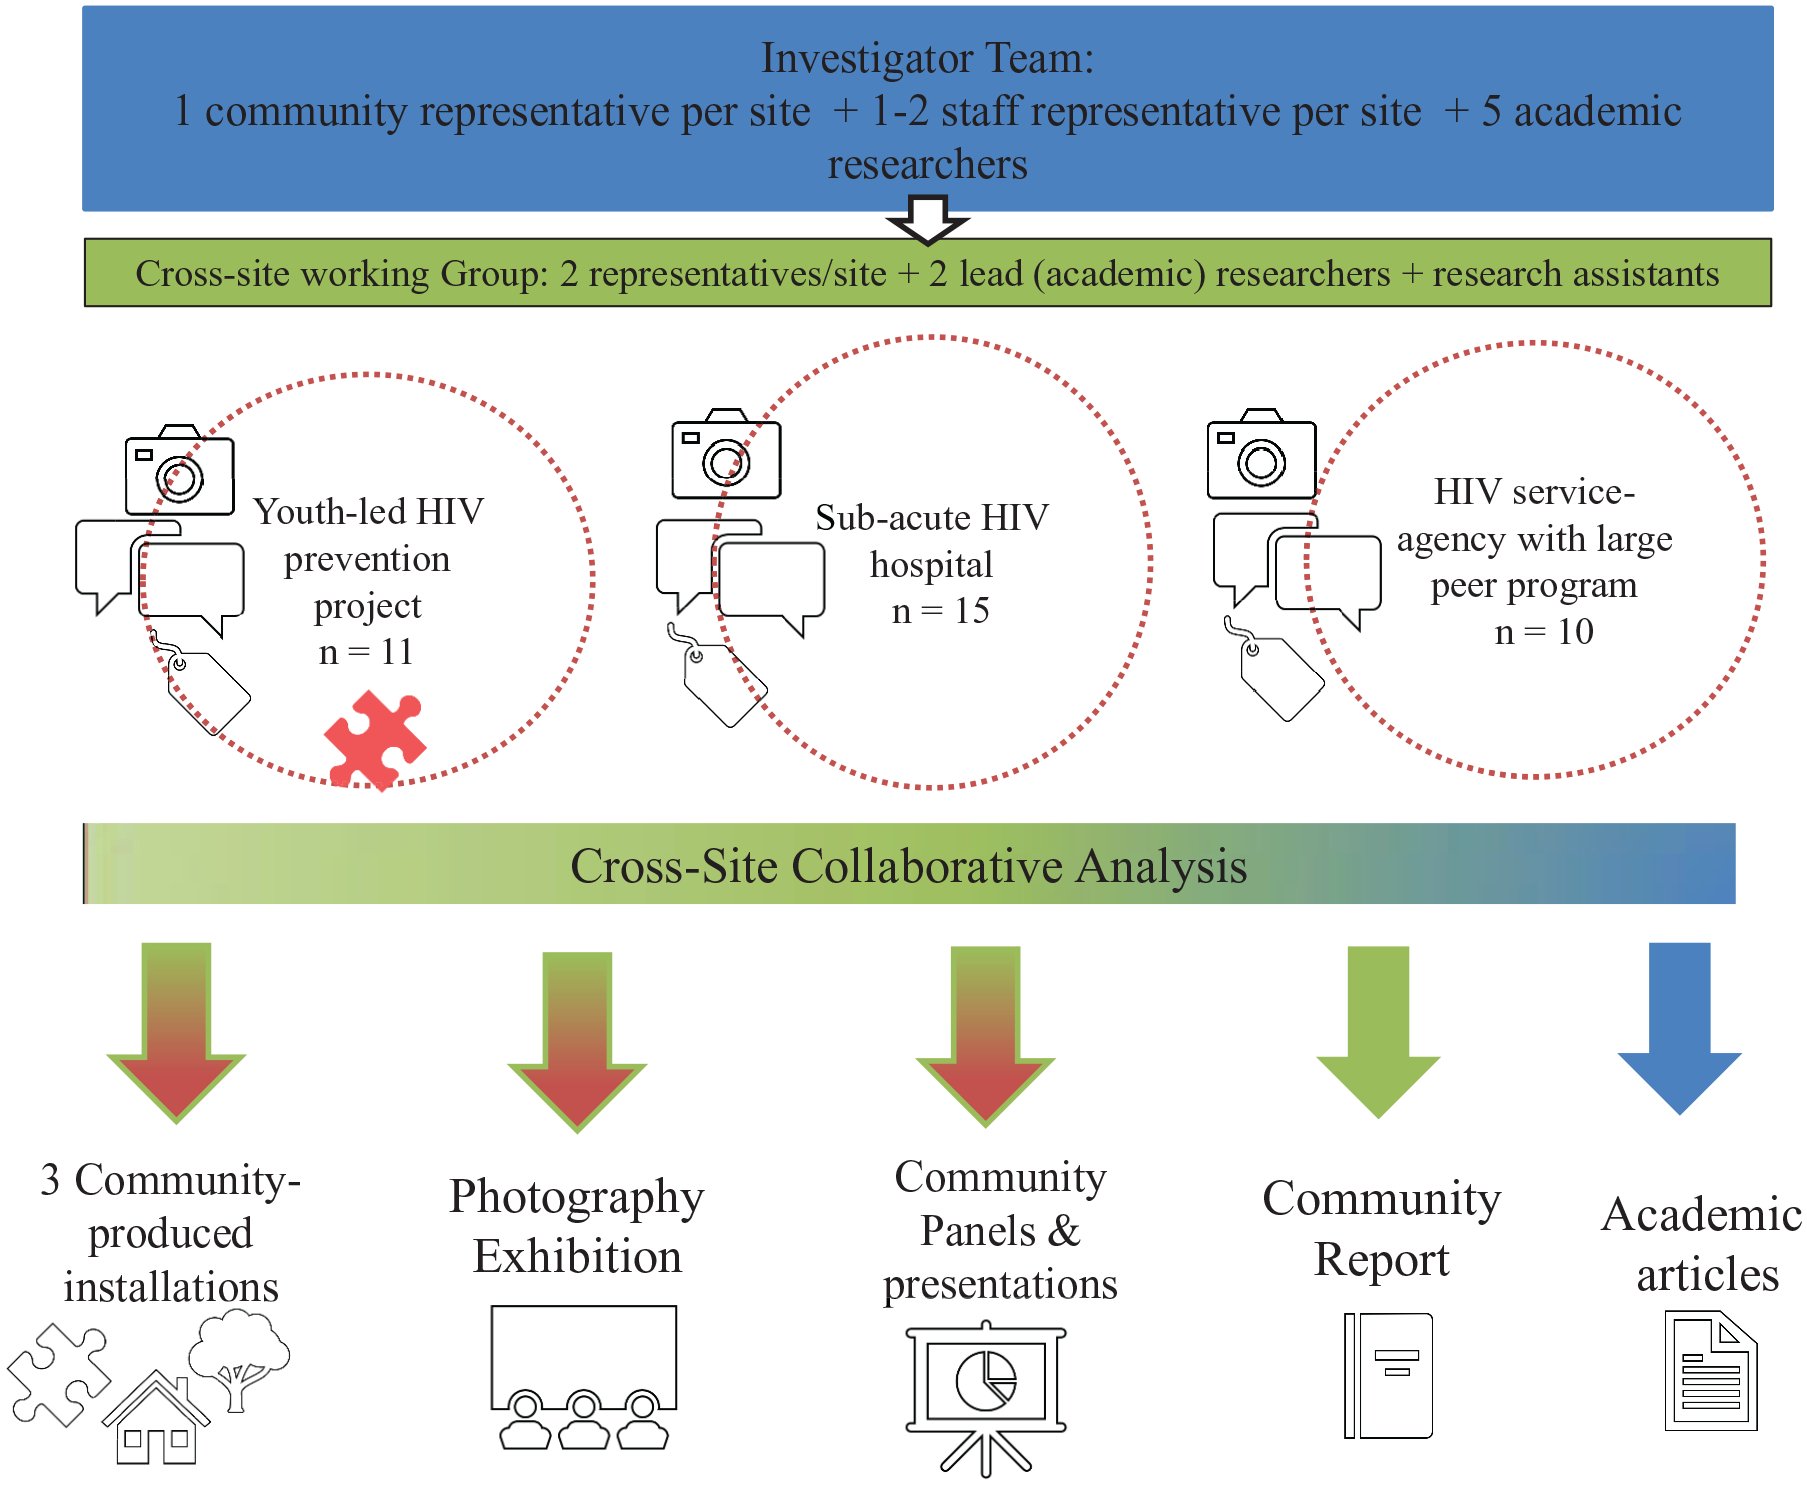
We were a partnership composed of community members affected by or living with HIV and involved with one of the three organizations, staff and organizational decision makers, and academics. Many of us identified with multiple roles. Some roles also changed over the course of the project. In total, there were 36 stakeholders (community members, staff, and organizational decision makers) who participated in the project (herein referred to as “participant photographers”). Six of these participant photographers were also community co-investigators. In addition, the full investigator team included five academics from local universities (including the authors who served as project manager and principal investigator) and five research assistants (see Figure 1). For efficiency, a cross-site working group with representation from these different stakeholder groups guided the project decisions. Combined, Flicker and Switzer had more than 30 years of experience working in partnership with the HIV sector and took the lead in facilitating the project and connecting its many moving parts.
Project Overview
Each of the organizations had a diverse history of engaging community members in programmatic activities as well as in organizational or policy change efforts and was genuinely committed to reflecting on their practice. However, we knew before we started that the term engagement was enacted and understood differently at each site (e.g., youth engagement, client engagement, or volunteer engagement). Our work was informed by the Canadian HIV sector’s commitment to GIPA/MEPA (the greater and/or meaningful engagement of people living with HIV/AIDS; Joint United Nations Programme on HIV/AIDS, 1999).
Study Design
We invited 36 stakeholders (“the participant photographers”) to participate in a site-specific photovoice project. We asked the participants to take photos to capture their understandings of engagement, discuss the meanings of the photos with other participants and/or team members, develop photo narratives, and participate in exhibition planning for their site. Over 6 months, approximately seven workshops were facilitated at each site, yielding a total of 20 audio-recorded workshops. The workshops were co-facilitated by Switzer and a community-based research assistant. Despite some variation, at each site, we introduced the project, brainstormed ideas about engagement, provided training on ethics and photography, supplied photography equipment, and provided instructions for taking photos (Switzer, 2019). In the later workshops, we discussed, analyzed, and celebrated the photos and creative projects emerging from each site. As the site-specific projects wound down, the cross-site working group began the comparative analytic work, adapting DEPICT for visual data across multiple sites. We later recruited the full investigator team for participatory visual analysis. Herein, we refer to this as Visualizing DEPICT.
Visualizing Depict: Collaborative Data Analysis Procedures
From DEPICT to Visualizing DEPICT
Our analytic goal was to explore diverse conceptualizations of engagement within HIV organizations. We hoped our findings would catalyze and nuance conversations on engagement within the sector and lead to organizational and sector-wide change (Switzer et al., 2020). Consequently, both single and cross-site analyses were important. We aimed for analytic depth and breadth.
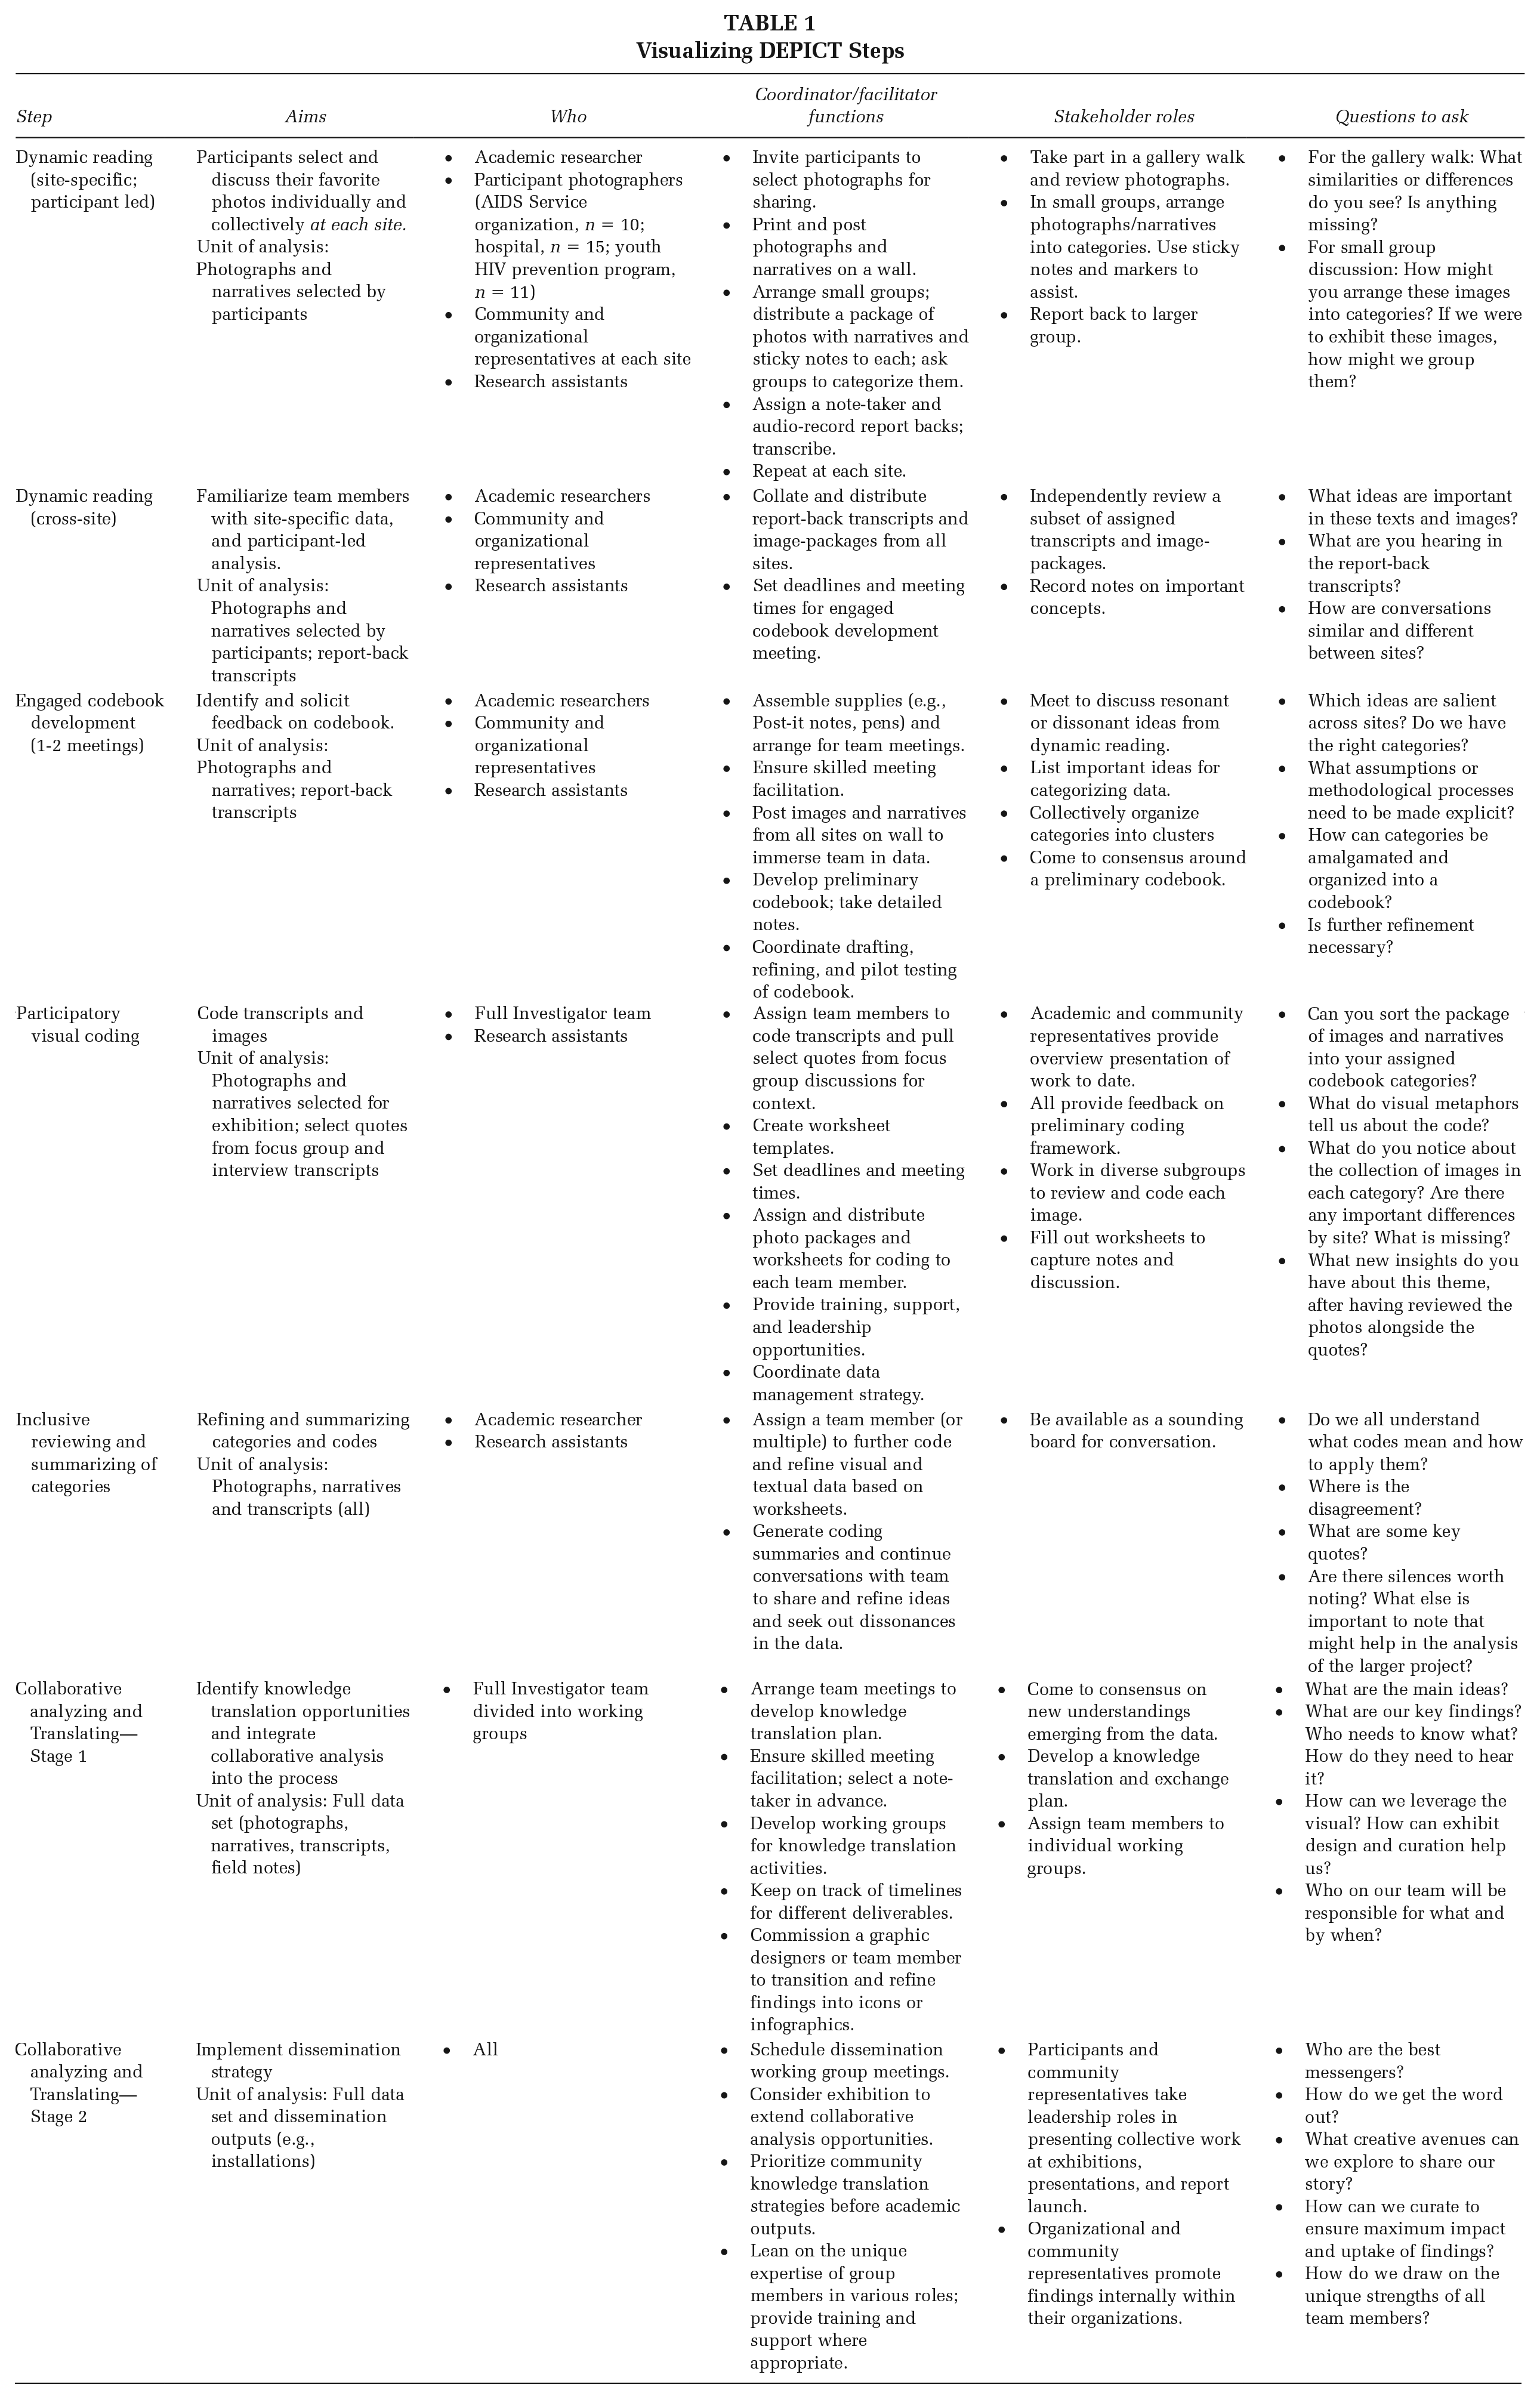
DEPICT was originally designed to analyze qualitative textual data. It draws from other qualitative health research approaches, while emphasizing participation, collaboration, and transparency throughout (Flicker & Nixon, 2015). DEPICT explicitly honors the multiplicity of gifts, talents, knowledges, and experiences that diverse stakeholders can bring to the analytic process to promote equity and praxis (Cashman et al., 2008; Macaulay et al., 1999). DEPICT stands for (1) Dynamic reading (e.g., of data), (2) Engaged codebook development, (3) Participatory coding, (4) Inclusive reviewing and summarizing of categories, and (5) Collaborative analysis and Translation. Below, we highlight our adaptations to accommodate visual data in a multisite study. Our process is summarized in Table 1. Although the stages are presented as discrete, the process was less linear. As is often the case in participatory work, analysis was fluid and iterative (Cahill, 2007; Tulinius & Hølge-Hazelton, 2011).
Visualizing DEPICT Steps
Dynamic Reading
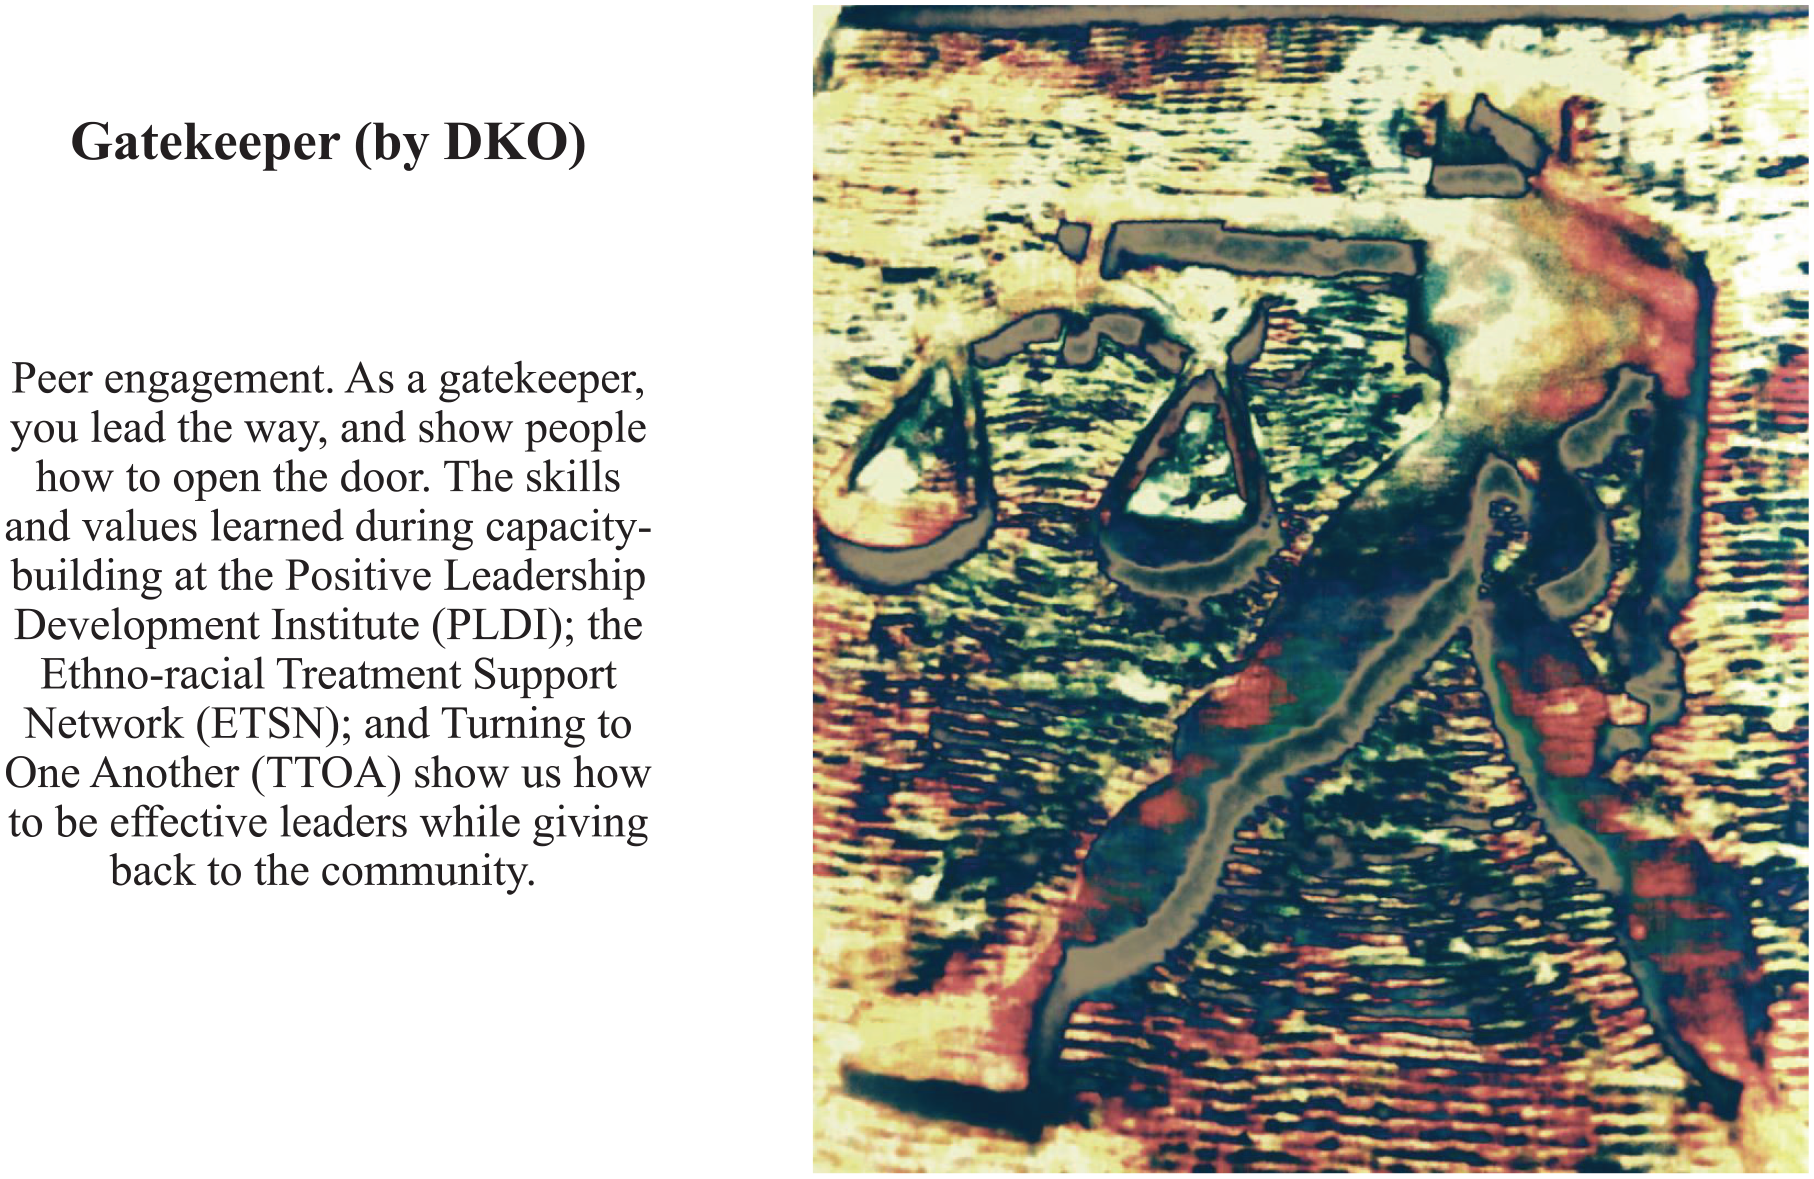
This phase began during the site-specific photovoice workshops. Since participants took many more photos than we had capacity to discuss in the groups, we asked each participant to prioritize one or two photos for discussion and analysis. Photographers were invited to reflect on why they took the photo, and how it represented their thoughts on engagement. We modified the SHOWeD model for group discussion: What do you see? What do you think is happening in this photo? What does this photo tell us about engagement generally, and at your organization? How does it connect to your lives, or experiences? What can we do about this issue? And finally, what is missing in this photo? Parallel to the workshops, individual photo elicitation interviews were conducted with 17 participants to accommodate confidentiality, health, and accessibility issues, particularly at the subacute hospital, and/or to attend to scheduling challenges. As shown in Figure 2, the participants authored (independently or with support) accompanying narrative captions and descriptions, decided how they wanted to be publicly recognized (e.g., given names, pseudonyms, artist alias) and selected which photos they were comfortable exhibiting.
Sample Image and Narrative
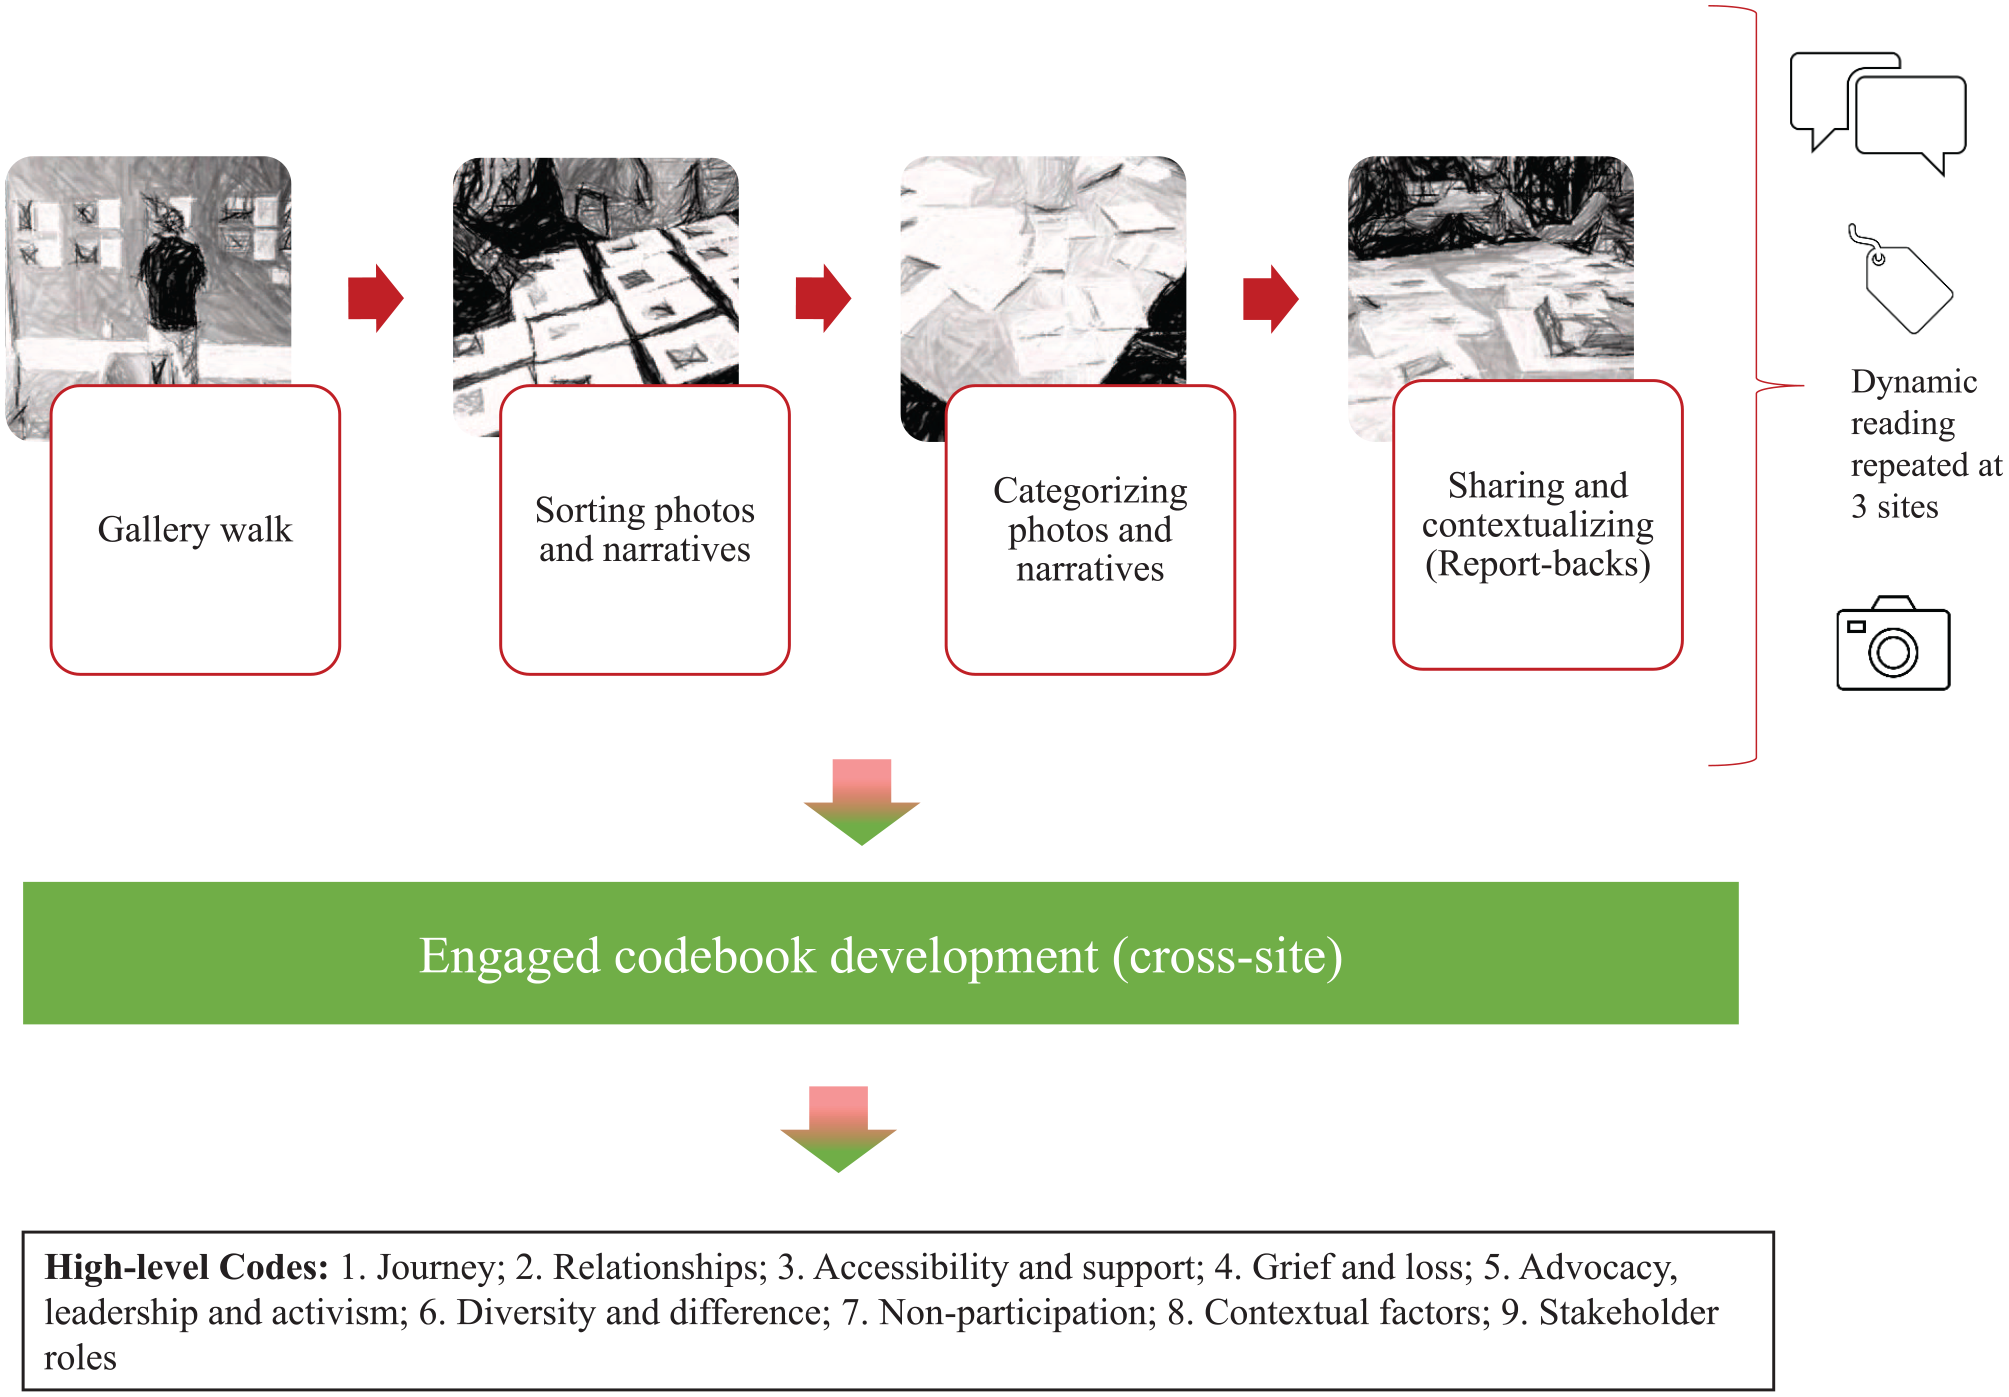
In the following workshop, photographs and narratives were posted on the walls with attribution. Participants did a “gallery walk” to identify similarities, differences, and any missing components. We prompted the participants to reflect on what it was like to have their attributed photos on display. This activity supported subsequent conversations about photo sharing and consent. Next, we divided the participants into small groups. Each group received a package with the printed photos, associated narratives, and blank sticky notes. The groups were tasked with (1) identifying and naming common ideas across the photographs, (2) sorting and labeling the images into piles according to those categories, and (3) reporting back to the larger group (Figure 3).
Dynamic Reading and Codebook Development Stages
The cross-site working group independently reviewed the same sets of photographs and narratives, as well as report-back transcripts from all three sites. Until this point, each site had functioned somewhat independently. This cross-site familiarity was necessary to prepare the working group for codebook development.
Engaged Codebook Development
The cross-site working group met twice to create and refine a draft coding framework. During this stage, some key analytic decisions were collectively made. First, we committed to a group process that ensured community representation from each site when making methodological decisions. Second, for ethical and feasibility reasons, we chose to focus our analytical efforts on images that were flagged for exhibition (and not take up others that were discussed during workshops or interviews only). Third, we agreed to a process that honored similarities and differences between sites, as to not lose sight of the sociopolitical, institutional, and contextual specificities of engagement. For example, during the dynamic reading stage, the participants noted that many conversations and photos focused on individual or organizational transformations or change. However, the language they used to describe these changes varied considerably by site. These site-specific distinctions became subcodes within a higher-level code, journey. Fourth, we decided that while the images and narratives were rich, in many instances, it was important to return to the recorded transcripts for additional context about particular photos to fully capture the nuance of intent, and how other participants responded to the image(s).
Between the first and second meeting, Switzer consolidated meeting minutes and dynamic reading materials (i.e., transcripts, sticky notes) into a preliminary coding framework for further discussion, refinement, and feedback. At the second meeting, some codes were amalgamated, others were crystallized and renamed, and new ones emerged. This process resulted in a revised framework of nine high-level codes, and subcodes.
Participatory Visual Coding
Our full investigator team participated in our participatory coding meeting. This was the first time that some team members engaged with the entire visual data set. To prepare for our participatory coding meeting, Switzer used the draft coding framework to code focus group and interview transcripts where participant photographers had discussed relevant photos. She worked with research assistants to create textual code summaries. Each summary included a working definition and key quotes that were representative of the code across sites and participant–stakeholder roles (e.g., peer volunteer, clinician, youth peer educator). This process promoted rigor as multiple research assistants reviewed and reflected on the textual data (Barry et al., 1999). Summaries became the basis for coding worksheets, as described below.
Prior to the meeting, packages of the 63 photos and associated narratives were circulated for review. Community co-investigators from the working group and Switzer began the meeting with an overview presentation of the work completed to date, including the coding framework. This created an environment where the unique roles of different stakeholders were valued. The presenters proposed to focus on seven of the nine high-level and subcodes. The team agreed. We worked in small multistakeholder groups to catalog and by consensus assign photographs to the seven codes. Each small group was randomly assigned a single code to champion. Some photos were attributed to multiple codes. Groups were given the preprepared worksheets to refine codes, guide and capture analytic discussions, reflect on associated quotes from focus group conversations and interviews, and consider contextual differences across sites (see Supplemental Material on Sample Worksheet).
Participatory visual coding was an inductive process whereby team members looked across and within sites simultaneously. For example, in coding images for journey, team members reflected on the similar, yet differential ways journey was described and visualized. At the youth site, photographers had discussed growth and internal change with visual references to plants. At the AIDS service organization, the participants had discussed lightness and darkness, with visual references to paths, signaling the way the organization had supported them on their journeys. At the subacute hospital, the participants depicted images of the new hospital under construction, signaling the relationship between the organization’s journey, and reflections on their own mortality (for more on journey as a metaphor for engagement, as shaped by institution and role, see Switzer et al., 2020). Examining metaphor is a promising tool for photovoice studies (Switzer, 2019; Teti et al., 2021). Additionally, the combined approach of working with images and worksheets (with preprepared quotes) allowed us to prioritize both visual and narrative data.
We concluded our participatory coding meeting by discussing potential knowledge translation strategies. We solicited volunteers from our research team to mobilize future steps. We agreed to prioritize the production of a coauthored community report to be distributed and launched at a public exhibition. Switzer was tasked with doing deeper thematic analysis to support these efforts.
Inclusive Reviewing and Summarizing of Categories
Following preliminary coding, data often need to be rereviewed and summarized. The purpose of this analytic stage is to further parse and distill data into a more refined form. Drawing on worksheets and meeting notes, Switzer (with feedback from Flicker) worked with research assistants to enter coded photographs and narratives into NVivo and revisited previously coded transcripts to refine alignment. Reviewing, summarizing, and refining can be tedious and time-intensive. The depth and degree of refinement necessary may vary across projects. Because Switzer was nesting her doctoral dissertation within this study, she had the time, resources, and interest to lead this work. In our case, other team members chose to focus their attention on the next stage—collaborative analysis and translation.
Collaborative Analysis and Translation
We combined collaborative analysis and translation into a single step, using each output to deepen our inquiry. This encouraged team members to focus their attention where they desired. We used tailored dissemination strategies (Figure 1) to reach different audiences, including community members, organizational decision makers, policy makers, funders, and researchers (whose roles might overlap). We split into subgroups to organize and generate outputs. Ad hoc working groups (containing people in different roles) were struck to design workshops, panels, and conference presentations when opportunities arose. Working through each output helped refine our iterative analysis and refine themes (Figure 4).
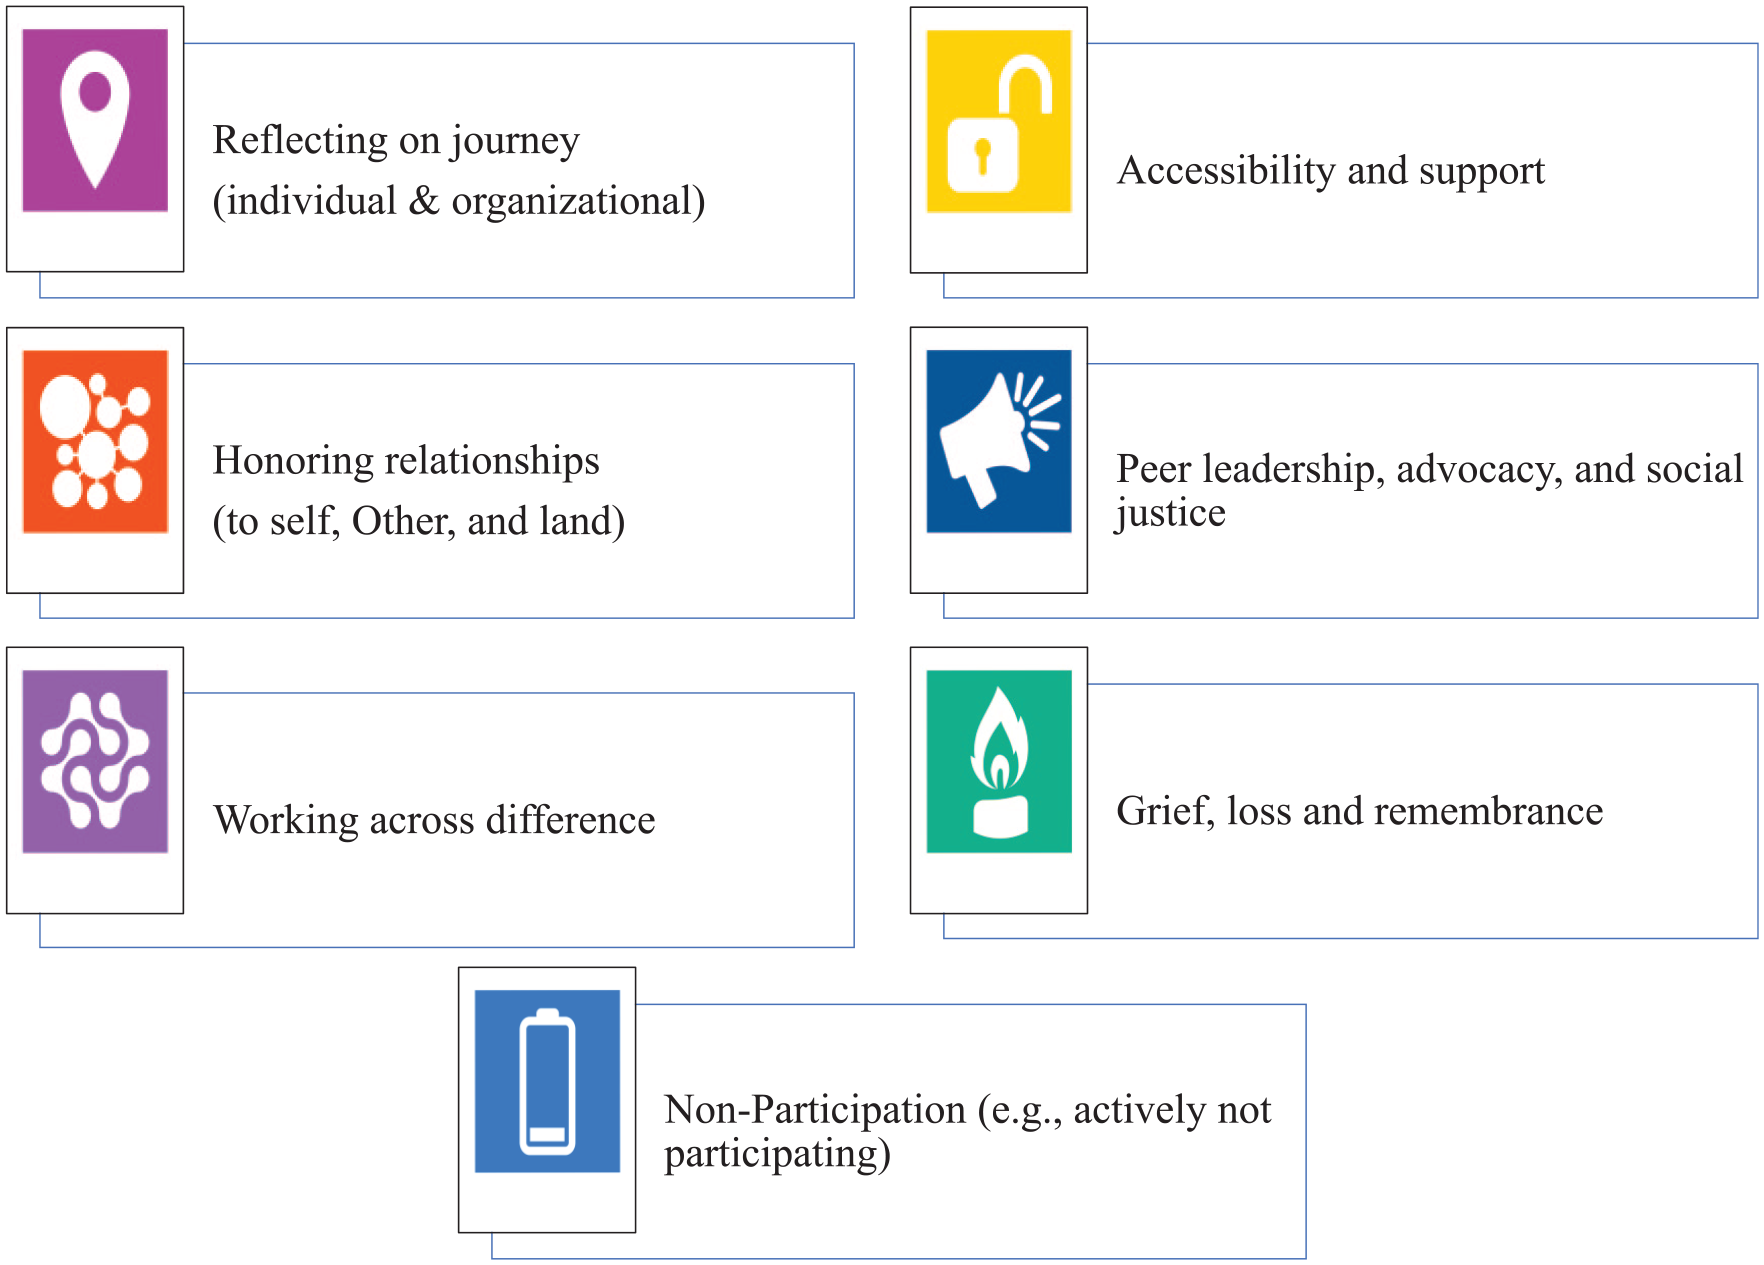
Seven Key Themes With Corresponding Icons for Catalyzing Conversations About Engagement in the HIV Sector
Community report and exhibit
For the community report, worksheets from our participatory coding meeting were collated, summarized, and crystallized into seven key themes. The report su-group worked with a graphic designer to create icons for each theme (Figure 4). The process of graphically representing themes illuminated divergent and common understandings. The icons grounded these (at times) abstract discussions and made these conversations more accessible to diverse stakeholders. For example, while some icons received immediate approval (i.e., journey), others, such as nonparticipation, required deeper dialogue and revision. As we debated options, the team developed greater conceptual clarity around what each theme meant. The icons then served as visual guides for both the report and exhibit.
The report provided organizations with a concrete tool to facilitate conversations about meaningfully including people with lived experience in program delivery and policy change. Each section was dedicated to one theme and contained sample photos, a brief description, and questions for consideration. The report was printed, launched, and initially shared at our community photography exhibit and other events to more than 300 attendees (Switzer et al., 2017). Later, an online version was made publicly available for download. We created icon stickers and used them to visually identify images belonging to different themes at the exhibit. This curation rendered our analysis more visible and intelligible for diverse and specific audiences. The icons were also leveraged in other dissemination outputs and on “swag” for participants. The report was later adapted into a coauthored academic article (Switzer et al., 2021).
Installations
During a photovoice workshop, a participant photographer used the metaphor of a puzzle to represent collaboration, the coming together across many different communities and program cycles, and the labor and wisdom inherent in participatory processes with young people (e.g., giving a piece of oneself). The idea generated so much excitement that youth participants from that site decided to make a physical puzzle out of their photographs. Participant photographers at the other two sites were so inspired that they decided to make their own installations (e.g., a tree and house) to showcase the spirit of their work and summarize site-specific conversations (Figure 5). Initially, these installations were designed for dissemination. However, they inadvertently became another analytic touchstone for communicating and interpreting findings. They captured and translated the findings in multisensory ways that complemented traditional modes of communication. Later, community representatives and participants frequently spoke with great enthusiasm about the process and meaning behind building these installations.
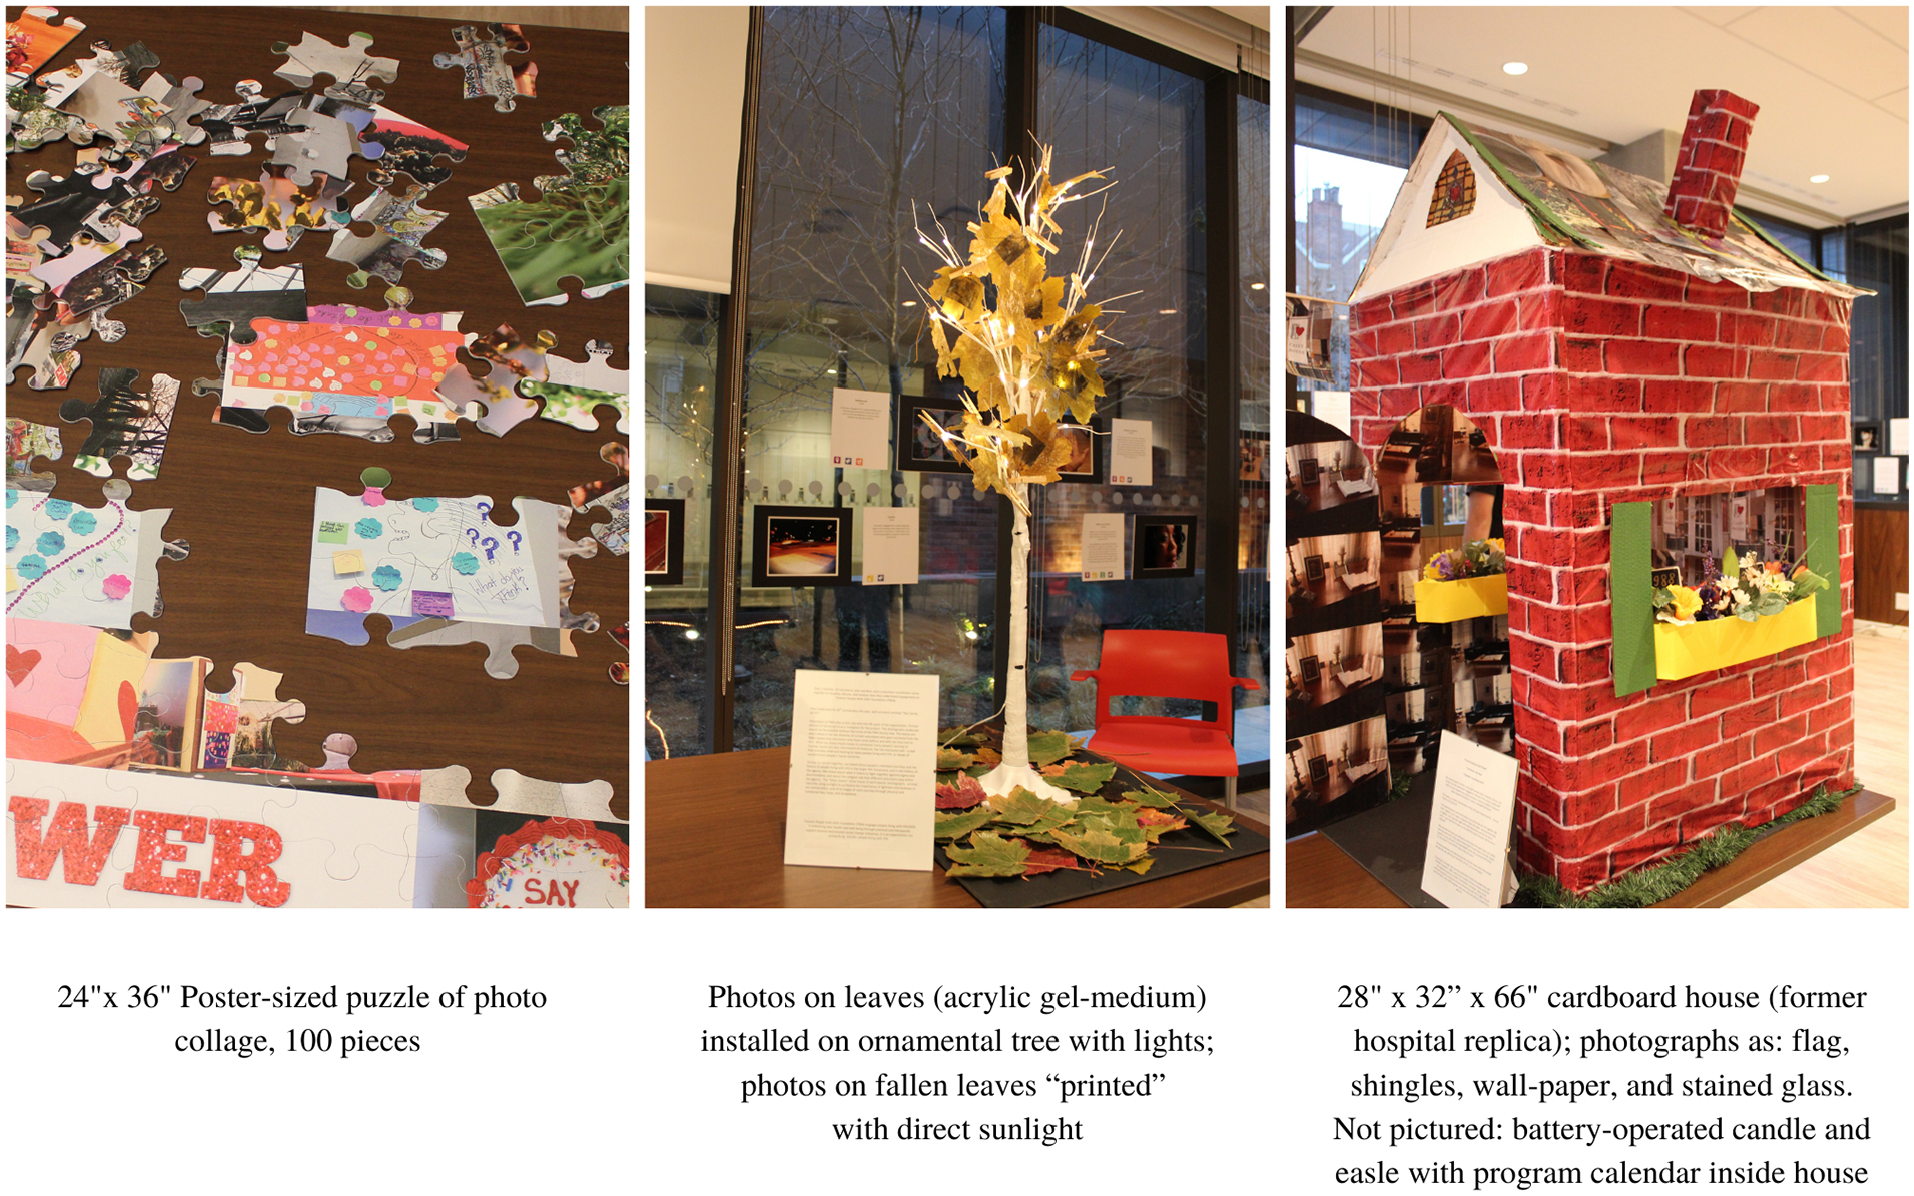
Site-Specific Installations (From Left to Right): Puzzle: Youth-Led HIV Prevention Project; Tree: AIDS Service Organization; House: HIV Subacute Hospital
The tangibility of creating something together helped anchor and deepen conversations and became sites of co-theorizing (for more, see Switzer, 2019). For example, at one organization, the theme of lightness and darkness as connected to individual and organizational journeys was so prominent that participants decided to use sunlight to burn images of photographs onto leaves, as a homage to the “family of HIV” and former advocates who had been lost to HIV.
Presentations and academic articles
The tangible, action-oriented nature of the report and installations helped motivate stakeholder involvement at several community panels, workshops, and scholarly conferences. Photovoice participants, organizational staff, and community representatives from the sites worked with the academic researchers to present in various settings. Presentation opportunities were then leveraged to generate first drafts of coauthored academic papers as further dissemination tools (Flicker & Nixon, 2018; Switzer et al., 2020; Switzer et al., 2021).
Discussion: Implications for Practice and Research
Photovoice data analysis approaches ought to promote participation, balance data from the image, text, and narrative, and be logistically feasible and methodologically congruent with theoretical commitments (Capous-Desyllas & Bromfield, 2018; Latz, 2017; Q. Wang & Hannes, 2020). As originally conceptualized, the method draws from Freirean and feminist orientations that privilege reflexivity, praxis, and group-based critical analysis (Coemans et al., 2019; Liebenberg, 2018; Sutton-Brown, 2014). Participatory visual analysis also borrows from the rich legacy of collaborative visual analysis in Latin America, as led by Fals Borda, which emphasized imagination, co-analysis, and the politics of knowledge production as points of departure (Rappaport, 2020).
These commitments align with critical narrative intervention. To paraphrase Gubrium et al. (2019), critical narrative interventions (1) spotlight marginalized voices, (2) foster community and social support, and (3) recalibrate “damaging and disempowering conversations on social health and wellbeing, ultimately to create more supportive policies with and for marginalized communities” (p. 291). Visualizing DEPICT was developed to better align our principles and practices.
In Liboiron’s (2020) 1 powerful chapter, Exchanging, they implore readers to consider how theories and methods conceal extractive relations and ask how we might move toward more relational modes of knowledge production and dissemination. They argue that “methods enact realities rather than merely describe them” (p. 90). Commitments are not enough. Researchers need clear methods, strategies, and tools to ensure multiple voices are included in analysis and dissemination processes. By opening our data analysis process to a broader and more diverse range of voices, we ensured that multiple stakeholders could shape the direction and dissemination of the findings. The model encouraged our team to regularly consider who needed to be in which room, when, and why. This form of “expert validity”—in other words reframing whose expertise matters and why (Quijada Cerecer et al., 2013; Torre et al., 2012)—enhanced rigor and trustworthiness and helped us share findings with broader audiences.
The products of arts-based health research have a unique potential to positively affect health policy (Boydell et al., 2012; Mitchell et al., 2017). In an era of increased inequity, visual researchers must also consider the intent and impact of our methods on representing nondominant narratives (Burch, 2021). As Hergenrather et al. (2009) argue, although change in community and policy can be incremental, . . . [participatory visual methods] can identify concerns and priorities that empower participants to become advocates of change for themselves and community, providing data to help influential advocates and policy makers understand the needs of their community. (p. 697)
While a fulsome review of our impacts is beyond this article’s scope, we believe that multistakeholder involvement in the analysis and dissemination process was pivotal in ensuring uptake of our findings and promoting community leadership. We curated exhibits, organized panels, facilitated workshops, prepared academic and professional conference presentations, and drafted manuscripts. Distinct knowledge translation products served different analytic ends while also facilitating travel across various contexts (Cahill & Torre, 2007; Quijada Cerecer et al., 2013). The community report created directly out of our collaborative analysis process was widely distributed and taken up by service providers locally, provincially, and nationally. The study affected organizational policy and programming at partner organizations, including one organization’s strategic plan. Other organizations used the materials produced as part of onboarding new staff, volunteers, and students. Youth participants used the project as a launching board for their own youth-led projects. Images from the project, many years later, hang on one organization’s walls. Our theory of change posits that while participatory visual methods may not be empowering in and of themselves (Switzer, 2018), the way in which we design and facilitate photovoice projects may lead to participants’ enhanced investment, ownership, and commitment to project outcomes. Consequently, multiple stakeholders (community members, staff, and researchers) were mobilized with evidence to make compelling cases for change within a sector that was already primed for doing better.
However, an insistence on inclusion can present challenges around feasibility. We had to carefully consider how to equitably enact representation politics while combining site-specific data sets in ways that were practical and did not gloss over difference. As Bang and Vossoughi (2016) argue, practicality has both theoretical and methodological relevance. Linked with “imagined possible futures,” practicality becomes a process that seeks to “enact the type of future [we] are struggling to bring into being” (p. 178). Because of team size, and the multisite nature of our study, it was not possible (nor desirable) to have everyone involved in equal measure in all stages. Analysis requires time, resources, and a level of research familiarity that is not always practical for multistakeholder teams where resources and research capacity may vary considerably across the team. We attended to this challenge by ensuring that meetings were organized and carefully facilitated to achieve clear outcomes. We were explicit that we expected capacity levels to shift over a project. There are many valid reasons why people cannot (or may not want to) participate (Switzer, 2020). We integrated different types of analytic activities and were always cognizant of who was involved at each step. This went a long way in ensuring project feasibility and respectfulness of peoples’ time, interests, and energy resources. Researchers may want to consider how they can structure different kinds of participation into their project, as well as how to create an environment where people are both welcomed into the process and can disengage when necessary.
Incorporating the visual (e.g., icons, installations) added an additional analytic opportunity to examine the data from new perspectives and invited team members and participants with creative skills and strengths to shine. Similarly, codeveloped presentations and workshops provided all team members with opportunities to further explore and elaborate on ideas initially expressed during collaborative analysis meetings. Together, this process resulted in feelings of increased ownership by community team members that manifested in enhanced leadership at the dissemination stage. This ultimately created suitable conditions for the cowriting of academic manuscripts that truly reflected the ideas of diverse team members and participants (Flicker & Nixon, 2018).
Privileging the visual also encouraged us to take curation and exhibit planning seriously. Together, we explored the following key questions: How should we display images? By theme, or by site? If by theme, how do we attend to images that speak to multiple themes? How do we invite audience members (especially those with decision-making power) not to consume the images, but to reflect deeply on them, as individual images, and as a collection? How do we prioritize the voices of community members in ways that also attend to the sensitivity of the data and participants’ different (and sometimes competing) desires to be recognized? These inquiries were not just utilitarian, they were analytic as they encouraged us to continually revisit questions about audience, framing, impact, and intent. Health researchers newer to this field may wish to consider teaming up with colleagues in the arts or cultural production who may have relevant experience wrestling with these questions.
Photovoice scholars often comment on the large amount of data that are produced by any project (Gubrium & Harper, 2013); our project was no exception. Limiting our analysis to exhibited photographs (that we had permission to share widely) and working with worksheets and preprepared photo packages enhanced feasibility. The physicality of working with photovoice data has been noted by others (Capous-Desyllas & Bromfield, 2018). Indeed, the embodied act of sorting printed photos can prompt memories, bridge connections, and enable prioritization (Switzer et al., 2015). In our study, many of participants had learning, literacy, and/or cognitive challenges. Sorting and labeling photos concretized sense-making. Other researchers might consider how to translate the physical act of sorting to digital environments.
By increasing transparency and incorporating different lenses on the data (e.g., lived, professional, and academic), participatory analysis may lead to more relevant and rigorous research findings and increased policy impacts. Nonetheless, this process does not come without tensions. The question of “who benefits?” is not always clear cut (Flicker, 2008; Tuck, 2009). Power dynamics with respect to role, academic training, and identity inform any participatory process. Researchers must navigate what Guerrero et al. (2013) refer to as the “push and pull” inherent in participatory research, and the “tensions between guiding and facilitating the process” (p. 116). For example, when discussing photographs, some participants frequently looked to researchers for confirmation that their responses were “correct.” It took time and ongoing reassurance that there was no “right” answer. Alternatively, during the participatory coding meeting, a community-affiliated team member suggested to Switzer that the project frame treatment access as a research finding. Switzer had to explain that it was difficult to frame access to treatment as a finding if it did not come up in the data. However, it was only later that she realized how conceptually significant this request was, given the biomedical landscape of engagement literature, which frames engagement as a mechanism for improved health outcomes rather than an opportunity to shift and dismantle power structures. No matter how “participatory” a process may be, the powered fault lines of decision making can be complex. This is particularly pertinent for doctoral students where academic timelines and expectations, as well as one’s own “desires” may compete with community needs and interests (Felner, 2020; Khobzi & Flicker, 2010; Switzer, 2020). We learned that being transparent and up-front about these limitations—during the process and in reporting outcomes—as well as taking time to pause and reflect is important.
Some of these tensions also invited us to be proactive when working within institutions. For example, finding suitable venues and settings for diverse teams to present work can be a challenge. Community representatives may not have the training or desire to follow strict academic conventions, and many scholarly venues may feel intimidating or irrelevant. In our study, we attended to this tension by choosing to present in a variety of settings. We prioritized funding and resources (e.g., time, honoraria) to present at community venues, with more flexible presentation formats. At conferences with mixed audiences (e.g., a provincial HIV conference with research scientists, policy makers, and practitioners), we contacted the conference organizers in advance to request a time slot of a 2.5-hour workshop. (This option was not available through the standard peer-review process.) A longer presentation window allowed us to invite different individuals with a range of public speaking skills to share our work and invite meaningful engagement with audience members. At the conference, our session was ranked the most relevant and highly rated out of all concurrent sessions—a score that was likely attributed to the diversity of team members who presented. When it was not possible to copresent, all team members were encouraged to share findings in opportune settings. This strategy extended the study’s reach considerably.
Ensuring multistakeholder team member and participant involvement (in analysis and dissemination) comes with human resource and financial costs. Meetings, worksheets, photo packages, and agendas needed to be arranged in advance. As emphasized by Flicker and Nixon (2015), careful facilitation, project coordination, scheduling, and budgeting should not be underemphasized. Researchers need to account for involvement up-front. In our study, all team members and participants who were not already compensated through an organization or institution were financially remunerated at every stage. This included meeting attendance (in person or by phone), article review, and dissemination events. The need for financial resources can be a challenge; however, with careful planning and strong facilitation, even projects with modest budgets can carve out resources for community member involvement.
Conclusion
There are limited “how-to” guides on including the voices of multiple stakeholders in the photovoice analysis process, especially for multisite studies. Here, we built on Flicker and Nixon’s (2015) DEPICT model for collaborative, text-based analysis to propose Visualizing DEPICT, an analytic model for collaborative, visual, and text-based analysis. We believe that photovoice studies can have a strong potential for influencing policy and program change, but only if practitioners are able to better leverage the voices of participants and other study stakeholders in analysis and dissemination in feasible and meaningful ways.
Supplemental Material
sj-docx-1-hpp-10.1177_15248399211045017 – Supplemental material for Visualizing DEPICT: A Multistep Model for Participatory Analysis in Photovoice Research for Social Change
Supplemental material, sj-docx-1-hpp-10.1177_15248399211045017 for Visualizing DEPICT: A Multistep Model for Participatory Analysis in Photovoice Research for Social Change by Sarah Switzer and Sarah Flicker in Health Promotion Practice
Footnotes
Authors’ Note:
The research described herein was conducted at York University. We would like to express gratitude to participants, organizational partners, and study team members for their commitment, expertise, and creativity. Without them (and their trust in the process), Visualizing DEPICT would not be possible. This article is dedicated to Derek Yee for his leadership, laughter, and for holding our team accountable every step of the way. Thank you to the reviewers, special issue editors, and Kathleen Roe for their guidance and support during the review process.
Notes
References
Supplementary Material
Please find the following supplemental material available below.
For Open Access articles published under a Creative Commons License, all supplemental material carries the same license as the article it is associated with.
For non-Open Access articles published, all supplemental material carries a non-exclusive license, and permission requests for re-use of supplemental material or any part of supplemental material shall be sent directly to the copyright owner as specified in the copyright notice associated with the article.