
Abstract
The relationship between posttraumatic stress (PTS) and posttraumatic growth (PTG) has been extensively studied; however, the nature of the relationship remains unclear. Inconsistencies in the literature could be, in part, due to the use of variable level approaches. Person centered methods may further our understanding of this relationship, as they enable the identification of clinically meaningful subgroups based on PTS/PTG scores. This review aimed to identify commonly found subgroups of PTS and PTG, clinically relevant factors that distinguish the subgroups and to critically appraise the utility of categorizing individuals into subgroups based on PTS/PTG scores. Five databases (Embase, Medline, Web of Science, PILOTS, and PsycINFO) were searched. Seven studies (with a total of eight study samples; n = 6,776) met the eligibility criteria. A narrative synthesis of the findings revealed that the majority of the analyses (n = 6) found three patterns of PTS/PTG. These were categorized as: (1) low PTS/PTG (representing 26.89% of the entire sample), (2) high PTS/PTG (weighted mean percentage = 20.05%), and (3) low PTS/high PTG (weighted mean percentage = 43.1%). The role of social support was examined in five studies and higher social support was consistently found to predict membership in the low PTS/high PTG class. All five studies that examined the role of trauma characteristics found that it was a significant predictor of class membership. These findings could inform the developments of tailored interventions. The utility of person-centered approaches was discussed and recommendations to improve the application and reporting of such methods were made.
Introduction
It has been estimated that up to 70% of the global population have been exposed to at least one traumatic event (Benjet et al., 2016). Traumatic experiences are known to be associated with a wide range of negative consequences including, posttraumatic stress disorder (PTSD; Koenen et al., 2017). A growing number of studies have demonstrated that some individuals exposed to traumatic events can also experience posttraumatic growth (PTG). This refers to the experience of perceived personal benefit following a traumatic event as the individual searches for new meanings and narratives (Tedeschi & Calhoun, 1996). It has been postulated that these positive changes manifest across five domains; these are: the recognition of new possibilities, a greater appreciation of life, closer interpersonal relationships, an increased sense of personal strength and spiritual development (Tedeschi & Calhoun, 1996).
The statistical relationship between posttraumatic stress (PTS) and PTG has been widely debated within the literature. Intuitively, it may be reasonable to assume that increased PTG is associated with decreased levels of PTS symptoms. Indeed, several studies have found evidence to support this inverse relationship (Hall et al., 2008; Ssenyonga et al., 2013). There are also several studies that have found a positive relationship between PTS and PTG (Dekel et al., 2012; A. N. Liu et al., 2017; Tiamiyu et al., 2016) suggesting as one increases so does the other. Some studies have however failed to find any significant relationship between the two constructs (Klosky et al., 2014; Sleijpen et al., 2016). Other studies, have suggested that the relationship may be quadratic whereby individuals with intermediate levels of PTS experience the highest level of PTG, but as PTS severity increases further from this point, PTG decreases (Shakespeare-Finch & Lurie-Beck, 2014). Unfortunately, despite a growing body of research examining the relationship between PTG and PTS, a clear consensus is yet to emerge. This inconsistency across prior studies may, in part, be further explained by the use of variable level approaches (such as general linear modeling) to study the relationship between the two constructs that are PTS and PTG (X. Liu et al., 2020). These approaches assume sample homogeneity, whereby it is assumed that the relationship between PTS and PTG follows a similar pattern among all individuals within the study sample.
Prior research has clearly demonstrated that responses to traumatic experiences vary widely, in that sub-groups of individuals who can be differentiated based on an array of sociodemographic and psychological characteristics report varying patterns of symptomatology (Bonanno & Mancini, 2012; Jones et al., 2019; Karstoft et al., 2013, 2015). This wide variation cannot be captured by using variable level analyses. This limitation can be countered by the use of person-centered analyses, such as latent class analysis (LCA; using categorical variables) and latent profile analysis (LPA; using continuous variables). These methods differ from variable-centered analyses by allowing large heterogeneous groups to be classified into meaningful latent subgroups based on participants similarity in responding to questions (be it at the item, subscale, or construct level; McCutcheon, 1987).
Person-centered analyses also have the advantage of not relying on classes that have been forced by the use of cutoff points but instead they use maximum likelihood estimation to identify distinct homogenous subgroups (Berlin et al., 2013). Overall, person-centered methods can generate meaningful subgroups based on PTS and PTG scores. These methods also allow researchers to examine relationships between the subgroups and other relevant constructs (including demographic, social, and psychological characteristics). This can facilitate our understanding of the characteristics of individuals within each homogeneous group and can help in the identification of which characteristics may or may not be associated with group membership; which is in turn indicative of symptom presentations (Birkeland et al., 2015; X. Liu et al., 2020; Y. Zhou et al., 2020).
In recent years there has been an increase in studies using LCA/LPA to explore patterns of co-occurring PTS and PTG (Birkeland et al., 2015; Cao et al., 2018; Chen & Wu, 2017a, X. Liu et al., 2020; X. Zhou et al., 2018, Y. Zhou et al., 2020). For example, X. Liu et al. (2020) examined profiles of PTSD and PTG among women who had been diagnosed with breast cancer. The results revealed three subgroups labeled (one characterized by both low PTS and PTG, one characterized by low PTS and high PTG and one characterized by both high PTS and PTG). The study also found that social support and income were significant predictors of group membership. Such studies have improved our understanding of the complex relationship between PTS and PTG. They have also demonstrated the potential utility of person-centered methods by identifying the existence of clinically meaningful subgroups which suggest the need for differentiated interventions. Furthermore, these studies have shown that the subgroups can be distinguished by factors such as social support, education, and severity of trauma (Cao et al., 2018; Chen & Wu, 2017a). This has allowed the identification of potential risk and protective factors associated with PTS and PTG which could inform the development of assessments and psychological interventions which are specific to the needs of the subgroup. To date however, there have been no reviews to synthesize the findings in this emerging area of research.
This systematic review will examine the literature on this subject and critically appraise the usefulness of categorizing individuals into clinically meaningful subgroups based on PTS and PTG scores. Specifically, we aim to (1) identify whether there are common patterns of co-occurring PTS and PTG (i.e., the number and nature of the subgroups) and, (2) examine whether there are clinically relevant factors that can differentiate between subgroups.
Method
The current review was conducted in line with the principles of the Preferred Reporting Items for Systematic Reviews and Meta-Analyses (PRISMA) Statement (Moher et al., 2009). The methodology and eligibility criteria were specified in advance and the protocol for the review was registered on Prospero (https://www.crd.york.ac.uk/prospero/display_record.php?RecordID=182868).
Eligibility Criteria
Eligible studies were, (1) published in a peer reviewed journal, (2) written in English, (3) utilized either LCA or LPA or utilized latent transition analysis (LTA; a longitudinal extension of LCA; Collins & Lanza, 2010) providing they reported LCA/LPA for each time point separately, (4) included only the PTSD or PTS and PTG indicators within their specified models, and (5) examined covariates in relation to the identified classes (note that the type of covariates examined were not specified). Any studies that did not meet all of the eligibility criteria were excluded from the review.
Search Strategy
A search for all literature reporting the use of LCA or LPA to identify subgroups of PTS and PTG was conducted on January 4, 2021. Embase, Medline, Web of Science, Published International Literature On Traumatic Stress (PILOTS) and PsycINFO databases were searched to identify potentially eligible articles. The following search terms were used: “latent profile,” “LPA,” “latent class,” “LCA,” “latent analysis,” “person-centered,” “person-centred,” “post-traumatic stress,” “posttraumatic stress,” “PTS,” “PTSD,” “posttraumatic growth,” “post-traumatic growth,” “PTG,” “stress related growth,” “benefit finding,” “positive life change,” and “adversarial growth.”
Study Selection
Following removal of duplicates, two researchers independently read all the abstracts and applied the eligibility criteria. The inter-rater reliability for the assessment of eligibility of abstracts was high (k = 0.9). Inconsistencies were resolved by discussion with other members of the research team. The articles that met the inclusion criteria at this stage were subjected to full text reviews by two researchers. Full agreement was reached at this stage (k = 1).
Data Extraction
Two researchers independently extracted data and completed standardized forms. The forms included the following information: country of sample, sample size, demographic information (gender, age, ethnicity), type of trauma, measures used to assess PTS/PTG, optimal class solution, method used to select number of classes, size and nature of classes identified, number and nature of covariates assessed, statistical approach to assess covariates in relation to PTG/PTS classes, and any significant covariates.
Data Analysis and Synthesis
Data on the sample characteristics, methodology, PTS and PTG subgroups and significant covariates were compared. This was presented using summary tables and through a narrative synthesis. Based on evidence of the variability in both trauma exposures and trauma responses depending on life stage (Zlotnick et al., 2008) studies conducted with child and adolescent samples and studies conducted with adult samples were discussed separately to improve comparability.
Quality Analysis
The quality of the reporting of the analyses was assessed using an adapted version of the Guidelines for Reporting on Latent Trajectory Studies (GRoLTS; Van de Schoot et al., 2017). This checklist was developed to improve uniformity of reporting of latent trajectory analyses such as latent class growth analysis and latent class mixture modeling (longitudinal latent analyses; Van de Schoot et al., 2017). Items on the checklist include, “Is the software mentioned?,” “If covariates have been used, can analyses still be replicated?,” and “Are the model comparison and selection tools described from a statistical perspective?” (Van de Schoot et al., 2017). The adapted GRoLTS used in this study has 16 items (Petersen et al., 2019). Each study was given a score ranging from zero to 16 to indicate the level of reporting quality.
Results
The searches retrieved 722 non-duplicated studies, 706 of these were excluded following abstract screening. Full-text screening of 16 publications resulted in the exclusion of nine further studies. The PRISMA flowchart presents the details of this process and the reason for the exclusion of studies that were subjected to a full text review (see Figure 1). In total, seven studies were found to be eligible for inclusion in the current systematic review. For clarity of reporting, each study was assigned a number which can be found in Table 1.
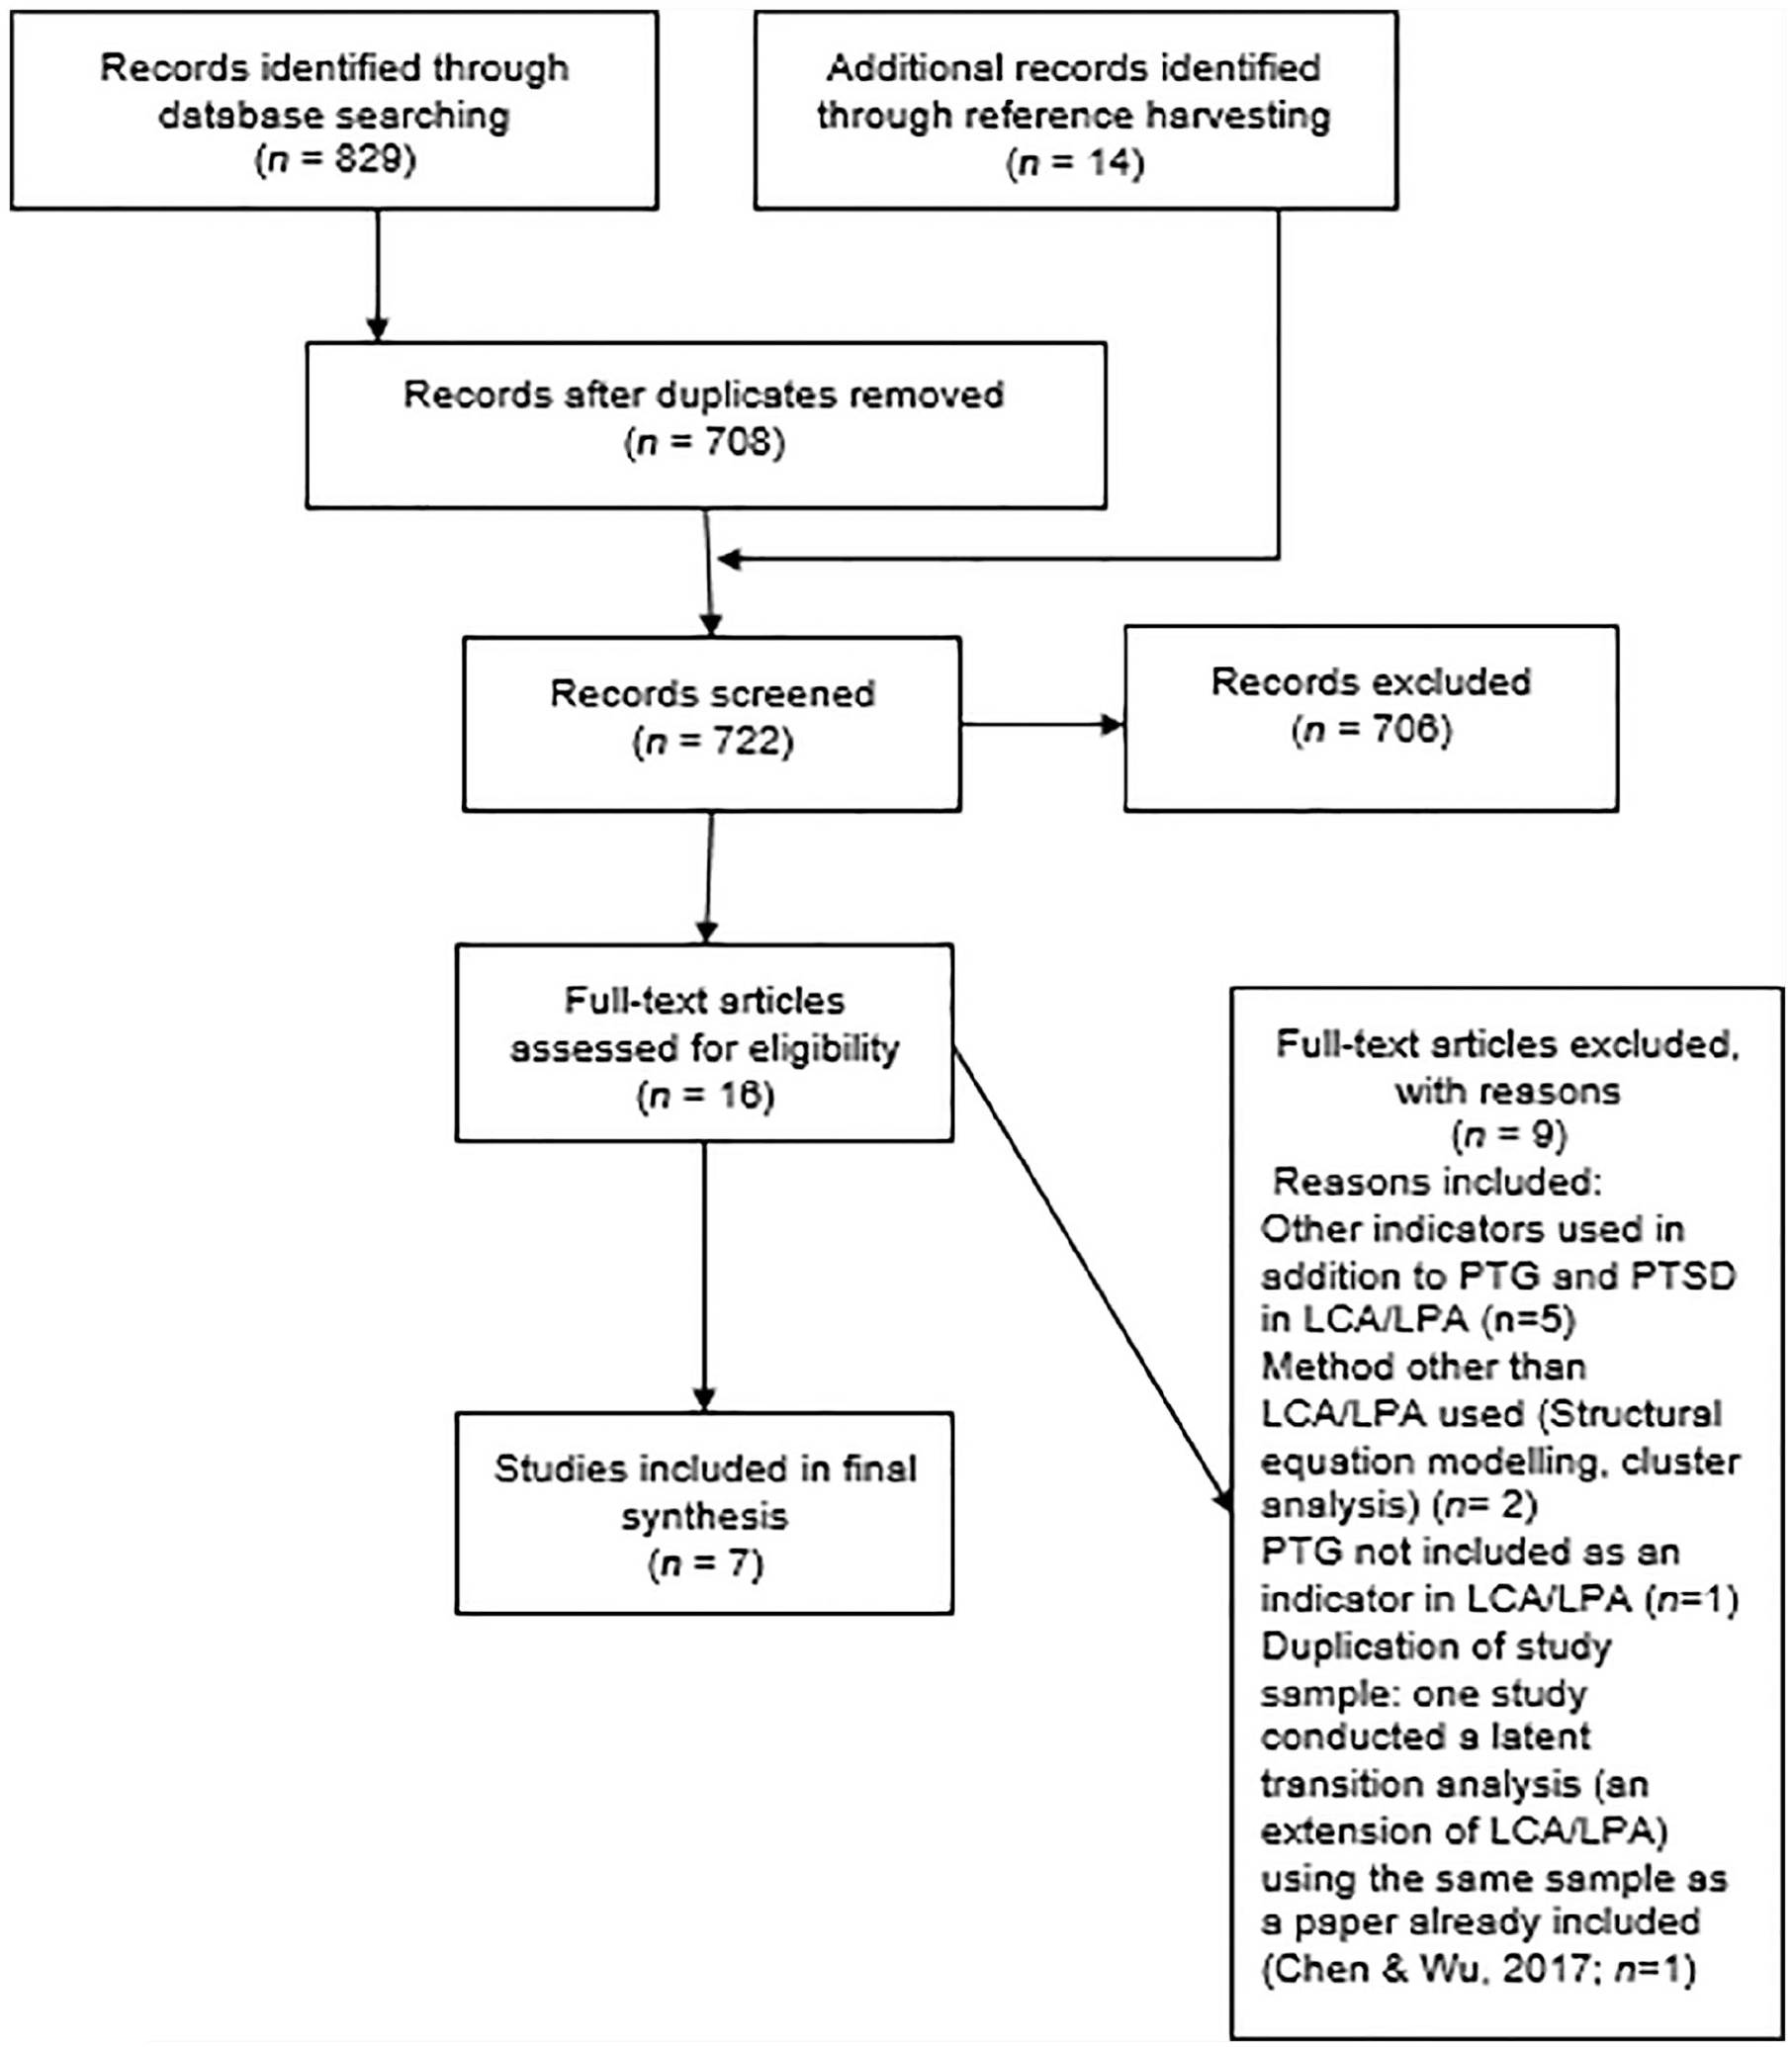
PRISMA flowchart to outline procedure for the review.
Sample Characteristics, Measures of PTS and PTG and Indicators Included in the Latent Analysis.
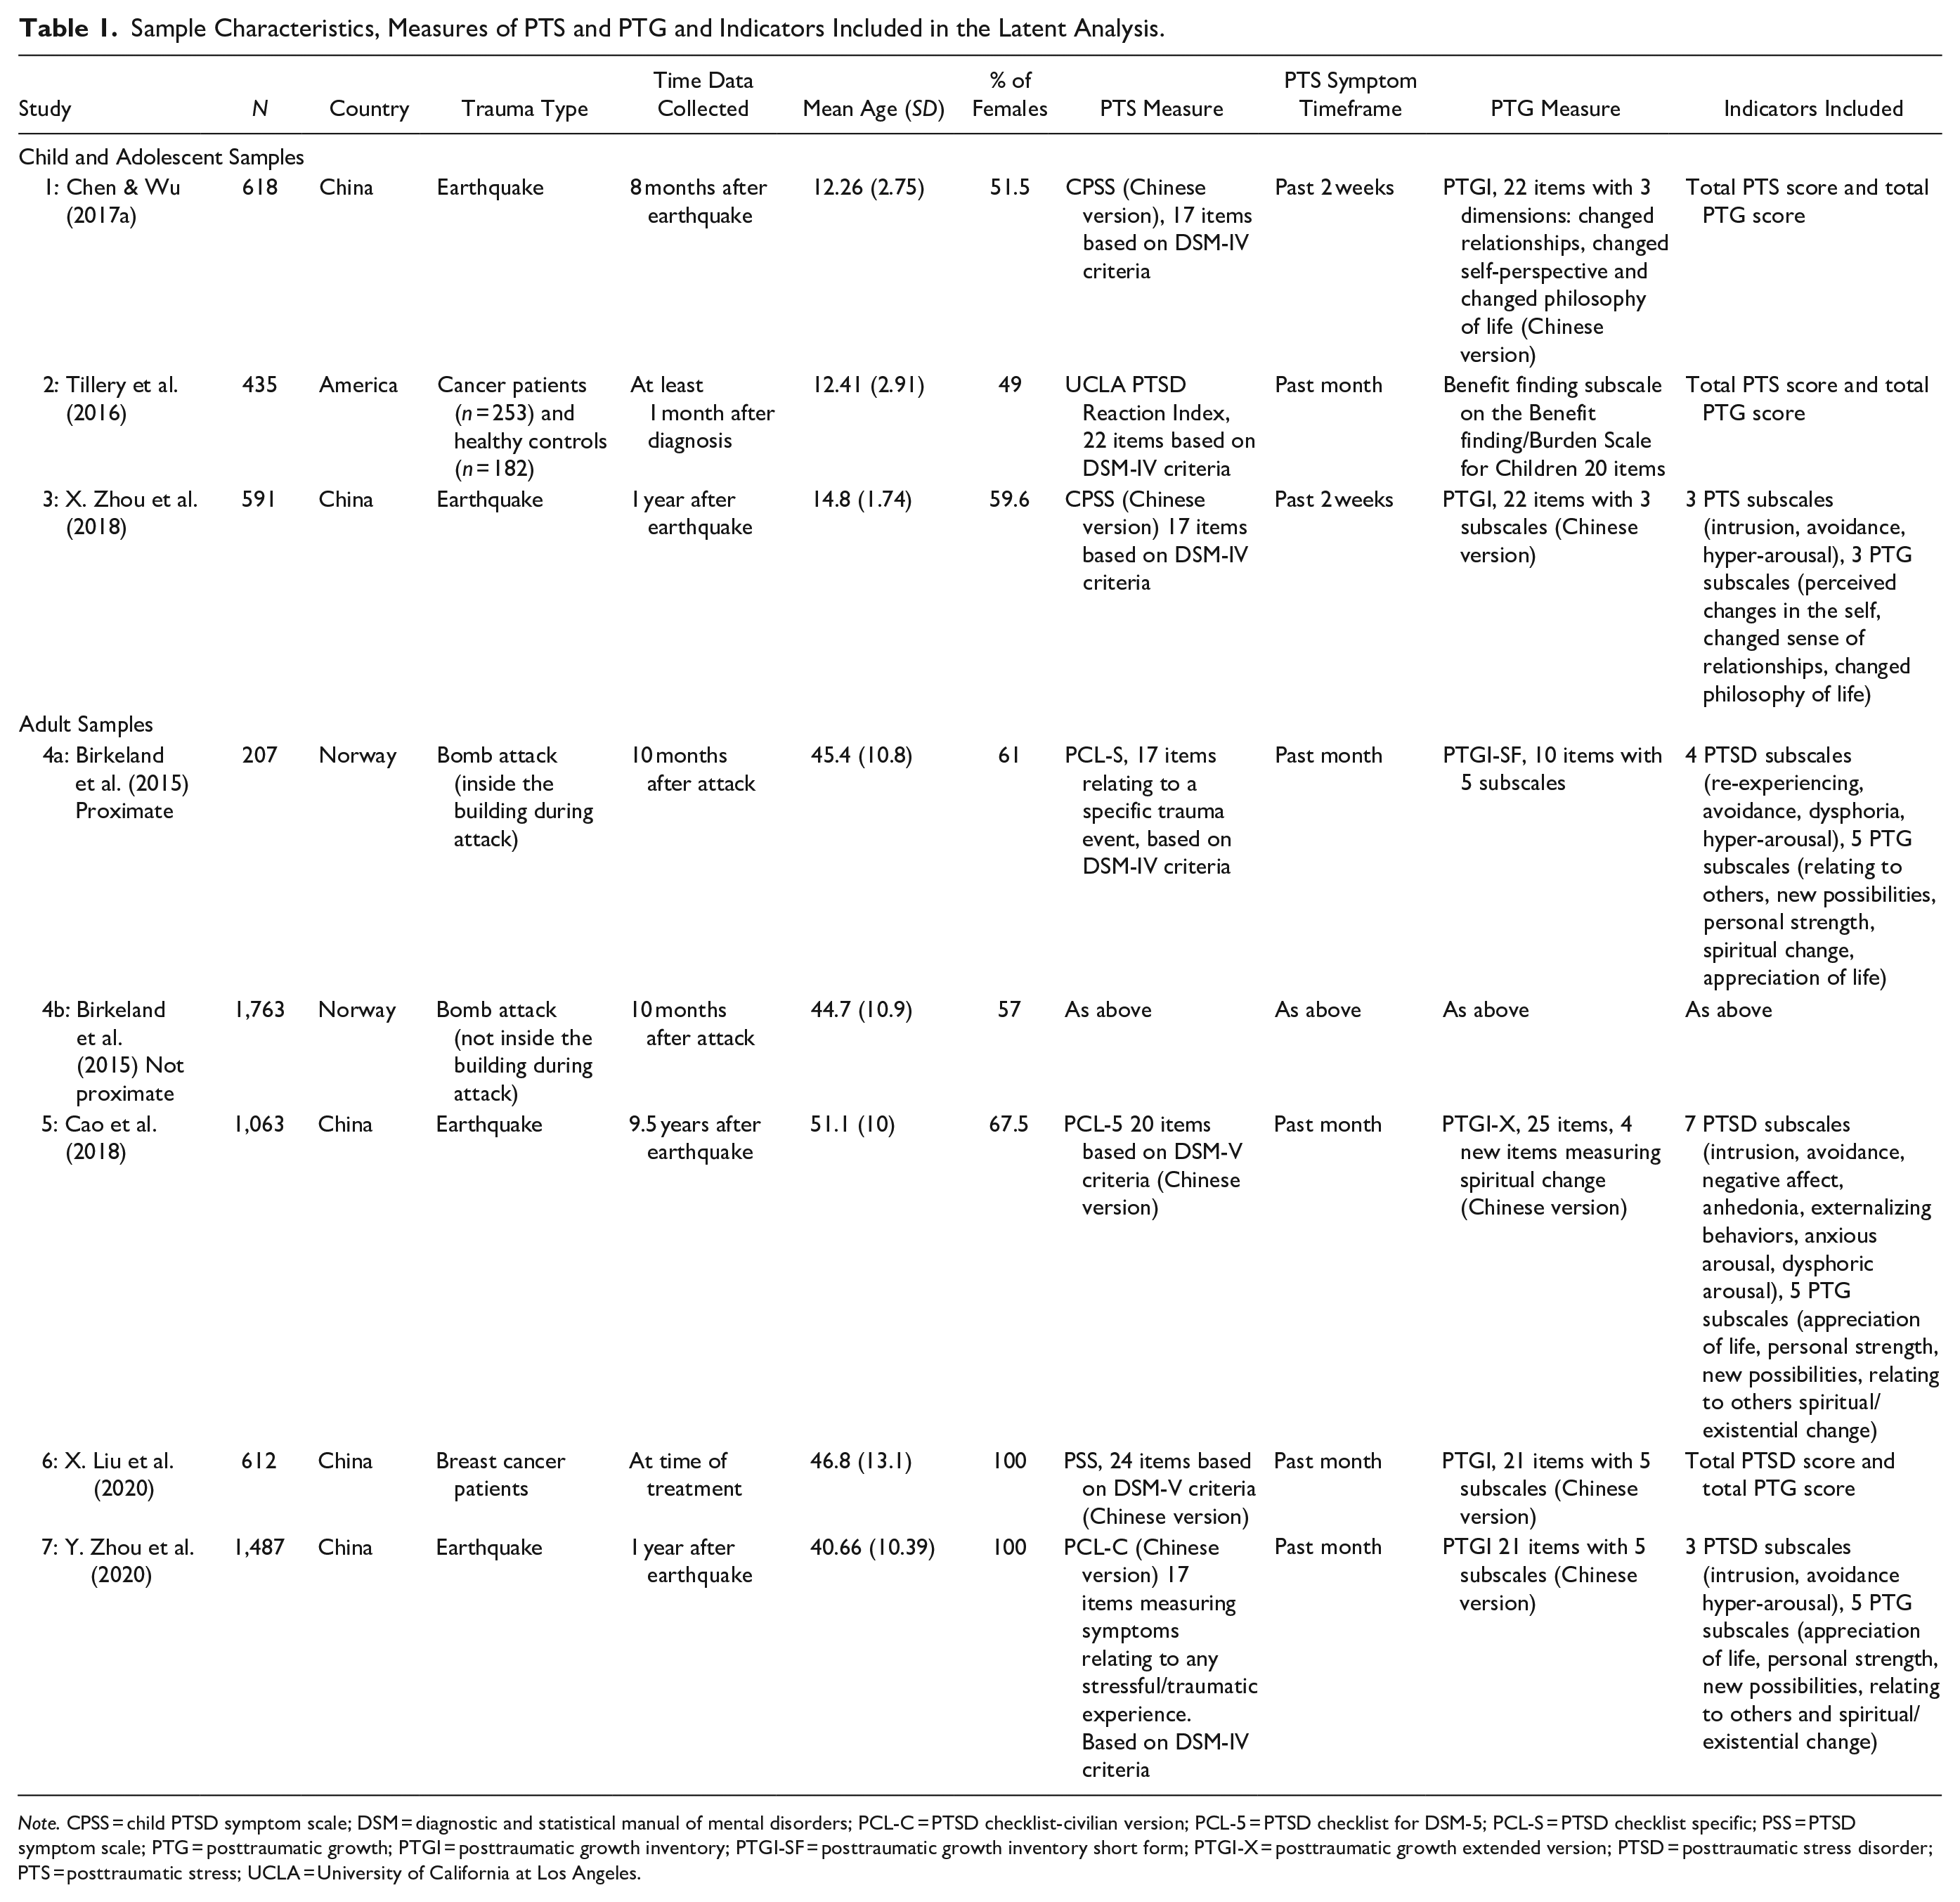
Note. CPSS = child PTSD symptom scale; DSM = diagnostic and statistical manual of mental disorders; PCL-C = PTSD checklist-civilian version; PCL-5 = PTSD checklist for DSM-5; PCL-S = PTSD checklist specific; PSS = PTSD symptom scale; PTG = posttraumatic growth; PTGI = posttraumatic growth inventory; PTGI-SF = posttraumatic growth inventory short form; PTGI-X = posttraumatic growth extended version; PTSD = posttraumatic stress disorder; PTS = posttraumatic stress; UCLA = University of California at Los Angeles.
Studies Using Child and Adolescent Samples
There were three studies that used child and adolescent samples. Information relating to the sample characteristics, measures of PTS and PTG and the indicators used in the latent is presented in Table 1.
Quality Analysis
A modified version of the GRoLTS criteria (Petersen et al., 2019; Van de Schoot et al., 2017) was used to examine the quality of the reporting and the replicability of studies. The studies had quality scores ranging between five (study 2) and nine (study 3) out of a possible score of 16 (see Table 2). All three studies clearly reported what software was used, what method was used to examine the covariates, the model comparison tools used for model selection and the entropy value. Two out of three studies reported fit statistics for all models (including a one class model; 1; 3) and used a plot/chart to present the final model (2; 3). Only one study reported the missing data mechanism (i.e., missing completely at random, missing at random, or not missing at random), described how the missing data was dealt with, reported the distribution of the observed variables (3), and numerically described the final solution (1). All studies failed to report variables related to the missing data, the parameter restrictions, the random start values and final number of iterations, the class sizes for each model, plots/charts for every model tested, and to make the syntax file available.
Fit Statistics Reported by the Studies Included in the Review.
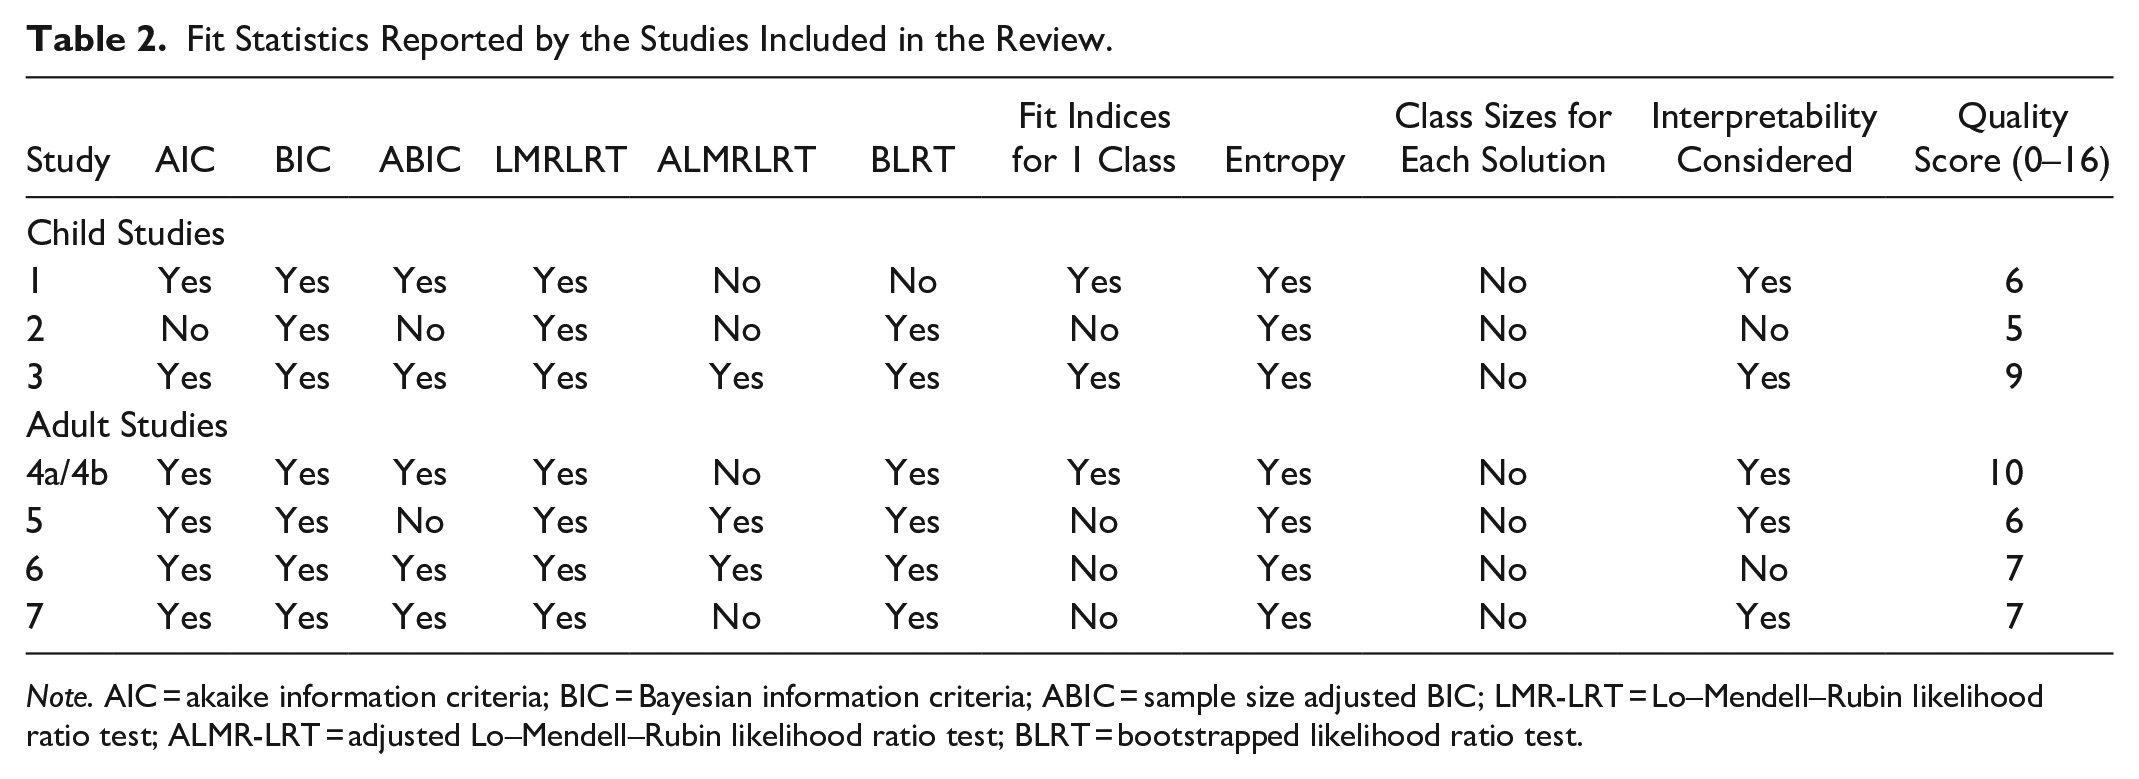
Note. AIC = akaike information criteria; BIC = Bayesian information criteria; ABIC = sample size adjusted BIC; LMR-LRT = Lo–Mendell–Rubin likelihood ratio test; ALMR-LRT = adjusted Lo–Mendell–Rubin likelihood ratio test; BLRT = bootstrapped likelihood ratio test.
Sample Characteristics
Sample sizes ranged from 435 (2) to 618 participants (1), with a mean sample size of 548 (SD = 80.71). Two studies (1; 3) included participants who lived in China and one included participants who lived in America (2). All studies included both males and females and had relatively balanced gender distributions; the weighted mean percentage of females was 53.98% (range = 49%‒59.6%). The weighted mean age of participants was 13.27% (range 12.26%‒14.8%). Two studies used samples of earthquake survivors (1; 3) and one used a mixed sample of child cancer patients and healthy controls (2). The time period between the trauma and the data collection ranged from at least 1 month (this relates the participants who had a cancer diagnosis; 2) and 1 year (following the earthquake; 3).
Measures
In all studies the measures were completed by the child participants. Measures of PTSD included the Child PTSD symptom scale (1; 3) which measured PTS symptoms within the past 2 weeks and the UCLA PTSD Reaction Index (2) which measured symptoms within the past month. All were based on DMS-IV criteria for PTSD. In terms of PTG, two studies (1, 3) used the Chinese version of the Posttraumatic Growth Inventory (PTGI) and one (2) used the Benefit finding subscale of the Benefit Finding/Burden Scale for Children.
Latent Analysis: Type of Indicators Used, and Methods Used to Select the Optimal Number of Classes
All studies used Mplus software (Muthén & Muthén, 1998–2015) and used continuous indicators in the analysis. Two (1; 2), used two indicators (total PTS and PTG scores) and one (3) used six indicators (individual subscales for PTS and PTG). All studies reported a range of fit statistics (presented in Table 2) including the Bayesian Information Criterion (BIC; Schwarz, 1978), the Lo–Mendell–Rubin adjusted likelihood ratio test (LMRLRT; Lo et al., 2001) and entropy (a measure of the quality of latent class classification). No studies reported class sizes for all the solutions.
Nature and Size of the PTS/PTG Classes
All of the studies found an optimal three class solution, with one class characterized by low PTS and PTG, one characterized by high PTS and PTG and one characterized by low PTS and high PTG (a description is presented in Table 3). A summary of the class sizes and weighted mean percentages (for all studies) is presented in Table 4.
Information on the Optimal Class Solution the Type of Analysis to Examine Covariates, The Covariates Included, and The Significant Covariates.
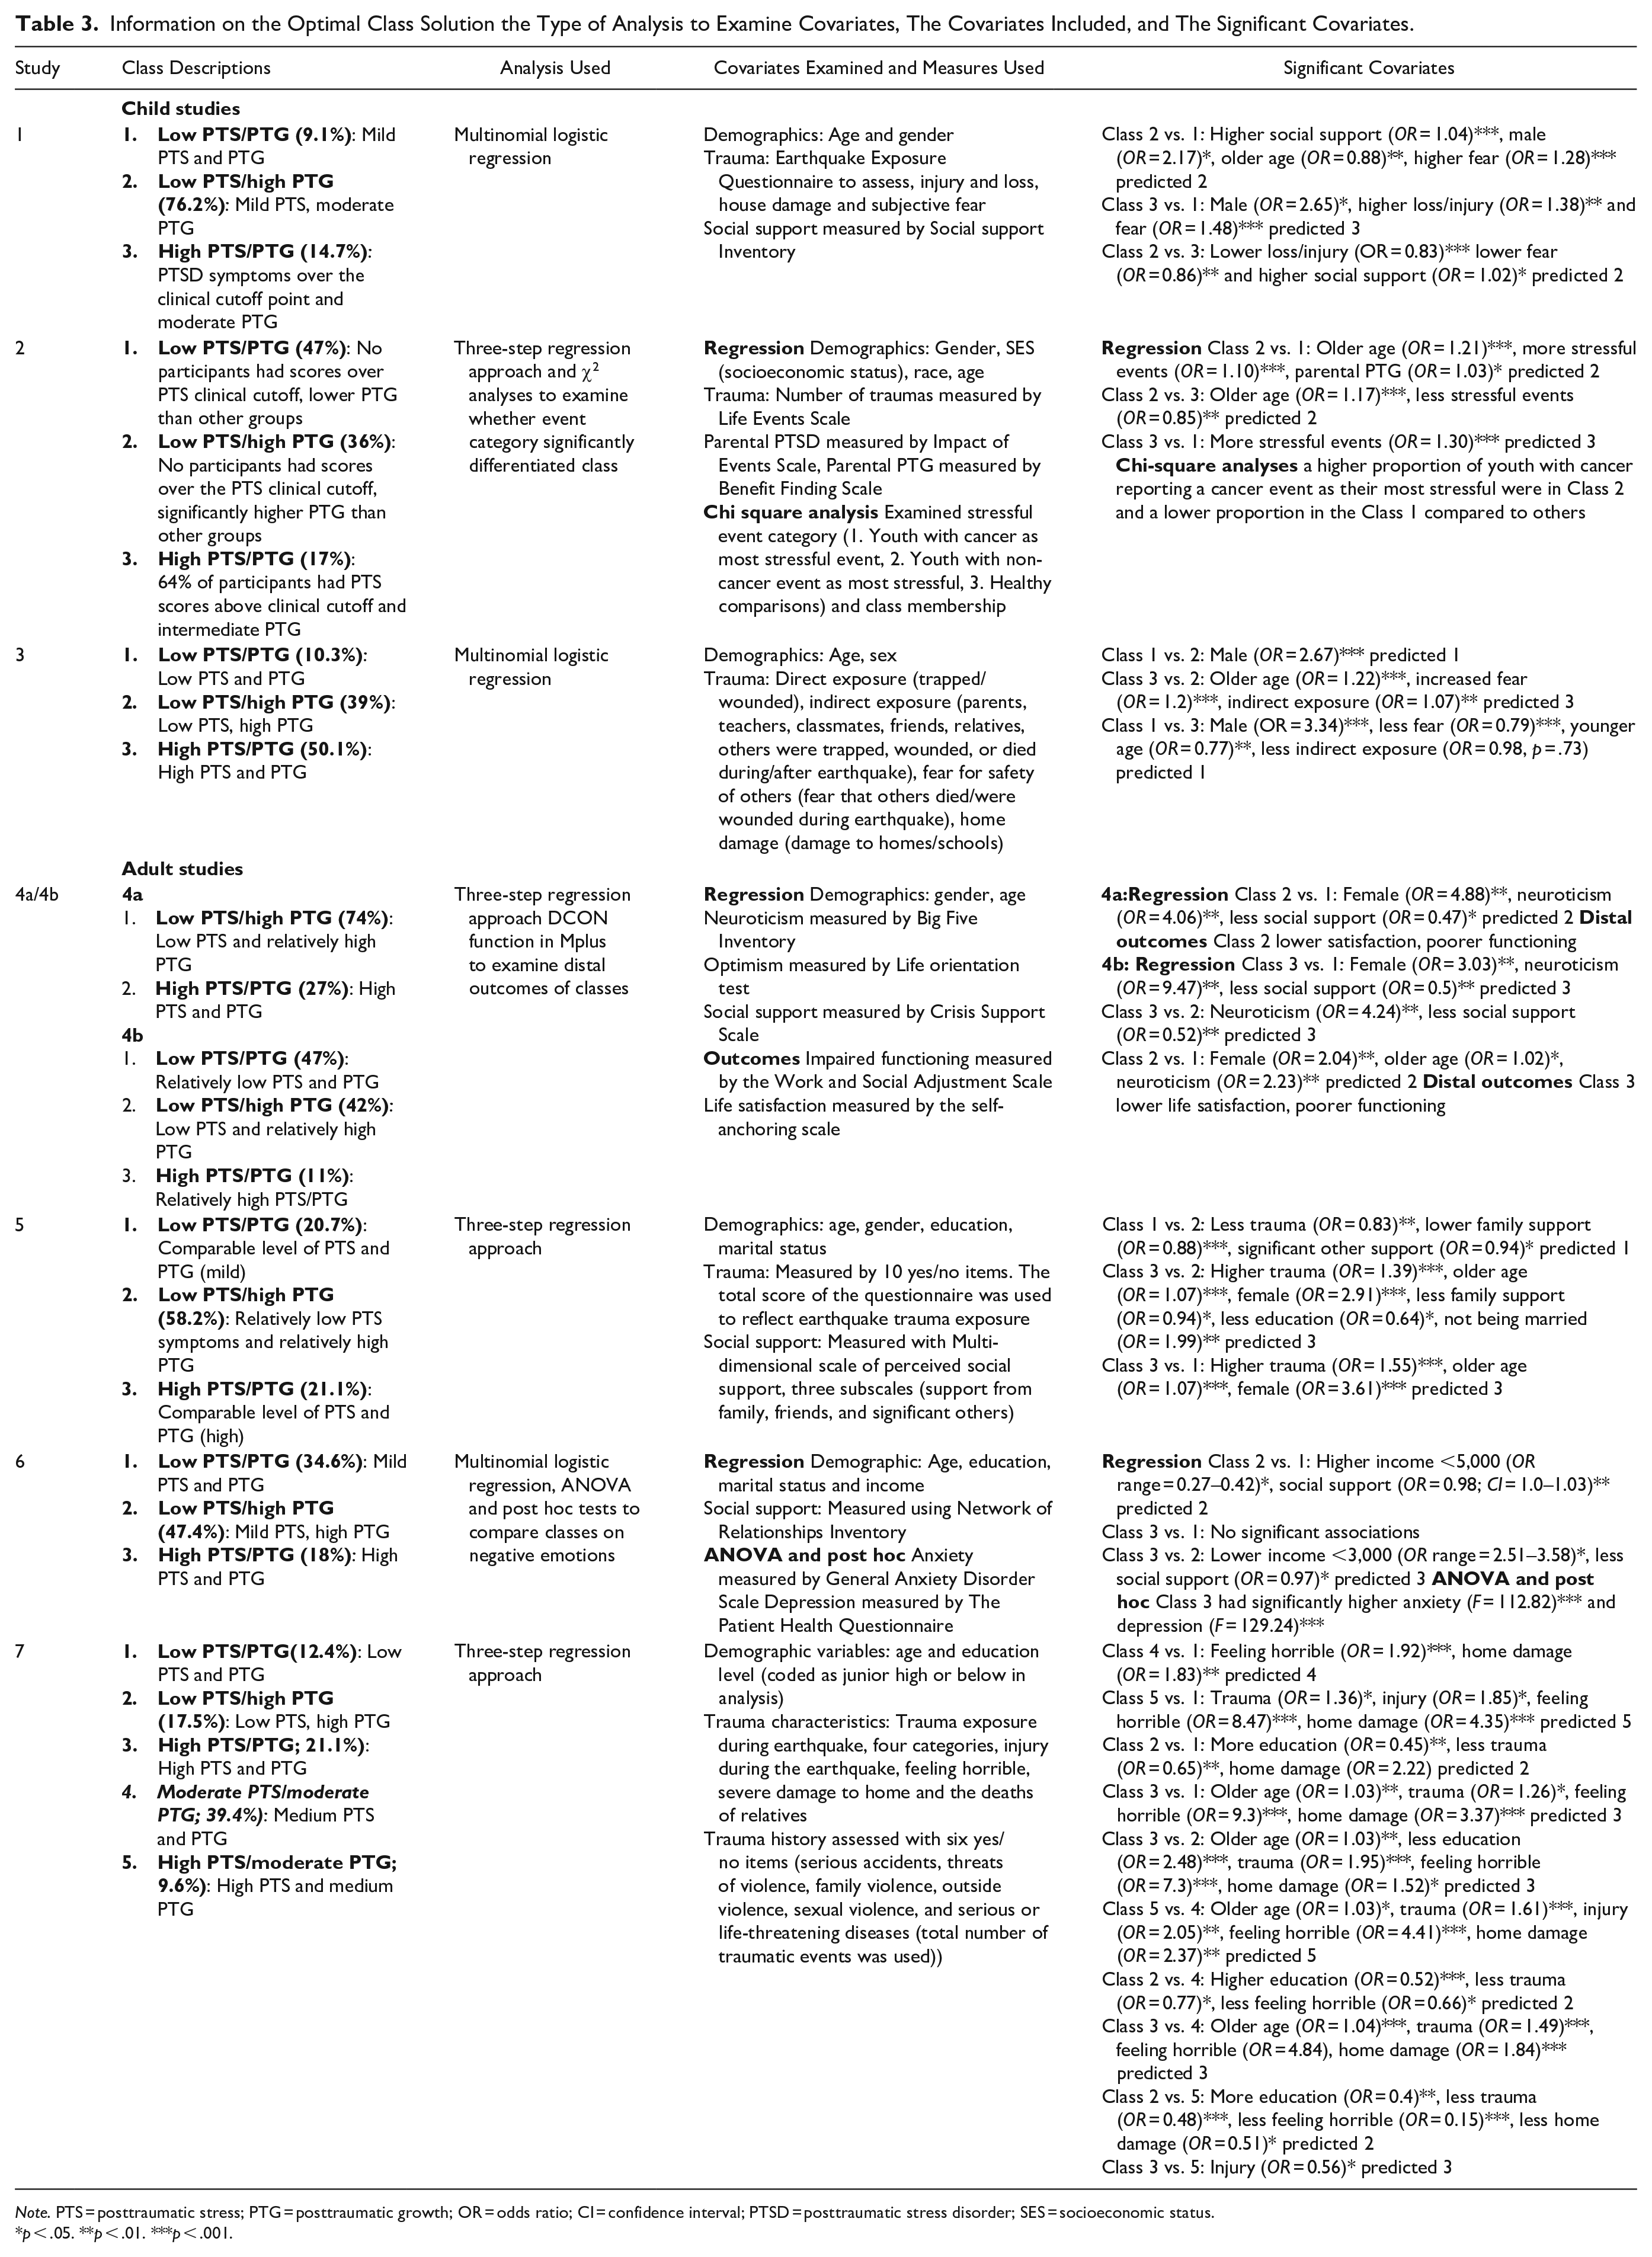
Note. PTS = posttraumatic stress; PTG = posttraumatic growth; OR = odds ratio; CI = confidence interval; PTSD = posttraumatic stress disorder; SES = socioeconomic status.
p < .05. **p < .01. ***p < .001.
A Summary of the Number of Studies that Found Each of the Three Main Classes, the Class Sizes, and the Weighted Mean Percentage of Participants in Each Class.
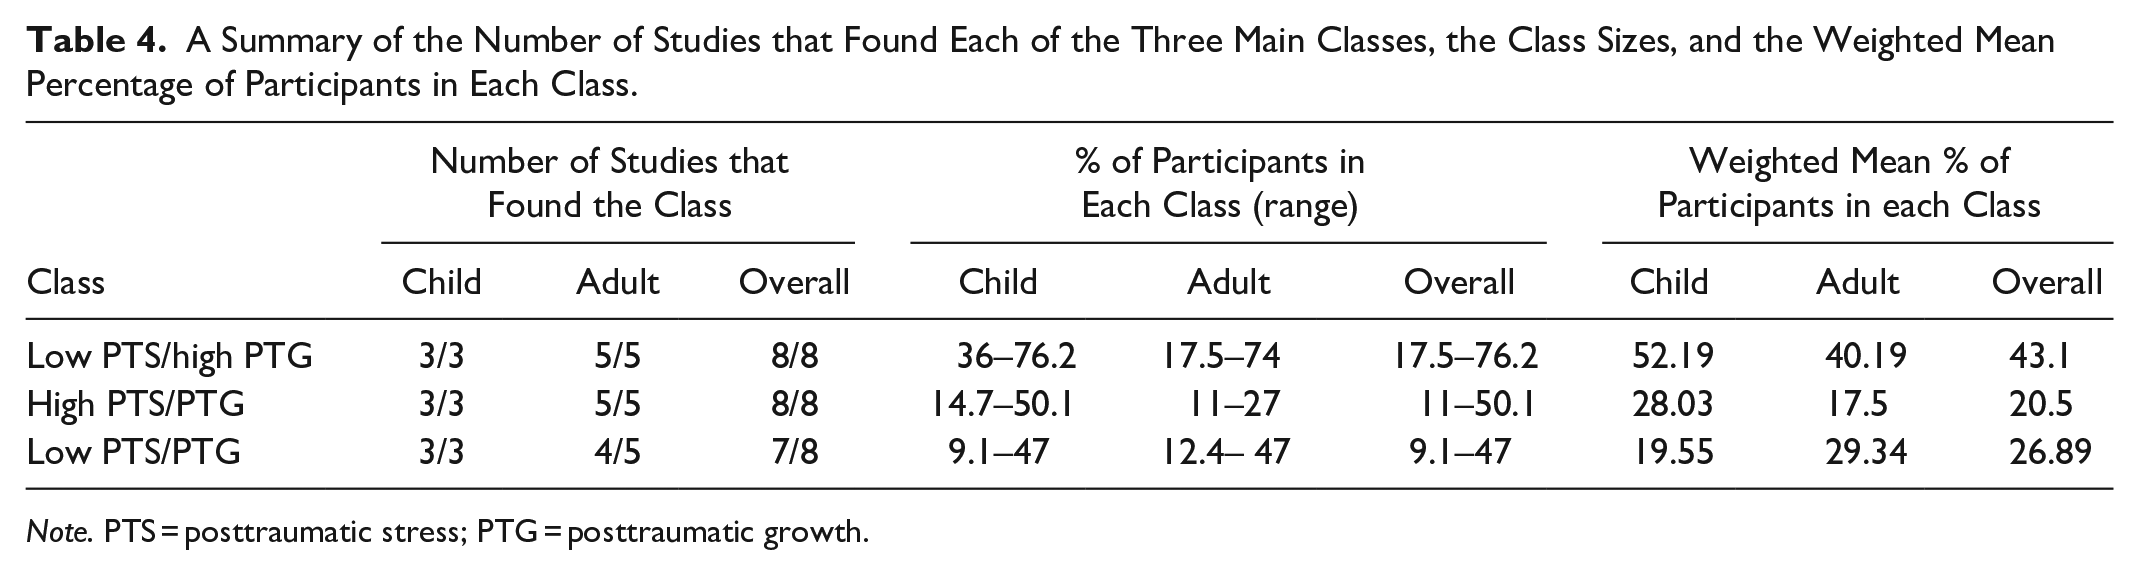
Note. PTS = posttraumatic stress; PTG = posttraumatic growth.
Low PTS/PTG class
All three studies found one class that was characterized by low PTS and low PTG (for the purpose of this review it will be referred to as the low PTS/PTG group). Authors labeled this class as the resilient class (1), the low symptom group (3), and the resilient low growth group (2). The weighted mean percentage of participants in this class was 19.55% (range = 9.1%‒47%).
Low PTS/high PTG class
All three studies found a group characterized by low PTS (below the clinical cutoff) and moderate to high PTG (in this review it will be labeled the low PTS/high PTG class). Authors labeled this the thriving group (1), the growth group (3), and the resilient high growth group (2). The weighted mean percentage of participants in this class was 52.19% (range = 36%‒76.2%).
High PTS/PTG class
Finally, all three studies found a group characterized by intermediate to high PTS and PTG (in this review it will be called the high PTS/PTG class). Two of the studies described this class as having PTS scores above the clinical cutoff point (1; 3) and another reported that 68% of participants met the clinical cutoff score (2). The levels of PTG ranged from intermediate/moderate to high. This class was labeled the stressed and growing class (1), the distressed class (2), and the coexistence class (3). The weighted mean percentage of participants in this class was 28.03% (range = 14.7%‒50.1%).
Covariates (Types of Analyses, Covariates Examined, and Significant Covariates)
Among the studies included there were differences in the statistical approaches used to examine the covariates (see Table 3). All of the studies used logistic regression but only one study used the three-step approach (Asparouhov & Muthén, 2014; 2). The number of variables examined in the regression analyses ranged between six (1; 3) and seven (2). A summary of the variables used in the regression models is presented in Table 5. In terms of demographic characteristics, all three studies examined age and sex. One study also examined socioeconomic status (SES) and race (2). Additionally, all three studies examined the role of trauma characteristics. Two studies examined earthquake related home damage (1; 3). Other earthquake related trauma characteristics examined were loss and injury and subjective fear (1), direct and indirect earthquake exposure and fear for the safety of others (3). One study examined the role of the total number of stressful life events (2). The roles of social support (1) and parental PTSD and PTG (2) were also examined. All studies varied in the variables that were found to be significantly associated with class membership. In terms of gender, there were inconsistent results. Two of the three studies found gender was significantly associated with class membership. One found that being male predicted membership in the low PTS/PTG class (3) and another found it was predictive of membership in the low PTS/high PTG or the high PTS/PTG class (1). All studies found that age was significantly associated with class membership. Two studies found that older age was associated with the low PTS/high PTG class when compared to the low PTS/PTG class (1; 2) and the high PTS/PTG class (2). One found it was associated with the high PTS/PTG class (3) when compared to the other groups. All three studies found that trauma characteristics were associated with class membership. One study found that more stressful events predicted membership in the low PTS/high PTG class or the high PTS/PTG class when compared to low PTS/PTG class. Additionally, less stressful events were associated with the low PTS/high PTG class when compared to the high PTS/PTG class (2). Two studies examined earthquake related trauma characteristics. When the low PTS/PTG class was compared to the low PTS/high PTG class, it was characterized by less subjective fear and indirect exposure (3). Conversely, participants in the low PTS/high PTG class experienced higher levels of fear (1). When the high PTS/PTG and the low PTS/high PTG classes were compared, the PTG class was associated with less loss, injury, and fear (1), conversely, the high PTS/PTG class was associated with higher indirect exposure and fear (3). Finally, when the high PTS/PTG class was compared to the low PTS/PTG class, it was associated with higher loss, injury, and fear (1) whereas the low PTS/PTG class was associated with lower fear and less indirect exposure (3). Other significant variables were social support and parental PTG. Increased social support (1) was associated with increased odds of membership in the low PTS/high PTG class when compared to the other classes. Finally, parental PTG was associated with membership in the low PTS/high PTG class when compared to the low PTS/PTG class.
Summary of Predictor and Outcome Variables Examined.
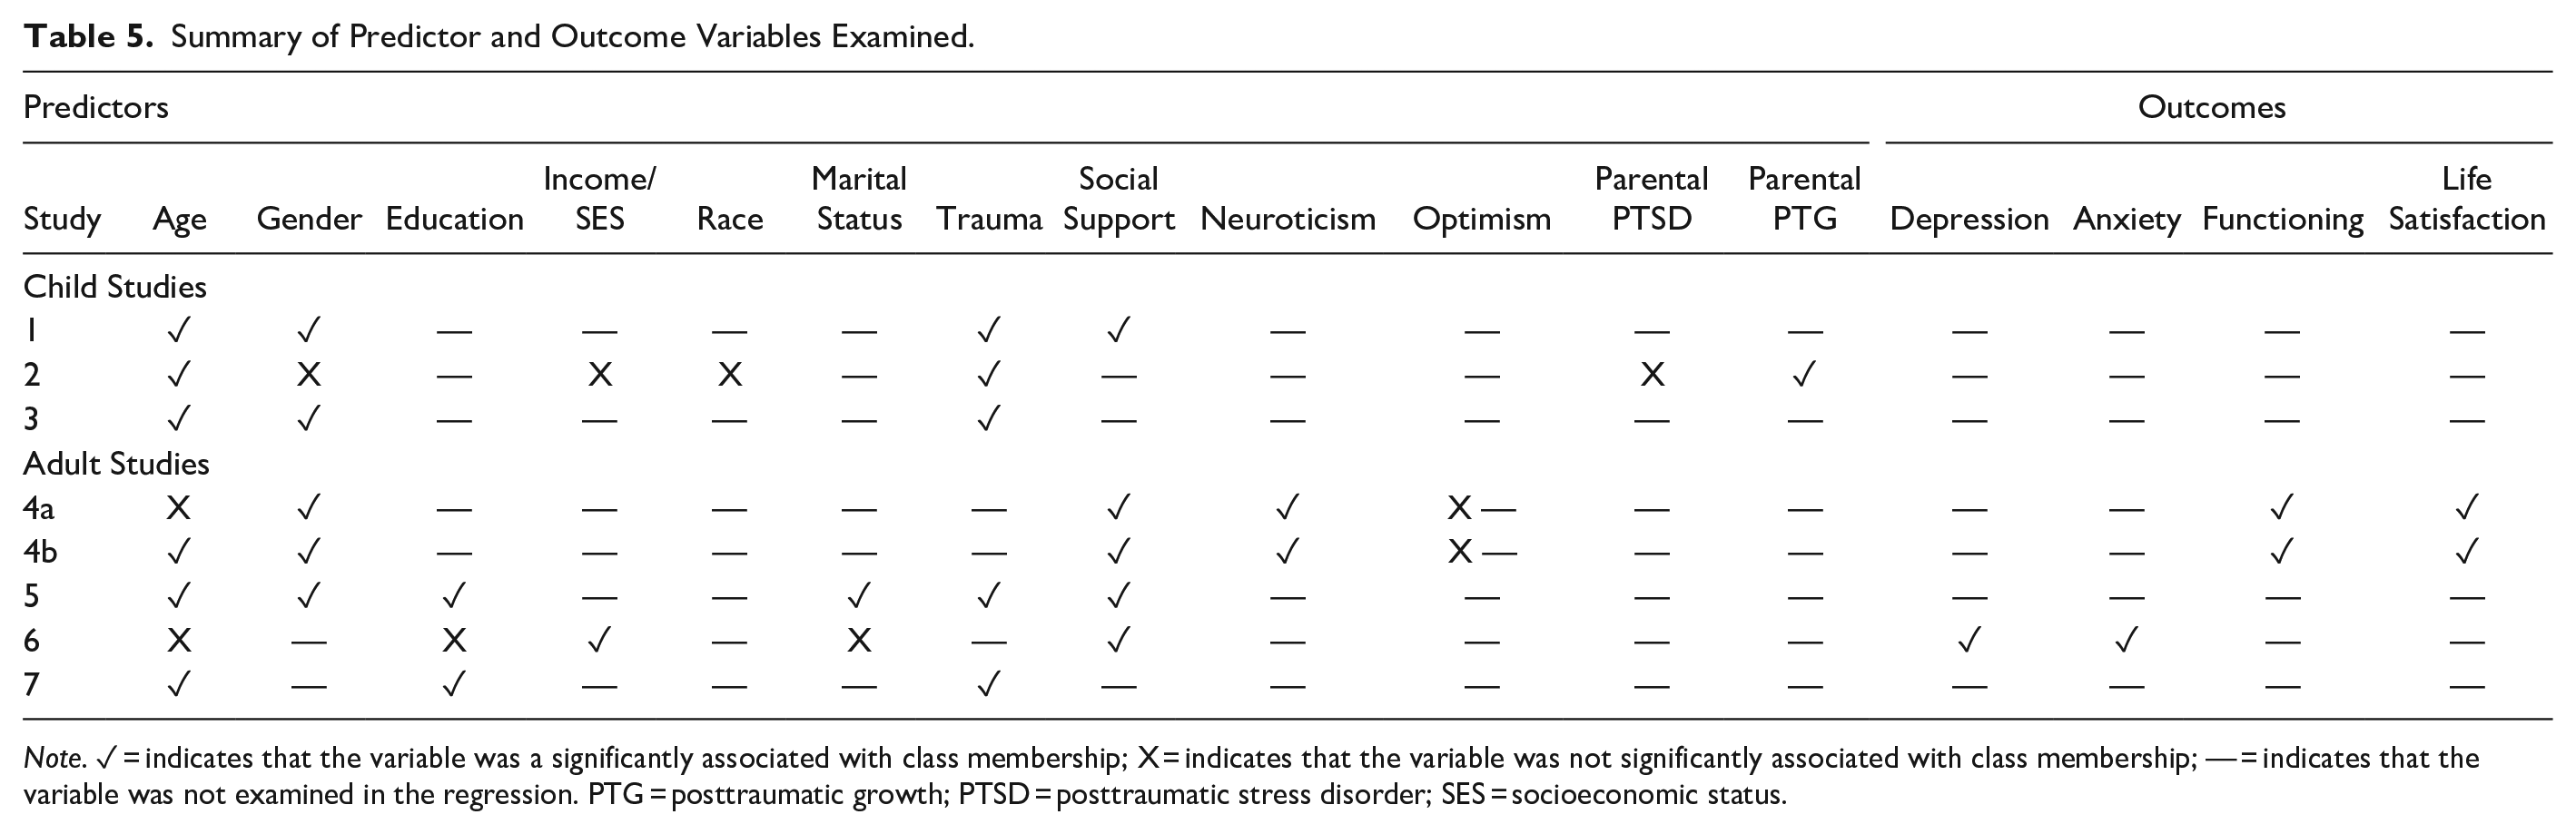
Note. ✓ = indicates that the variable was a significantly associated with class membership; X = indicates that the variable was not significantly associated with class membership; — = indicates that the variable was not examined in the regression. PTG = posttraumatic growth; PTSD = posttraumatic stress disorder; SES = socioeconomic status.
Studies Using Adult Samples
There were four studies that used adult samples. One of the studies (Birkeland, et al., 2015), conducted analyses in two separate subsamples (4a, included individuals who were physically proximal to the bomb and 4b, included individuals who were not physically proximate to the bomb). Each sample will be described separately meaning that there will be five analyses in adult samples discussed. Information relating to the sample characteristics, and the indicators used in the analysis is presented in Table 1.
Quality analysis
The GRoLTS (Van de Schoot et al., 2017) revealed variability in the quality of the reporting of statistical results. Scores ranged from 6 (5) to 10 (4a; 4b) out of a possible 16 (scores are presented in Table 2). All studies reported the software used, entropy, the method used to examine covariates, a range of fit statistics used to select the optimal model and described how missing data was handled. All studies also presented a chart/plot to show the final class solutions. All the studies however, failed to report, the parameter restrictions in the analysis, the number of random starts, and final iterations and the class sizes for each model. All studies also failed to present charts/plots for all models and provide syntax of the analysis. Only one study (4a; 4b) mentioned the missing data mechanism, the variables related to the missing data and the distribution of the observed variables and described fit statistics for the fitted models including the one class solution. Two of the studies numerically described the final class solution (6; 7).
Sample characteristics
Sample sizes ranged between 207 (4a) and 1,763 (4b) and the mean sample size was 1026.4 (SD = 565.54). Two of the studies were conducted with female only samples (6; 7). Within the mixed gender samples the weighted mean percentage of females was 60.95% (range = 57%‒67.5%). Three of the samples consisted of participants from China (5; 6; 7) and two consisted of participants living in Norway (4a; 4b). The weighted mean age of participants was 45.09% (range = 40.66%‒51.1%).
In relation to type of trauma, one sample consisted of breast cancer patients (6), two consisted of earthquake survivors (5; 7) and one study had two subsamples of survivors of a terrorist bomb attack, (4a; 4b). The time period between the trauma and the data collection ranged from 3 months (6) to 9.5 years (5).
Measures
Out of the five analyses, three used PTSD measures based on the DSM-IV criteria. These were the PTSD checklist (PCL) specific version (measuring symptoms relating to a specific experience; 4a; 4b) and the PCL Civilian version (to measure PTSD symptoms relating to any traumatic event; 7). Two studies used measures based on the DSM-V criteria. One used a Chinese version of the PCL version 5 to measure trauma symptoms related to the earthquake (5) and one used a Chinese version of the PTSD symptom scale (6). All measures examined PTSD symptoms within the past month. Measures of PTG included the Chinese version on the PTGI (6; 7), the Chinese version of the PTGI (extended; this version has four additional items and integrates existential and spiritual change; 5) and the PTGI short form.
Latent analysis: Type of indicators used, and methods used to select the optimal number of classes
Out of the five analyses, all were conducted in Mplus (Muthén & Muthén, 1998–2015) and all used continuous indicators; thus, were LPAs. In terms of indicators used (number of and type) there was a wide variation. One used two indicators (mean PTS/PTG scores; 6), one used eight indicators (five PTG indicators and three PTS indicators; 7), two used nine indicators (four PTS indicators and five PTG indicators; 4a; 4b) and one used 12 indicators (seven PTS indicators and five PTG indicators; 5). The fit indices and selection criteria used to select the optimal model are presented in Table 2. All of the studies reported the Akaike information criterion (AIC; Akaike, 1987), BIC (Schwarz, 1978), LMRLRT (Lo et al., 2001), the Bootstrapped Likelihood Ratio Test (BLRT; McLachlan & Peel, 2000),and the entropy. None of the studies reported the class sizes for each solution although one did report the proportion of participants in the smallest class (7). Only one study (with two analyses; 4a; 4b) reported fit indices for the one class solution.
Nature and size of PTS/PTG classes
There were differences in the numbers of classes selected. Out of the five analyses, one found a two class solution (4a), three found a three class solution (4b; 5; 6) and one found a five class solution (7).
Low PTS/PTG class
Four out five analyses found a class characterized by low PTS and PTG (4b; 5; 6; 7). These groups were called low stress/low growth (4b), mild PTSD, mild PTG (5; 7), and the resisting group (6). The weighted mean percentage of participants in this group was 29.34% (range = 12.4%‒47%).
Low PTS/high PTG class
A group characterized by low levels of posttraumatic stress symptoms and the presence of PTG was found within all samples. This class was labeled, mild PTSD/high PTG (5; 7), growth group (6), and low stress/high growth (4a; 4b). The weighted mean percentage of participants within this group was 40.19% (range = 17.5%‒74%).
High PTS/PTG class
All samples had a class characterized by relatively high PTS and PTG. These were labeled the high stress/high growth class (4a; 4b), high PTSD/high PTG (5), and the struggling group (6). The weighted mean percentage of participants in this group was 17.5% (range = 11%‒27%).
Other classes
In addition to a high PTS and PTG class, one study (7) also identified two additional classes labeled the moderate PTSD/moderate PTG group and the high PTSD/moderate PTG group.
Covariates (types of analyses, covariates examined, and significant covariates)
All the studies conducted regression analyses. Three out of the five analyses used the three-step approach (4a; 4b; 5). The number of covariates examined, ranged from five (4a; 4b) to eight (5). The demographic characteristics included in the analyses were age (4a; 4b; 5; 6; 7), gender (4a; 4b; 5), education (5; 6; 7), marital status (5; 6), and income (6). Social support was included in four of the analyses (4a; 4; 5; 6). Trauma characteristics that were studied, included earthquake exposure (5; 7) and number of traumatic events (7). Neuroticism and optimism were also examined (4a; 4b). In two samples, impaired functioning and life satisfaction were examined as distal outcomes of the classes (4a; 4b) and in another study ANOVA and post hoc tests to examine whether the classes differed in relation to anxiety and depression (6). Studies varied in terms of variables associated with the classes. In two samples, older age was associated with increased odds of membership in the high PTS/PTG class (5; 7) and in one, older age was associated with membership in the low PTS/high PTG class (4b). All three studies that examined gender found that being female predicted membership in the high PTS/PTG class (4a; 4b; 5). One study also found that being female predicted membership in the low PTS/high PTG class when compared to the low PTS/PTG class (4b). Two of the three studies that examined education, found that lower education was associated with the groups with higher PTS. Specifically, one study found lower education was associated with membership in the high PTS/PTG class (compared to the low PTS/high PTG class; 5) and another found it was associated with groups with higher PTS but lower (moderate) levels of PTG (7). One study found that not being married was associated with membership in the high PTS/PTG class (when compared to the low PTS/high PTG class; 5). Lower income was associated with increased odds of membership in the low PTS/PTG class and the high PTS/PTG class when compared to the low PTS/high PTG class (6). Two studies found that social support was associated with increased odds of membership in the low PTS/high PTG class (5; 6) and lower social support was associated with membership in the high PTS/PTG class (4a; 4b).
Discussion
The first aim of the review was to identify whether there are commonly identified patterns of co-occurring PTS and PTG. The three class solution was the most supported model, with six out of the eight analyses (three within child samples and three within adult samples) identifying three classes (not proximate; Birkeland et al., 2015; Cao et al., 2018; Chen & Wu, 2017a; X. Liu et al., 2020; Tillery et al., 2016; X. Zhou et al., 2018). The existence of subgroups within all the studies is consistent with previous evidence showing that trauma responses are heterogeneous (Bonanno & Mancini, 2012; Galatzer-Levy & Bryant, 2013). Despite a wide variation in methodological approaches, some trends in the nature of the patterns were identified. All eight analyses identified one subgroup characterized by low PTS and moderate to high growth (low PTS/high PTG class) which is in line with research that has shown a negative relationship between PTS and PTG (Hall et al., 2008; Ssenyonga et al., 2013). It has been suggested that within certain contexts PTG is protective against PTS (Hall et al., 2008). It is however also possible that the growth present in this group represents illusory growth (Cao et al., 2018). This is a self-protective strategy to facilitate coping with stressful experiences. Although illusory growth can act as a buffer in the aftermath of trauma, its positive impact can be short term and it can be associated with longer term adjustment difficulties (Frazier et al., 2009). Alternatively, the two component “Janus-Face” model postulates that PTG consists of both constructive (real positive adaptation resulting in better functioning) and illusory components (Maercker & Zöllner, 2004; Pat-Horenczyk et al., 2016).
A second identified pattern characterized by low levels of PTS and PTG, was present in seven out of the eight analyses (not proximate sample; Birkeland et al., 2015; Cao et al., 2018; Chen & Wu, 2017a; X. Liu et al., 2020; Tillery et al., 2016; X. Zhou et al., 2018; Y. Zhou et al., 2020). The existence of this group is supportive of studies that have found a positive relationship between PTS and PTG (A. N. Liu et al., 2017; Tiamiyu et al., 2016). It is thought PTG develops in response to a struggle with distressing experiences; although this can be related to PTS, it can also increase ruminative activity which can in turn facilitate the development of new meanings associated with PTG. Within this group the levels of distress may be too low to trigger the cognitive processes important in the development of growth. (Calhoun & Tedeschi, 2006; Tedeschi & Calhoun, 1996).
Within all eight samples there was a pattern characterized by relatively high PTS and moderate to high PTG (high PTS/PTG class). Y. Zhou et al. (2020) found two additional classes (moderate PTSD/moderate PTG and high PTSD/moderate PTG). The classes with similar levels of PTS and PTG offer further support to the research demonstrating a positive relationship between the constructs (A. N. Liu et al., 2017; Tiamiyu et al., 2016). Within these groups PTS-related distress may have increased the level of rumination which in turn could have facilitated the development of new meanings associated with growth (Calhoun & Tedeschi, 2006; Zhou et al., 2015). As with the low PTS/high PTG group it cannot be determined whether the growth in this group is real or illusory (or a combination of both). Additionally, although individuals within this group experience PTG, they also experience high levels of PTS. This demonstrates that the presence of growth does not necessarily mean that there are lower levels of distress. Research examining the relationship between PTG and levels of distress has been inconclusive, with some suggesting that PTG leads to lower distress (M. L. Wang et al., 2014) and others showing that distress does not change despite the presence of growth (Dekel et al., 2012).
Within the wider trauma literature, some studies have reported a quadratic relationship between PTS and PTG, whereby the relationship is positive until PTS reaches a certain level and at this point the relationship becomes negative (Shakespeare-Finch & Lurie-Beck, 2014). The low PTS/PTG classes and the high PTS/PTG classes support a positive relationship, and although none of the studies identified a class characterized by high PTS and low PTG, a quadratic relationship cannot be ruled out. It is possible that a pattern with high PTS and low PTG could be identified in longitudinal studies or in studies among survivors of repeated and severe trauma where the levels of PTS may be higher. Taken together, LCA/LPA has revealed that there are multiple patterns of PTS and PTG. These patterns demonstrate within-group homogeneity and between-group heterogeneity, suggesting these classes may be stable regardless of trauma type, life stage, length of time since trauma, and country.
The second aim of this study was to examine whether there were commonly identified factors that could distinguish PTS and PTG patterns. Six of the eight studies that examined age found that it significantly predicted class membership; however, findings were mixed. Consistent with research that suggests that females are more likely to engage in ruminative thinking (Johnson & Whisman, 2013) which is associated with both PTS (Arditte Hall et al., 2019) and PTG (Calhoun & Tedeschi, 2006), all three adult studies that examined gender found that being female was associated with the high PTS/PTG (Birkeland et al., 2015; Cao et al., 2018).
There was some evidence suggesting that lower education was associated with the high PTS/PTG class (compared to the low PTS/PTG class; Cao et al., 2018) and with groups with higher levels of PTS but lower (moderate) levels of PTG (Y. Zhou et al., 2020). Similarly, one of the two studies that examined SES/income found that lower income predicted membership in the high PTS/PTG class and the low PTS/PTG when compared to the low PTS/high PTG class. Conversely, higher income was associated with the low PTS/high PTG class (X. Liu et al., 2020). Less education is associated with lower SES and social position and therefore increased life stress and fewer resources (Dohrenwend & Dohrenwend, 1985), which could in part explain the poorer outcomes among these individuals.
All five studies examining the role of trauma characteristics found that they significantly predicted class membership. Experiencing a higher number of traumatic events and more severe trauma predicted membership in the high PTS/PTG class when compared to the low PTS/PTG (Cao et al., 2018; Chen & Wu, 2017a; Tillery et al., 2016; Y. Zhou et al., 2020) and the low PTS/high PTG classes (Cao et al., 2018; X. Zhou et al., 2018; Y. Zhou et al., 2020). This finding lends evidence to previous research demonstrating that increased trauma severity is a risk factor for greater mental health distress (Contractor et al., 2018) including higher levels of PTS (Briere et al., 2016). It also shows that despite the increased levels of PTS, this group can experience moderate to high growth, possibly due to cognitive processes associated with distress that can also facilitate personal growth (Calhoun & Tedeschi, 2006). Interestingly, increased trauma was also predictive of the low PTS/high PTG class when compared to the low PTS/PTG classes (Cao et al., 2018; Chen & Wu, 2017a; Tillery et al., 2016). This is in line with the idea that a certain level of trauma exposure is required to trigger PTG (Calhoun & Tedeschi, 2006). All five studies that examined social support found that it was a significant predictor of class membership. Higher social support was associated with the low PTS/high PTG class when compared to the low PTS/PTG class (Chen & Wu., 2017a; X. Liu et al., 2020) and the high PTS/PTG class (Chen & Wu, 2017a). Conversely, lower social support predicted membership in the high PTS/PTG class (Birkeland et al., 2015; X. Liu et al., 2020) and the low PTS/PTG class (X. Liu et al., 2020) compared to the low PTS/high PTG class. Consistent with previous research, these findings could suggest that social support protects against the development of PTS (Joseph et al., 1993; McIlveen et al., 2020; Mitchell et al., 2020) and promotes the development of PTG (McDonough et al., 2014). However, it is important to note that the directionality of these relationships cannot be assumed. There have been some studies suggesting that PTS leads to lower social support (Nickerson et al., 2016) and in 2021, Y. Wang et al. (2021) conducted a meta-analysis to examine the longitudinal relationship between PTSD and social support and results indicated a reciprocal relationship between the variables.
Other significant variables included neuroticism, (Birkeland et al., 2015) and parental PTG (Tillery et al., 2016), and future studies should attempt to replicate these findings. Within four of the samples, additional analyses were conducted to examine outcomes variable. In relation to outcomes of the classes, results revealed that individuals within the high PTS/PTG class may experience more distress. Specifically, individuals in this class were more likely to have lower life satisfaction and an increased impairment in functioning (Birkeland et al., 2015) as well as higher levels of anxiety and depression (X. Liu et al., 2020). Clinicians should be aware that post trauma, these individuals (with both high PTG and PTS) may benefit from additional support due to their increased risk of experiencing negative psychological outcomes. This finding suggests that higher PTG does not necessarily lead to lower distress. Nevertheless, it may still have value in terms of other positive changes (e.g., a greater appreciation of life and closer relationships). Further studies are required to replicate these findings and to examine other outcomes which may be associated with group membership (such as psychological distress and quality of life). In summary, this review identified a number of trends in the covariates associated with the PTS/PTG patterns identified. Social support and trauma characteristics were consistently found to predict class membership. Although many of the variables examined were stable and therefore could not be targeted in treatment (such as age, gender, and trauma experience), the findings could be used to assist clinicians to identify individuals who may be more or less likely to be in each subgroup.
The findings from this review have highlighted that person-centered analyses can capture the heterogeneity in posttraumatic response patterns. Knowledge of the PTS/PTG patterns can add to the theoretical base for developing differentiated psychological interventions for those who have experienced trauma. Although these methods can be useful in helping us to understand the complex relationship between PTS and PTG they have a number of limitations which could potentially reduce their utility. Firstly, LCA/LPA are considered exploratory methods; this could potentially lead to classes that represent statistical artefacts, lacking reliability and validity (Bauer & Curran, 2003; Lanza & Cooper, 2016). If the reliability and validity of the class is not examined in it is possible that the classes could be specific to the study sample. The reliability of the classes can be determined by conducting the same analysis within different samples or using subsets of the study samples (Bauer & Curran, 2003). Notably, only one of the studies (Birkeland et al., 2015) conducted the same analysis within two different samples and found a different number of classes. It could be argued that the classes lack reliability; however, six out of the eight analyses found an optimal three class solution and had similar classes, which may suggest that this is not the case. Future studies should consider testing the reliability of the classes in order to improve the level of rigor. All the studies within this review examined the subgroups in relation to relevant covariates and the findings suggested that the groups were valid and meaningful rather than artificial. Secondly, there is a risk of misclassification when individuals are assigned class membership (Nagin, 2005). It is possible that the studies with a higher number of indicators included in the analysis had lower classification error (Wurpts & Geiser, 2014) and this should be considered when interpreting the findings of the current review. Thirdly, the final number of classes selected depends on a number of decisions made by the researchers (Van de Schoot et al., 2017). The optimal class solution should be selected based on a combination of fit indices as well as interpretability (Collins & Lanza, 2010; Nylund et al., 2007). Although there was variation in relation to the fit statistics examined, all studies examined a range of fit indices, within six of the eight samples interpretability was considered and all studies reported the recommended BIC (Schwarz, 1978) which is thought to outperform other indices (Nylund et al., 2007). Fourth, the quality analysis (Petersen et al., 2019; Van de Schoot et al., 2017) revealed that there was variation in the reporting of the results. There were some areas that were consistently reported by authors, such as the methods used to examine covariates and the statistics used to select the optimal model. Other areas were not consistently reported such as, numerical descriptions of the final model and reporting fit statistics for the one class solution. There were also some areas that all studies failed to report, such as, the parameter restrictions and the random start values. These findings demonstrate that there is poor consensus in relation to statistical reporting between the studies and there are a number of important details relating to model specification, identification, and selection that were not reported by any of the studies. Incomplete reporting of results can reduce utility of this method as it can impact the interpretation and critical appraisal of the findings as well as making it difficult to replicate the findings and to compare results with other studies (Van de Schoot et al., 2017). Lastly, the utility of the method partially relies on the labels given to the classes. All studies included in this review labeled the classes based on the level of PTS and PTG relative to other classes which may be misleading. For example, moderate in one study could potentially be labeled as high in another study. As only three studies (Chen & Wu, 2017a; X. Liu et al., 2020; Y. Zhou et al., 2020) numerically described the subgroups and there were variations in the measures and indicators used, it was not possible to directly compare the levels of PTS/PTG across studies.
Person-centered analyses do however have a benefit over variable level analyses as they can capture the heterogeneity present within the study samples. The existence of multiple subgroups may explain why there are many inconsistencies in the literature with regard to the relationship between PTS and PTG (Cao et al., 2018; X. Liu et al., 2020). These methods have also allowed researchers to examine covariates that distinguish the groups. This has been important as it has allowed for the identification of risk and protective factors that can inform the development of interventions. Thus, despite the limitations of person-centered analyses, it has allowed researchers to make unique contributions to the literature that can enhance our understanding of the complex and controversial relationship between PTS and PTG. Incomplete reporting can reduce the utility of these methods and it is recommended that future studies consider using the GRoLTS (Van de Schoot et al., 2017) checklist to improve the reporting quality.
This review has a number of limitations which should be considered when interpreting the results. The eligibility criteria did not state that all participants within the study samples should have experienced trauma (e.g., one of the studies included used a mixed sample of cancer patients and healthy controls [Tillery et al., 2016]). This means that the conclusions do not relate solely to survivors of trauma. Additionally, there was a high degree of heterogeneity in relation to the methodologies (including the measures used, sample characteristics, and indicators used in the analysis); this reduced the comparability of the studies. Although similar classes were found in many of the studies, the percentage of participants in each class varied widely across studies which may be partly explained by the differences in methodologies.
This review included studies which were conducted in the US, China, and Norway. There has been some evidence showing that responses to trauma can vary across cultures (Hinton & Lewis-Fernandez, 2011). The results in this study however suggest that the three main classes are stable across cultures. Given the small number of studies, these findings should be replicated in other countries, including lower-income countries. All of the studies included in the review were cross-sectional in nature; therefore there was no information about the stability of classes over time. Longitudinal studies using methods such as LTA or latent growth mixture modeling could improve our understanding of how the varying patterns of PTS and PTG change across time (e.g., some symptomatology may remain consistent, some may worsen, and some may improve). One longitudinal study used LTA to examine transitions in classes of PTS and PTG between 8 and 20 months after an earthquake (Chen & Wu, 2017b). The study found the same three classes were present at both time points and there were three transition pathways (labeled struggling to resilient, thriving to resilient, and thriving to struggling). Further research is required to understand how the complex relationship between PTS and PTG changes over time but also to identify clinically relevant predictors (e.g., coping styles and social support) of the changing patterns, as this could inform the planning of targeted interventions. Also, in order to advance our current knowledge of PTS and PTG patterns, future studies should seek to improve the rigor with which LCA/LPA is applied and reported by referring to the GRoLTS (Van de Schoot et al., 2017) when designing studies.
The studies included involved participants who were either survivors of community-wide traumas (e.g., natural disasters and bomb attacks) or cancer patients. None of the studies specifically focused on survivors of interpersonal trauma which is one of the most common trauma experiences (Stein et al., 2010). Future studies should examine PTS/PTG subgroups within this population. Additionally, studies are required in populations that are known to experience high levels of multiple and repeated traumas (such as first responders, the military, refugees, etc.). Within these populations, high levels of trauma and PTS would be expected and could potentially identify a pattern with high PTS and low PTG. Finally, all of the studies used self-report measures of PTG. It is not known the extent to which these measure actual positive change following trauma (Park & Sinnott, 2018) and Boerner et al. (2017) suggested that self-report measures of PTG may reflect illusory growth rather than actual positive change.
In conclusion, this review is the first to systematically compile data on empirically derived patterns of PTS and PTG and the clinically relevant variables that can distinguish the subgroups. The evidence presented, supports the idea that trauma responses are highly heterogeneous, and three common PTS/PTG patterns were identified (low PTS/low PTG, high PTS/PTG, and low PTS/high PTG). The evidence suggests that these groups are stable across different study populations. Clinicians should be aware of this finding and should consider assessing for both PTS and PTG among trauma survivors. This review identified a number of factors that were robustly associated with class membership; this could help clinicians to identify individuals who may be more or less likely to be in each subgroup. For example, more severe trauma was found to predict the high PTS/PTG class and the low PTS/high PTG class. The findings suggested that social support is associated with lower PTS and higher PTG. It could be suggested that this is a protective factor which should be targeted in treatment; however, due to the cross-sectional nature of the studies, the direction of the relationship cannot be concluded. The studies also consistently found that the high PTS/PTG class was more likely to experience further negative outcomes (depression, anxiety, lower functioning, and life satisfaction) and therefore these individuals may benefit from additional support. Finally, despite limitations in reporting the findings, person-centered analyses have contributed to our understanding of the complex and multidimensional relationship between PTS and PTG by capturing the highly heterogeneous nature of trauma responses.
Critical findings
Seven studies (and eight analyses; n = 6,766) were included in the review
Studies found between two and five classes of co-occurring PTS and PTG
The majority (n = 6) found three classes of PTS and PTG, these were labeled (1) low PTS/PTG (26.89%), (2) high PTS/PTG (20.5%), and (3) low PTS/high PTG (43.1%)
Social support was associated with membership in the low PTS/high PTG class
A higher number of traumatic events and more severe trauma were predictive of membership in the high PTS/PTG class and the low PTS/high PTG class
Participants in the high PTS/PTG were more likely to have higher anxiety, depression, poorer functioning and decreased life satisfaction
There is a need to improve the rigor with which LCA/LPA is applied and reported when exploring the highly heterogeneous nature of trauma responses
Implications
Clinicians should consider assessing both PTS and PTG among trauma survivors
Clinicians should be aware that individuals who have experienced more severe trauma exposure may be more likely to have higher levels of both PTS and PTG
Individuals with higher levels of co-occurring PTS and PTG may be at a greater risk of experiencing depression, anxiety, lower functioning and life satisfaction and therefore may benefit from additional support
All of the studies that examined social support found that it was associated with lower levels of PTS and higher levels of PTG. It could be suggested that social support is protective; however, further studies are needed to establish the directionality and causality of the relationship
In order to advance our current knowledge of PTS and PTG patterns, future studies should seek to improve the rigor with which LCA/LPA is applied
Footnotes
Declarations of Conflicts of Interest
The author(s) declared no potential conflicts of interest with respect to the research, authorship, and/or publication of this article.
Funding
The author(s) received no financial support for the research, authorship, and/or publication of this article.