
Abstract
Pre-enrolment self-assessments are a promising way to address student commitment and retention in an early stage. Such assessments aim to inform study decisions by evoking reflection and providing advice for further preparation. Though these assessments require a solid validation process, so far the consequential validity aspect tends to be ignored. To address this gap, the current study investigates self-assessment impact on study choice certainty and enrolment as well as self-assessment fairness. Prospective students (N = 662) orienting towards studying in higher online education took a self-assessment consisting of six subtests. The impact appeared in line with the assessment's purpose for 68.9% of the prospective students: their study choice certainty was adapted or remained unchanged in accordance with their obtained scores. Study choice certainty after the self-assessment related positively to enrolment probability. Additionally, the impact appeared fair (similar across subgroups), though men's study choice certainty appeared relatively robust against unfavourable scores.
Introduction
To enhance retention in higher (online) education, student commitment should be addressed in an early stage, even prior to enrolment (Muljana & Luo, 2019). One way to do so is by pre-enrolment self-assessments, in which prospective students receive information about where they stand in regard to the demands of studying in higher (online) education (e.g. Nolden et al., 2019). These instruments are advisory and information instruments, which are conducive to self-examination (Hornke et al., 2013). In such self-assessments, prospective students complete tests on factors that are relevant for a solid start and continuation in higher education (Delnoij et al., 2021; Nolden et al., 2019). For instance, in the Self-Reflection Tool by Nolden et al. (2019), prospective students take subtests on factors such as self-discipline, motivation, and learning strategies. Feedback aligned to those tests aims to raise awareness and self-reflection (Broos et al., 2018, 2019; Delnoij et al., 2020b; Nolden et al., 2019). For example, Broos et al. (2018, 2019) provide feedback including information on the obtained subtest scores, compared to successful students in the first year after enrolment, and advice for further preparation. The aim of such information is to support prospective students in making well-informed study decisions and possibly leads to early remediation, all for a successful start and success in higher education (Broos et al., 2018, 2019; Kubinger et al., 2012; Muljana & Luo, 2019; Nicol, 2009; Nolden et al., 2019; O’Regan et al., 2016; Tinto, 2000; Van Klaveren et al., 2019).
With an eye on the possible continuation of online education after the Covid-19 pandemic (Gomez Recio & Colella, 2020), strategies to enhance retention in the context of online higher education have become even more relevant. There is no doubt that retention is a serious issue in this context, as demonstrated by its place on institutional agenda's for many years (Muljana & Luo, 2019; Rovai, 2003; Simpson, 2010). Considering that self-assessments prior to student enrolment seem a promising approach in higher education more generally (Fonteyne & Duyck, 2015; Kubinger et al., 2012; Nolden et al., 2019), we developed a similar instrument for prospective students in higher online education. So far, the development and validation of these types of self-assessments has received little (public) attention (Niessen & Meijer, 2017). In other words, there is a lack of clarity about when and under what circumstances such instruments are effective. Therefore, this study aims to provide an example of how to evaluate the impact of self-assessments and to shed light on the validity of decisions based on these assessments.
Based on previous studies (Delnoij et al., 2020a, 2020b, 2021, 2022), the present self-assessment (hereafter ‘SA’) entails six subtests divided in three categories of tests: attitude (i.e., discipline and study expectations), knowledge and skills (i.e., numerical skills and study strategies), and personal situation (i.e., social support and hours planned to study). Prospective students choose which and how many subtests they want to take. On each subtest, they receive feedback about their obtained score in relation to the chances of success after enrolment (i.e. a ‘high’, ‘medium’, or ‘low-risk’ score). An explanation of the measurement and concrete suggestions on how to address possible risks indicated by their obtained score complete the feedback information. The SA does not differentiate between or provide advice for specific study directions. Also, it is not committal or aimed at selecting students. Rather, the aim is to enable informed decision-making (food for thought), and to encourage prospective students to start well-prepared (feedback for action).
The Quest for Validity
Pre-enrolment instruments providing prospective students information about their chances for success potentially have far-reaching impact both for the student in terms of decision-making and progress, and for the institute in terms of enrolment and success rates (Van Klaveren et al., 2019). It is important that such an impact is theory- and data-driven (Nolden et al., 2019). Therefore, assessment procedures in the context of access to higher education - even for non-selective purposes - require a substantive and solid development and validation process (Niessen & Meijer, 2017).
Hence, in line with modern validity theories, the development process of the present SA involves evaluation of five sources of validity evidence (AERA et al., 2014), corresponding to the content, predictive, internal structure, process, and consequential aspects of validity. Table 1 explains all five sources of validity evidence illustrated with examples in the context of pre-enrolment self-assessments.
Explanation and Examples of the Five Sources of Validity Evidence.
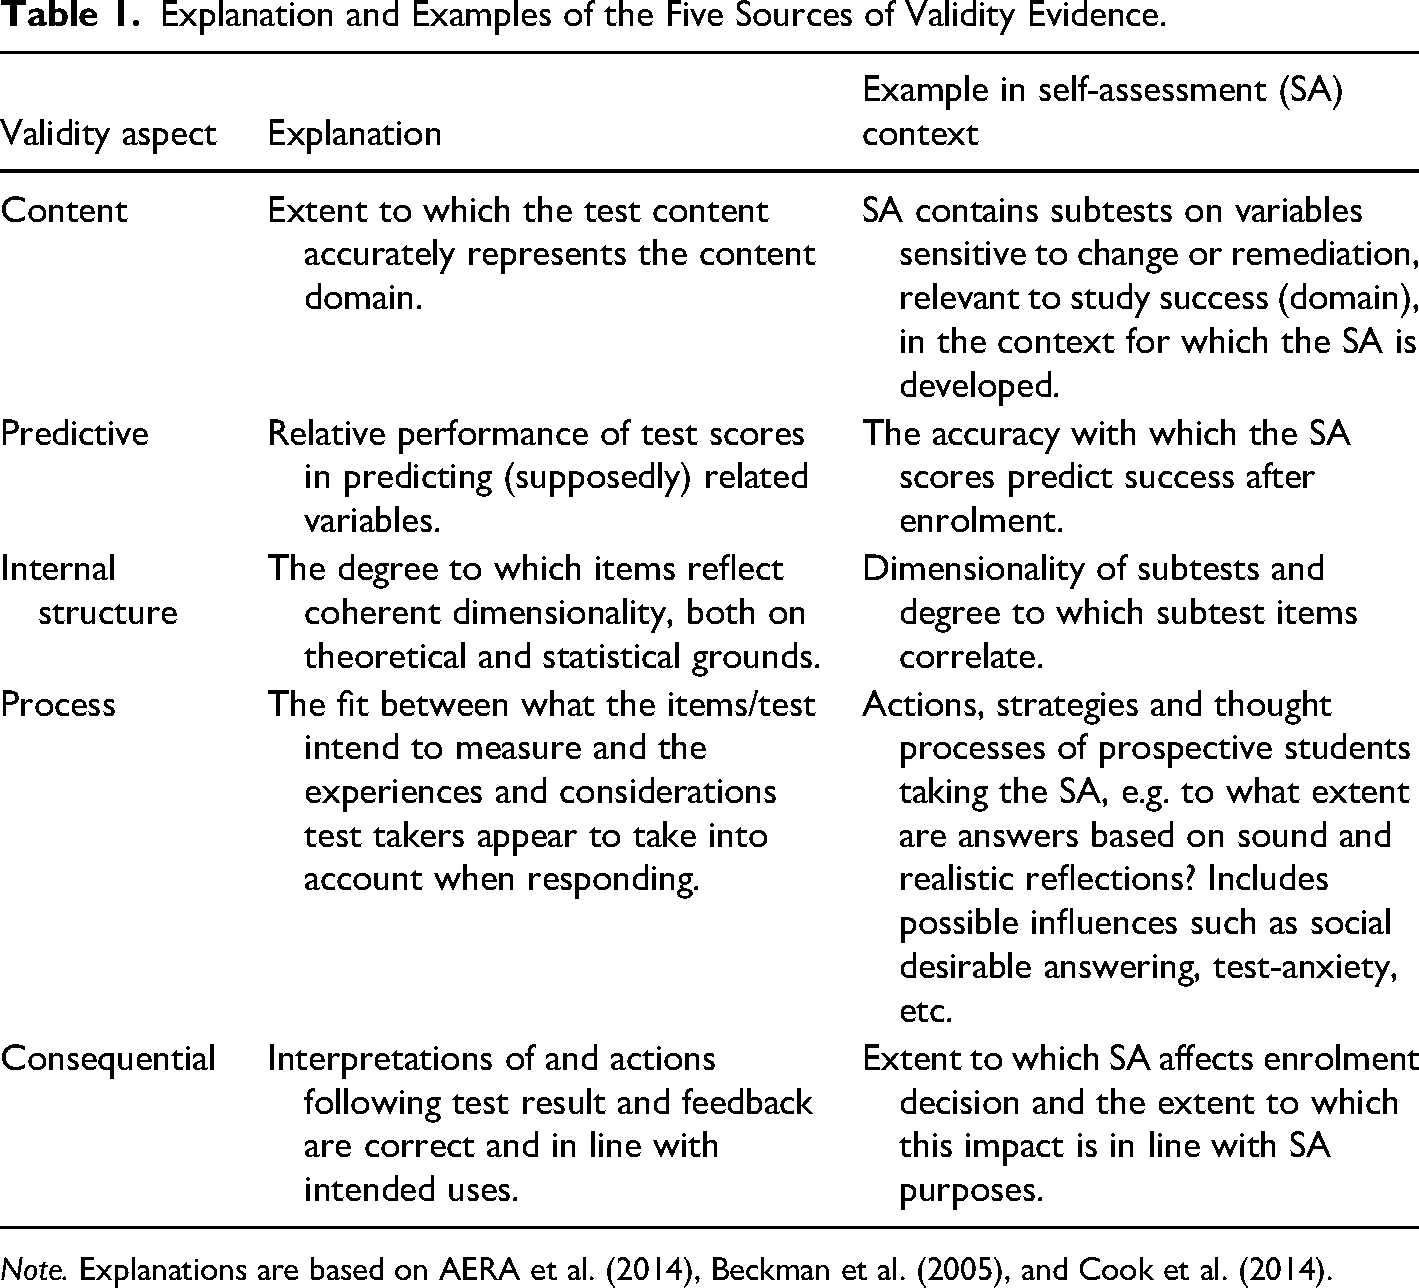
Note. Explanations are based on AERA et al. (2014), Beckman et al. (2005), and Cook et al. (2014).
What is striking when looking at applied validation studies, is that they tend to focus mainly on content, internal structure and predictive power and that there is less attention for the process and consequential aspects of validity (Cook et al., 2014; Kreiter, 2016). Cook et al. especially argue that greater emphasis is required on whether the impact of instruments is correct and justified, i.e. the consequential aspect of validity. In the context of study decision support tools, it appears such empirical evaluation is often implicit or even completely lacking (Niessen & Meijer, 2017).
After having established satisfactory results on other aspects of validity in previous studies, this evaluation study aims to gain insight into evidence of consequential validity of an online SA for informed study decisions in higher online education. In doing so, we not only aim to assure the validity of this particular instrument but also to fill the gap in the literature and to set a standard for validating such orientation instruments. The procedure we show in this paper may inspire other institutions regarding the design process for assessment instruments aimed at informed study decisions (Neumann et al., 2020). In the next section, we dive deeper into the concept of consequential validity, before we present the specific research questions of this study.
Consequential Validity: What it is and how to Evaluate it
The consequential aspect of validity regards the intended and unintended impact of the assessment, both positive and negative, for the individual and/or society. It involves the soundness of decisions made and actions taken, based on assessment results. For example, taking a remediation course to address sub-standard performance (AERA et al., 2014; Beckman et al., 2005; Cook et al., 2014). Validity literature highlights three themes with respect to the consequential aspect of validity: pass/fail cut-off establishment and consequences, individual and societal impact of assessment scores, and fairness (AERA et al., 2014; Beckman et al., 2005; Cook et al., 2014; Downing, 2003; Messick, 1995; Niessen, 2018; Schreurs, 2020; St-Onge et al., 2017). We briefly discuss each of these themes and illustrate them with examples in the context of self-assessment for informed study decisions.
Pass/Fail cut-off Establishment and Consequences
A first important concern when it comes to the consequential aspect of validity is the establishment and impact of score distributions. The score distribution provides context and meaning to all possible scores on a test, e.g. what is the range of ‘sufficient’ scores. In the context of self-assessments, the score distribution determines the cut-off point below which remediation is considered beneficial (Cook et al., 2014). This score distribution can be established in various ways and has to be substantiated and documented (Downing, 2003). Nolden et al. (2019), for instance, created three categories of scores based on the means and standard deviations of successful students and non-successful students. In their score distribution, a ‘risk’ score (or ‘red zone’ as they call it) entails all scores lower than the mean score of non-successful students minus one standard deviation on a particular test, while a ‘safe’ score (‘green zone’) entails all scores higher than one standard deviation above successful students’ mean score. Scores in between these ‘extremes’ constitute the ‘yellow zone’. For our SA, we determined score distributions on classification accuracy. Classification accuracy is a metric indicative of the performance of a variable (read: test score) in relation to a classification model (i.e. classifying successful and non-successful students) and is calculated by dividing the number of correct predictions (‘true positives’ and ‘true negatives’) by the total number of predictions. This approach enables to reckon with the fact that, in this case of open online education, we want to be particularly careful not to unnecessarily discourage students. More specifically, this means that a maximum of 5% of students receiving a ‘high-risk’ score on a certain subtest might in fact appear successful.
Continuous monitoring of the classification model and score distributions is an important in evaluating the consequential aspect of validity (Cook et al., 2014; Downing, 2003). This requires longitudinal evaluation, and is therefore out of scope for the present paper. Moreover, for prospective students who decide not to enrol (either following a favourable or unfavourable score) it is impossible to establish whether the prediction appeared accurate. This means that purely theoretical, evaluation of the classification model is necessarily restricted to a subset of test takers, i.e. those who decide to enrol.
Individual and Societal Impact
A second theme addressed in the literature on the consequential aspect of validity is the individual and societal impact of an assessment instrument, already implied in the previous section when referring to possible discouragement of prospective students, but meriting further elaboration. In the context of the present SA, possible individual consequences involve various variables: interpretation of obtained scores and feedback, intentions and actual steps in following-up on the feedback, study choice certainty (self-confidence), the decision to (not) enrol, and finally, post-enrolment success. Both interpretation of scores and feedback and intention to follow-up on feedback have been addressed in a previous study (Delnoij et al., 2022). The present study's focus is on study choice certainty and enrolment decisions. The extent to which these individual consequences can be considered valid are context-dependent. Increased levels of study choice certainty, for example, can be considered valid for those who score well on the SA. As can feeling affirmed in an already certain choice (Delnoij et al., 2022; Soppe et al., 2019). However, important to note is that scoring well on the SA or increased levels of study choice certainty do not necessarily imply that one ‘has to’ enrol, i.e. enrolment as the single valid consequence following next. The SA is part of a rich palette of orientation activities one can undertake and though the SA scores might imply one is ‘good to go’, one might opt for different opportunities discovered during the orientation. Nevertheless, a valid consequence to a risk score would be to take remedial measures or even to postpone or reconsider the study decision (Broos et al., 2019).
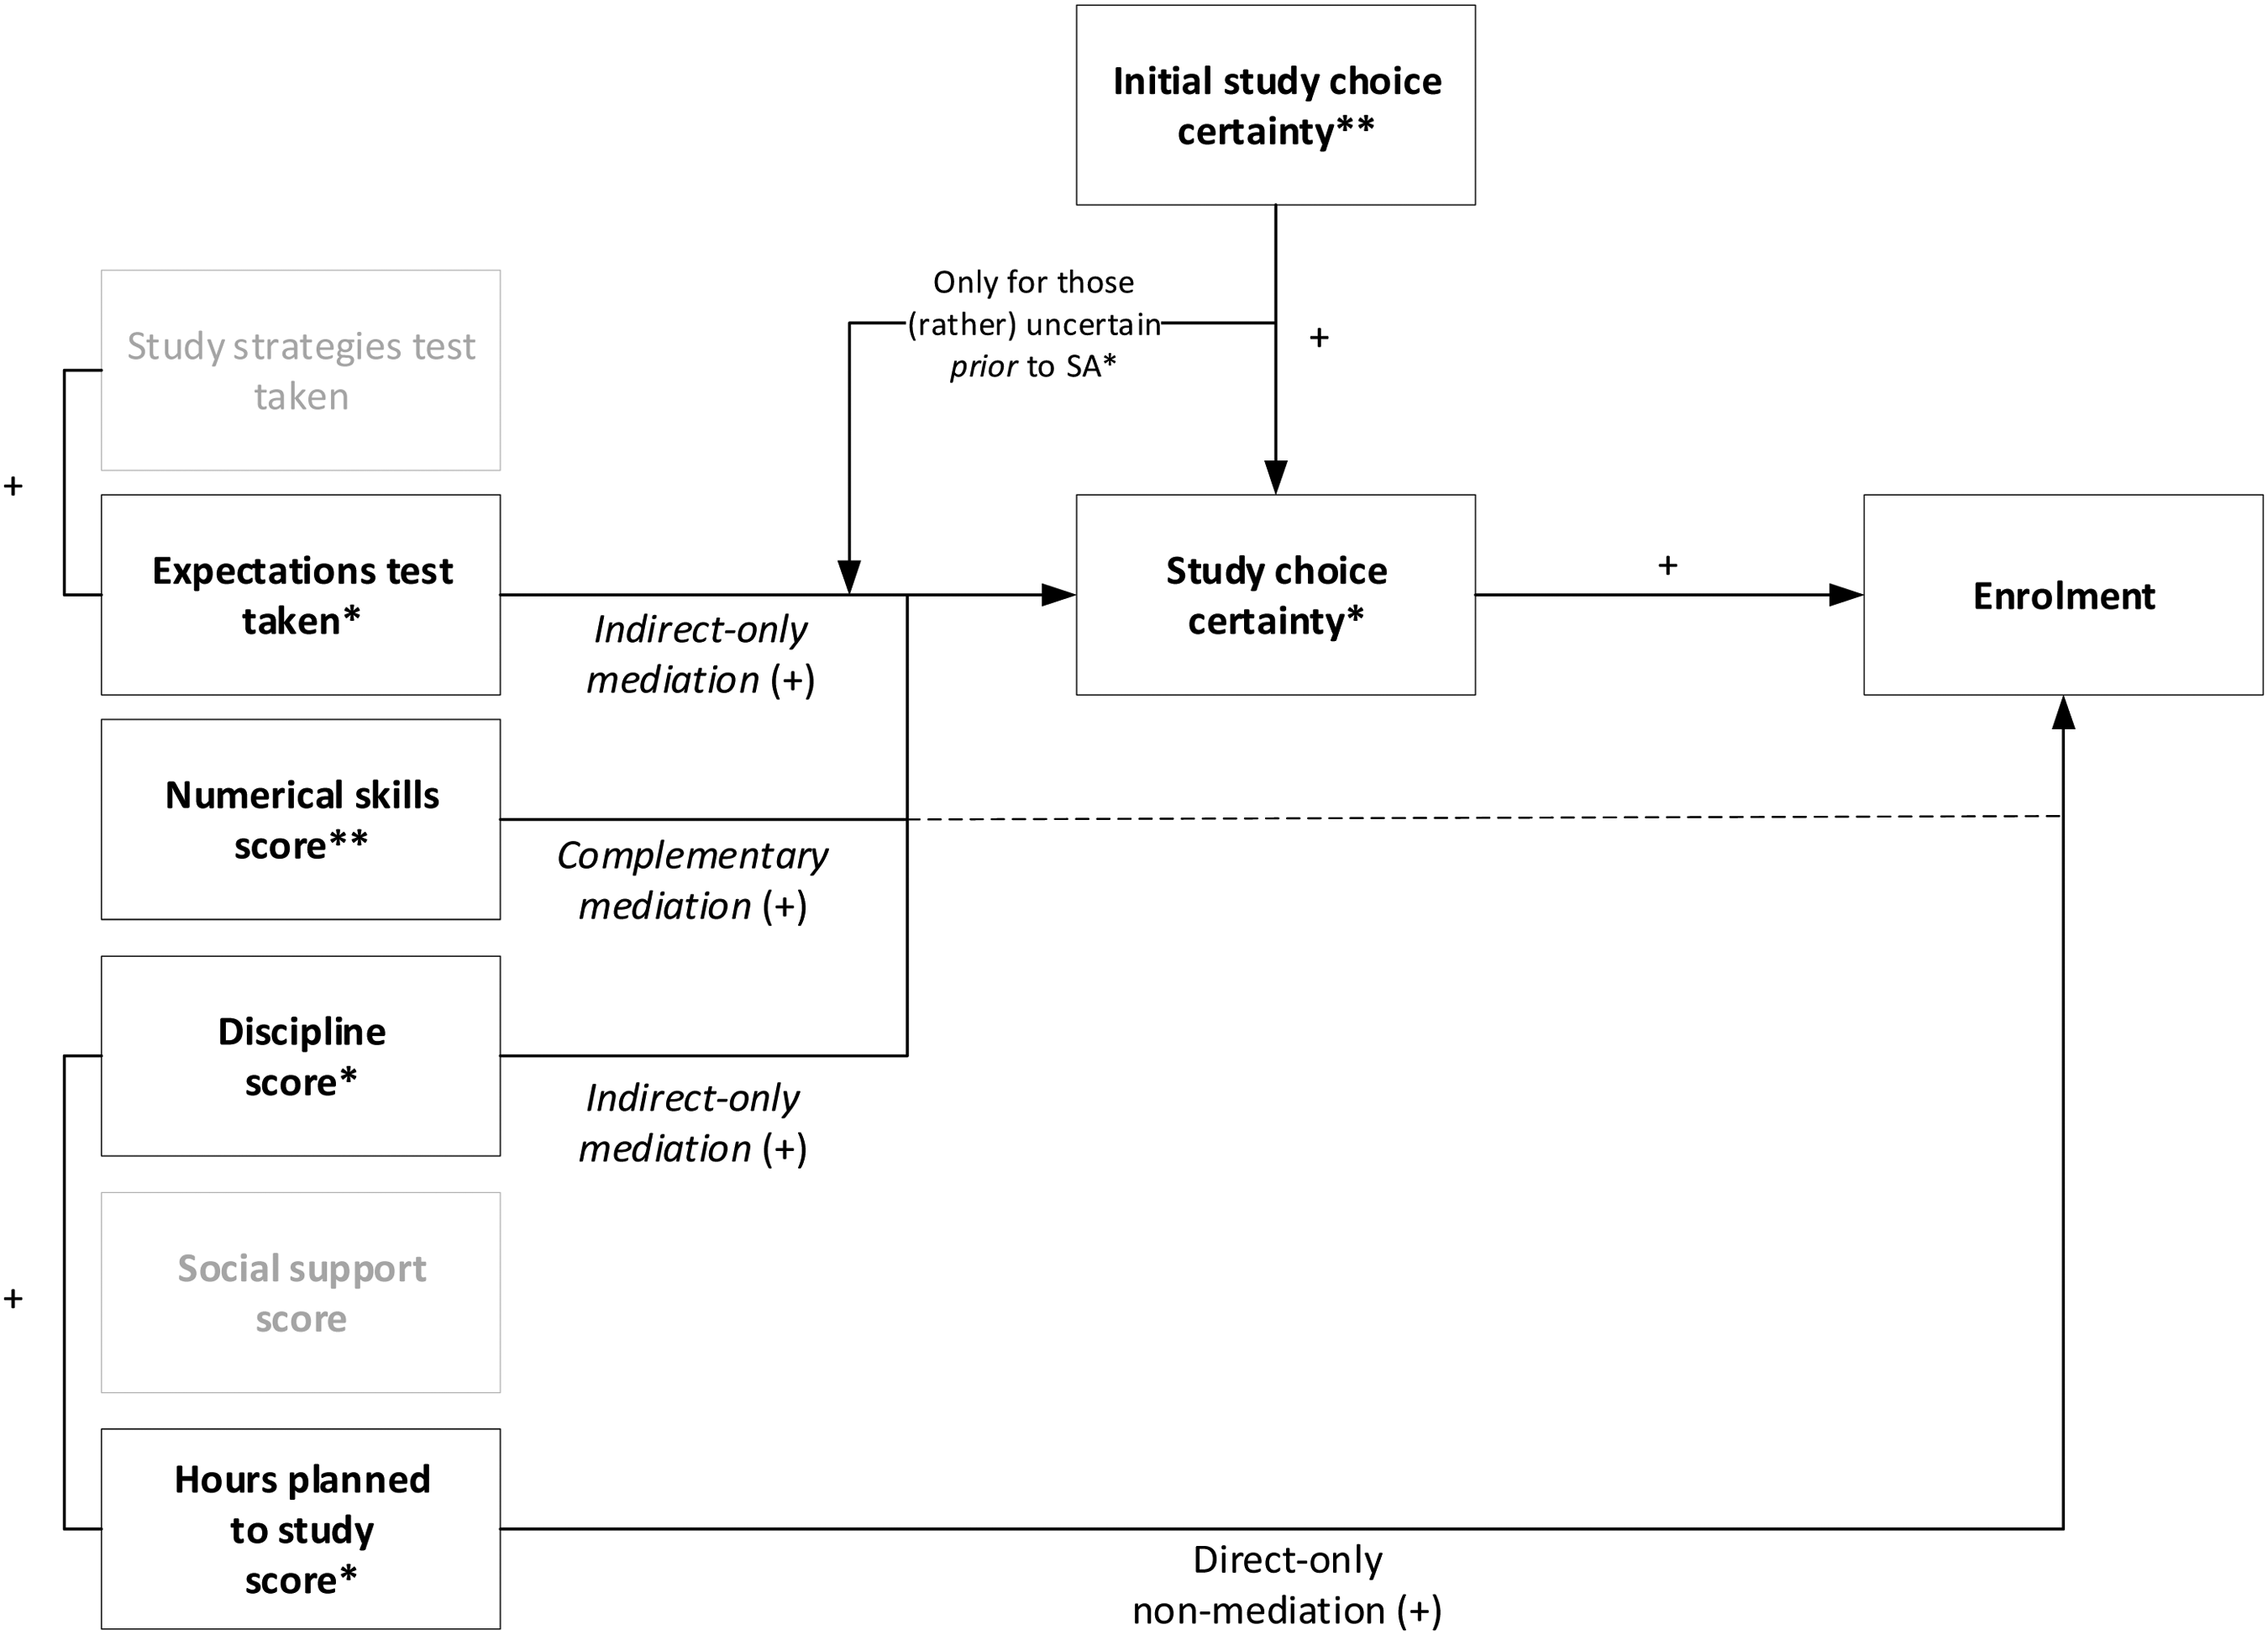
Research shows that orientation activities such as the present SA might affect study choice certainty. Moreover, these studies (Delnoij et al., 2022; Soppe et al., 2019) emphasize that the impact of such orientation activities on study choice certainty depends on the initial study choice certainty, i.e. the level of study choice certainty at the start of these activities. Those already relatively certain about their decision appear less affected by orientation activities and seem to be merely looking for affirmation of the decision they already made. These results are in line with a robust psychological effect known as confirmation bias (Rabin & Schrag, 1999), implying that students tend to focus on signals that confirm their beliefs rather than disconfirming signals (Eil & Rao, 2011). In sum, orientation activities are expected to influence study choice certainty, but we expect that this relation is moderated by initial study choice certainty (see Figure 1). Naturally, initial study choice certainty will also directly link to study choice certainty following orientation activities.
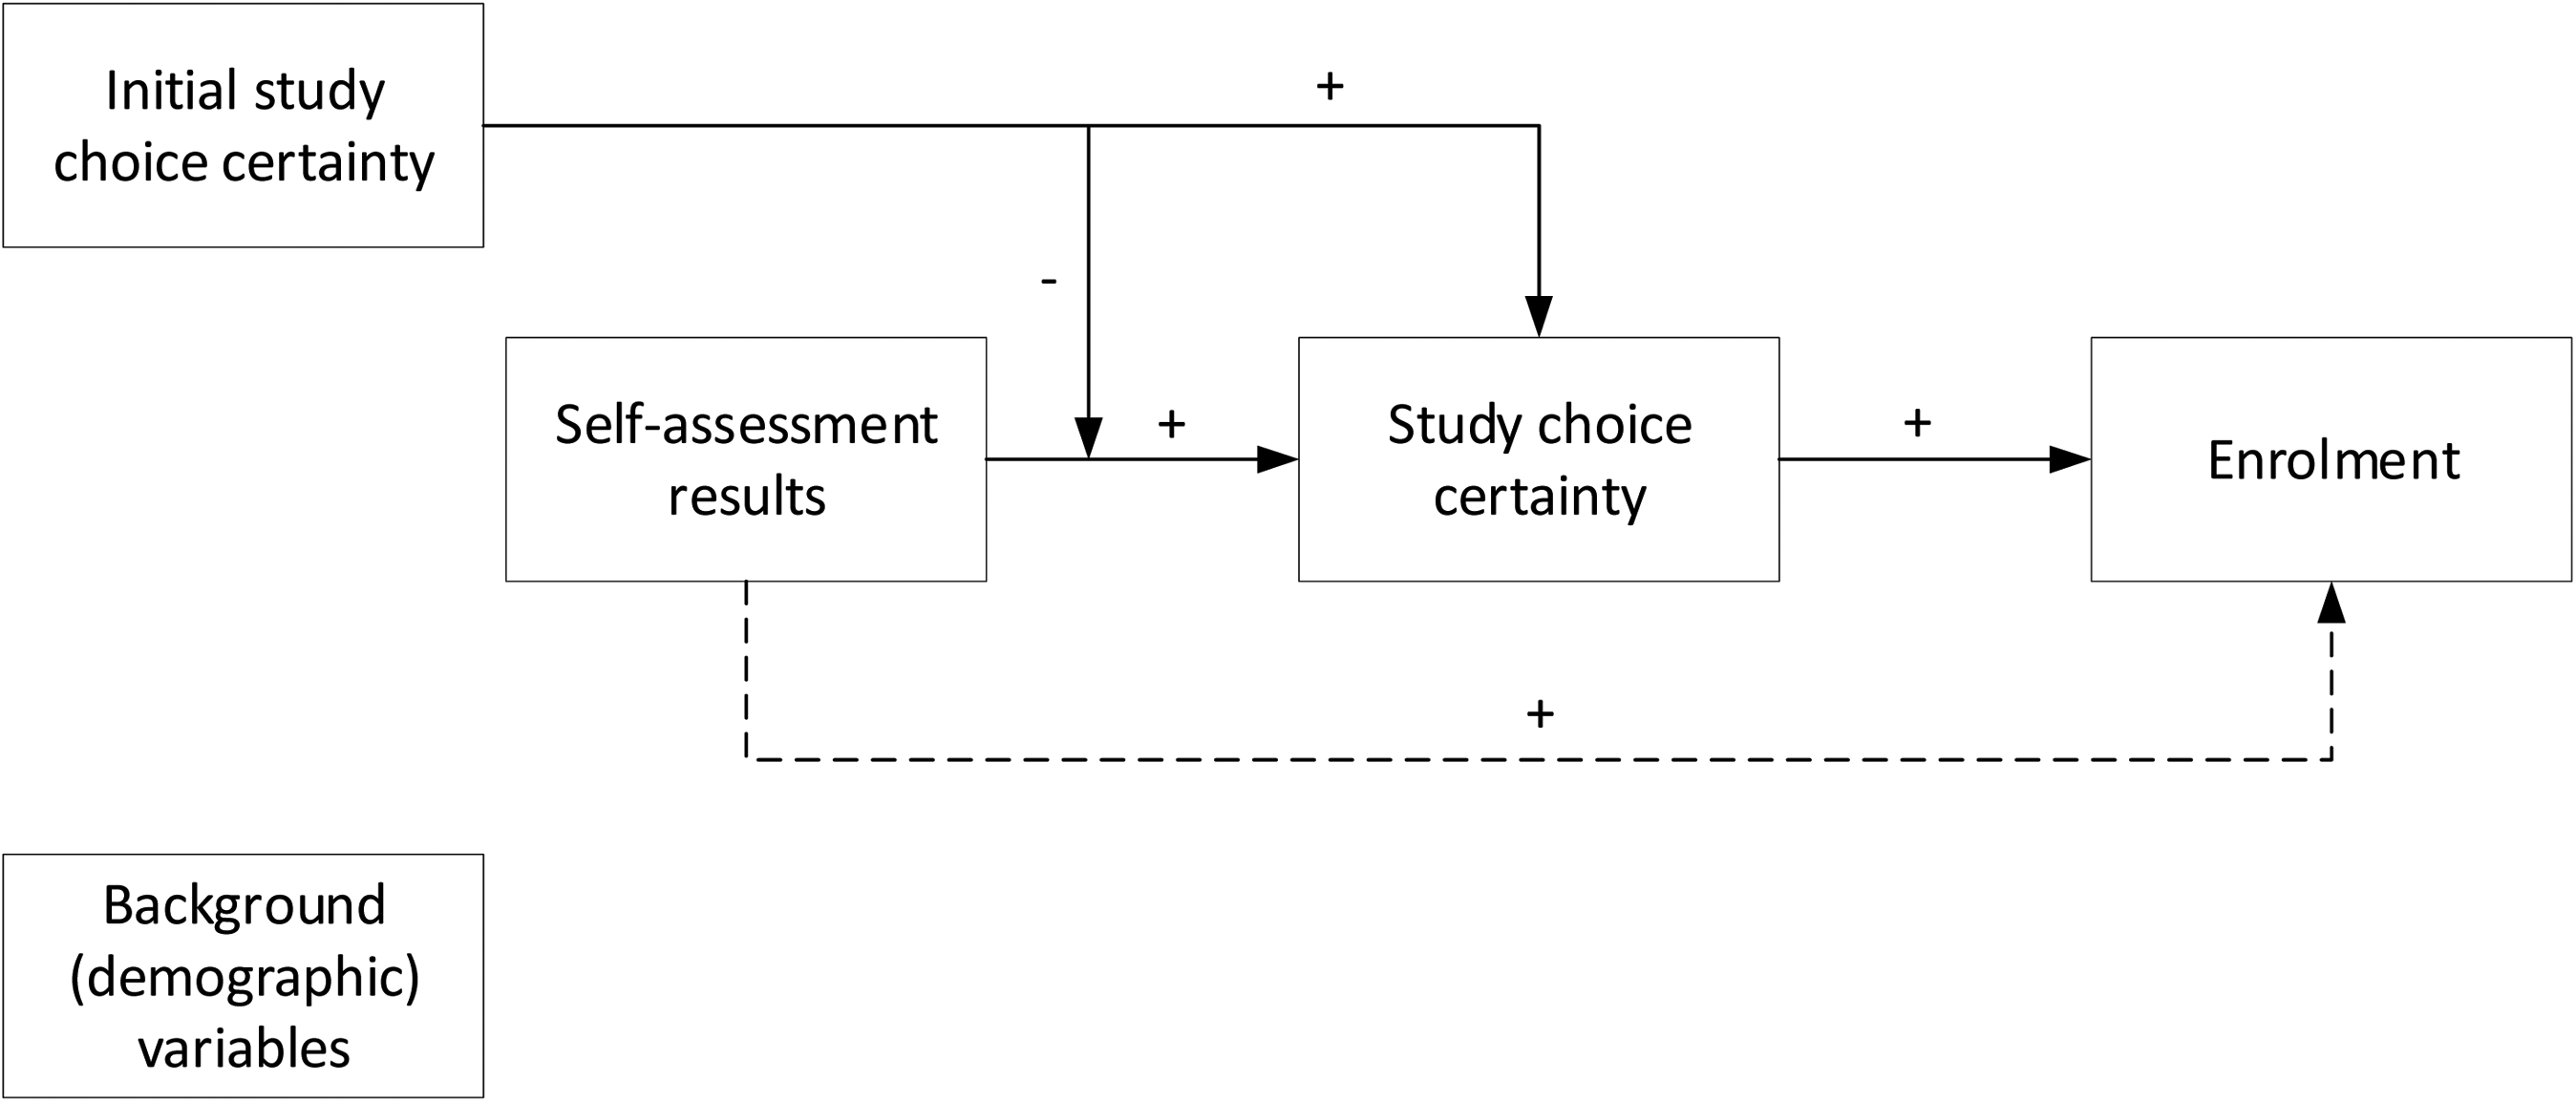
Conceptual model.
Moving to the societal level, the anticipated consequence is a positive impact of the SA on retention, either through improved preparation by prospective students informed by the feedback in the SA, or through reconsideration of enrolment by truly at risk prospective students. Previous research showed that retention rates raised after implementation of a similar instrument in the context of universities of applied sciences (Kappe & Knuiman, 2019). However, it must be noted that in those evaluations, results could not be compared to a control group of who did not make use of the instrument as it was obligatory for all prospective students. Though improving retention is the ultimate goal, evaluating this issue requires additional longitudinal investigation and as mentioned, necessarily limited to a subset of test takers, i.e. those who end up enrolling. Gaining insight into the impact of the SA on the enrolment decision and possible factors playing a role in this is essential in itself as well as an indispensable part of understanding the full picture.
Fairness
A final theme highlighted in the literature regarding concerns the fairness of an assessment instrument (AERA et al., 2014; Nisbet, 2019; Xi, 2010). As Kane (2010) described, validity and fairness are closely related concepts as both focus on the interpretations and uses of test scores and whether that is appropriate for a specific target group under a range of circumstances. The relation between both concepts is perhaps best illustrated by Xi’s (2010) definition of fairness as “comparable validity for identifiable and relevant groups across all stages of assessment, from assessment conceptualization to the use of assessment results” (p. 154).
However, so far, there is only limited research on fairness in regard to the consequential validity aspect in the assessment literature (Kreiter, 2016; Xi, 2010). With respect to self-assessments for informed study decisions in higher education, fairness plays an important role. In the context of open (i.e. non-selective) education, we want to be particularly careful not to unnecessarily discourage prospective students by the feedback provided in the SA. We aim to provide prospective students a realistic perspective on their preparedness for enrolment in higher online education and how this might be strengthened in case the test scores suggest such actions. Yet, the feedback provided should not have a different impact on study choice certainty of test takers with similar scores, but different backgrounds. In other words, the impact of a risk score on the discipline test should not be different for someone with a lower level of prior education than for one with a higher level of prior education. As visualized in Figure 1, background variables should not moderate the relationships between SA, study choice certainty and enrolment.
In the present study we include fairness not only in terms of the impact on study choice certainty but also in terms of the consistency of enrolment decisions for different groups, based on demographic variables such as gender or prior level of education.
Research Questions and Hypotheses
Overall, this study aims to evaluate consequential validity evidence of an online SA for informed study decisions in higher online education. More specifically, the study addresses the impact of the SA on study choice certainty, the decision to enrol and fairness. To that end, the following main research question has been formulated: To what extent do SA results affect study choice certainty, as well as a decision to enrol, and to what extent does this appear to be moderated by specific background characteristics? In order to answer the main research question and based on the theoretical framework, the following hypotheses were formulated:
Prospective students who obtain favourable self-assessment results are more certain about enrolment and more likely to enrol. The impact of self-assessment results on study choice certainty depends on initial study choice certainty: those students who are initially (rather) certain about enrolling are more likely to remain unperturbed by less favourable self-assessment results, than those initially (rather) uncertain about enrolling. The impact of self-assessment results on enrolment is mediated by study choice certainty. In regard to fairness, the relationships in hypotheses 1 and 2 are independent of background variables (i.e. gender, age, and prior level of education).
Method
Design
In an explanatory correlational design (Creswell, 2014), data was gathered through the self-assessment and follow-up survey. This research took place in the context of a distance university. The institution's open access policy means that for bachelor-level courses and programs the only entry requirement is a minimum age of 18 years.
Participants
Sampling took place between December 2020 and May 2021 via the institution's website, offering the online SA. Table 2 provides an overview of the number of participants. The average age of SA users (N = 662) is about 35 years (M = 34.7, SD = 12.0) and 57.9% are women. Most participants (55.2%) already hold a degree in higher education (i.e. university of applied sciences or scientific university).
Participants.
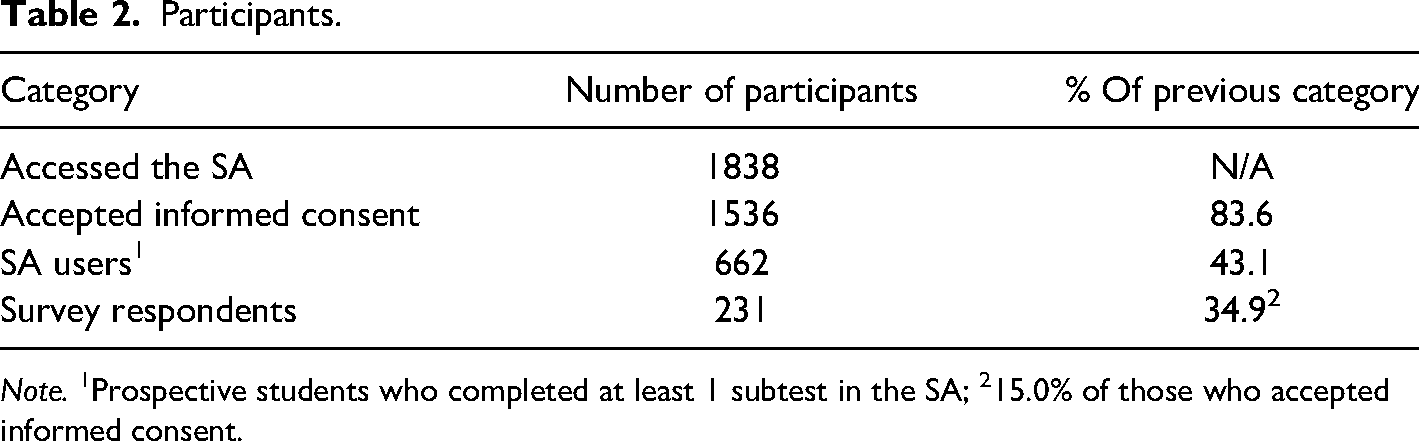
Note. 1Prospective students who completed at least 1 subtest in the SA; 215.0% of those who accepted informed consent.
Materials and Measurement
Self-Assessment
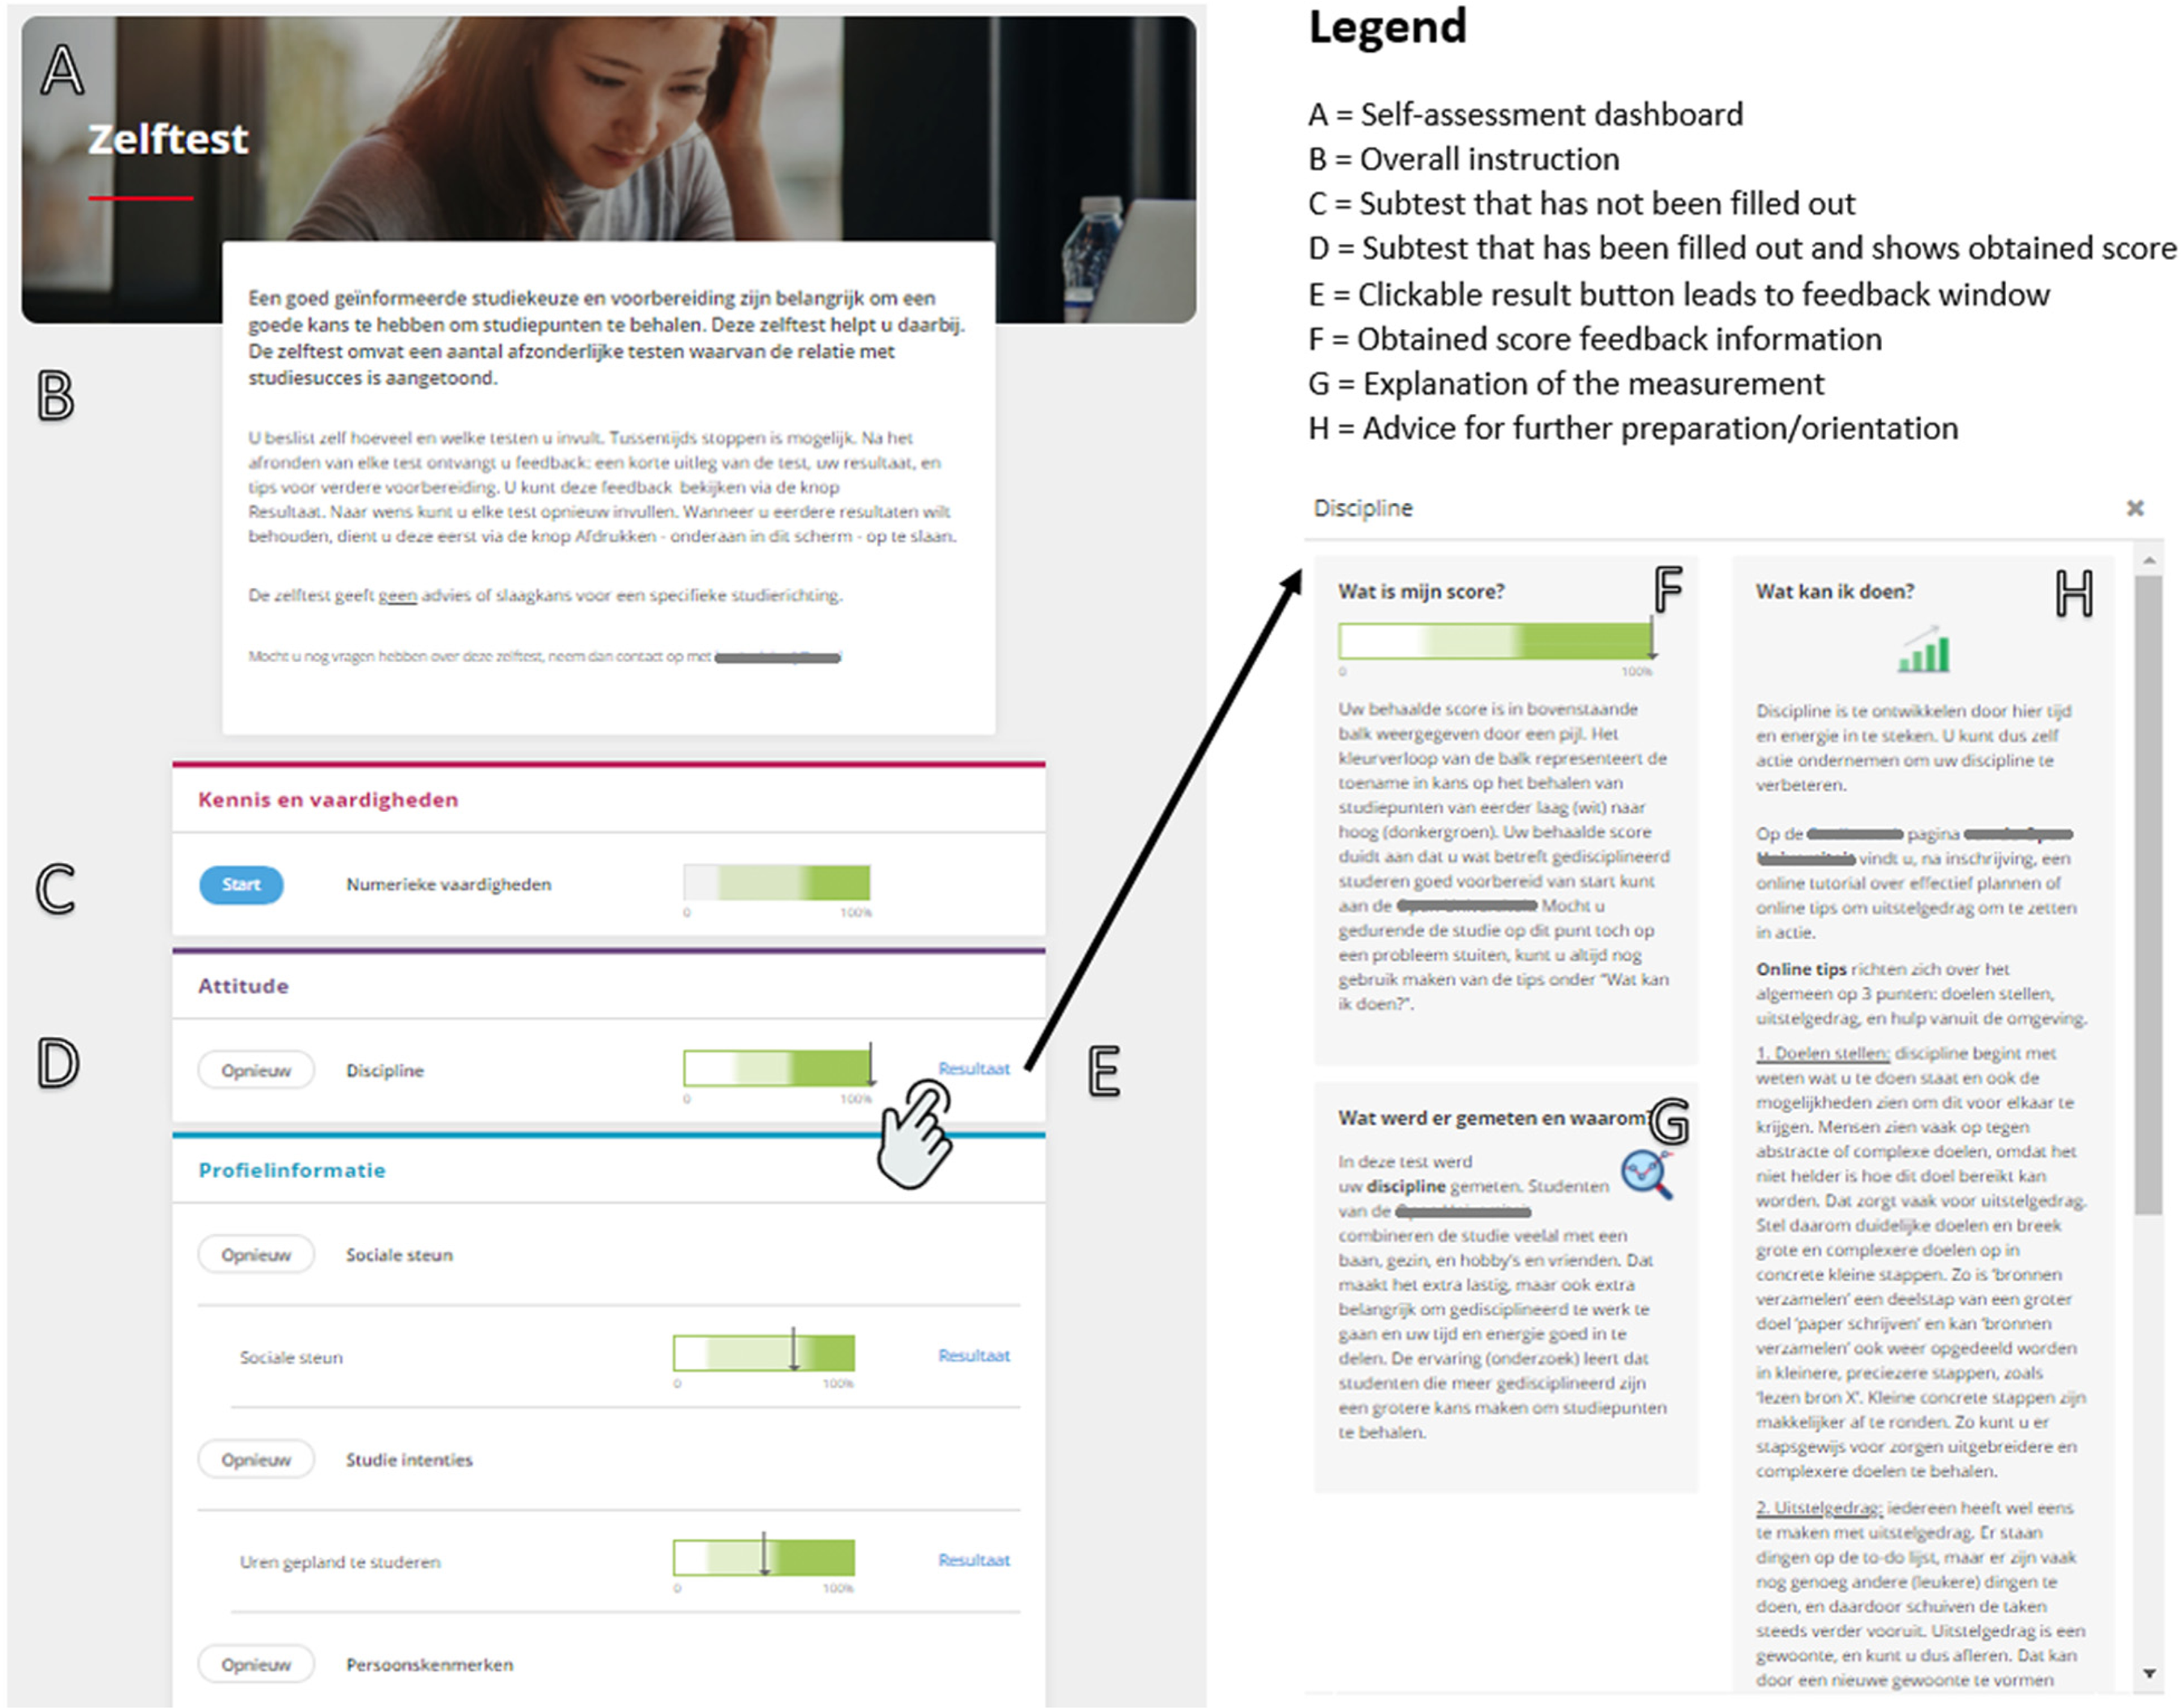
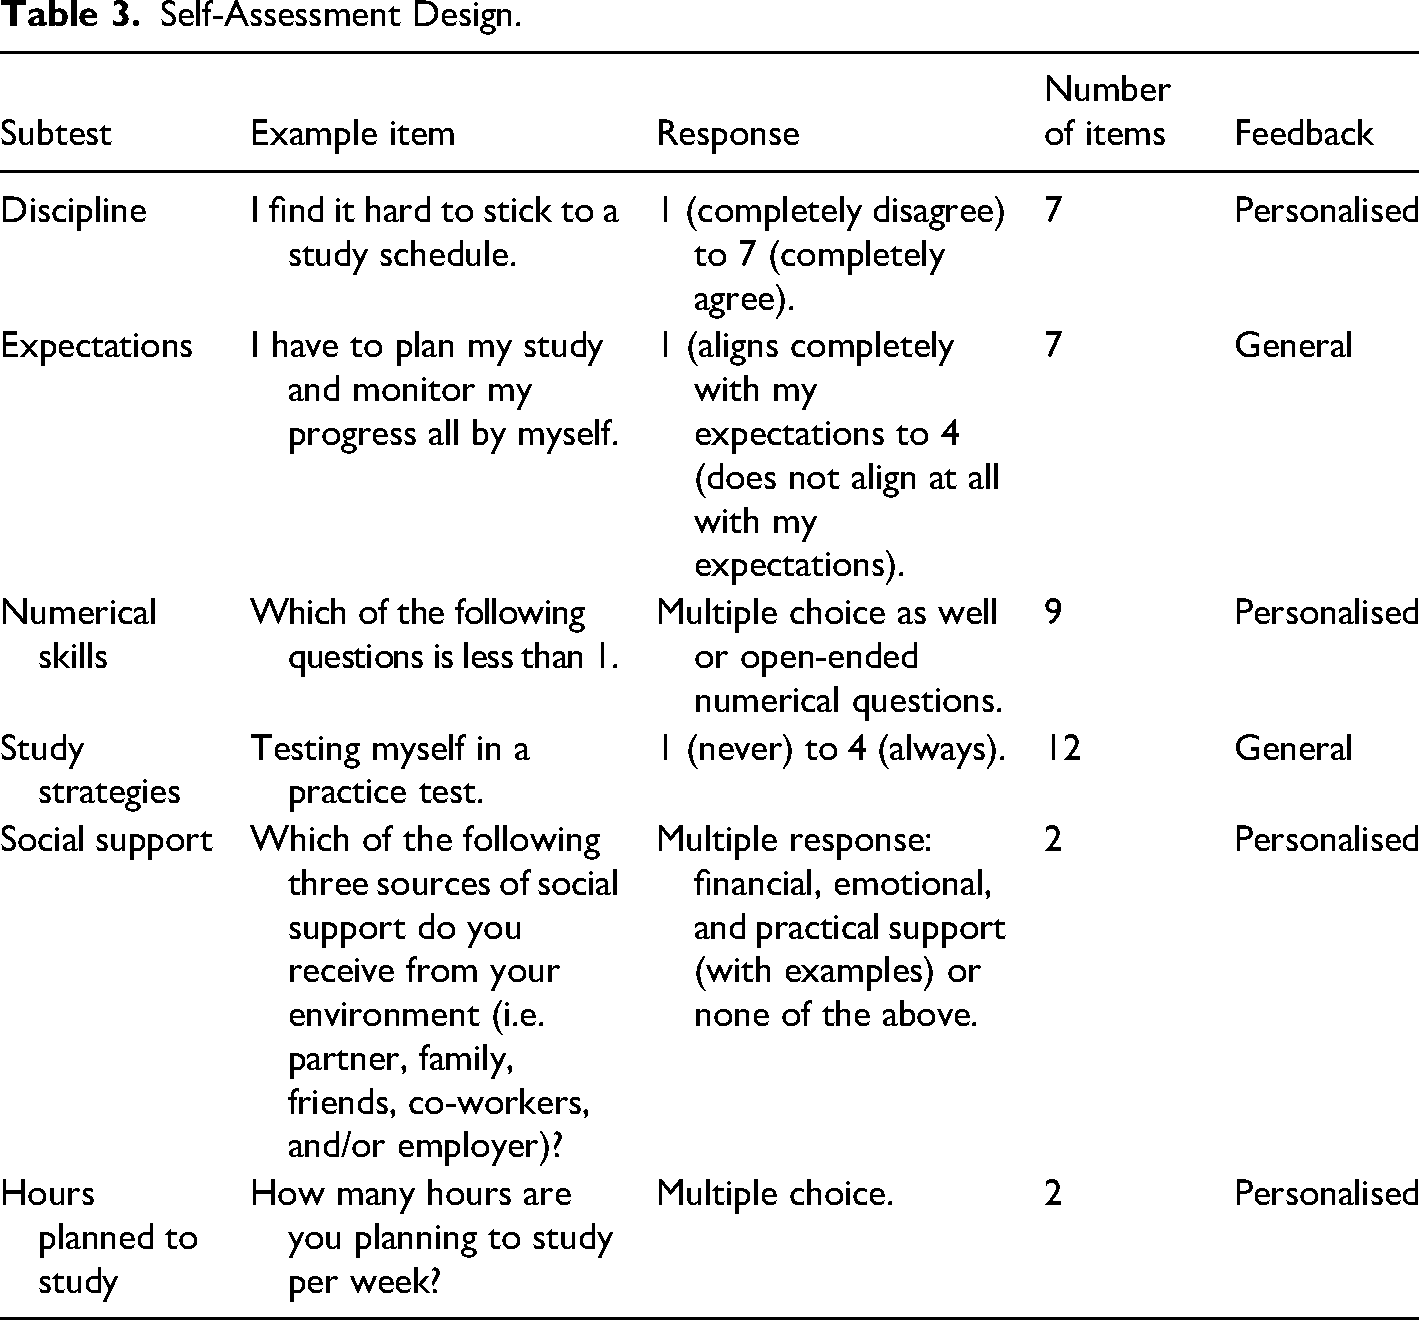
The SA (Figure 2, Table 3) consists of six tests of which four result in a personalised score and related feedback upon completion. Two tests are still prototypical, meaning that the feedback provided for these tests is not yet personalised as the predictive value and score cut-offs are still under investigation. For all subtests, Table 3 provides an example item. The feedback (based on Broos et al., 2018, 2019; Delnoij et al., 2021, 2022; Fonteyne & Duyck, 2015; Jivet et al., 2020; Nolden et al., 2019) consists of three components: information on the obtained score (Figure 2F), information on the test (what was measured and why) (Figure 2G), and advice for further preparation (Figure 2H). Information on the obtained score entails a visualization in which the obtained score (indicated by an arrow) is projected on a bar representing the possible range of scores (scale of 0–100%) as illustrated in Figure 2. The colour in the bar fades from white (left, ‘high-risk’ area) via light green (‘medium-risk’ area) to dark green (right, ‘low-risk’ area) indicating increased odds of course completion following enrolment. Additional feedback in line with the obtained score is presented in a pop-up and can be accessed through the overall SA dashboard.
Self-assessment design.
Self-Assessment Design.
Separate variables are defined to indicate overall SA results and subtest results, which are operationalized as follows:
Overall SA result: a dichotomous variable indicating whether prospective students obtained any ‘high-risk’ scores or not. Personalised subtest results: the scores on the four subtests resulting in a personalised score (‘high’, ‘medium’, or ‘low-risk’ score). Expectations/study strategy subtest taken: dichotomous variable indicating whether or not these tests were taken. These latter tests did not result in a personalised score (yet), but their general feedback might still affect study choice certainty.
Survey
Gender and prior level of education measured by multiple-choice items and age via an open-ended question. Initial study choice certainty (SCC) was measured retrospectively by asking participants to rate their certainty of enrolling at the OUNL prior to taking the SA retrospectively on a 4-point scale (1 = completely uncertain, 2 = rather uncertain, 3 = rather certain, 4 = completely certain). Next, they were asked to indicate their current certainty of enrolling (after taking the SA) on the same scale.
Enrolment
Enrolment data was obtained via the student administration system, with a score of 1 being assigned to those who enrolled in a course at the institution within 3 months after taking the SA and a score of 0 to all others. We opted for a limited interval for obtaining the outcome measure, so that a possible relationship between enrolment and the SA is still plausible. The choice for a 3 months interval specifically is supported by the fact that a majority (62%) of newly enrolled students enrolled within 3 months after their first orientation experience (based on data from a previous cohort).
Research Procedure
Ethical approval for the ongoing research was obtained from the research ethics committee of the Open Universiteit (approval code U202008923). Upon accessing the SA page, prospective students were invited to take part in this study by means of a pop-up including an online information letter and consent form. Consent was entirely voluntarily: those who declined could still take the SA, without their data being used for research purposes. In the general introduction on the SA dashboard (see Figure 2B), participants were invited to take as many tests of the SA as they liked and were asked to fill out the survey afterwards. To obtain a score and aligned feedback, all items in a subtest must be filled out. The survey could be filled out leaving any of the questions unanswered.
Analysis
All analysis were conducted in Jamovi 1.1.8.0. (R Core Team, 2018; The Jamovi Project, 2019). Descriptives are analysed regarding demographics, subtests taken, and obtained subtest scores, in order to provide context for the interpretation of further results. We also tested assumptions for parametrical testing. If not stated otherwise in the results section, those assumptions were met and parametrical analyses were conducted. All hypotheses were tested by means of regression analyses. For the first hypothesis, we analysed the relationship between overall SA results (obtaining ‘high-risk’ scores or not) and subtest scores with study choice certainty in linear regression models, while controlling for initial study choice certainty 1 . Since all participants completing the study strategies test, also appeared to have completed the expectations test we could not include both of them separately, as this would result in multi-collinearity. Thus, we included the test completed most often, the expectations test. In analyses on subtest level, we added all remaining predictors (and covariates1) simultaneously and excluded the non-significant subtests in a stepwise backwards method, beginning with the least significant predictor. The relationships with enrolment as outcome measure were analysed in binary regression models. To test the second hypothesis, we checked for interaction effects between initial study choice certainty and SA results in predicting study choice certainty. Significant interactions are reported in the results section. To test the mediation hypothesis (3), we added study choice certainty to the resulting model from testing hypothesis 1 and after having established a relationship between study choice certainty and enrolment. To test the fourth hypothesis, on fairness, we checked for interactions with background variables. For example, impact of subtest scores on study choice certainty should be equal for different genders. This means that no significant interaction effect should be found between gender and subtest scores in predicting study choice certainty. Interaction effects with background variables were analysed only for subgroups with n > 5. Significant interactions are reported in the results section.
Results
Subtests and Obtained Scores
Table 6 presents the relative popularity of subtests and obtained scores split for gender and levels of prior education. Table 4 provides an indication of the relative ‘popularity’ of the subtests when four and six subtests were available (see materials and measurement section), as well as the overall subtest scores. Detailed information, such as correlations between subtests scores is available on request. Looking at specific subtests, ‘high-risk’ scores are obtained most often on the social support test (8.8%), while the discipline subtest is most likely to result in a ‘low-risk’ score (70.2%). Overall, 13.4% (n = 89) of the SA users obtained at least one ‘high-risk’ score (not included in Table 4). The fact that this group is relatively small is not unexpected; a rather restrictive limit has been set in the classification model for assigning ‘high-risk’ scores, in line with the open access of the institution.
Number of Subtests Taken and Obtained Scores.
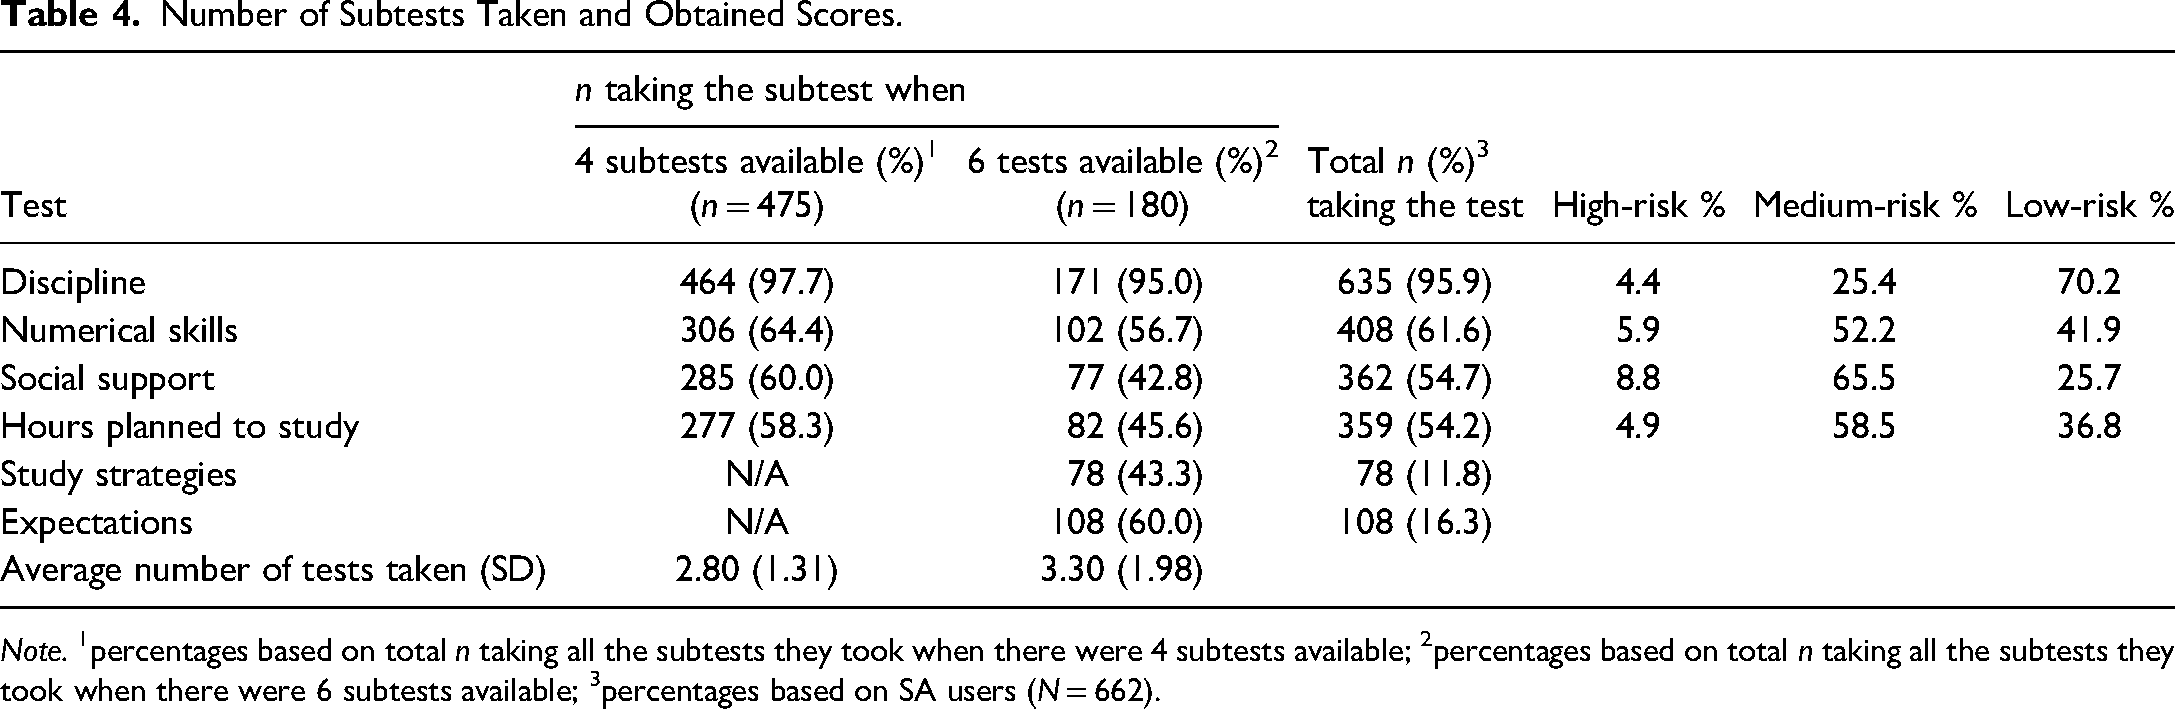
Note. 1percentages based on total n taking all the subtests they took when there were 4 subtests available; 2percentages based on total n taking all the subtests they took when there were 6 subtests available; 3percentages based on SA users (N = 662).
‘High-Risk’ Scores and Study Choice Certainty
Table 5 first provides insight into the change in SCC of prospective students obtaining at least one ‘high-risk’ score compared to those who did not such scores. Both a decrease 2 in SCC for those who obtained a ‘high-risk’ score and an increase 3 in SCC for those obtaining no ‘high-risk’ score constitutes evidence of consequential validity, whereas the opposite would indicate a threat to consequential validity. A grey filling in cells is applied to ‘tentatively’ indicate where results provide a threat to the consequential aspect of validity.
Impact of Obtaining High-Risk Scores (no/yes) on Study Choice Certainty.
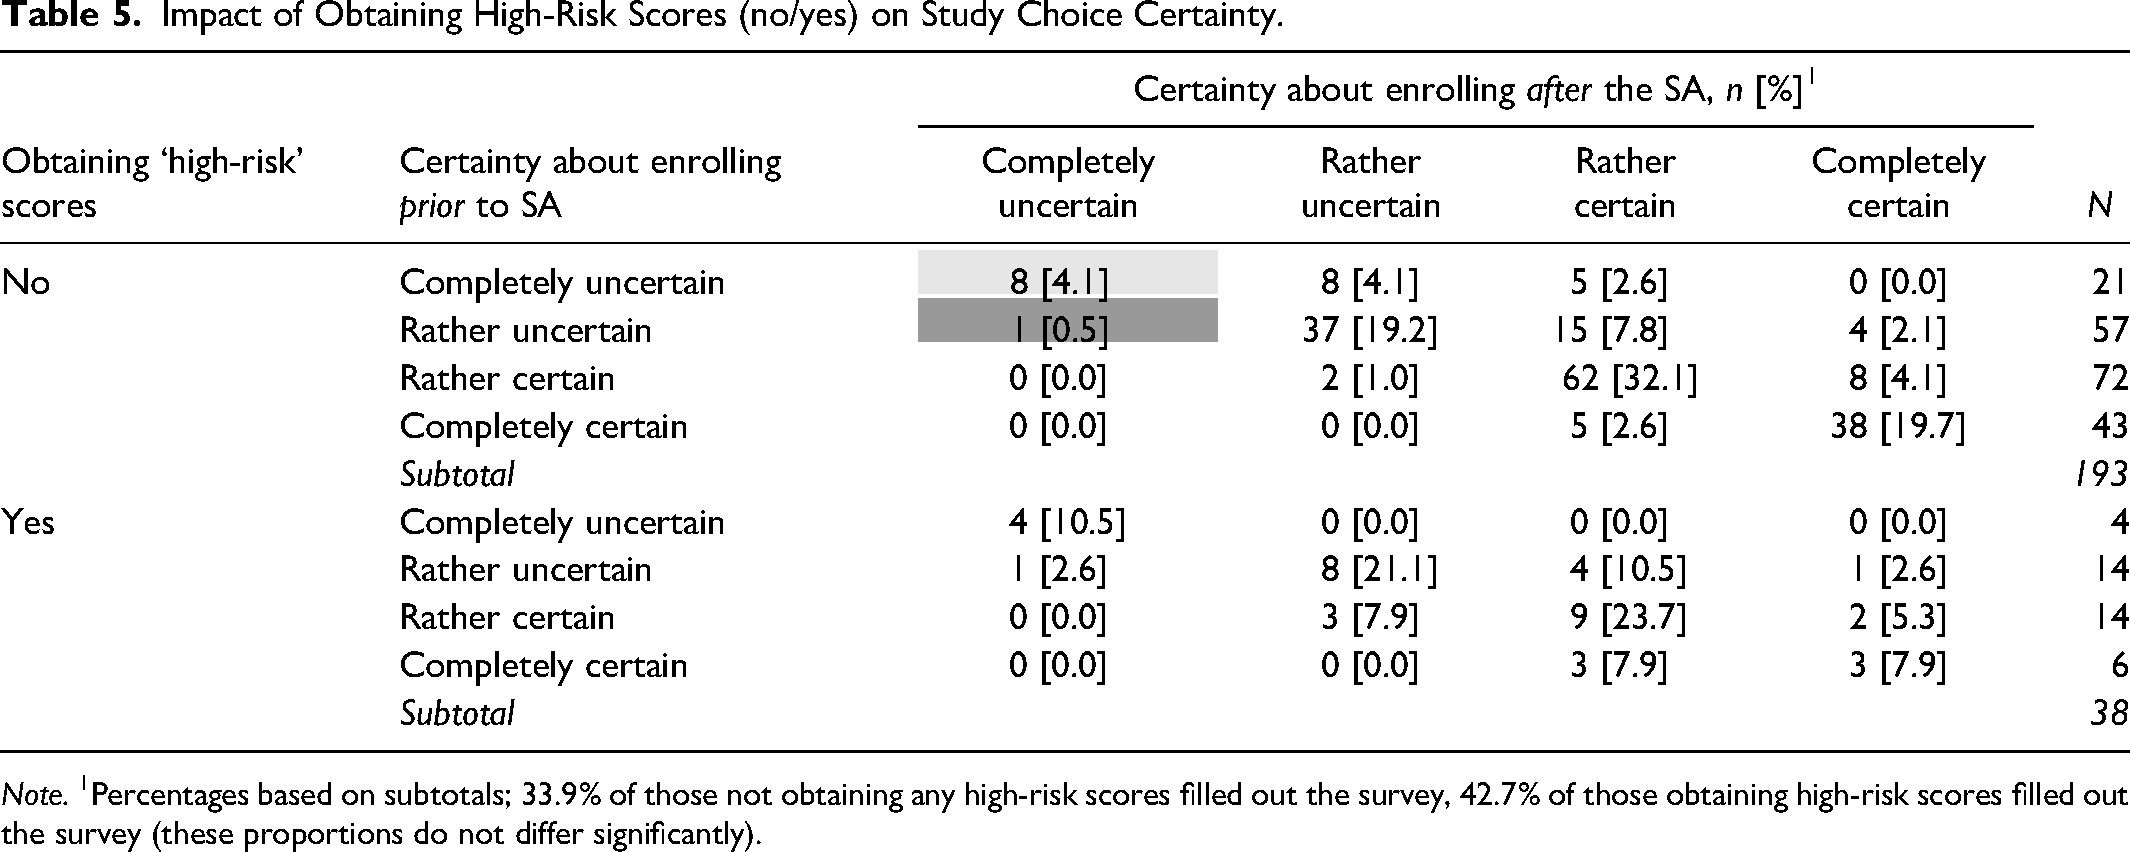
Note. 1Percentages based on subtotals; 33.9% of those not obtaining any high-risk scores filled out the survey, 42.7% of those obtaining high-risk scores filled out the survey (these proportions do not differ significantly).
In general, for those not obtaining any ‘high-risk’ scores, SCC largely remains the same or increases, in line with expectations. However, there also seems to be a small number (n = 8, darker grey filling in Table 5) who appear to become less certain about enrolling, despite not obtaining any ‘high-risk’ scores. An explanation might be that these prospective students obtain relatively more ‘medium-risk’ scores. This would indicate that, in general, they do not score very well on the SA, though without obtaining ‘high-risk’ scores. This appears to be a fitting explanation, as those who are ‘unexpectedly discouraged’ appear to (proportionally) obtain significantly more ‘medium-risk’ scores (Mdn = 0.63) compared to those also not obtaining ‘high-risk’ scores and not discouraged (Mdn = 0.26)(U = 75.0, p < .001, Cohen's d = 1.74).
About half of those obtaining at least one ‘high-risk’ score, appear to reflect adequately on their initial certainty as 18.4% becomes less certain of enrolling and 31.6% stays equally uncertain. We must note, however, that also some become more certain, despite obtaining ‘high-risk’ scores, 18.4% (n = 7, darker grey filling in Table 5).
Subgroup Division of Subtests Taken and % High-Risk Scores.
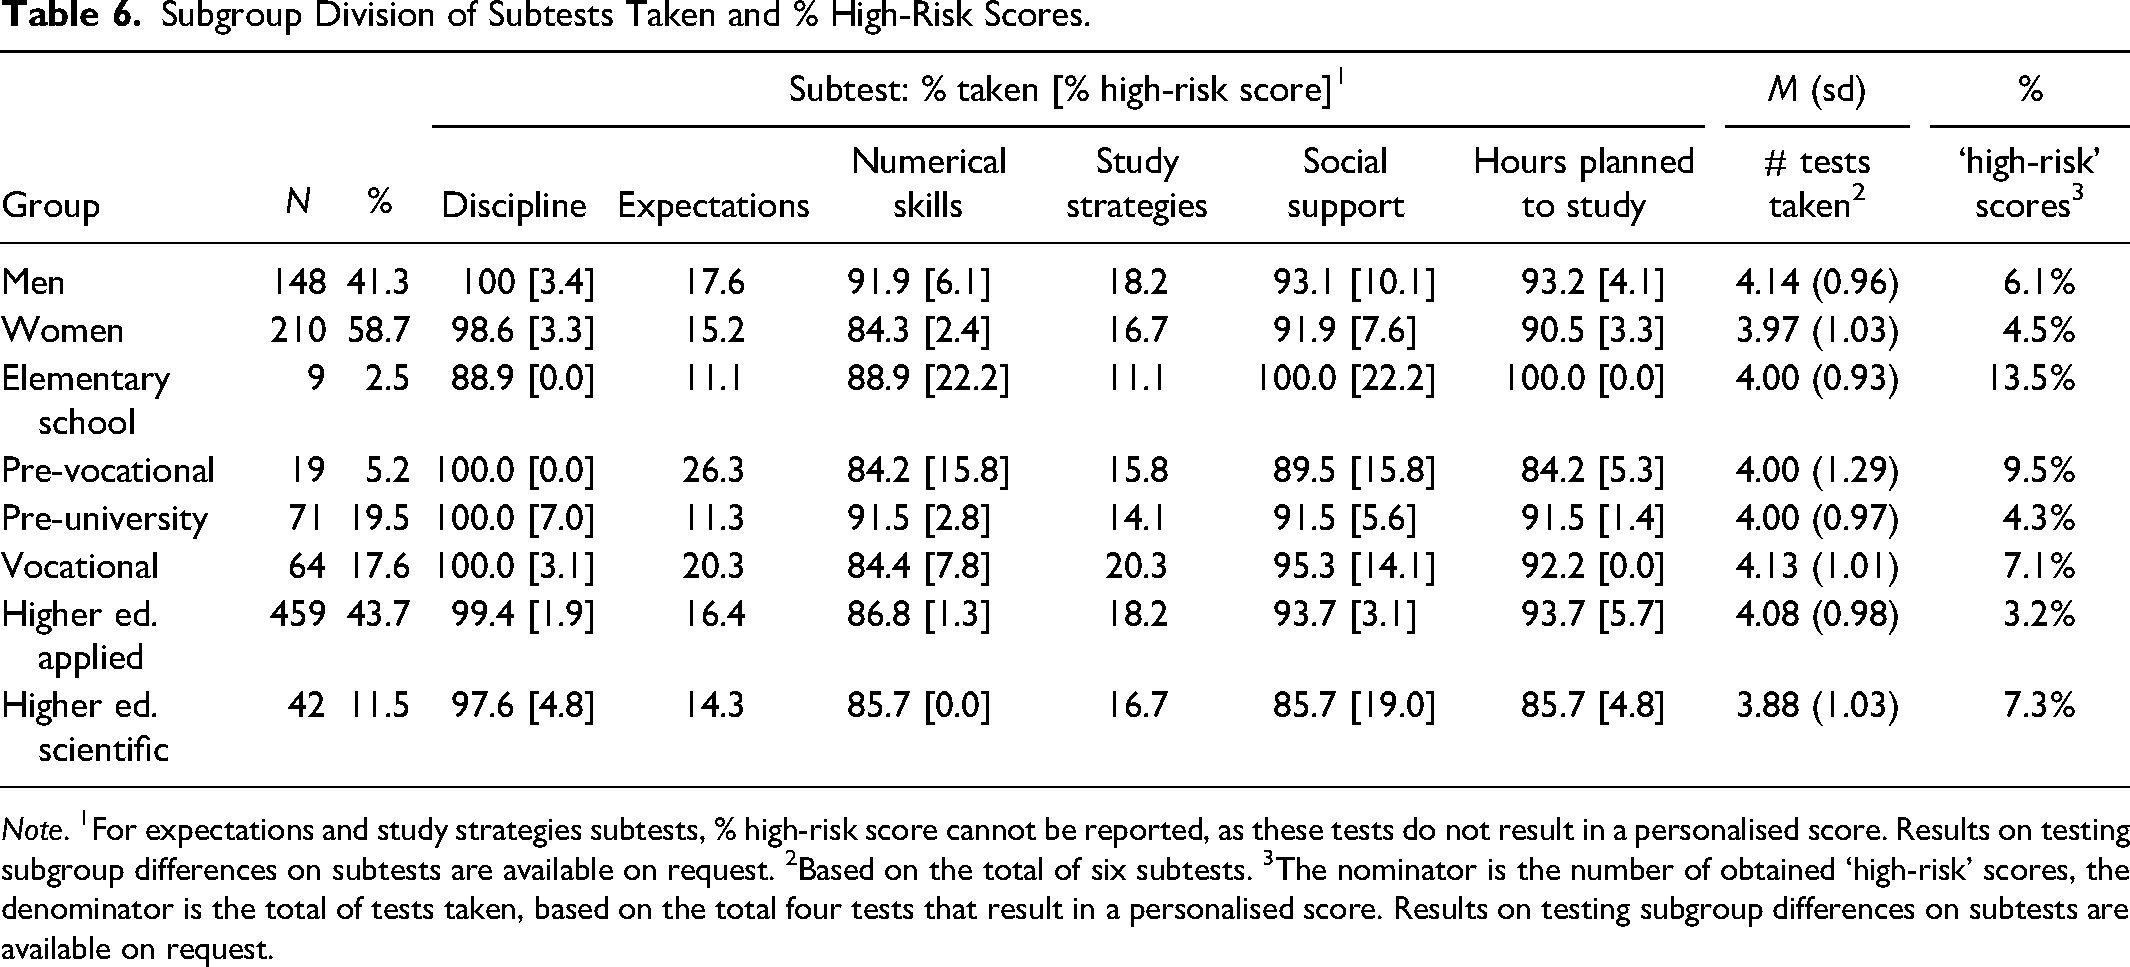
Note. 1For expectations and study strategies subtests, % high-risk score cannot be reported, as these tests do not result in a personalised score. Results on testing subgroup differences on subtests are available on request. 2Based on the total of six subtests. 3The nominator is the number of obtained ‘high-risk’ scores, the denominator is the total of tests taken, based on the total four tests that result in a personalised score. Results on testing subgroup differences on subtests are available on request.
Also, a significant positive and strong association was found between SCC prior and after the SA (χ2 (9) = 286, p < .001, γ = 0.884). In other words, this confirms the importance of controlling for initial SCC, while analysing post-assessment SCC. For more details on SCC related to background variables, we refer to Table 7.
Subgroup Division of Study Choice Certainty and Enrolment.
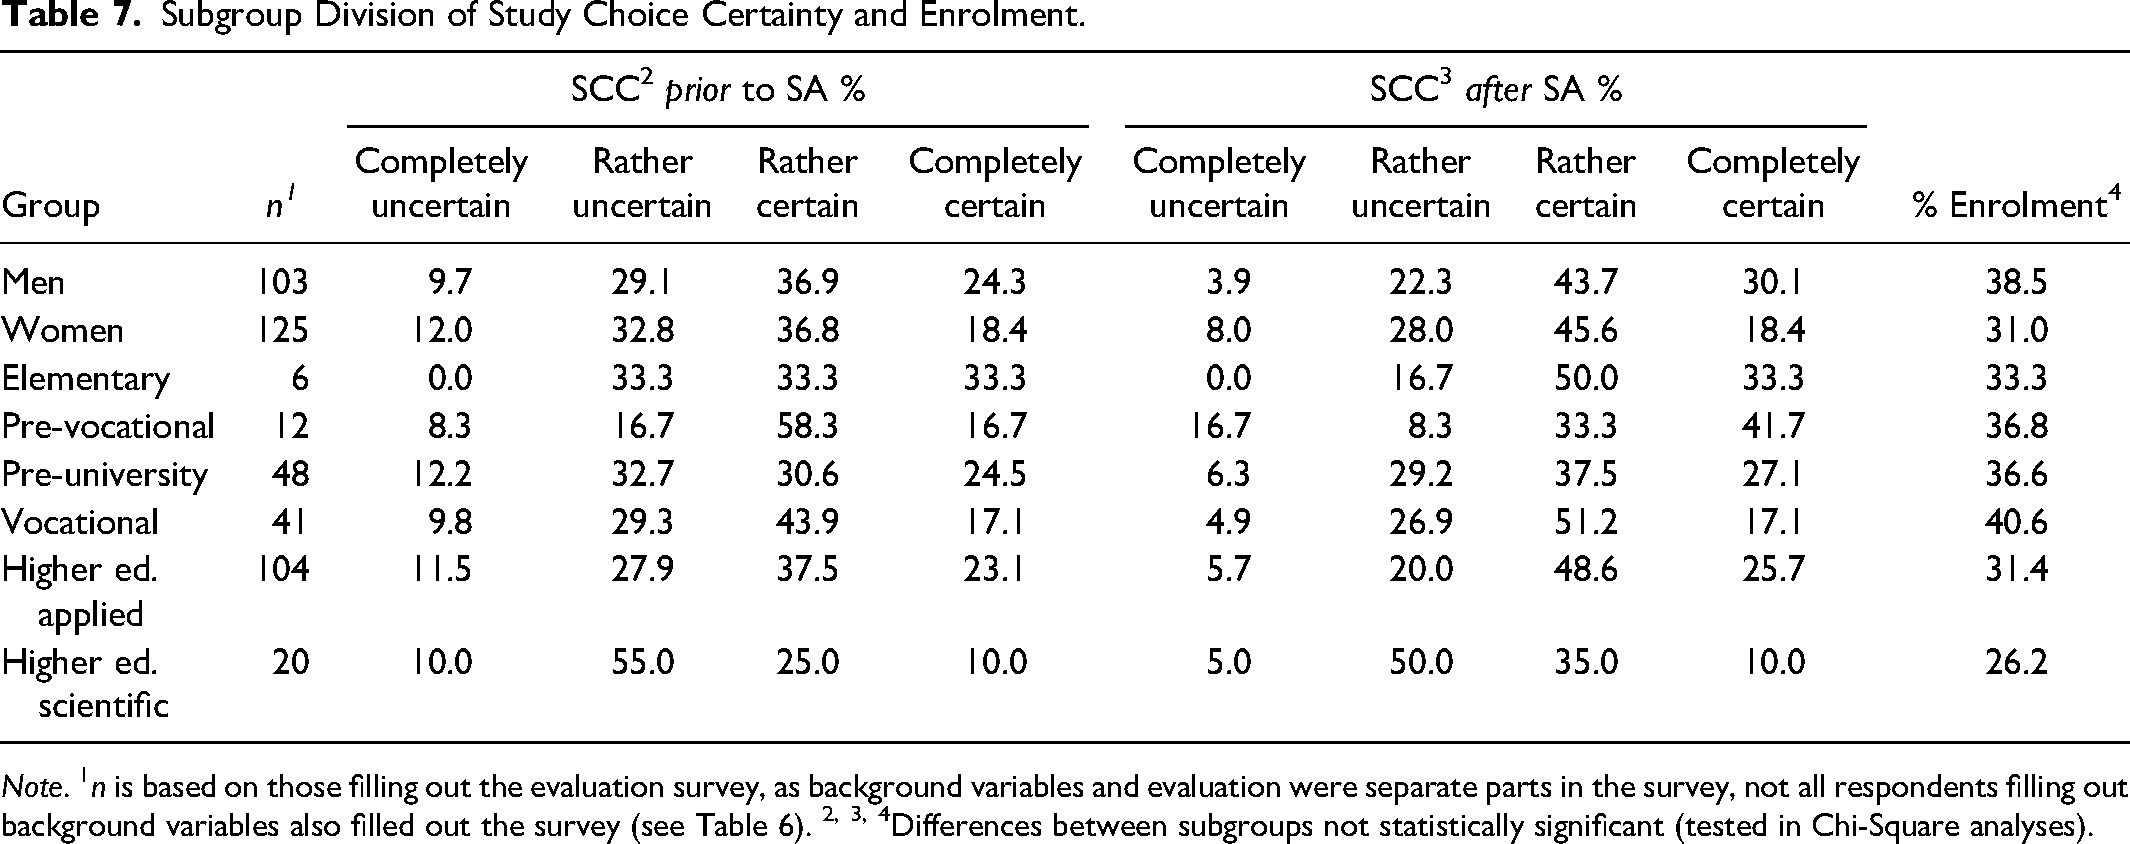
Note. 1n is based on those filling out the evaluation survey, as background variables and evaluation were separate parts in the survey, not all respondents filling out background variables also filled out the survey (see Table 6). 2, 3, 4Differences between subgroups not statistically significant (tested in Chi-Square analyses).
In line with hypothesis 1, obtaining ‘high-risk’ scores shows to be a negative, albeit not very strong, predictor of post-assessment SCC (while controlling for initial SCC) (β = −0.265, t (1) = −2.36, p = .019). Obtaining ‘high-risk’ scores 4 explains 1% of the variance in SCC. Contrary to hypothesis 2, the relationship between ‘high-risk’ scores and SCC does not appear to be moderated by initial SCC (β = 0.05, t (1) = 0.423, p = .672), meaning that a ‘high-risk’ score also affects those who were relatively certain about enrolling already before the SA. Contrary to hypothesis 4, the impact of obtaining ‘high-risk’ scores on SCC appeared to be moderated by gender in the sense that obtaining a high-risk score predicts lower SCC only for women (β = −0.71, t (1) = −3.17, p = .002). This interaction explains 1.5% of the variance in SCC.
‘High-Risk’ Scores, Study Choice Certainty and Enrolment
About one in three SA users (30.2%) enrolled within three months following the SA. Obtaining ‘high-risk’ scores was analysed as a predictor of enrolment in a binary regression model. In contrast to hypothesis 1, though enrolment probability is lower for those obtaining ‘high-risk’ scores, compared to those who do not, the difference is not significant (Z = −1.71, p = .086). Regarding the mediation hypothesis (3), the predictive value of SCC on enrolment (while controlling for initial SCC) turns out to be significant (χ2 (3) = 10.85, p = .012, R2 = 14.3%). We compared enrolment probabilities – based on the regression model – for distinct levels of SCC by means of a non-parametric ANOVA, as the probabilities were not normally distributed. All pairwise comparisons appeared significant in which the higher the SCC, the higher the enrolment probability. In sum, there does not appear to be a direct link between ‘high-risk’ scores and enrolment, yet there is a significant link between ‘high-risk’ scores and SCC, which in turn relates to enrolment. This indicates that there is an indirect-only mediation (Zhao et al., 2010). Figure 3 provides a visualization of the resulting model.

Resulting model ‘high-risk’ scores, SCC, and enrolment. Note. * p < .05, ** p < .01.
Subtest Scores and Study Choice Certainty
We first included all subtest predictors (and relevant covariates1) and removed the non-significant subtest predictors in a stepwise backwards method. The resulting model includes the discipline test score (β = 0.11, t (1) = 2.49, p = .014), the numerical skills test score (β = 0.12, t (1) = 2.84, p = .005), and whether or not the expectations test is taken (β = 0.28, t (1) = 2.61, p = .010), while controlling for initial SCC, hours planned to study score, age, gender, and prior level of education. In line with hypothesis 1, the significant subtest scores are positive predictors of SCC (indicated by the positive βs) and explain 5.1% of the variance in SCC. In line with hypothesis 2, the positive effect of taking the expectations test on SCC turned out to be moderated by initial SCC (β = −0.21, t (1) = −2.17, p = .031), in which only those initially (rather) uncertain were affected by taking this test. This interaction effect explains an additional 0.9% of the variance in SCC.
Subtest Scores, Study Choice Certainty, and Enrolment
Finally, the predictive value of specific subtests on enrolment was investigated in a binary regression analysis, again following a backward stepwise approach. The resulting model includes numerical skills score (Odds ratio = 1.82, p = .010) and hours planned to study score (Odds ratio = 2.02, p = .005), while controlling for discipline score, age, gender, and prior level of education. In line with hypothesis 1, the odds ratios indicate a positive relationship between the subtest scores and enrolment. The resulting model explains 9.0% (Nagelkerke R2) of the variance in enrolment. Next, we added SCC to check whether these relationships are mediated by SCC (hypothesis 3). As expected, SCC is a positive predictor of enrolment (Odds ratio = 2.34, p < .001). Furthermore, the predictive value of numerical skills score on enrolment disappeared, after adding SCC. This indicates that SCC mediates the relationship between numerical skills and enrolment. Hours planned to study score remained significant (Odds ratio = 1.95, p = .028). Not unexpected, as hours planned to study did not appear to significantly relate to SCC. In sum, three types of effects are found (Zhao et al., 2010): An indirect-only mediation of discipline and taking the expectations test on SCC and from SSC to enrolment; A complementary mediation from SCC on the relation between numerical skills and enrolment; and A direct-only
Resulting model subtests, SCC, and enrolment. Note. * p < .05, ** p < .01.
Conclusions and Discussion
The present study provides a hands-on example of how to investigate the consequential aspect of validity of a self-assessment for informed study decisions in (online) higher education. We investigated how the SA affects prospective students’ study choice certainty and subsequent enrolment.
Regarding the first hypothesis, on the level of the SA overall, obtaining ‘high-risk’ scores negatively relates to study choice certainty and, thereby (indirectly) affects enrolment (in line with hypothesis 3). In contrast to hypothesis 2, this impact does not depend on initial study choice certainty. Previous research suggested that those already quite certain about their study decision would only be looking for confirmation of their beliefs (Soppe et al., 2019), and would not be inclined to change their beliefs or decision in case of disconfirmation (Eil & Rao, 2011). In a previous qualitative study, prospective students also indicated that the SA would have more impact if they would have been less certain about their decision (Delnoij et al., 2022). A more diverse group of participants took part in the present study, as demonstrated by the distribution of initial study choice certainty. The results of the present study are in line with those by Van Klaveren et al. (2019), who found that the effect of risk (vs. success) scores, presented in a study decision activity, was independent of being (overly) confident. In this regard, Zafar (2011) discussed that students might better be classified as Bayesian learners, who actually revise their expectations and beliefs in expected ways.
Looking at specific subtest scores, three tests (discipline, numerical skills and expectations tests) positively related to study choice certainty (hypothesis 1). The relation between the expectations test and study choice certainty exists only for those initially (rather) uncertain about enrolling, which is in line with hypothesis 2. Though, in contrast to this hypothesis, this is the only effect moderated by initial study choice certainty. Nevertheless, this indicates that even without a personalised score, tests might add value, in this particular case helping those who are initially not very certain yet about their study decision. Furthermore, on the subtest level, two tests (hours planned to study and numerical skills) related to enrolment, in which the relationship between numerical skills score and enrolment is mediated by study choice certainty (in line with hypothesis 3). The social support test did not turn out to be significant in relation to study choice certainty and/or enrolment. More than half (54%) of the SA users in this study took this test, and most often (compared to the other tests) resulted in a ‘high-risk’ score. Yet, that does not seem to affect the study choice (certainty) of prospective students. Our previous user study showed that prospective students rate the relevance of this test for their study decision relatively low (Delnoij et al., 2020b). Perhaps this result generalizes to the more diverse group of participants in the present study. Literature suggests social support to be a relevant factor for study success, especially in the context of distance (online) higher education (Delnoij et al., 2020a; Muljana & Luo, 2019). This implies that due attention should be paid to clarifying this relevance for prospective students to effectively engage with this test and feedback in the SA.
Regarding fairness, there are two specific points to discuss. First, of those not obtaining any high-risk scores, 4.1% (8 participants) still became less certain about enrolling, implying a threat to consequential validity. As they obtained significantly more ‘medium-risk’ scores than those not obtaining any ‘high-risk’ scores and not discouraged, we might conclude that this does not actually indicate much of a threat to consequential validity. Furthermore, the expected (negative) relation between obtaining ‘high-risk’ scores and study choice certainty appears to exist only for women, while compared to men, they did not obtain more ‘high-risk’ scores in general or on specific subtests. This implies a threat to consequential validity. A possible explanation for this result are the gender differences reported in attribution theory (Beyer, 1998). This theory suggests that men tend to attribute poor performance to lack of effort, whereas women are more likely to ‘doubt themselves’; to attribute poor performance to a lack of ability. Though this effect explains only 1.5% of the variance in study choice certainty which begs the question whether and how this degree of ‘unfairness’ should be addressed. It is important to note that in fact high-risk scores mean to prompt prospective students to carefully reflect on their study decision. So, the effect found for women is not ‘unjustified’ or unfair, but the lacking of this effect for men is. Further research is needed to investigate how the feedback provided to men should be adapted to ensure that they do not dismiss high-risk scores too easily.
Implications
Combining different orientation activities has been stressed as relevant for the quality of study decisions and students’ progress (Borghans et al., 2015; Zhang et al., 2019). Hence, the self-assessment is embedded in the existing practice of providing information and advice prior to enrolment. This study shows that a self-assessment for informed study decisions does affect study decisions in terms of study choice certainty and enrolment behaviour. In general, the demonstrated impact is in line with the purposes of the SA and therefore, constitutes evidence for the consequential aspect of validity. In general, the effects (e.g., in terms of explained variance) of the SA on study choice certainty and enrolment are relatively small. However, the benefit of the SA should not only be derived from this, but should also be viewed in light of cost-effectiveness and scalability (Kraft, 2020; Schreurs et al., 2018). In this regard, it is also important to note that the SA does seem to have added value for a reasonably large group (68.9%), in line with purposes of the test. This is expressed, for example in the fact that prospective students tend to become more certain about enrolling if they do not obtain any ‘high-risk’ scores and – to a certain extent – seem to adequately downsize their certainty in case they do obtain such scores. Next to that, the SA offers concrete opportunities to improve chances of retention, both prior to and after enrolment by linking existing remedial courses and providing general tips. Previous research has shown that such remediation is a promising effective strategy for improving retention (Muljana & Luo, 2019; Wachen et al., 2016).
In general, the consequential aspect of validity has been underexplored in applied validation studies (Cook et al., 2014). Especially, in the context of study decision tools and even more so in educational contexts with broader accessibility, like online higher education (Niessen & Meijer, 2017; Soppe et al., 2019). The procedure shown in this paper may inspire other institutions in evaluating assessments in the context of admission and orientation towards higher education.
Limitations and Recommendations for Future Research
The predominant limitation is that not all subtests in the present SA were fully developed. For two tests (expectations and study strategies), a score distribution was not yet set, which means prospective students did not obtain personalised feedback on these tests. Those who took the study strategies test also took the expectations test, which means we could not investigate both tests separately, as this would result in multi-collinearity. We included the test completed most often – the expectations test – as a predictor, but exactly which part of the effects in regard to that predictor can be attributed to that test and which to the study strategies test needs further investigation. Additionally, longitudinal consequence evaluation would be valuable, by complementing the current findings with data regarding students’ success after enrolment. Though, we must bear in mind the more general limitation that we can only evaluate consequences for those who did decide to enrol, be it on the base of favourable assessment results or despite unfavourable results. For those who do not enrol, we will never know whether they would have been successful. If it was an unfavourable test result that led them to decide not to enrol, we will never be able to tell whether the assessment unjustly led them to re-think and decide otherwise or safeguarded them from a frustrating and possibly painful experience.
Footnotes
Declaration of Conflicting Interests
The author(s) declared no potential conflicts of interest with respect to the research, authorship, and/or publication of this article.
Funding
The author(s) received no financial support for the research, authorship, and/or publication of this article.