
Abstract
Despite evidence for the academic and psychological benefits of racial/ethnic minority (REM) students enrolling in minority-serving institutions, REM college students’ graduation rates have been consistently lower for White students across institutions. The current study examined REM graduation rates and associated risk factors in a campus with
Introduction
Racial/ethnic minority (REM) students graduate from colleges and universities at significantly lower rates than White students (Seidman, 2005). In Predominantly White Institutions (PWIs), REM students are more likely to experience racism and discrimination, as well as a lack of social, academic, and financial support, which reduces their sense of belonging and intention to continue their education (Gloria et al., 2005; Hurtado & Carter, 1997; Hurtado & Kamimura, 2003; Seidman, 2005). Indeed, REM students at PWIs often experience “minority status stress” triggered by their membership in a socially stigmatized group, which negatively affects their mental health and willingness to continue (Contrada et al., 2001; Gloria et al., 2005). By contrast, in settings where relatively large numbers of REM students are enrolled, such as at Historically Black Colleges and Universities (HBCUs) or Hispanic Serving Institutions (HSIs), REM students have more frequent and meaningful interactions with faculty (Wells-Lawson, 1994), more positive self-image, greater racial pride, higher educational aspiration (Contreras & Contreras, 2015; Gurin & Epps, 1975; Ward & Zarate, 2015), and more favorable adjustment skills (Fleming, 1984). Nevertheless, REM students at HBCUs and HSIs are even less likely to graduate from college compared with their REM counterparts at PWIs (Contreras & Contreras, 2015; Flores & Park, 2013; but see Kim & Conrad, 2006), perhaps due to the former’s relatively lower SAT scores, weaker high school records, and less financial or parental resources (Allen, 1992; Benítez & DeAro, 2004; Flores & Park, 2013; Kim & Conrad, 2006; Seidman, 2005).
What factors affect the college completion rates of REM students? In the current study, we provide pilot data for a new hypothesis: REM students thrive academically in educational settings where no single racial majority exists. We consider here the case of a 4-year institution with
Disparities in College Education
Although the number of Black and Latinx students entering college has grown significantly in the past 50 years, McGlyn(2014) showed the graduation rates of Black (27.62%) and Latinx (19.81%) students are still significantly lower than White (43.87%) and Asian (59.35%) students. A large body of literature has documented similar racial/ethnic disparities in higher education, yet without consensus on the factors that drive these disparities (Adelman, 2006; Bowen et al., 2009; Camburn, 1990). One difficulty with previous studies is that the effects of racial/ethnic composition on college retention have mostly been observed only in either PWIs or minority-serving institutions (Adelman, 1999; Allen, 1985, 1992; Astin, 1991; Attewell et al., 2011; Bean, 1980; Benitez & DeAro, 2004; Berger & Milem, 1999; Buchman & DiPrete, 2006; Flores & Park, 2013; Ishitani & DesJardins, 2003; Kim & Conrad, 2006; Rector et al., 2001; Rincón, & Rincâon, 2008; Stoecker et al., 1988; Wells, 2008). Due to the demographics of the US population, samples often contain large proportions of White participants (>85%) but relatively few REM participants (<15% combined; Adelman, 2006; Astin, 1991; Attewell et al., 2011; Bean, 1980; Berger & Milem, 1999; Buchman & DiPrete, 2006; Ishitani & DesJardins, 2003; Rector et al., 2001; Rincón & Rincâon, 2008; Stoecker et al., 1988; Wells, 2008). Moreover, students who transferred and received bachelors’ degrees at other institutions are typically considered dropouts and excluded from many studies, which creates unreliable graduation estimates (Attewell et al., 2011; Berger & Milem, 1999; Buchman & DiPrete, 2006; Contreras & Contreras, 2015; Flores & Park, 2013; Ishitani & DesJardins, 2003; Rector et al., 2001; Rincón & Rincâon, 2008; Stoecker et al., 1988). Finally, although some risk and protective factors such as gender, socioeconomic status, and parental education have been well studied (Adelman, 1999; Astin, 1993; Buchman & DiPrete, 2006; Ewert, 2012; Ishitani & DesJardins, 2003; Pascarella & Terenzini, 1980; Strodtbeck et al., 1957; Tierney, 1999; Tinto, 1975, 1993), other factors, such as stress, satisfaction in college, hours of study, hours of work, length of commute, immigration status, have been under-examined (Ackerman & Gross, 2003; Adams et al., 2016; Bradburn & Carroll, 2002; Ishitani & DesJardins, 2003; Martin & Midgley, 2010 ).
Purpose of the Current Study
The current study employed Astin’s (1984) I-E-O model to examine protective and risk factors among racial minority and majority students at an NRM campus. Astin’s model is particularly useful when comparing intrinsic factors, such as race/ethnicity and gender, to experiential factors, such as stress, satisfaction, and registration status. We compared graduation rates of the four main racial groups at the NRM institution (Black, Latinx, White, and Asian) to national averages, while addressing the limitations identified in previous studies. For example, to provide a better estimate of academic success, the current study included students who discontinued their enrollment in their initial college but received an undergraduate degree at other institutions. We also focused the study on eight-year college completion rates to provide a more complete window on REM graduation (Snyder et al., 2018).
Method
Participants
The NRM is a large urban commuter-based institution in Harlem, New York City offering low in-state tuition and comprised of over 16,500 students, including 630 (3.8%) doctoral, 2,441 (14.8%) masters, and 13,445 (81.4%) undergraduate students (Silverman, 2016). The student body has an equal representation of males (49%) and females (51%) with relatively equal numbers of students in each demographic group (White 18%; Black 23%; Latinx 32%; Asian 18%) (see Table 1). The NRM faculty is less diverse than the study body (White 44%; Black 20%; Latinx 17%; Asian 12%), but much more diverse than the average faculty at US degree-granting postsecondary institutions (White 75%; Black 6%; Latinx 6%; Asian 12%; Hussar et al., 2020). We investigated two samples. The first sample consists of all undergraduate students (n =12,960) enrolled in the NRM during the fall semester of 2009. The second sample is a subset from the larger sample of 514 students in an introductory psychology class in 2009 who completed a 21-item survey of sociodemographic characteristics (e.g., household income, parents’ education, place of birth) and college-related experience (e.g., student employment, source of financial support, full or part-time registration status, length of commute, stress, hours of study) (see Online Appendix A).
Demographics and Graduation Rates of the 2009 Undergraduate Cohort (n = 12,960) and Survey Sample (n = 514) at NRM.
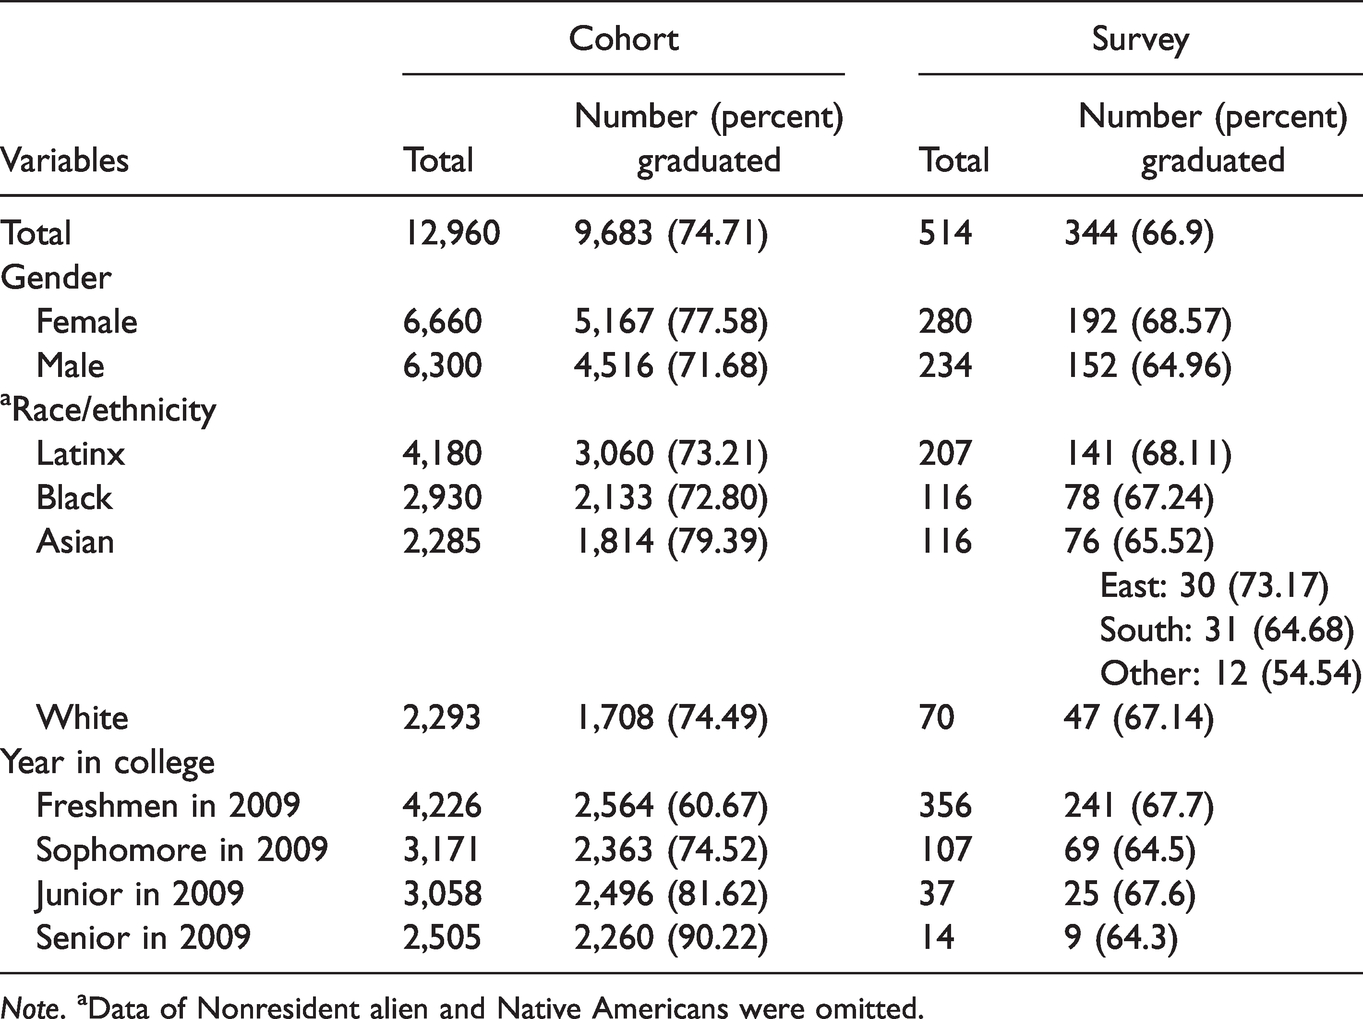
Note. aData of Nonresident alien and Native Americans were omitted.
Measures
Data Analysis
Eleven variables contained at least one missing value, 224 students failed to answer at least one question, and a total of 389 (3.44%) among 11,308 values were unrecorded (see Table 2). Missing data were handled by either matching with the sociodemographic OIR data or using multiple imputations. Missing race identifiers reduced the survey sample for regression analyses from 514 to 509. The racial groups in both samples were re-categorized into four groups (see Table 3). To prevent multicollinearity, collinearities among all variables were tested, and VIF was controlled below 3.0. Nonetheless, a singularity in Hessian matrix and a possible quasi-complete separation were detected in multinominal logistic regression analyses. By removing two variables, place of birth and registration status, both errors were corrected.
Descriptions of Missing Data From Survey Sample (n = 514) at NRM.
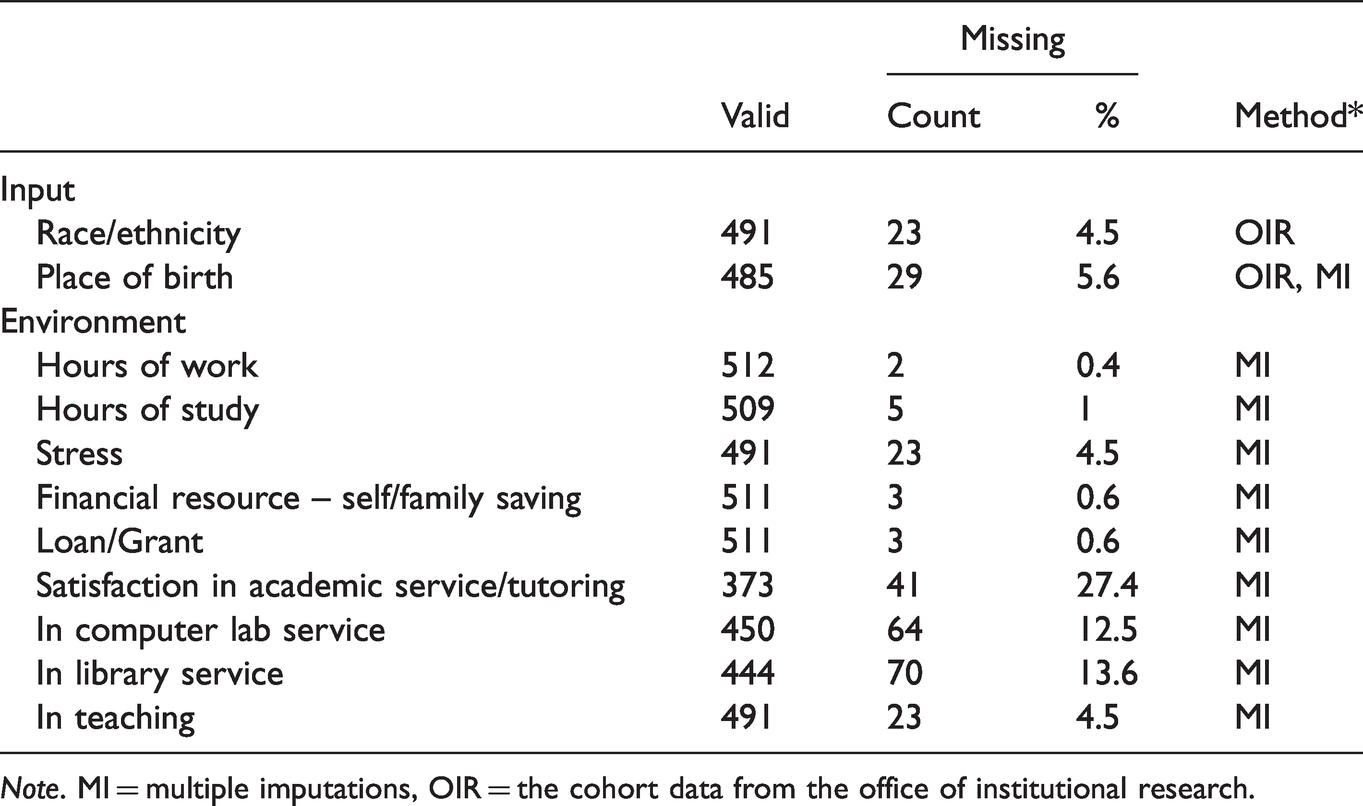
Note. MI = multiple imputations, OIR = the cohort data from the office of institutional research.
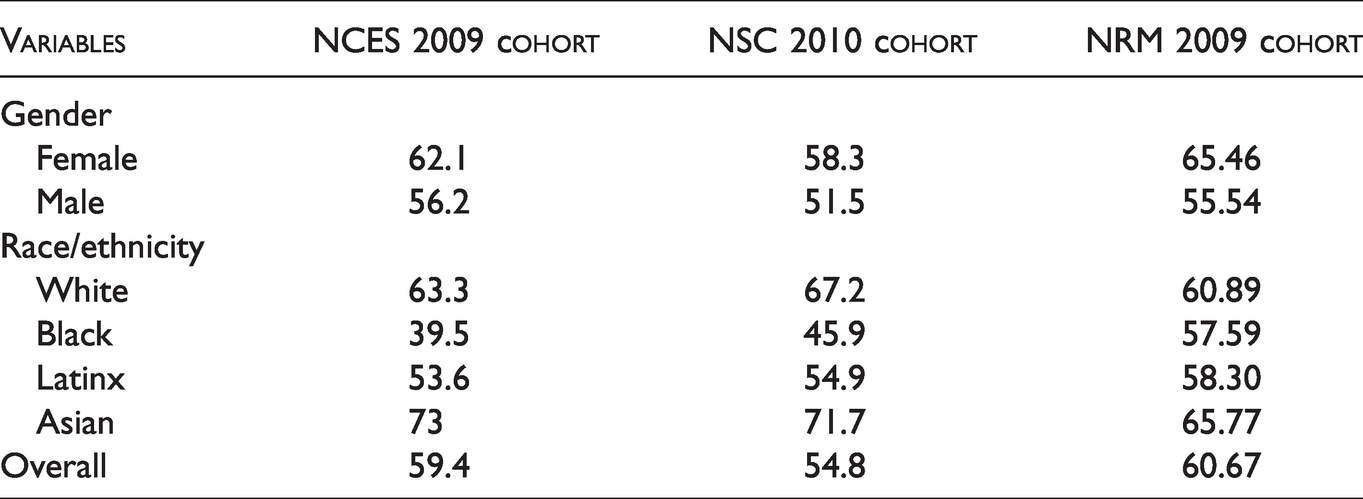
Graduation Rates (%) of Freshmen Cohorts in the NCES, NSC, and NRM Samples.
Data analysis comprised four phases. First, the 2009 cohort (n = 12,960) and survey (n = 514) samples were analyzed by gender, race/ethnicity, and year in college to observe general graduation patterns at the NRM. Second, the graduation rates of students who were freshmen in 2009 (n = 4,226) were compared with the national freshmen graduation rates reported by the NSC and NCES. Third, to identify factors that affect college completion at the NRM, binary logistic regression analyses were conducted separately with well-established and under-examined variables (n = 509). Finally, to identify relative risk factors associated with REM students, multi-nominal logistic regressions (NOMREG) were conducted using White and Asian as reference groups and race/ethnicity as the dependent variable (n = 509). To ensure ample statistical power in logistic regression analyses with many independent variables (see Peduzzi et al., 1996), two separate logistic regression analyses, one with input and another with environment variables, were conducted in the third and fourth phases.
Results
Among students who began NRM as freshmen in 2009 (n = 4,226), 60.67% graduated either from the NRM or the college where they transferred. The NCES and NSC analyzed 6-year graduation rates; thus, we expected the 8-year rates calculated at the NRM to be elevated by 1.9% to 3.8% (see Horn, 2011). The NCES report for the 2009 cohort (Snyder et al., 2018) revealed a six-year graduation rate of 59.4%. The NSC report for the 2012 cohort (n = 2,823,578; Shapiro et al., 2017) showed a six-year graduation rate of 54% (including 42% graduating from their starting college and 12.8% graduating from transfer colleges). The graduation rate of Black students was 18.08 points higher at the NRM compared with NCES data and 11.69 points higher compared with NCS data. The graduation rate of Latinx at NRM was 4.7 points (NCES) and 3.4 points (NSC) higher. On the other hand, Asian and White students’ graduation rates at NRM were 2.41 and 7.23 points lower, respectively (see Table 3).
The upshot is that NRM showed significantly smaller disparities among racial/ethnic groups in graduation rates compared with national averages (see Figure 2). We found common patterns among the NSC, NCES, and NRM data sets. Asian female students graduated at the highest rate, whereas Black male students graduated at the lowest rate. Differences in graduation rates among racial/ethnic groups were the largest among males. Yet two patterns stood out in the NRM as distinct from NCES and NSC: 1). Black and Latinx females graduated at higher rates than males of all races, including Asian and White (see Figure 1); 2). Differences in graduation rates were larger between genders (9.92) than among racial/ethnic groups (8.18) (see Figure 2). Of course, national data sets include some NRM schools, making the comparison imprecise. To provide a deeper understanding of the role of racial/ethnic diversity in college graduation, we compared six-year graduation rates among 34 mid-sized colleges (∼20,000 students) that are relatively high (approximately 40% of the student population is White) versus low (60% White) in racial/ethnic diversity (NCES survey, February 26, 2021). A summary of graduation rates by racial/ethnic status appears in Table 4. As one can see, the lower the racial/ethnic diversity of the student population, the greater the disparity in graduation rates of Latinx and, especially, Black students relative to White students. Indeed, Black students at schools with relatively low racial/ethnic diversity have a 16-point lower graduation rate on average than White students. By contrast, Black, Latinx and White students have roughly the same graduation rate at mid-sized institutions with relatively high racial/ethnic diversity. These results are in concert with the comparison of the NRM with national data.
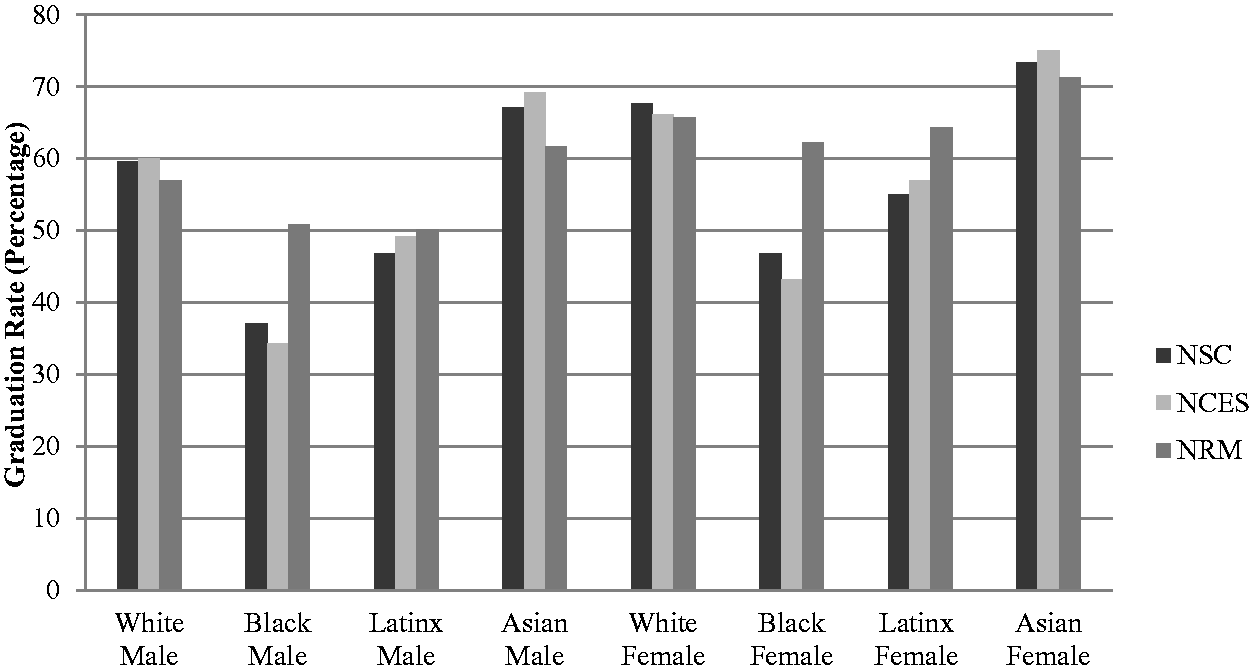
Rates of Student Graduation Separately by Each Combination of Gender-Race/Ethnicity Group in the National Student Clearing House (NSC), National Center for Education Statistic (NCES), and No-Racial/Ethnic Majority (NRM) Samples.
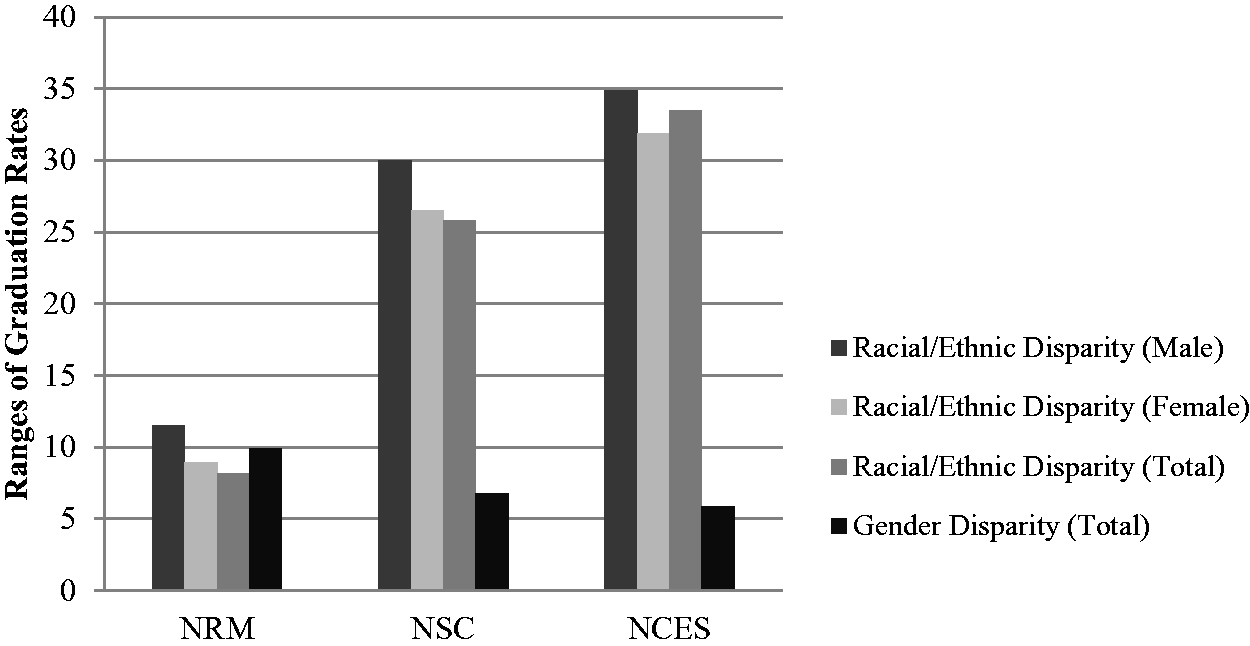
Disparities in Graduation Rates (Expressed as Graduation Range) for Racial/Ethnic Groups (Combined and Separately by Gender) and Gender in the No-Racial/Ethnic Majority (NRM) Campus, National Student Clearing House (NSC), and National Center for Education Statistic (NCES) Samples.
Six-Year Graduation Rates in High Versus Low Racial/Ethnic Diversity Colleges.
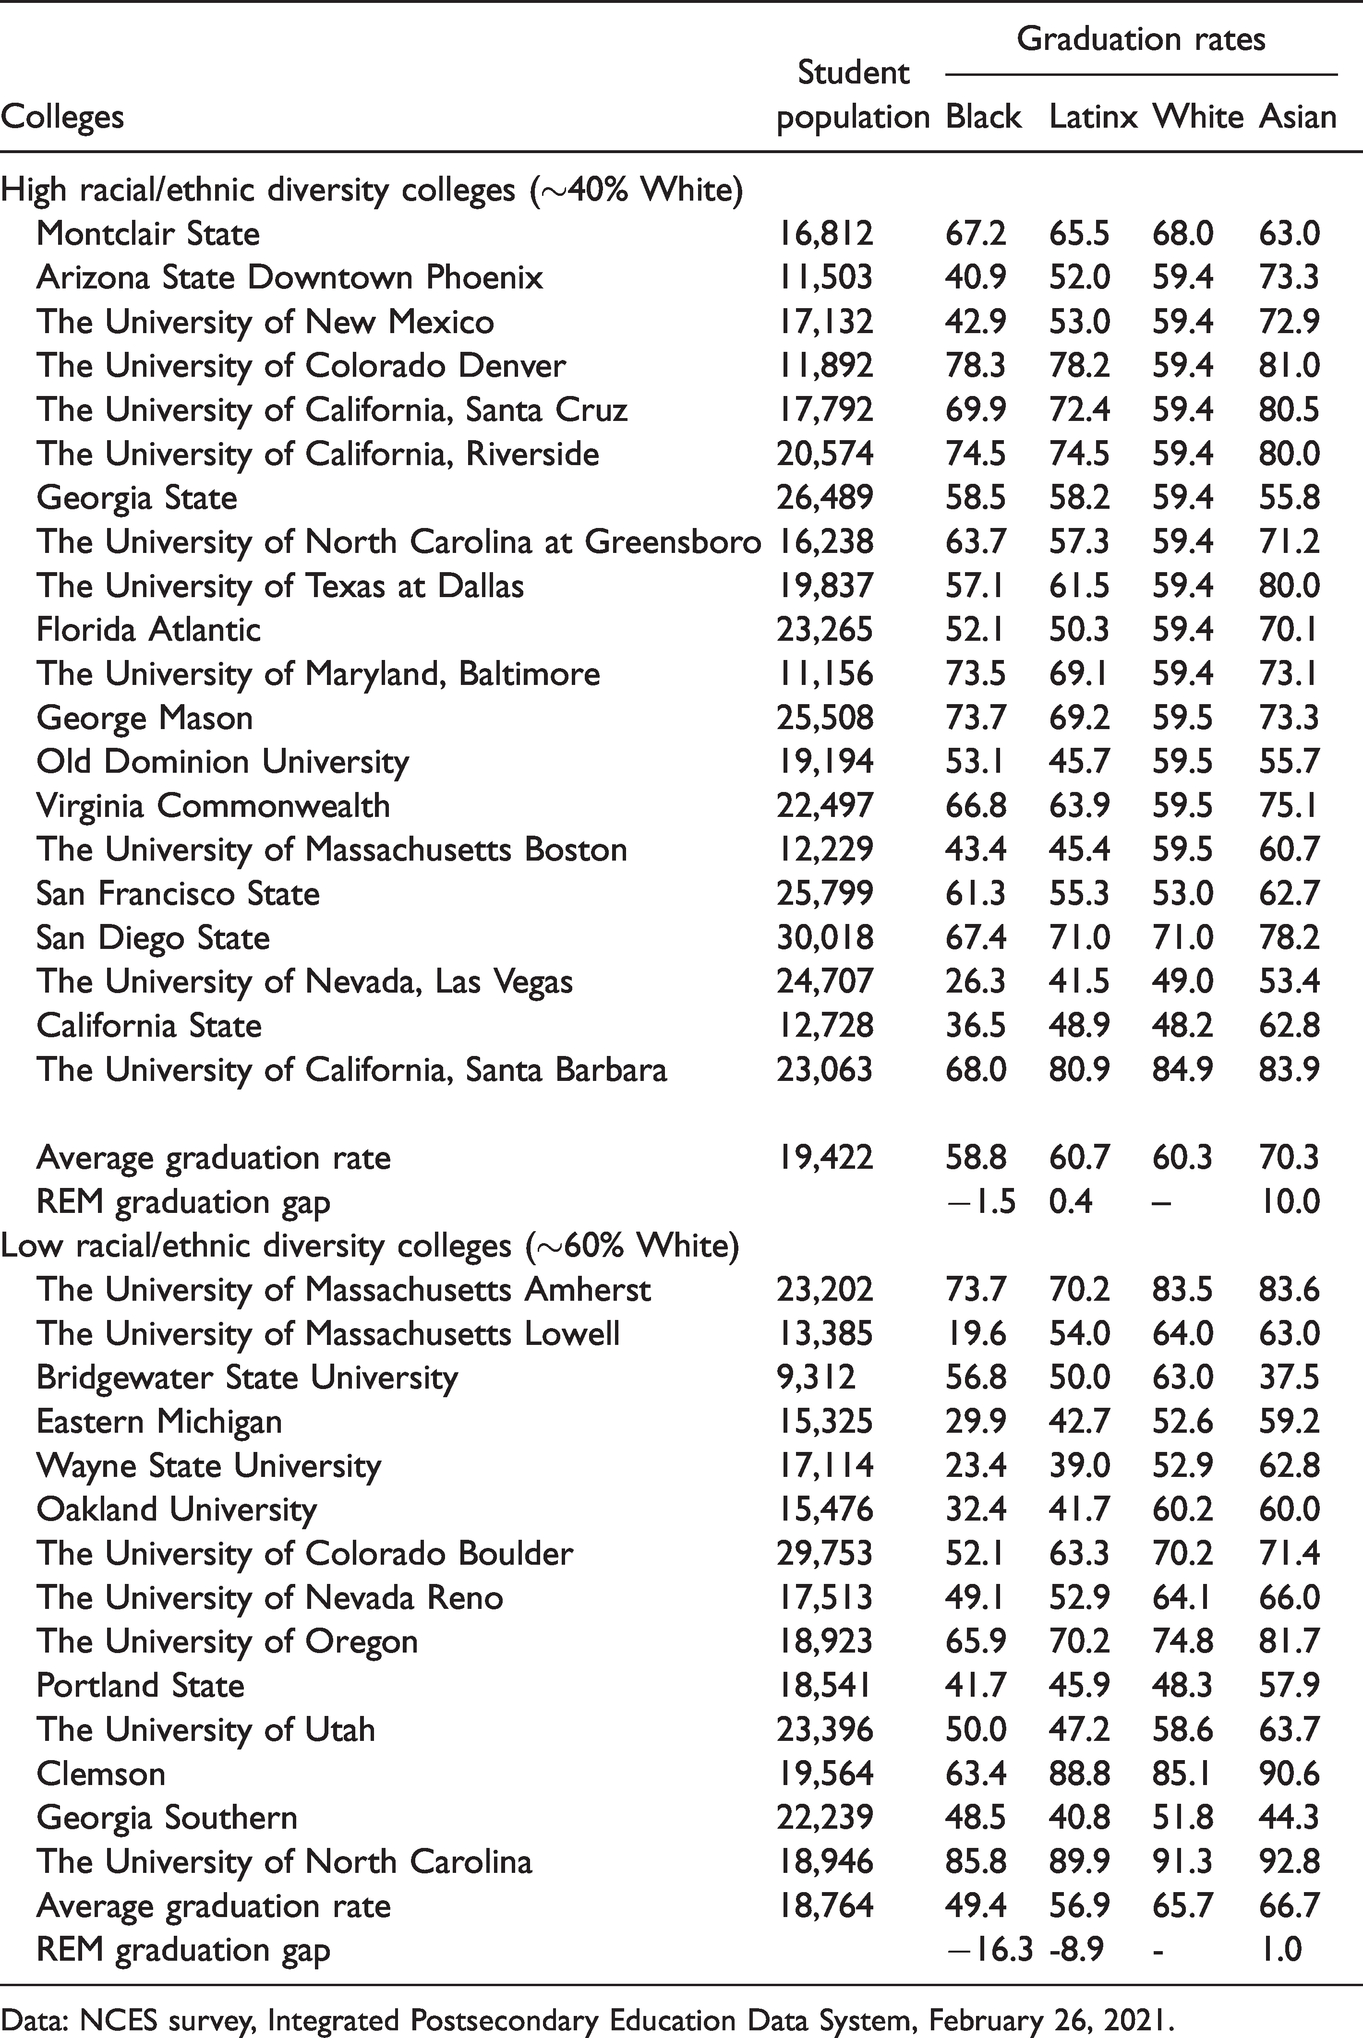
Data: NCES survey, Integrated Postsecondary Education Data System, February 26, 2021.
Input Variables Predicting College Completion at NRM (n = 509; Models 1 and 2).
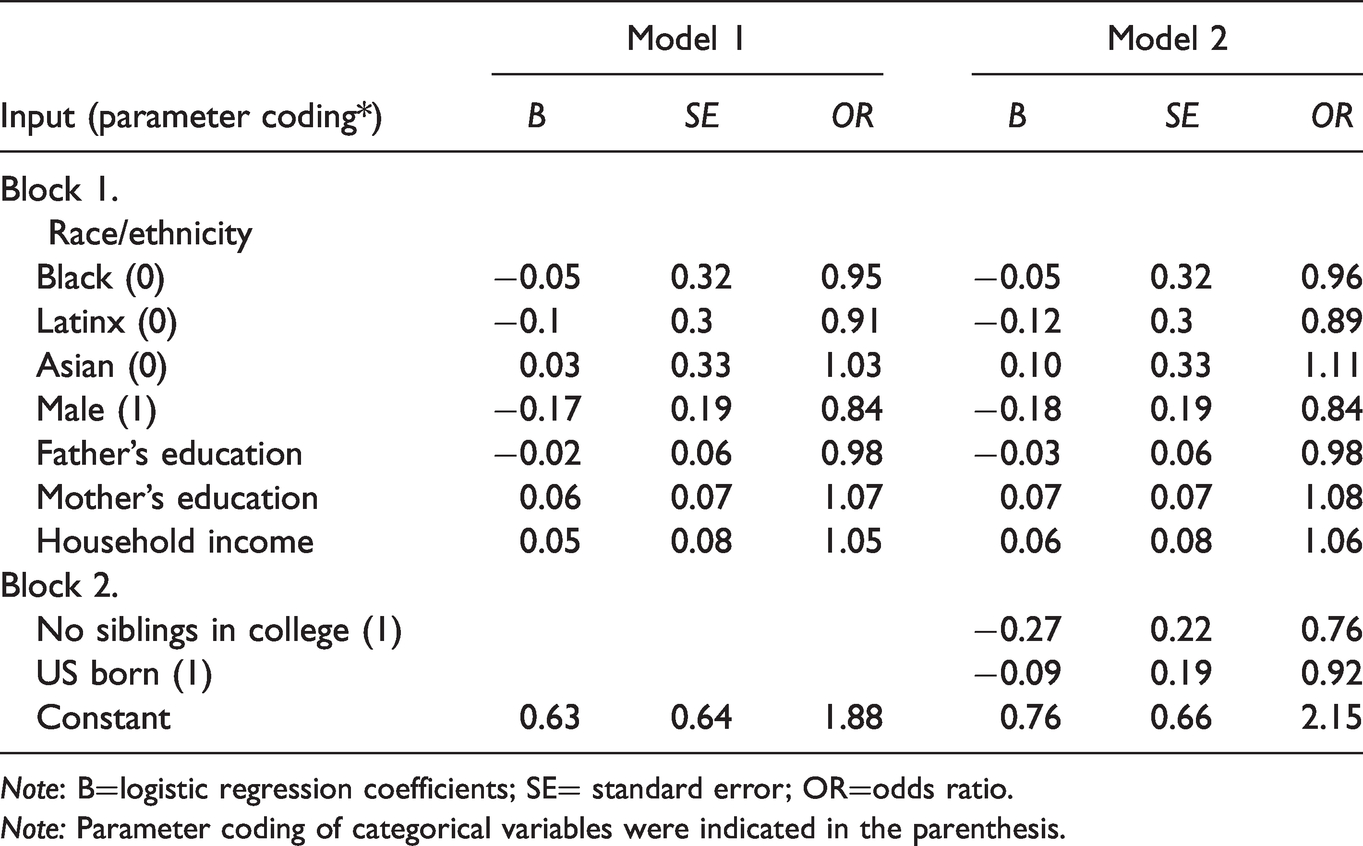
Note: B=logistic regression coefficients; SE= standard error; OR=odds ratio.
Note: Parameter coding of categorical variables were indicated in the parenthesis.
Environment Variables Predicting College Completion at NRM (n = 509; Models 3 and 4).
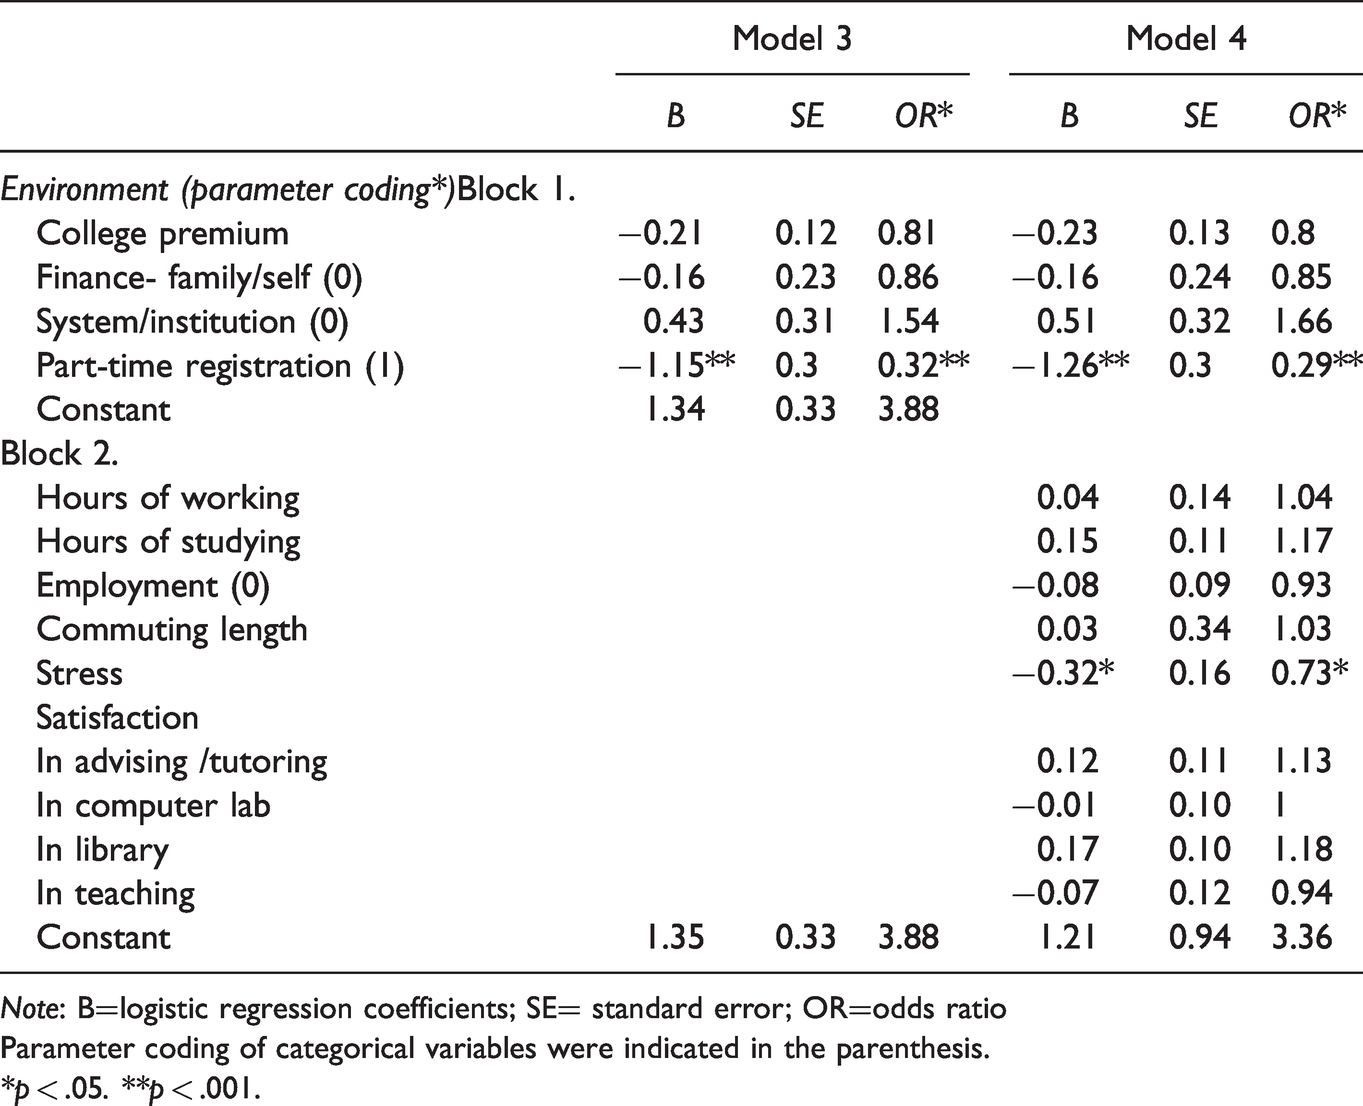
Note: B=logistic regression coefficients; SE= standard error; OR=odds ratio
Parameter coding of categorical variables were indicated in the parenthesis.
*p < .05. **p < .001.
The regression analyses revealed that none of the input variables predicted students’ graduation in either Model 1 (Nagelkerke R2 = 7% variance explained), χ2(7) = 2.559, ns, or Model 2 (12% variance), χ2(7) = 4.44, ns (see Table 5). However, the environment variables were statistically significant in both Model 3 (53.6% variance), χ2(4) = 20.1638, p < 0.001, and Model 4 (92.4% variance), χ2(13) = 35.155, p < 0.001 (see Table 6 ).
Both models correctly classified 68.18% of cases. Here, the well-established factors, such as parental education, household income, gender, and financial support, which have been known to be good predictors in previous studies, did not predict graduation. Only registration status and perceived stress predicted college completion. Table 6 shows that part-time registration and an increase in perceived stress were both associated with a reduction in the likelihood of graduation. A part-time student was 71% less likely to graduate than a full-time student (Model 4); every unit increase in part-time status led to a decrease in the log-odd for graduation of 1.15 units. A student who perceived more stress in college relative to high school was 27% less likely to graduate than students who perceived less stress (see Table 5); every unit increase in stress led to a decrease in the log-odd for graduation of 0.32 units.
Multinomial Logistic Regression Results Linking Input Variables to Students’ Race/Ethnicity at NRM (n = 509; Models 1 and 2).
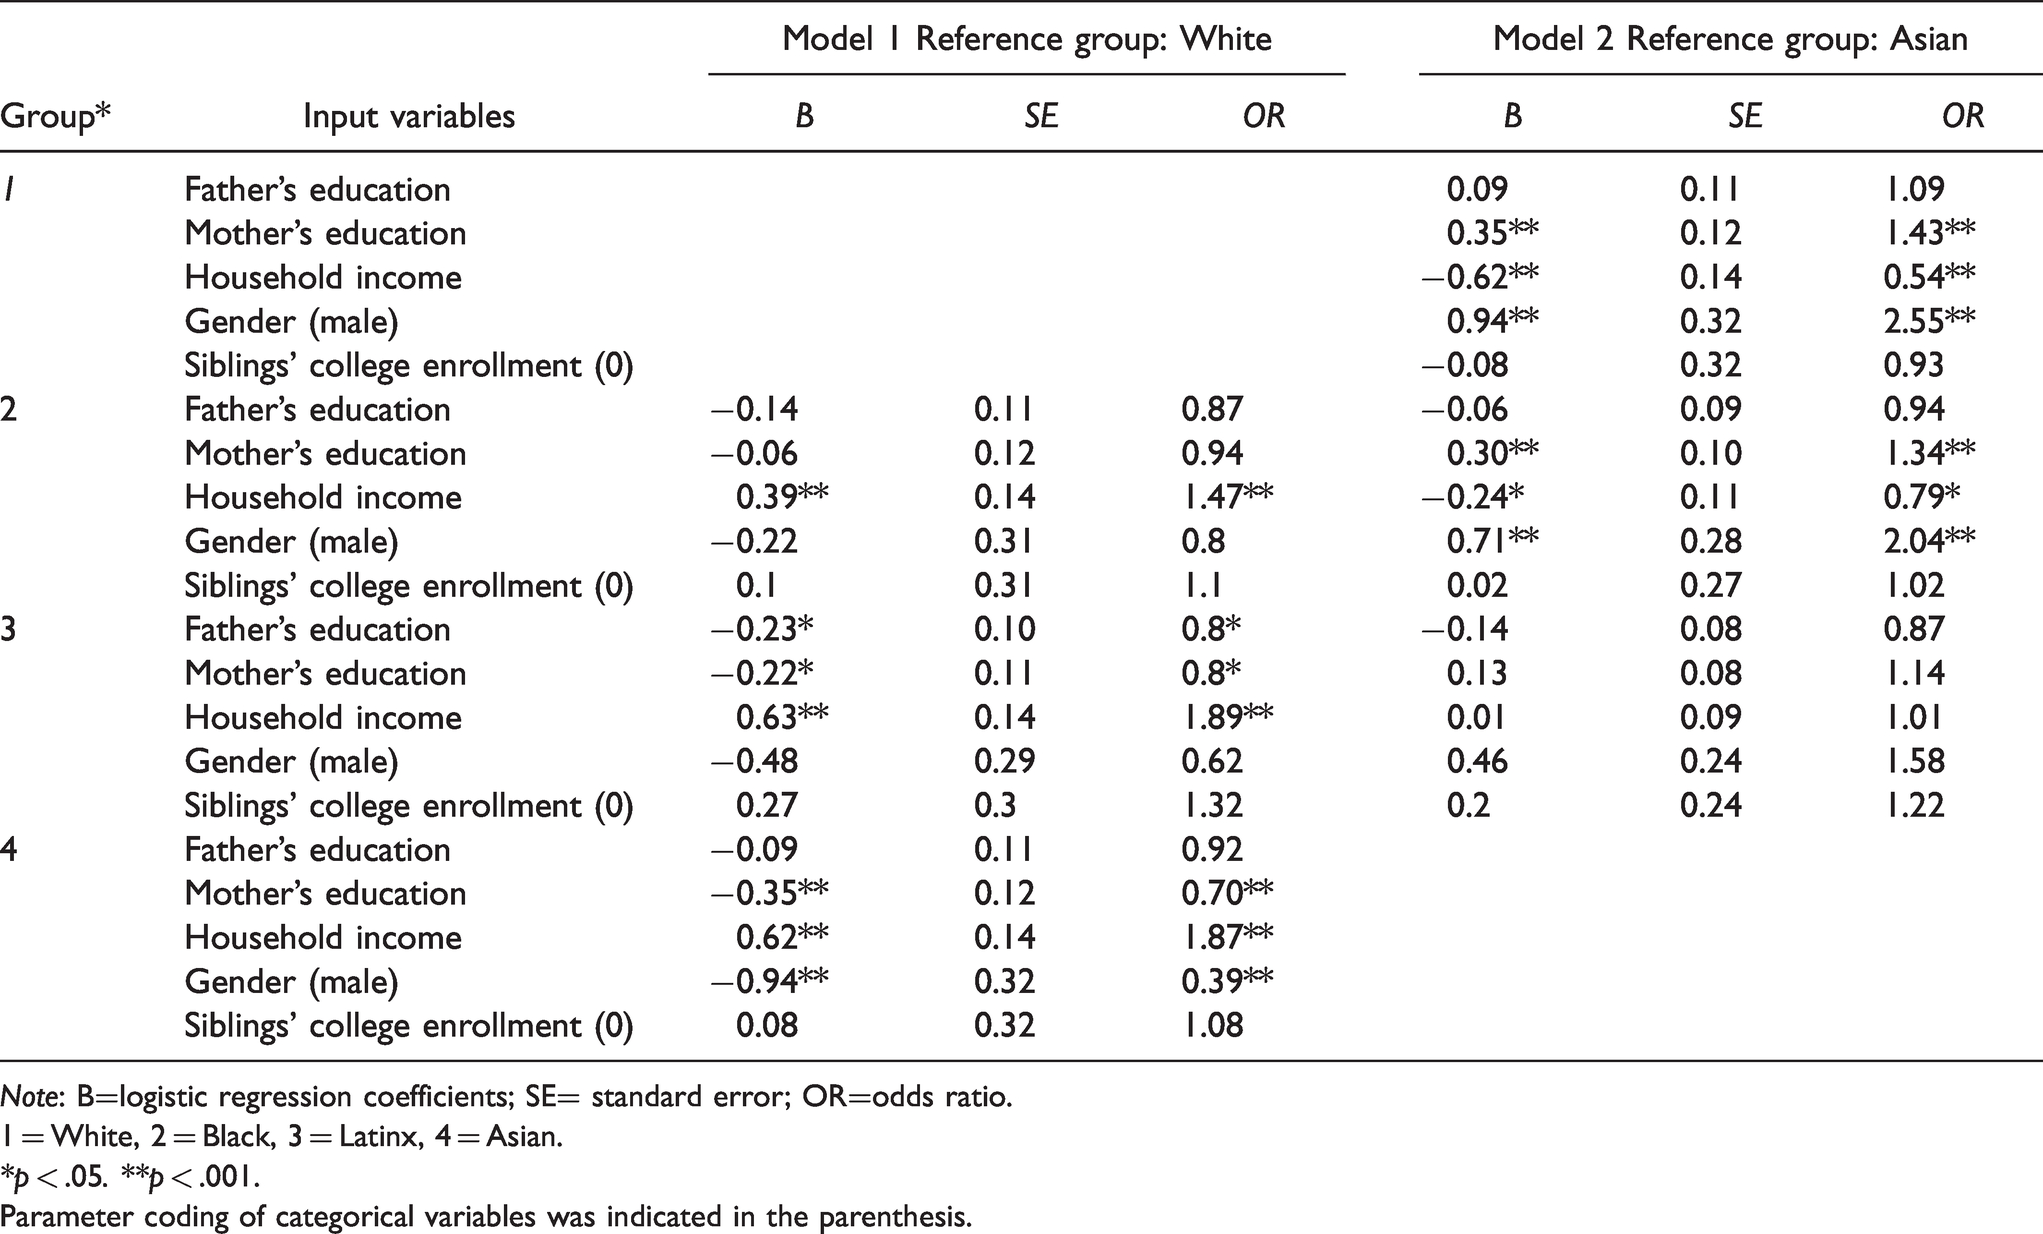
Note: B=logistic regression coefficients; SE= standard error; OR=odds ratio.
1 = White, 2 = Black, 3 = Latinx, 4 = Asian.
*p < .05. **p < .001.
Parameter coding of categorical variables was indicated in the parenthesis.
When White was used as the reference group, Black students revealed higher household incomes; Latinx students had lower parental education and higher household incomes. When Asian was used as the reference group, Black students had higher parental education, lower household income, and a higher ratio of male students. Latinx and Asian students did not differ on any input variable.
NOMREG of environment variables (Models 3 and 4) uncovered significant relative risks (or protections) for REM students compared with White or Asian students, χ2(48) = 115.72, p < 0.001 (22% variance explained), in hours of study, χ2(4) = 29.64, p < 0.001, length of commute, χ2(4) = 22.21, p < 0.001, financing college with self/family saving, χ2(4) = 10.44, p < 0.05, and financing college with loan or grant χ2(4) = 10.28, p < 0.055 (see Table 8). When White was used as the reference group, REM students demonstrated higher expectations of college premium and fewer study hours. Latinx students were also less likely to finance college with self/family savings but more likely to use loans or grants. When Asians were used as the reference group, REM students were found to study and commute for fewer hours; Latinx students were more likely to finance college with loans or grants.
Multinomial Logistic Regression Results Linking Environment Variables to Students’ Race/Ethnicity at NRM (n = 509; Models 3 and 4).
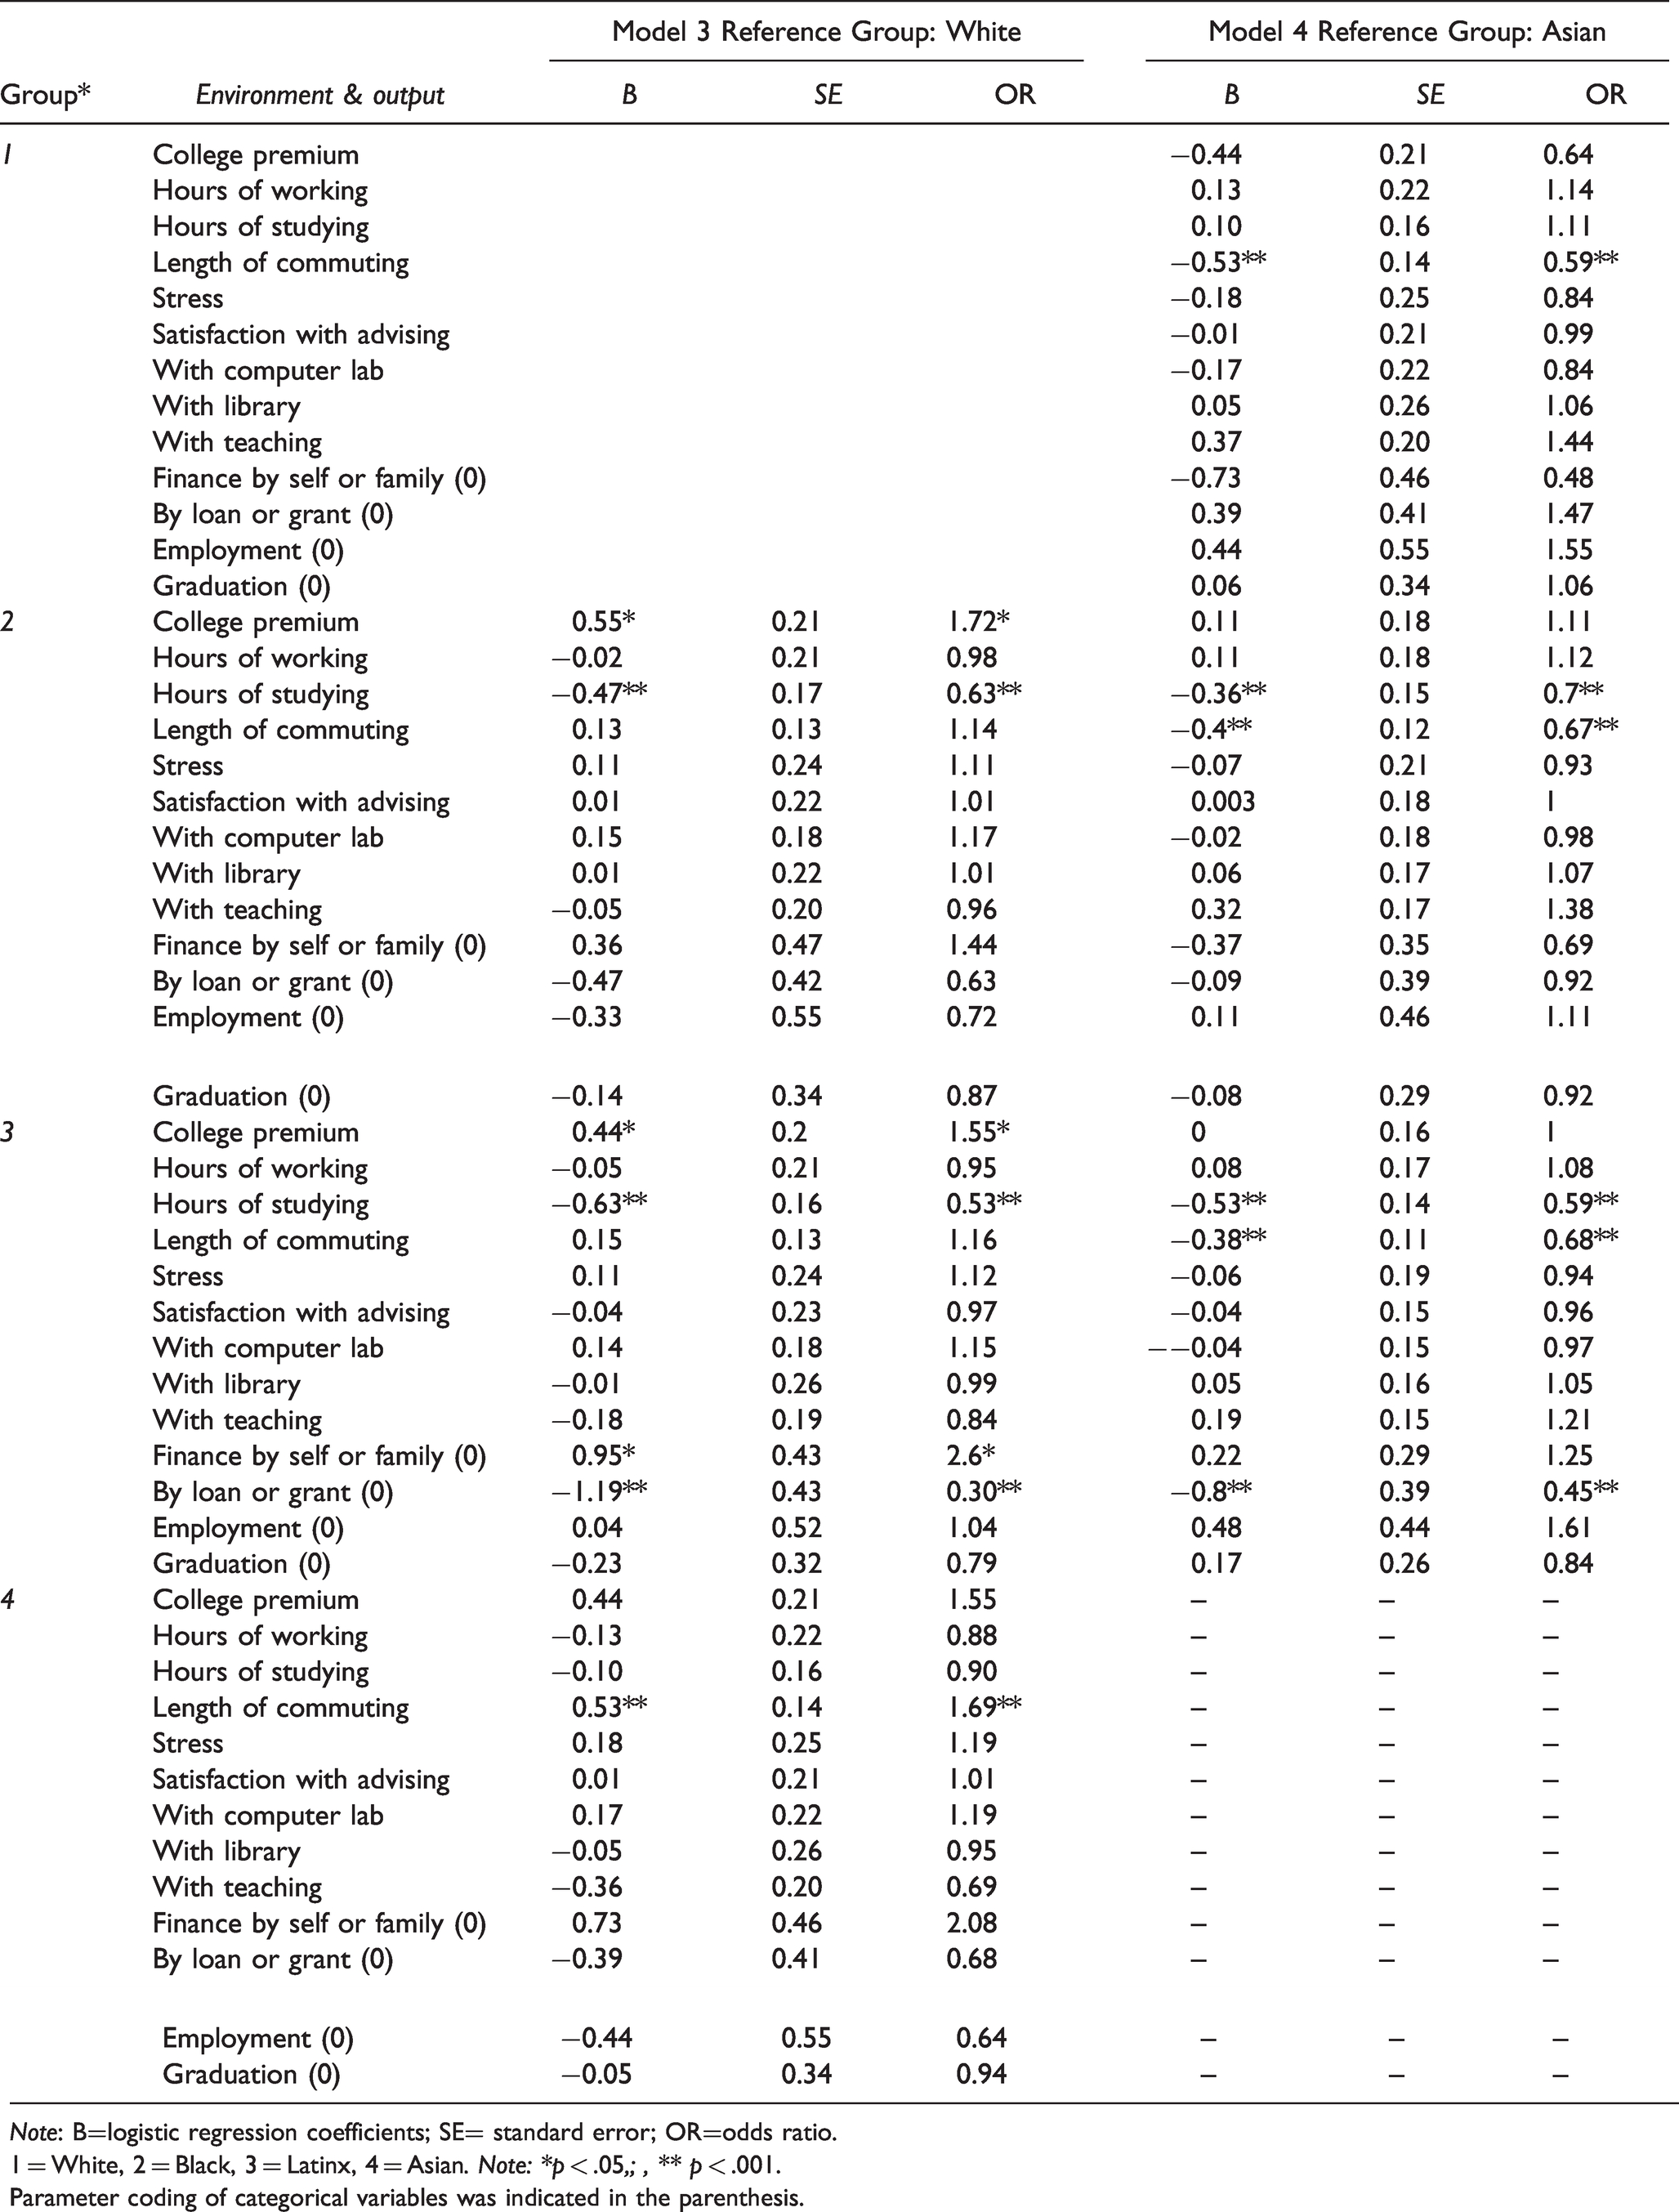
Note: B=logistic regression coefficients; SE= standard error; OR=odds ratio.
1 = White, 2 = Black, 3 = Latinx, 4 = Asian. Note: *p < .05,; , ** p < .001.
Parameter coding of categorical variables was indicated in the parenthesis.
Discussion
College graduation rates of REM students are significantly lower than those of White students across PWIs, HSBCs, and HSIs (Fletcher & Tienda, 2010; Kao & Thompson, 2003; Snyder et al., 2018). The current study examined the hypothesis that REM students thrive academically in educational settings where no single racial/ethnic majority exists (see Seidman, 2005; Umbach & Kuh, 2003). We examined graduation rates and predictive factors for REM students in an urban NRM institution. We found that college completion of REM students in the NRM (58%) was comparable to the average graduation rates of White students in PWIs (63%), despite appreciably less racial/ethnic diversity among the NRM faculty (Hussar et al., 2020). Moreover, in contrast to national averages, we found little disparity in average graduation rates among racial/ethnic groups in the NRM sample. Indeed, female students REM outperformed Asian and White male students at the NRM, and REM students had a similar social and financial status to White students, including parental education, household income, and immigration status. Traditional input factors such as social and economic background, immigration status, and gender played no role in predicting college completion at the NRM. Instead, two experiential variables explained NRM graduation: perceived stress and registration status. We found similar results in a separate analysis of graduation rates in mid-sized colleges that are high versus low in racial/ethnic diversity (Table 4). The results suggest that the absence of a single racial/ethnic minority among students in college may alleviate REM disparities in graduation and create an environment in which the individual’s college experience has a more powerful impact on completion than demographic, cultural, or economic factors.
Risk Factors in College Completion
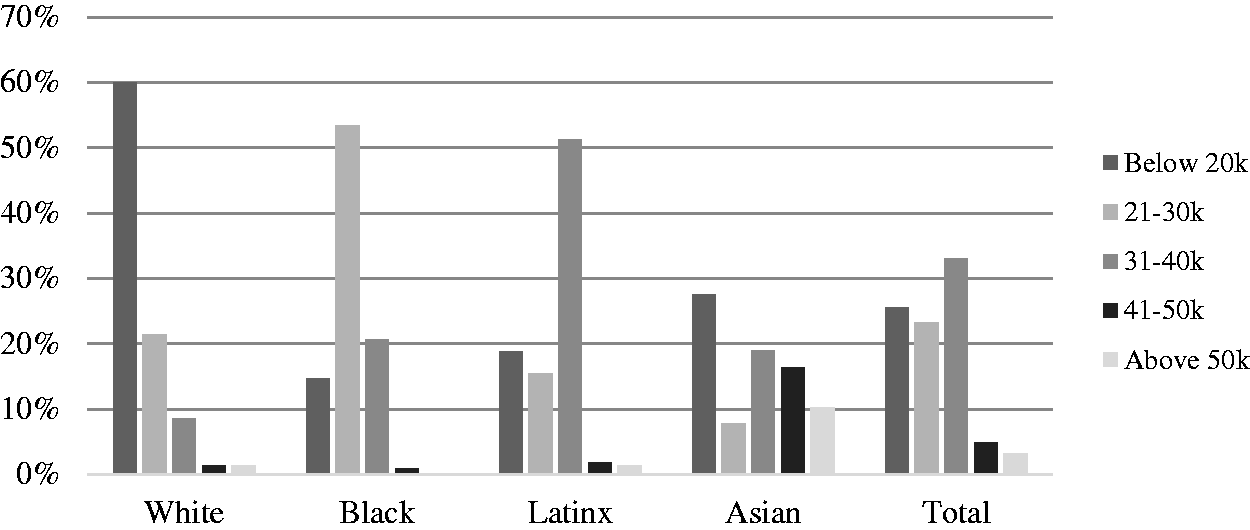
Percentage of Total Household Income in Each of Five Income Categories, Across All Students (n = 509) in the No-Racial/Ethnic Majority (NRM) Campus and Separately for Each of Four Racial/Ethnic Groups.
Are White and Asian students economically and socially marginalized in this setting? The economic risk factors operating in White and Asian groups might be expected to lower graduation rates at the NRM, at least relative to the NCES and NSC rates (Fuligni & Witkow, 2004; Kao & Thompson, 2003). Yet despite the socioeconomic disadvantages of White and Asian NRM students, their average graduation rates were similar to the national averages (as were REM NRM students). Additionally, unlike previous studies (DesJardins et al., 2002; Hu & St. John, 2001, Ishitani & DesJardins, 2003; Whalen et al., 2010), access to financial aid from public sources, such as grants or loans, did not affect graduation rates at the NRM. We conclude that low socioeconomic status among NRM students did not depress graduation rates.
Limitations and Directions for Future Research
Several limitations constrain our conclusions. First, since our primary analysis focused on a single NRM institution, we can only infer that the absence of a racial/ethnic majority contributed to successful college completion. In this regard, comparisons of graduation rates in the NRM with other large urban commuter-based institutions in New York City are instructive. For example, the two public baccalaureate institutions in Brooklyn, New York are distinct in both student populations and graduation rates: The one with no racial/ethnic majority (White 28.5%; Black 21.9%; Latinx 23.4%; Asian 21.0%), like the NRM studied here, reveals a relatively high graduation rate (54%), whereas the one primarily serving a single racial/ethnic minority population (White 1.4%; Black 73.4%; Latinx 17.9%; Asian 2.9%) reveals a substantially lower graduation rate (14%). The patterns, and those found in institutions with relatively high racial/ethnic diversity (see Table 4), are consistent with our thesis that the absence of a single racial/ethnic majority among the students contributes to improved college completion. Composition of the faculty, staff, and administrators in the NRM schools may further influence student success. To extend generalizability, future research must systematically investigate additional examples of NRM institutions and explore how diversity among faculty, staff, and administrators may contribute to a more equitable learning environment for students (Seidman, 2005).
Second, although linking the eight-year-old survey data to the current institutional data enabled us to observe final graduation rates, as opposed to retention rates, and investigate a wide range of factors, it hindered the comparison of outcomes with studies examining six-year graduation rates. Moreover, we did not evaluate our survey instrument's reliability or construct validity, relying instead on face validity, content validity, and ecological validity. Also, no specific method was used to assess or improve the internal consistency of the survey since each construct was evaluated with an individual item. Future studies are encouraged to implement standardized measures with established validity and reliability to allow researchers to compare the outcomes of different studies using the same measures. Finally, by collapsing survey responses from East, South, and Other Asian students (to align with the institutional data), we sacrificed an opportunity to observe each Asian subgroup separately. The same is true of Latinx subgroups. A separate analysis in future studies will enable researchers to identify differential risk factors to different subgroups.
Conclusions
Findings from the present study suggest that the academic success of REM college students may be significantly enhanced in educational settings where no single racial/ethnic majority exists. In this environment, risk factors affecting college completion may shift from traditional background variables to experiential variables such as perceived stress. Most encouraging was the finding that graduation rates in a student body residing in an economically underserved community were comparable to national averages.
Footnotes
Declaration of Conflicting Interests
The author(s) declared no potential conflicts of interest with respect to the research, authorship, and/or publication of this article.
Funding
The author(s) received no financial support for the research, authorship, and/or publication of this article.
Supplemental material
Supplemental material for this article is available online.