
Abstract
Objective
Connective tissue disease (CTD) encompasses a group of autoimmune disorders, with interstitial lung disease (ILD) being the most common form of pulmonary involvement. The primary focus of this study was to employ machine learning for the identification of blood-based biomarkers in individuals afflicted with CTD-ILD. Additionally, the study aimed to assess the potential association of these biomarkers with the likelihood of hospital readmissions and all-cause mortality within a 1-year period among CTD-ILD patients.
Methods
A total of 210 patients were included in the study, with 147 patients allocated to the training set and 63 patients assigned to the test set. Univariate logistic regression, LASSO regression, and multivariable logistic regression analyses were executed to discern the risk factors associated with readmission within 1 year among CTD-ILD. Logistic regression, support vector machine, and XGBoost were utilized to build the model. The global and local interpretation of the model was conducted using SHAP. The efficacy of model was evaluated using the ROC curve and DCA. Furthermore, the predictive values of inflammatory indicators were compared for their ability to forecast all-cause mortality in CTD-ILD patients.
Results
Low albumin levels, high CA125, and CYFRA 21-1 were identified as significant factors associated with patient readmissions. The XGBoost model demonstrated the highest efficacy in both the training and test sets, achieving an AUC of 0.857 (95% CI 0.832–0.879) and 0.788 (95% CI 0.706–0.833), respectively. SHAP analysis indicated that low albumin had the most significant impact on the model outcomes. Among the 1-year all-cause deaths of CTD-ILD patients, the neutrophil-to-lymphocyte ratio (NLR) was the most potent predictor in univariate analysis. A model combining albumin, CA125, and CYFRA 21-1 with NLR was constructed, achieving an AUC of 0.944 (95% CI 0.915–0.964).
Conclusion
Elevated levels of CA125, CYFRA 21-1, and NLR, along with lower albumin levels, were predictive of a poor prognosis in CTD-ILD patients.
Keywords
Introduction
Connective tissue diseases (CTDs) represent a group of systemic autoimmune disorders characterized by immune-mediated organ failure. 1 Interstitial lung disease (ILD) is a significant complication associated with CTD, occurring across various forms of CTD, including rheumatoid arthritis, scleroderma, systemic lupus erythematosus, polymyositis or dermatomyositis, Sjogren’s syndrome, and mixed connective tissue disease. ILD emerges in approximately 15% of CTD cases and is associated with a decreased quality of life and a higher mortality rate. The manifestations of CTD-ILD vary significantly, and patients with mild and stable conditions may not require treatment. Therefore, the early identification of patients with a poor prognosis is crucial for timely and effective intervention. 2
CTD-ILD is a heterogeneous condition with diverse clinical manifestations leading to varying outcomes. Some CTD-ILD patients exhibit long-term stability without the need for treatment and can be managed through regular follow-up without medication. 3 However, some patients with CTD-ILD may experience acute exacerbations, sudden ILD progression, and exhibit high mortality during or after these exacerbations, resulting in very low 1-year survival rates. 4 Therefore, it is crucial to identify CTD-ILD with varying prognoses. This informs the formulation of personalized therapeutic approaches and management protocols, ultimately enhancing overall patient outcomes and quality of life. A retrospective study by Chan et al. demonstrated that male gender, advanced age, smoking history, and usual interstitial pneumonia patterns are predictive of mortality and lung function decline in CTD-ILD patients. 5 Furthermore, previous studies have identified associations between vitamin D deficiency, red blood cell distribution width, elevated serum carcinoembryonic antigen (CEA), and carbohydrate antigen 19–9 (CA199) levels and the severity and poor prognosis of CTD-ILD.6–8 However, the majority of previous studies have relied on single predictors to forecast the prognosis of CTD-ILD patients, and there is a paucity of comprehensive models reported in the literature. Therefore, this paper employs a machine learning approach to construct a comprehensive model for predicting CTD-ILD readmission and all-cause mortality. By interpreting the machine learning model through SHapley Additive exPlanations (SHAP) analysis, this study aims to provide clinicians with better guidance for treatment and disease monitoring.
Materials and methods
Study population
CTD-ILD patients diagnosed and treated at Huzhou Central Hospital from January 2019 to October 2023 were enrolled in accordance with previously well-defined criteria. This retrospective observational study was approved by the Institutional Review Committee of Huzhou Central Hospital (202412007-01).
The baseline inclusion criteria were as follows: (1) In accordance with the ILD standards of the American Thoracic Society, the European Respiratory Society, the Japanese Respiratory Society, and the Latin American Thoracic Society (ATS/ERS/JRS/ALAT), patients diagnosed with CTD-ILD were included based on the American College of Rheumatology criteria for systemic sclerosis (SSc), rheumatoid arthritis (RA), Sjogren’s syndrome (SS), mixed connective tissue disease (MCTD), idiopathic inflammatory myopathy (IIM), and systemic lupus erythematosus (SLE); (2) During the hospitalization, the diagnosis was CTD-ILD. The baseline exclusion criteria were as follows: (1) Age younger than 18 years; (2) pregnancy; (3) lossing to follow-up; (4) incomplete clinical records.
Data collection
Demographic and laboratory data were collected from the charts of all patients included in the study. Detailed demographic and clinical characteristics were recorded, including age, sex, smoking history, hypertension, diabetes, extrapulmonary manifestations (joint pain, muscle pain, dry eyes and mouth), cough, and chest tightness. Laboratory results were extracted, including baseline complete blood count, albumin, clotting function, tumor markers, and autoimmune markers. Various inflammatory indicators were calculated, such as neutrophil-to-lymphocyte ratio (NLR) = neutrophil count/lymphocyte count, systemic immune-inflammation index (SII) = platelet count × neutrophil count/lymphocyte count, systemic inflammation response index (SIRI) = neutrophilcount × monocytecount/lymphocytecount, platelet-to-lymphocyte ratio (PLR) = platelet count/lymphocyte count, and pan-immune-inflammation value (PIV) = neutrophil count x monocyte count × platelet count/lymphocyte count. Enrolled patients using corticosteroids, conventional immunosuppressants, and antifibrotic drugs were recorded. Data on 1-year readmissionrates and all-cause mortality were also collected.
Statistical analysis
SPSS 26.0 (IBM) was employed for statistical analysis. The Kolmogorov-Smirnov test was utilized to verify the normality of the data. Normally distributed data are presented as the mean and standard deviation (SD), while non-normally distributed data are expressed as the median and the 25th percentile (Q1) to 75th percentile (Q3). Categorical variables are represented by count and frequency. Independent sample t tests and Mann-Whitney U tests were adopted to analyze the differences among continuous variables. Chi-square tests and Fisher exact tests were used to analyze the difference between binary variables. Since an excessive number of missing values might affect prediction accuracy, features with a missing value rate greater than 10% were removed. The missing data were supplemented and completed through regression-based imputation, and the results were combined. A total of 210 patients were included and randomly partitioned into a training set (70%) and a test set (30%) using R software with a fixed random seed to ensure reproducible results. Two logistic analyses were divided into two steps: (1) univariate logistic regression for each potential influencing factor was conducted; (2) influencing factors with p < 0.05 in univariate analysis were included in a multivariate logistic analysis. The construction and evaluation of machine learning models were carried out using the following software packages: The Extreme gradient boosting (XGBoost) model was implemented using the xgboost package (version 1.7.8.1); the support vector machine (SVM) analysis was completed using the e1071 package (version 1.7.14); Logistic regression (LR) was applied using R (version 4.4.1). The interpretability analysis of the models adopted the SHAP (SHapley Additive exPlanations) method, and the shapviz package (version 0.9.3) was used to calculate and visualize feature importance. The model was assessed using calibration curves with a bootstrap resampling method (bootstrap = 1000). To assess the clinical utility and practicality, decision curve analysis (DCA) curves were generated for the XGBoost model. Figure 1 depicts the study design and analysis planning process. A p value <0.05 was regarded as statistically significant. Flow diagram. CTD-ILD, Connective tissue disease-associated interstitial lung disease; LR, Logistic regression; SVM, support vector machine; XGBoost, extreme gradient boosting; SHAP, SHapley Additive explanations.
Results
Demographic and clinical characteristics of CTD-ILD patients
Clinical characteristics of CTD-ILD patients.

CRP, C-reactive protein; WBC,White blood cell count; SII, systemic immune-inflammation index; SIRI, systemic inflammation response index; PIV, pan-immune-inflammation value; PLR, platelet-to-lymphocyte ratio; NLR, neutrophil-to-lymphocyte ratio; CA125, carbohydrate antigen 125; CA15-3, carbohydrate antigen 15-3; CA72-4, carbohydrate antigen 72-4; CA19-9, carbohydrate antigen 19-9; NSE, Neuron-specific enolase; SCC, Squamous cell carcinoma associated antigen; AFP, alpha-fetoprotein; CEA, Carcinoembryonic antigen.
Data are presented as means (SD), numbers (%) or median (Interquartile Range).
aMann-Whitney U test.
bChi-square test.
cExtrapulmonary symptoms: joint pain, muscle pain, dry eyes and mouth.
dIndependent sample t test.
Elevated inflammatory and tumor markers with decreased albumin levels in CTD-ILD readmissions
The levels of inflammatory markers in CTD-ILD readmitted patients were significantly higher than those in the non-readmitted group, such as SII, SIRI, PLR, and NLR (p < 0.05). CA125, cytokeratin 19 fragment (CYFRA 21-1), ferritin, squamous cell carcinoma associated antigen (SCC), and CEA (p ≤ 0.001) were higher in readmitted patients than in non-readmitted patients. Simultaneously, albumin (p < 0.001) was significantly lower than in non-readmitted patients (Supplemental Figure 1). Univariate analysis was carried out on the relevant indicators included. Inflammatory markers and tumor markers were significantly higher and albumin levels were significantly lower in the readmission group (p < 0.05) (Supplemental Table 2). The results imply that inflammatory markers, tumor markers, and albumin might be potentially promising biomarkers for readmission to CTD-ILD.
Risk factors of CTD-ILD readmission and multiple machine learning models
Using univariate logistic regression analysis, 19 potential risk factors associated with readmission (p < 0.05) were identified. Using multivariate logistic regression and the backward elimination method to further screen out valuable variables from the above risk factors, the results showed that albumin (OR = 0.8, p < 0.001), CA125 (OR = 1.01, p = 0.019), and CYFRA 21-1 (OR = 1.26, p = 0.014) had the strongest correlation with readmission in patients with CTD-ILD. To further validate our findings from the linear regression analysis, we utilized Least absolute shrinkage and selection operator (LASSO) repeat variable selection, which yielded very similar variables, namely albumin, CA125, CYFRA 21-1, and age (Figure 2). Receiver Operating Characteristic (ROC) curve analysis indicated that the critical value of albumin was 31.75, the sensitivity was 83.0%, and the specificity was 70.7%. The AUCs of CA125 and CYFRA 21-1 were 0.680 (95% CI 0.571–0.789) and 0.697 (95% CI 0.596–0.798), respectively (Table 2). Albumin, CA125, and CYFRA 21-1 were incorporated into the LR, SVM, and XGBoost machine learning models. The AUC of the training set was 0.827 (95% CI 0.805–0.836), AUC = 0.826 (95% CI 0.771–0.856), and AUC = 0.857 (95% CI 0.832–0.879), respectively. The AUC of the test set was 0.702 (95% CI 0.564–0.742), 0.733 (95% CI 0.589–0.858), and 0.788 (95% CI 0.706–0.833), respectively (Figure 2). ROC analysis demonstrated that the best-performing model in both the training set and the test set was XGBoost, with an AUC of 0.857 and 0.788. The specificity and sensitivity of the training set were 75.61% and 90.57%, signifying excellent efficiency in distinguishing between patients readmitted and non-readmitted within 1 year. The Hosmer–Lemeshow test showed that the LR, SVM model fit well (p > 0.05) (Figure 2(e)). As depicted in Figure 2(g), within the threshold probability range of 0.1 to 0.9, the net benefit derived from the DCA demonstrates a notable enhancement. This finding underscores the favorable clinical application potential of decision curve analysis. LASSO regression and machine learning approaches. The predictive power of multiple biomarkers in predicting readmission in CTD-ILD patients. Sen, sensitivity; Spe, specificity; CA125, carbohydrate antigen 125; CYFRA 21-1, Cytokeratin 19 fragment. p Value indicates that the AUC of each indicator has statistical significance.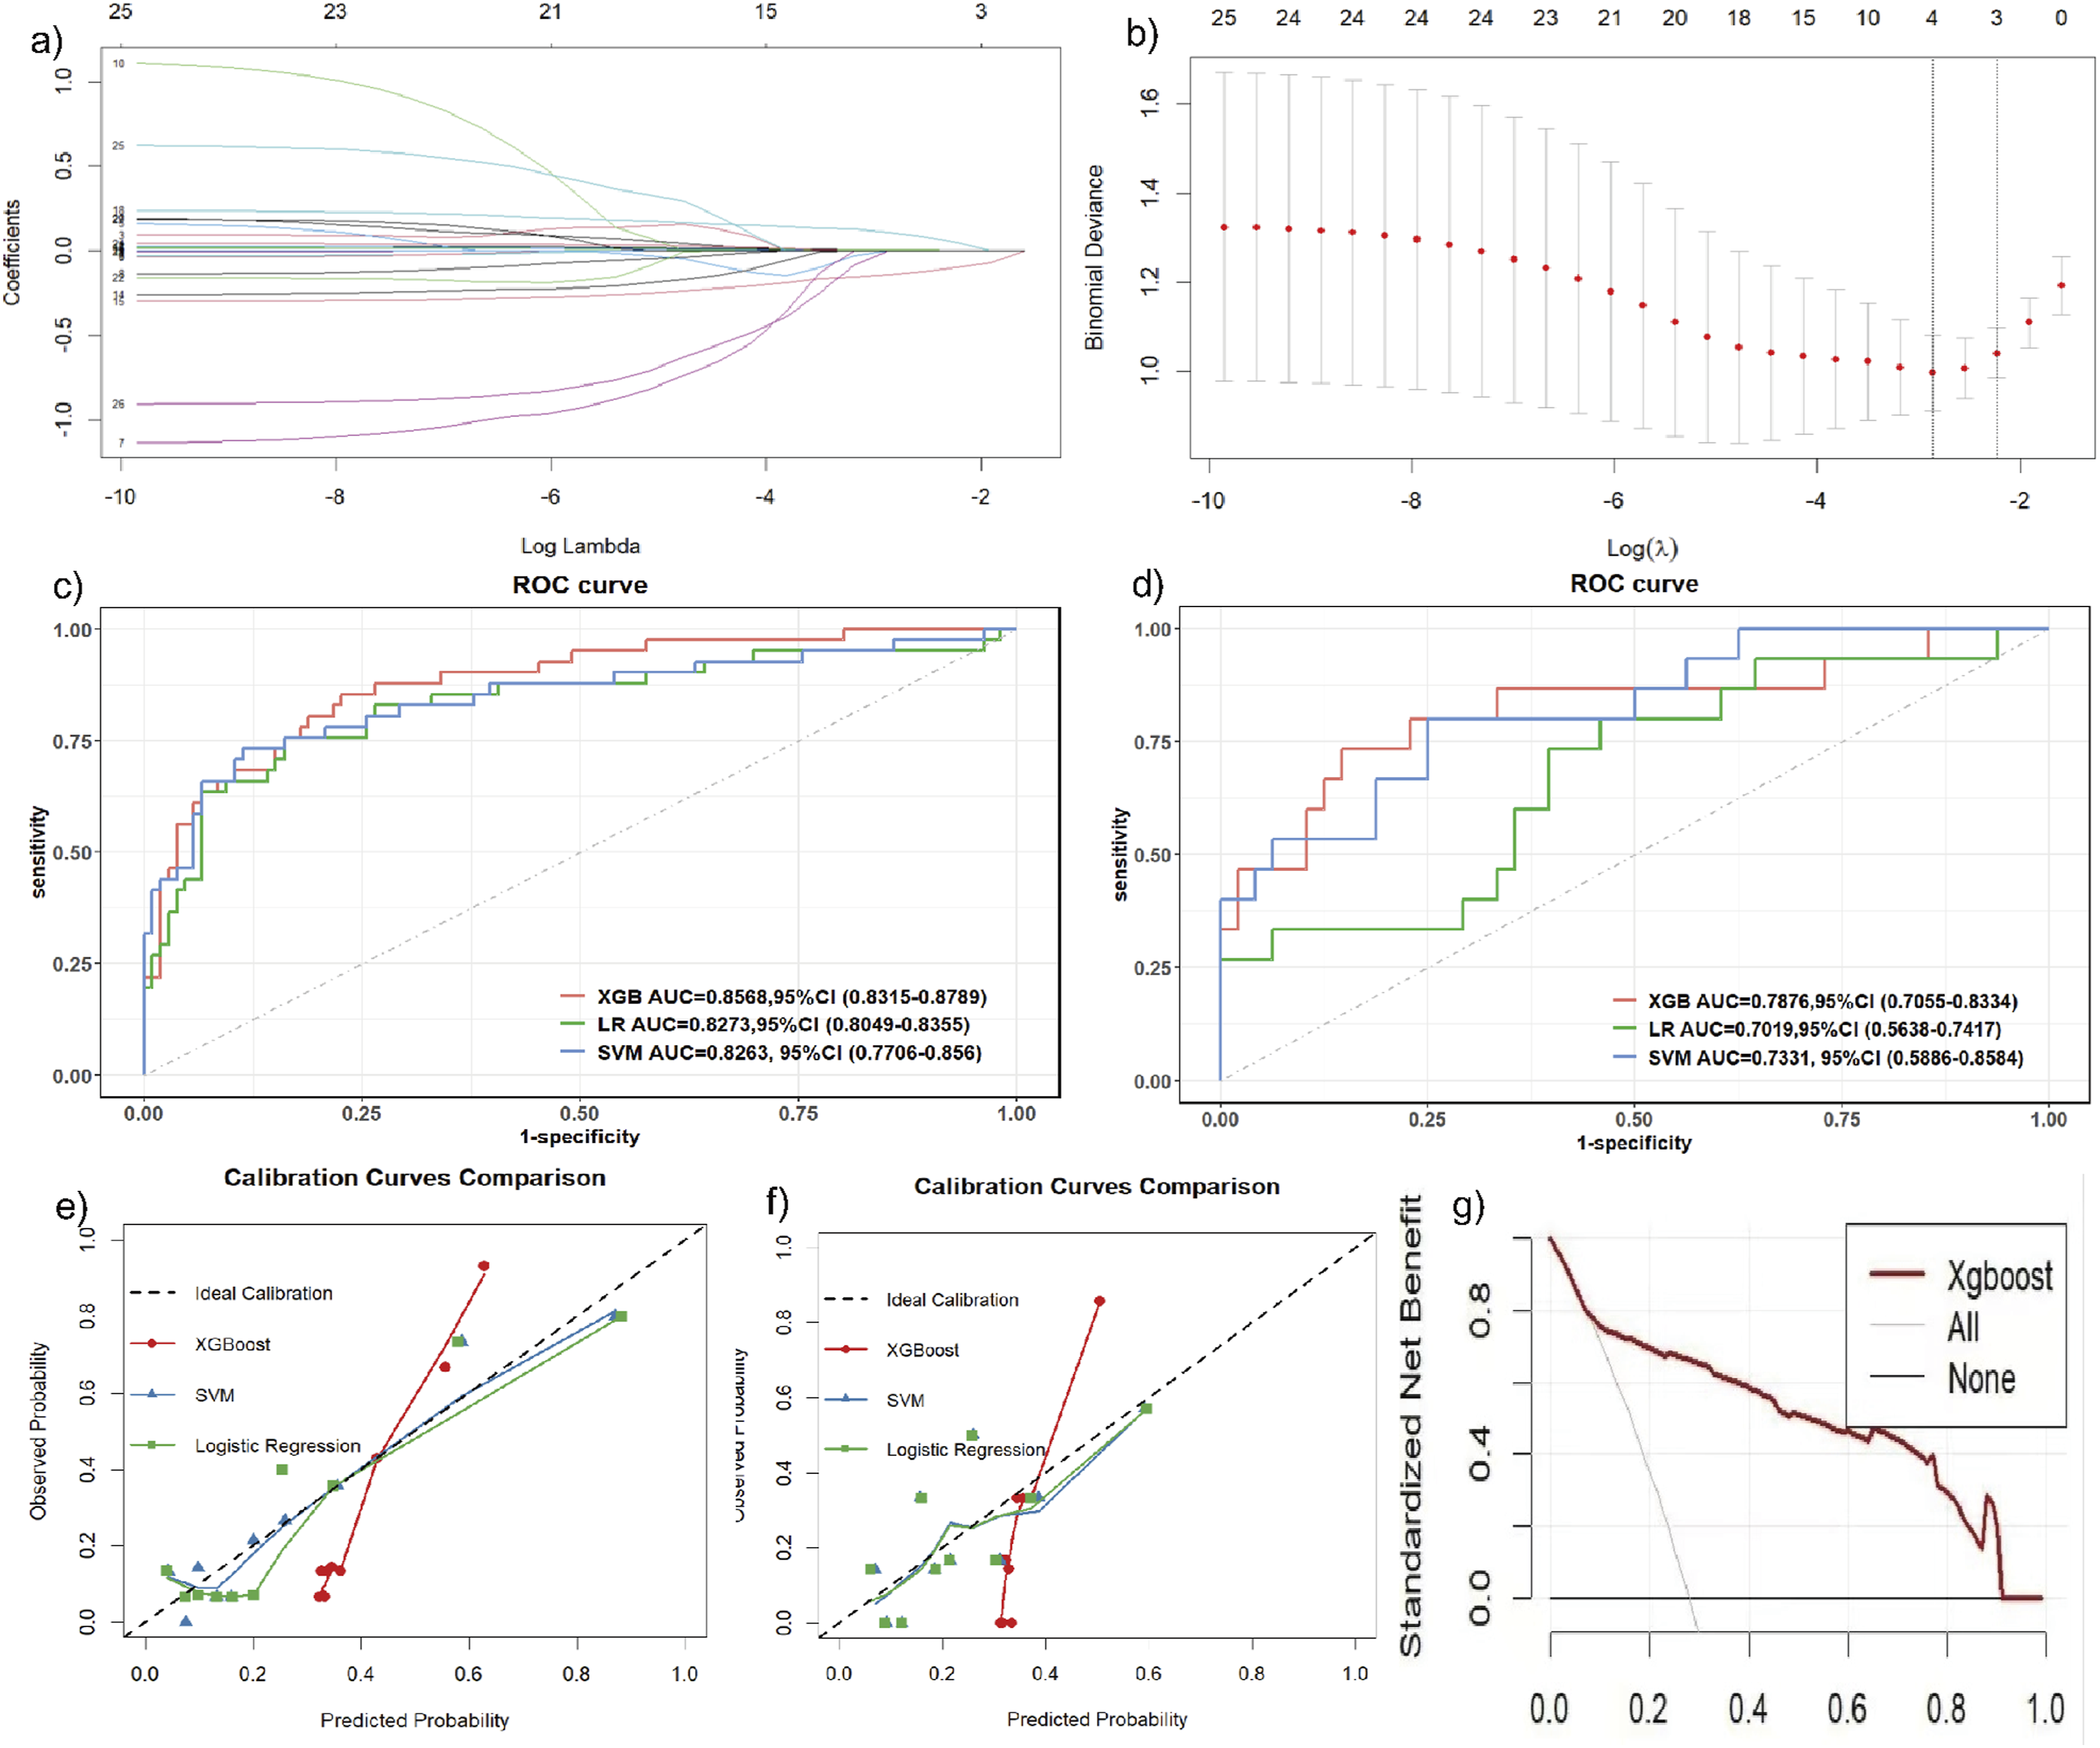

Interpretable machine learning models
This study evaluated the relative significance of various factors influencing the susceptibility of readmission in CTD-ILD patients after diagnosis. Figure 3(a) visually presents this ranking, with each point representing a sample and the color gradient ranging from purple to red indicating the magnitude of the sample’s feature values. The vertical axis depicts the importance ranking of the features, as well as the correlation and distribution of each feature value to the SHAP value. Specifically, elevated CA125 and CYFRA 21-1 levels contributed positively to the predicted results, while high albumin levels had a negative impact on the output of the model. Figure 3(c) shows the hierarchical significance of features in the XGBoost model. The vertical axis presents each feature in descending order of importance, while the horizontal axis shows the average SHAP value. The analysis indicated that albumin was the top feature, suggesting that low albumin strongly influenced the model’s predictions. Figure 3 displays the influence of individual risk factors on the model. Notably, when albumin levels fell below approximately 31.75 g/L, the risk of readmission escalated dramatically among CTD-ILD patients. Moreover, an elevation in CA125 and CYFRA 21-1 levels was associated with an increased risk of readmission. By visualizing the SHAP values for these samples, we can discern the impact of each feature on the model’s predictions for these specific instances. Interpretability analysis of XGBoost model.
Elevated all-cause mortality inflammatory factors
The characteristics of all included patients (171 alive within 1 year and 22 all-cause deaths within 1 year) are presented in Supplemental Table 3. The levels of various inflammatory factors in all-cause deaths within 1 year among CTD-ILD patients were significantly higher than those in non-death patients, such as SII [(549.54) versus (2553.10), p < 0.001], SIRI [(1.27) versus (2.77), p < 0.001], PIV [(218.79) versus (700.81), p = 0.003], PLR [(146.67) versus (290.00), p < 0.001], and NLR [(3.11) versus (13.50), p < 0.001]. Based on the AUC value, SII (AUC = 0.813), SIRI (AUC = 0.732), PIV (AUC = 0.696), PLR (AUC = 0.825), and NLR (AUC = 0.831) indicated that NLR had the highest predictive efficacy for all-cause death in CTD-ILD patients (Supplemental Table 4).
All-cause mortality model
In this study, four significant risk factors, namely NLR, CA125, CYFRA 21-1, and albumin, were integrated, and XGBoost machine learning was employed to construct an all-cause death model (AUC = 0.944 (95% CI 0.915–0.964)) (Figure 4(a)). Additionally, SHAP visualization was utilized to visually assess the risk of all-cause death 1 year after diagnosis in CTD-ILD patients. The results imply that the higher risk of all-cause death is mainly driven by the following characteristics: albumin and NLR. Particularly, the asymmetric distribution (positive and negative) of SHAP values for albumin, NLR, CA125, and CYFRA 21-1 also indicates a nonlinear relationship between these measures and CTD-ILD (Figure 4(b)). Interpretability analysis of XGBoost model for All-Cause Mortality.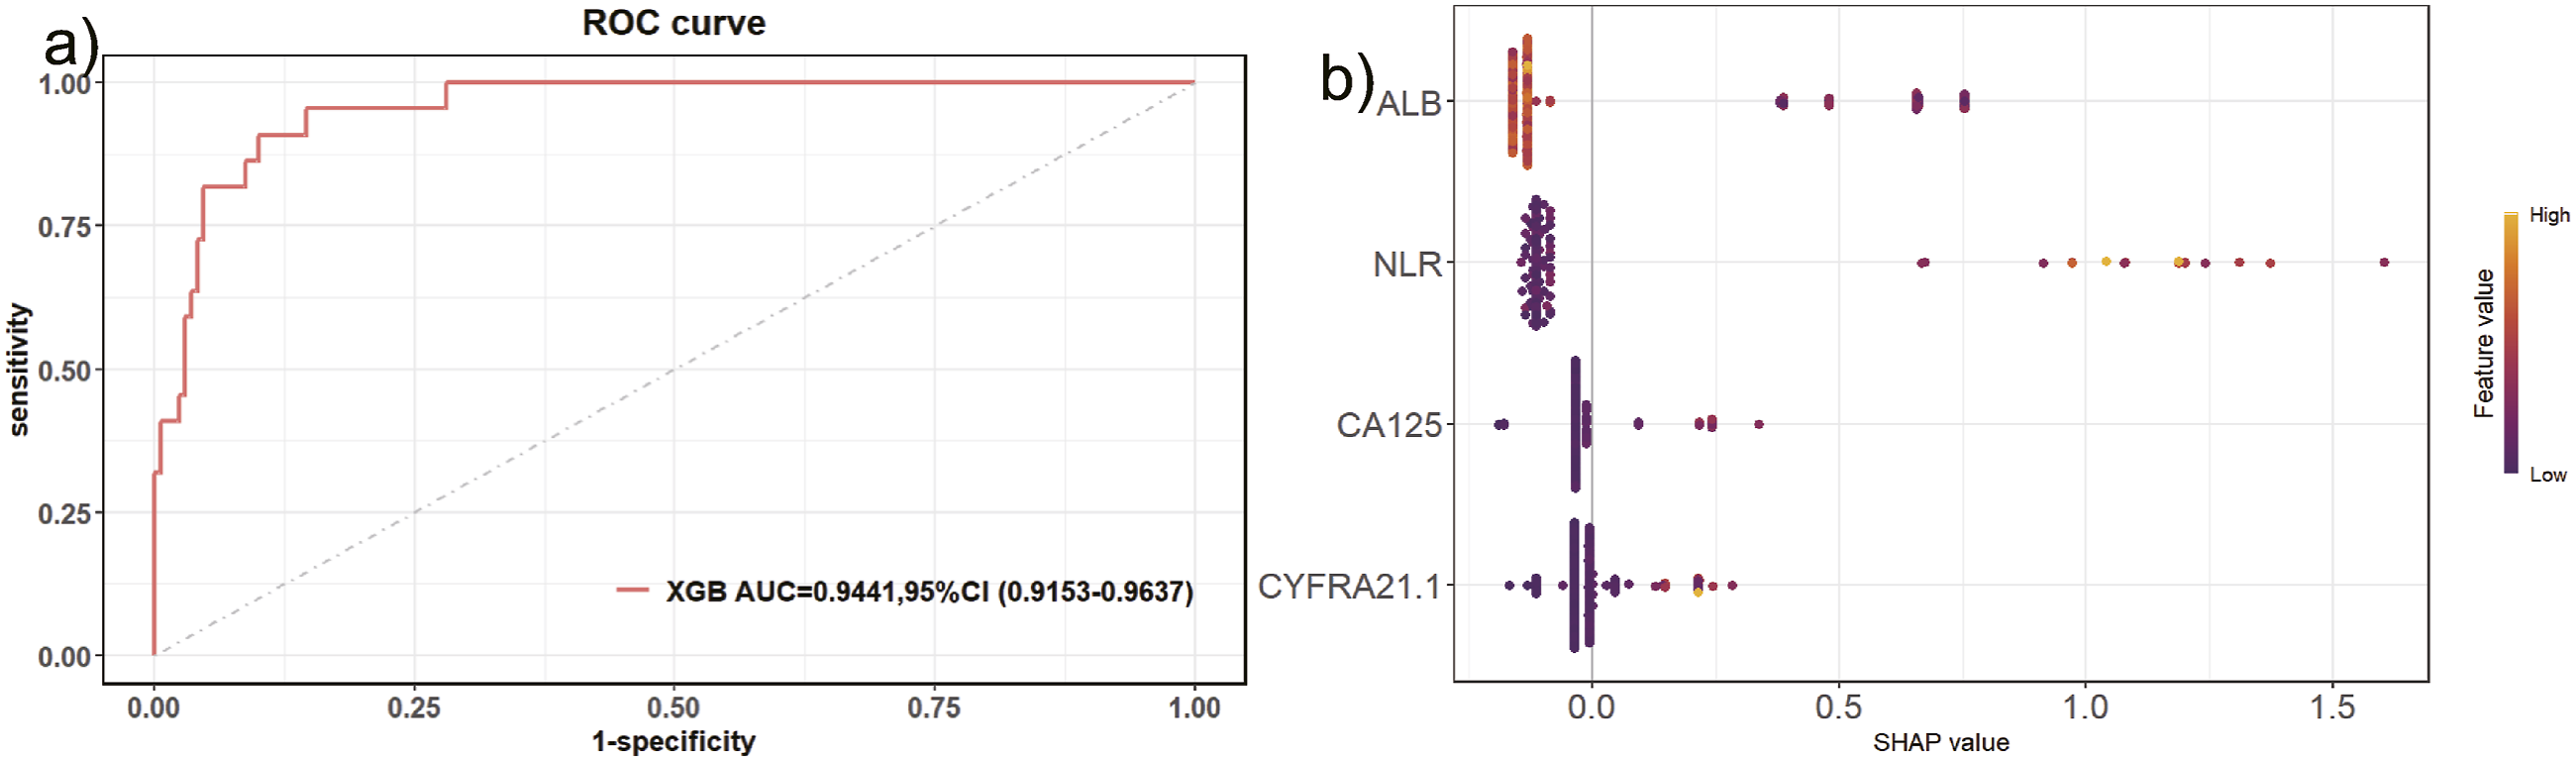
Discussion
This study aimed to explore the risk factors of readmission and all-cause death within 1 year of diagnosis in CTD-ILD patients based on serum biomarkers. A predictive readmission model was developed using the XGBoost algorithm, which effectively estimates the probability of readmission in CTD-ILD patients within 1 year of diagnosis. Through meticulous feature selection and multi-model comparison validation, this study highlights the significance of various key risk factors and offers a valuable tool to assist clinical decision-making.
Our study revealed that albumin levels are associated with 1-year readmission and all-cause death in CTD-ILD patients (OR = 0.740, p < 0.001; OR = 0.699, p < 0.001). Lower albumin levels indicate a poorer prognosis for these patients. This aligns with findings by Chen et al., who observed that in patients with primary Sjogren’s syndrome-associated interstitial lung disease, a continuous decrease in albumin was associated with the continuous progression of lung disease. 9 Additionally, low albumin levels have been linked to the incidence of CTD-ILD. 10 Consistent with our results, Lee et al. and Sun et al. demonstrated that low albumin is associated with mortality in CTD-ILD patients.11,12 Albumin acts as a protective factor by inhibiting endothelial cell apoptosis and possessing antioxidant and free radical scavenging properties. In ILD, excessive production of cytokines and inflammatory mediators leads to albumin loss, which may weaken its protective effects and activate fibroblasts, thereby exacerbating pulmonary fibrosis and leading to worse outcomes.13,14 Furthermore, in chronic diseases, inflammation causes albumin loss, contributing to poorer outcomes. Previous studies have shown that low albumin levels are associated with increased mortality or severity in various respiratory diseases.15–17 Tumor markers, currently used in cancer screening and as tools to monitor treatment effect and recurrence, can also be elevated in benign diseases. 18 Their serum concentrations are derived from proliferating epithelial cells and are not specific to any particular organ or system.19,20 Our study found that elevated levels of tumor markers (CA125 and CYFRA 21-1) were associated with readmission and all-cause death within 1 year in CTD-ILD patients. Previous studies have demonstrated that tumor markers are significantly higher in patients with CTD-ILD compared to those without ILD, and these markers are strongly associated with the severity and prognosis of CTD-ILD, consistent with our findings.8,21–23 The exact cause of elevated tumor marker levels remains unclear. A large multicenter sample study indicated that CA125 reflects the proliferation and secretion of epithelial cells and is a marker of epithelial injury. 24 The increase in CA125 may be related to persistent injury, excessive repair, epithelial apoptosis, and the formation of fibroblast lesions in the pathogenesis of ILD. 25 Adegunsoye et al. found that after treatment with antifibrotic therapy (AF), the CA125 concentration in Idiopathic pulmonary fibrosis (IPF) patients remained stable. 26 CYFRA 21-1, a cleavage fragment of keratin CK19, is located in the proliferative epithelium of ILD lung tissue. CYFRA 21-1, a marker of epithelial damage and turnover, is more widely expressed in epithelial cell types in IPF lung than CA125. Additionally, CYFRA 21-1 is expressed in epithelium overlying fibroblastic foci and may therefore provide an indirect marker of profusion of fibroblastic foci. 27
The SII, SIRI, PIV, PLR, and NLR are subclinical markers of inflammation. Numerous studies have found that these inflammatory markers are elevated in pulmonary disorders such as chronic obstructive pulmonary disease and cancer. Ruta et al. evaluated the SII and NLR indices in a group of CTD-ILD patients and found that they were associated with lung involvement in CTD-ILD. 28 In our study, we calculated several inflammatory factors, including SII, SIRI, PIV, PLR, and NLR, and observed that these factors were elevated in CTD-ILD patients who experienced readmission and all-cause death within 1 year. NLR was the most optimal predictor of all-cause death, with a cut-off value of 6 (AUC = 0.831). The combination of NLR with albumin and CA125, CYFRA 21-1 to construct a XGBoost model can assist in clinically determining the disease status of patients. Inflammation induces an increase in neutrophils, accompanied by a decrease in lymphocyte count. 29 Neutrophils release proteolytic enzymes and free radicals, causing structural changes and unpredictable local lesions. 30 Peripheral blood lymphocytopenia may also be attributed to lymphocyte migration to the lungs to participate in local immune responses. 31 Xing et al. found that patients with CTD-ILD presented a higher level of NLR and SII than those with CTD. 32 Watase et al. analyzed the alveolar lavage fluid of ILD patients and discovered that the NLR value was higher in the alveolar lavage fluid of patients with poor lung progression and prognosis. 33 The NLR, derived from routine blood tests, serves as a cost-effective and readily accessible indicator of chronic inflammation. In patients with connective tissue disease, the NLR value parallels the prognostic significance of CRP. 34 However, while elevations in CRP typically occur later in the disease course, increases in NLR often manifest earlier. An elevated NLR serves as an indicator of potential pulmonary interstitial involvement and a heightened risk of subsequent mortality.
We identified albumin, CA125, and CYFRA 21-1 as the most valuable biomarkers in predicting readmissions among CTD-ILD patients through univariate and multivariable regression analyses, as well as LASSO regression. Additionally, NLR and other serum biomarkers were found to be significant risk factors of all-cause mortality. These four biomarkers are likely involved in the pathogenesis and progression of CTD-ILD. Prior research has demonstrated that low albumin levels, tumor markers, and the NLR are correlated with the prognosis of patients suffering from interstitial lung disease (ILD) without connective tissue disease.24,33,35 The presence of low protein levels suggests a link between nutritional status and the prognosis of ILD. 35 Despite the growing body of research in this area, the findings have yet to reach a consensus. There is still a lack of clarity regarding which biomarkers offer the most robust evidence for predicting the prognosis of ILD patients. Further investigation is required to elucidate this critical issue. To enhance predictive capabilities, we integrated these biomarkers to construct a machine learning model and visualized the model’s performance using SHAP analysis. Furthermore, continuous monitoring of biomarkers can effectively mirror the disease activity and progression of CTD-ILD. Álvarez and colleagues showed that Krebs von den Lungen-6 (KL-6) is capable of offering valuable insights into the disease activity, progression, and the response to intervention strategies in CTD-ILD. 36 Although the model relies on blood parameter measurements and offers advantages of repeatability and ease of access, it is equally important to consider pulmonary HRCT imaging and pulmonary function assessments. Radiomics features have demonstrated their utility in evaluating the severity of CTD – ILD and guiding treatment decisions. Meanwhile, biological markers can offer information for predicting the outcomes of radiological examinations.37,38 We plan to incorporate pulmonary function and pulmonary HRCT data into combined models to improve prognostic accuracy for CTD-ILD patients. Despite the model’s logical structure and ease of application, it has certain limitations. In this study, our hospital did not conduct KL-6 monitoring, leading to the absence of KL-6 data. Therefore, we opted to predict patient prognosis using more commonly available serological markers, which makes the modified model more suitable for implementation in primary care hospitals. The generalizability of our study results may be limited by the small sample size, which might have reduced the statistical power of the study. Larger-scale cohort studies are required in the future to validate these findings. This was a single-centre study with a relatively focused population and only inpatients in the our hospital were included, but not all outpatients were included, and the sample was not completely representative. Moreover, this study failed to explore whether inadequate immunosuppressive therapy could result in alterations in biomarkers. Therefore, prospective studies in larger cohorts and the incorporation of imaging data are necessary to validate the predictive value of the model.
Conclusion
In summary, the objective of this study was to identify novel non-invasive markers indicative of a poor prognosis in CTD-ILD, thereby aiding in the early assessment and management of the disease. Our findings demonstrated that CA125, CYFRA 21-1, albumin, and inflammatory factors were strongly associated with 1-year readmissions and all-cause mortality in CTD-ILD patients. Furthermore, we constructed interpretable machine learning models to assist in clinical decision-making and treatment planning.
Supplemental Material
Supplemental Material - Connective tissue disease-associated interstitial lung disease risk of readmission and all-cause mortality: Interpretable machine learning approach
Supplemental Material for Connective tissue disease-associated interstitial lung disease risk of readmission and all-cause mortality: Interpretable machine learning approach by Boyi Chen, Xixian Hu, Xuefei Shi, Bin Wang in Chronic Respiratory Disease.
Footnotes
Acknowledgments
We apologized to all researchers whose relevant contributions were notcited due to space limitations.
Ethical considerations
The study was approved by the Ethics Committee of our institution (202412007-01), and all patients provided written informed consent before inclusion. This study was conducted in accordance with the amended Declaration of Helsinki.
Author contributions
CBY and HXX retrieved the related literature and drafted the manuscript. WB and SXF participated in the design of the review and drafted the manuscript.
Funding
The authors disclosed receipt of the following financial support for the research, authorship, and/or publication of this article: This work was supported by grants from the Project of Zhejiang Basic Public Benefit Research of Zhejiang Province (NO. WKJ-ZJ-2556 to WB), The National Natural Science Foundation of Zhejiang (NO. LY22H160038 to SXF), and The Project of Huzhou Basic Public Benefit Research (NO. 2021GZ68 to SXF).
Declaration of conflicting interests
The authors declared no potential conflicts of interest with respect to the research, authorship, and/or publication of this article.
Supplemental Material
Supplemental material for this article is available online.
Appendix
References
Supplementary Material
Please find the following supplemental material available below.
For Open Access articles published under a Creative Commons License, all supplemental material carries the same license as the article it is associated with.
For non-Open Access articles published, all supplemental material carries a non-exclusive license, and permission requests for re-use of supplemental material or any part of supplemental material shall be sent directly to the copyright owner as specified in the copyright notice associated with the article.