
Abstract
Introduction
Chronic obstructive pulmonary disease (COPD), asthma, and interstitial lung diseases (ILDs) are among the most prevalent respiratory conditions necessitating precise diagnostic and monitoring approaches. 1 Pulmonary function tests (PFTs), including spirometry, plethysmography, and diffusing capacity of the lungs for carbon monoxide (DLCO) assessment, serve as pivotal tools in this regard.2,3 PFTs are crucial not only for diagnosis, but also for assessing disease severity and monitoring its progression.2,3 Therefore, it is crucial that the PFT parameters are of reliable quality and that the interpretation is based on the latest available scientific data and guidelines.
The interpretation of PFT results relies heavily on guidelines established by esteemed organizations (e.g.; American Thoracic Society (ATS), European Respiratory Society (ERS)).4,5 These guidelines undergo periodic revisions to integrate the latest advancements in respiratory medicine. Notably, the 2005 ERS/ATS guidelines 5 were substantially updated in 2022. 4 This update is important, emphasizing the need for healthcare professionals to adjust their practices accordingly and integrate the changes into their daily routines. 6 In clinical practice, and some years after the publication of the ERS/ATS update, 4 there are still a number of issues that pose uncertainty7,8 and therefore need to be clarified. On August 29, 2024, to the best of the authors’ knowledge, among the 474 papers that cited the ERS/ATS update 4 as a reference (source: Scopus), only 11 papers8–18—all written as letters, editorials, or short communications—criticized the guideline. 4
The primary aim of this review was to offer a comprehensive framework for interpreting PFTs, including spirometry, plethysmography, and DLCO assessment, incorporating the latest ERS/ATS update. 4 The secondary aim was to briefly explore and discuss some complex cases to shed light on their implications for understanding PFTs.
What is measured through routine pulmonary function tests?
Spirometry, plethysmography, and DLCO are techniques used to determine various parameters, such as bronchial flow rates, lung volumes, lung capacities, and DLCO.19–25 The technical aspects19–21 and international norms22–25 for these PFTs have been extensively detailed in previous publications.19–28
Main measured/determined parameters during spirometry, plethysmography, and carbon monoxide diffusion capacity (DLCO).

How to interpret pulmonary function tests’ parameters?
Before starting the interpretation of PFTs, it is essential to ensure that the measurements conform to the technical quality requirements during their execution.19–21,27–31 This step, extensively described in previous publications,19–22,27–31 ensures that the interpreted results genuinely reflect the patient’s pulmonary function. Consequently, PFTs of lower quality should be handled with caution as they may not provide an accurate depiction of ventilatory impairments (VIs). 29
The interpretation of PFT parameters can be summarized into five steps32,33: (i) Comparison of the determined parameters to those observed in an appropriate reference population.22–25 This step helps determine if the functional parameter is low, normal, or high.32,33 (ii) Identification of potential VIs, such as obstructive (OVI) and/or restrictive (RVI) ones, commonly observed in certain chronic respiratory or extra-respiratory conditions.32,33 (iii) Assessment of the severity of the identified VI or low DLCO.32,33 (iv) Evaluation of the response to bronchodilator testing, if performed.32,33 (v) If previous PFT results are on record, detection of any notable changes in specific parameters over time by comparing current findings with past ones.32,33
Step 1: comparing determined ventilatory parameters to norms and the place of race and ethnicity in PFT interpretation
In the absence of a specific intra-individual reference point, it is necessary to compare the determined parameters with the reference values established using standards (i.e.; norms).22–25,34 These norms are derived from the results of PFTs performed on a large and representative sample of the general population with anthropometric, ethnic, socioeconomic, and environmental characteristics similar to those of the patient undergoing PFTs.22–25
In general, the normal range is defined as the range of values encompassing 90% of the healthy population.22–25,32,33 Thus, the lower limit of normal (LLN) corresponds to the value below which 5% of the healthy population is located, and conversely for the upper limit of normal.32,33 The Global lung function initiative (GLI) published norms for spirometric parameters (GLI-2012), 22 DLCO (GLI-2017), 24 and static lung volumes (SLVs) (GLI-2021). 25
Historically, lung function was assessed using race-specific reference equations, which assumed that differences in lung function were due to variations in thoracic cavity size among racial and ethnic groups. 23 However, this method overlooked the impact of environmental and social factors, potentially disadvantaging marginalized populations. 23 In response to new evidence questioning the use of race-specific norms for the interpretation of lung function, the GLI created race-neutral norms (GLI-2023-Global), which do not require race/ethnicity as an input in spirometry interpretation. 23 The GLI-2023-Global norms were derived from the same data as the GLI-2012 norms, 22 but applied inverse probability weights so that each racial and ethnic group contributes equally to the predicted values. According to the ERS, the GLI-2023-Global norms, 23 designed to encompass the broad range of lung function across populations, should be applied with careful consideration of an individual’s symptoms and medical history, particularly in clinical, employment, and insurance contexts. Several scholarly societies recommended these standards when interpreting PFTs parameters.22–25 Bowerman et al. 23 have reanalyzed existing data (i.e.; national health and nutrition examination survey III data; n = 6984 Mexican American, non-Hispanic White, and non-Hispanic Black participants) to develop a race-neutral norm, considering factors like sitting height and the Cormic index. The authors suggested that a single global spirometry norm could more accurately reflect lung function across diverse populations, though careful consideration of individual patient histories remains crucial for clinical decisions. 23 In April 2023, the ATS issued an official statement 26 recommending the use of the aforementioned norms for PFT interpretation, in order to improve accuracy and reduce potential harms, such as delayed diagnoses or inappropriate clinical decisions. The statement highlights the need for further research and education to understand the impact of this shift, emphasizing that race should not be used to infer biological characteristics. 26 The transition to race-neutral norms 23 requires careful consideration, particularly in clinical, employment, and insurance contexts, to avoid unintended consequence.
One of the main advantages of the GLI norms22–25 is the possibility of standardizing the reporting and interpretation of PFTs. 35 Indeed, the GLI norms22–25 are consistent with each other, which allows for a single set of PFT equations, thus avoiding discordant results between different PFTs and potential errors in the classification of physiological phenotypes. 9 This is not the case for the ATS new norms.23,26
The GLI equations include the largest samples of healthy individuals and represent a single standard for comparing observed measurements, applicable at all ages.22–25 The use of GLI norms22–25 involves the calculation of a z-score for each of the PFT parameters.24,33,36 The z-score indicates how much a measurement deviates from its predicted value, and 90% of healthy individuals have a z-score between −1.645 and +1.645.22,25,37 The z-score has the advantage of being free of any bias related to age, height, sex, or ethnic group, and it also facilitates the interpretation of PFTs.22–25 The algorithms and software for the GLI equations22–25 are freely available from two websites (i.e.; https://www.lungfunction.org, https://gli-calculator.ersnet.org/). To obtain race-neutral spirometry estimates using GLI-Global norms, 23 clinician are requested to select “race-neutral” in the spirometry section on the GLI websites.
In clinical practice, one challenge arises when interpreting PFT parameters in individuals over the age of 80 years. 25 For this specific population, while spirometric norms are available, 22 norms for SLVs are lacking. 25 In the elderly population, the ERS/ATS 4 provides the following two options (which are difficult to apply in routine clinical practice) for interpreting SLVs:
In summary, a parameter is considered ‘low’ if its z-score is less than −1.645 and considered ‘high’ if its z-score is greater than +1.645.4,33
Step 2: identifying ventilatory impairments
This step involves comparing the determined parameters with the distinctive thresholds of the main VIs observed in respiratory diseases (e.g.; OVI, RVI, mixed VI (MVI), non-specific pattern (NSP), preserved ratio impaired spirometry (PRISm)). Some of these VIs can be objectified by spirometry (Figure 1), while others require the determination of SLVs and therefore the use of plethysmography (Figure 2).4,6 The analysis of the flow-volume curve aspects for spirometry and the specific resistance loops for plethysmography is a crucial step in the interpretation of PFTs, as this analysis allows the evocation of specific VIs.6,32 These aspects/loops have been detailed in previous publications.5,20,32 In the following paragraphs concerning the interpretation of spirometry, plethysmography, and DLCO, the terms “low,” “normal,” and “high” correspond to z-scores of the parameters concerned, respectively, “<−1.645,” between “−1.645” and “+1.645,” and “>+1.645.” Spirometry: algorithm of interpretation (figure A), classification of impairment severity (figure B), and interpretation of dysanapsis (figure C). FEV1: Forced expiratory volume in 1 s. FVC: forced vital capacity. Notes: ✓ Low: z-score <−1.645. ✓ Normal: z-score: −1.645 ≤ Z ≤+ 1.645. ✓ Figure 1C (Cells D
1
and D
2
): “no” means “not to be performed” and “Yes” means “to be performed.” Static lung volumes: algorithm of interpretation. C-RVI: complex RVI. FEV1: forced expiratory volume in 1 s. FVC: forced vital capacity; LH: lung hyperinflation; LL: large lungs; MVI: mixed ventilatory impairment; RV: residual volume; S-RVI: simple RVI; TLC: total lung capacity; Z: z-score. Notes: ✓ Low: z-score <−1.645. ✓ Normal: −1.645 ≤ z-score ≤+ 1.645. ✓ High: z-score >+1.645.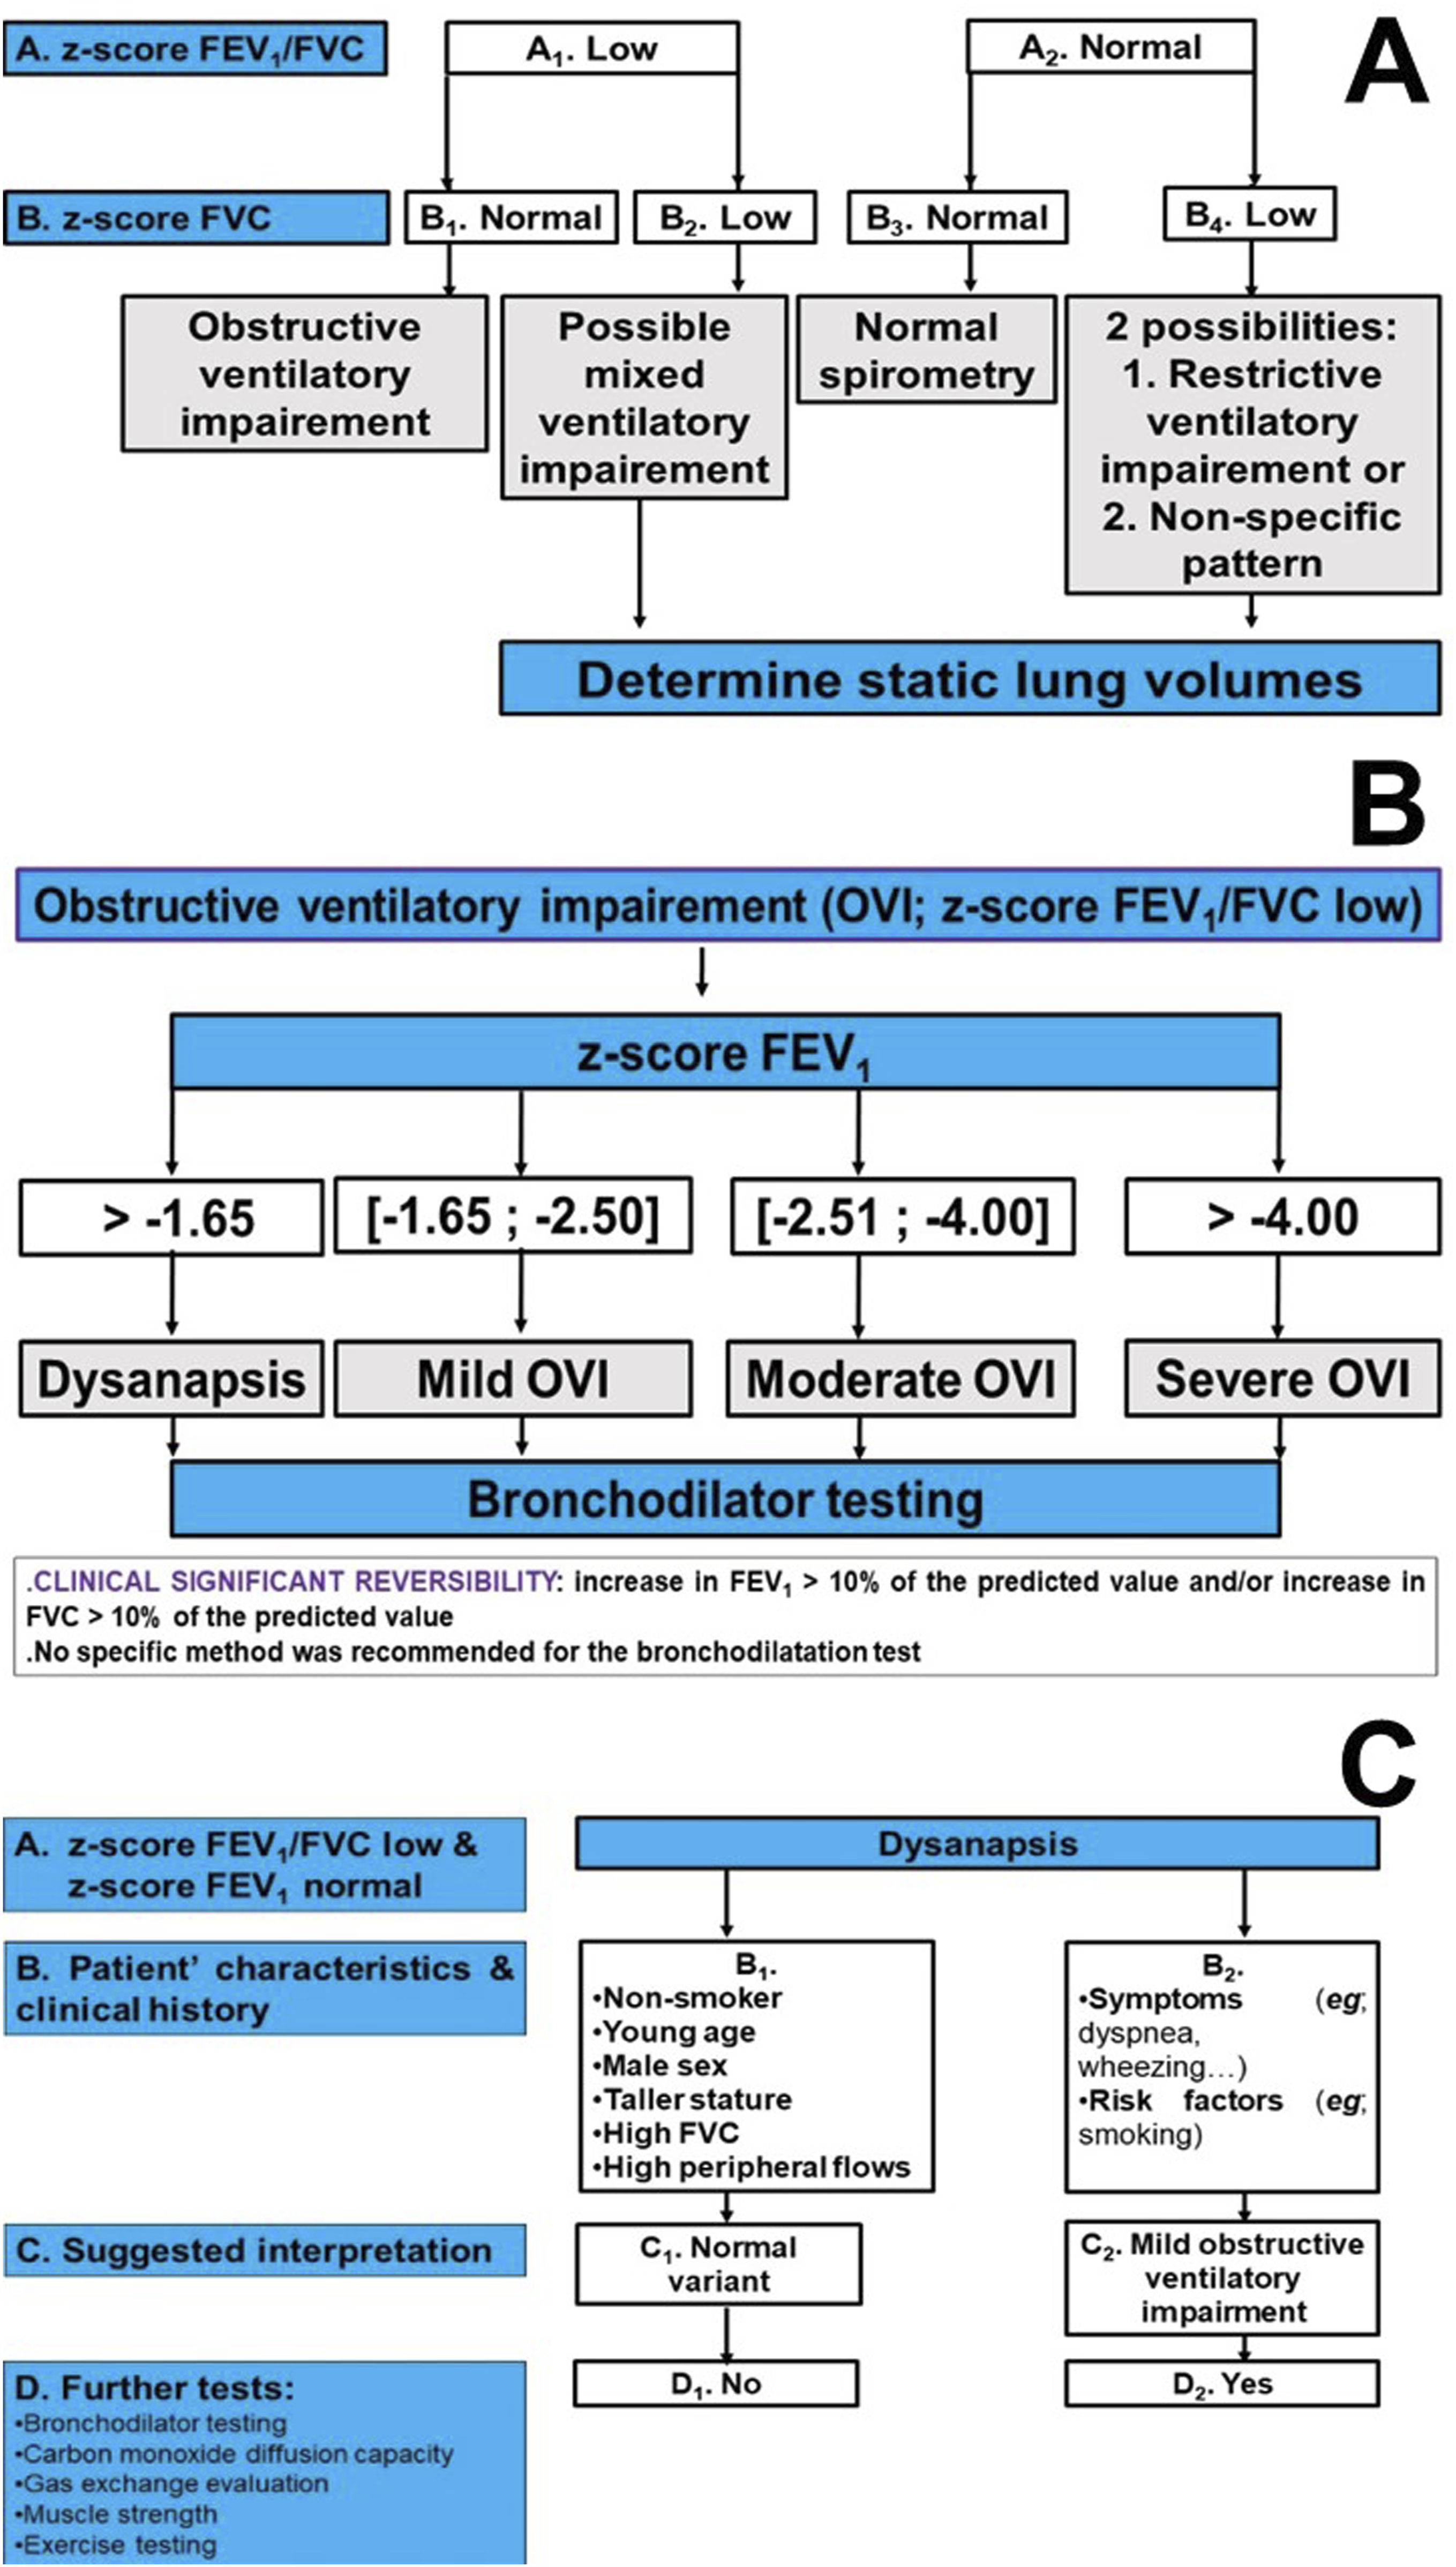

Figure 1 illustrates the algorithm of interpreting spirometric parameters. The initial step is to evaluate the ratio between forced expiratory volume in 1 s (FEV1) and forced vital capacity (FVC), with two possible situations (Figure 1(A)). The first is a normal FEV1/FVC ratio (cell A
2
). In this case, if the FVC is normal (cell B
2
), this suggests a normal spirometry. If the FVC is low (cell B
4
), this suggests a RVI or a NSP, while a simultaneous decrease in FVC and FEV1 points to a PRISm (not shown in the
Figure 2 illustrates the algorithm for interpreting SLVs.
4
The initial step is to evaluate total lung capacity (TLC), with three principal outcomes: (i) High TLC (cell A
3
). If the RV/TLC ratio (and/or the functional residual capacity (FRC)/TLC ratio) is high (cell B
5
), this suggests lung hyperinflation (LH), whereas it normalization (cell B
6
) points to large lungs. (ii) Normal TLC (cell A
2
). Here, a high RV/TLC ratio (or FRC/TLC ratio) (cell B
3
) evokes LH, while its normalization (cell B
4
) indicates normal SLVs. The presence of a low FEV1, low FVC, and a normal FEV1/FVC ratio indicates a NSP (not shown in the (iii) Low TLC (cell A
1
). This verifies the presence of a RVI with three identifiable possibilities: (a) MVI: High RV/TLC (and/or FRC/TLC) (cell B
1
) with low FEV1/FVC (cell C
1
); (b) Complex RVI: High RV/TLC (and/or FRC/TLC) (cell B
1
) with normal FEV1/FVC (cell C
2
); and (c) Simple RVI: normal RV/TLC (and FRC/TLC) (cell B
2
).
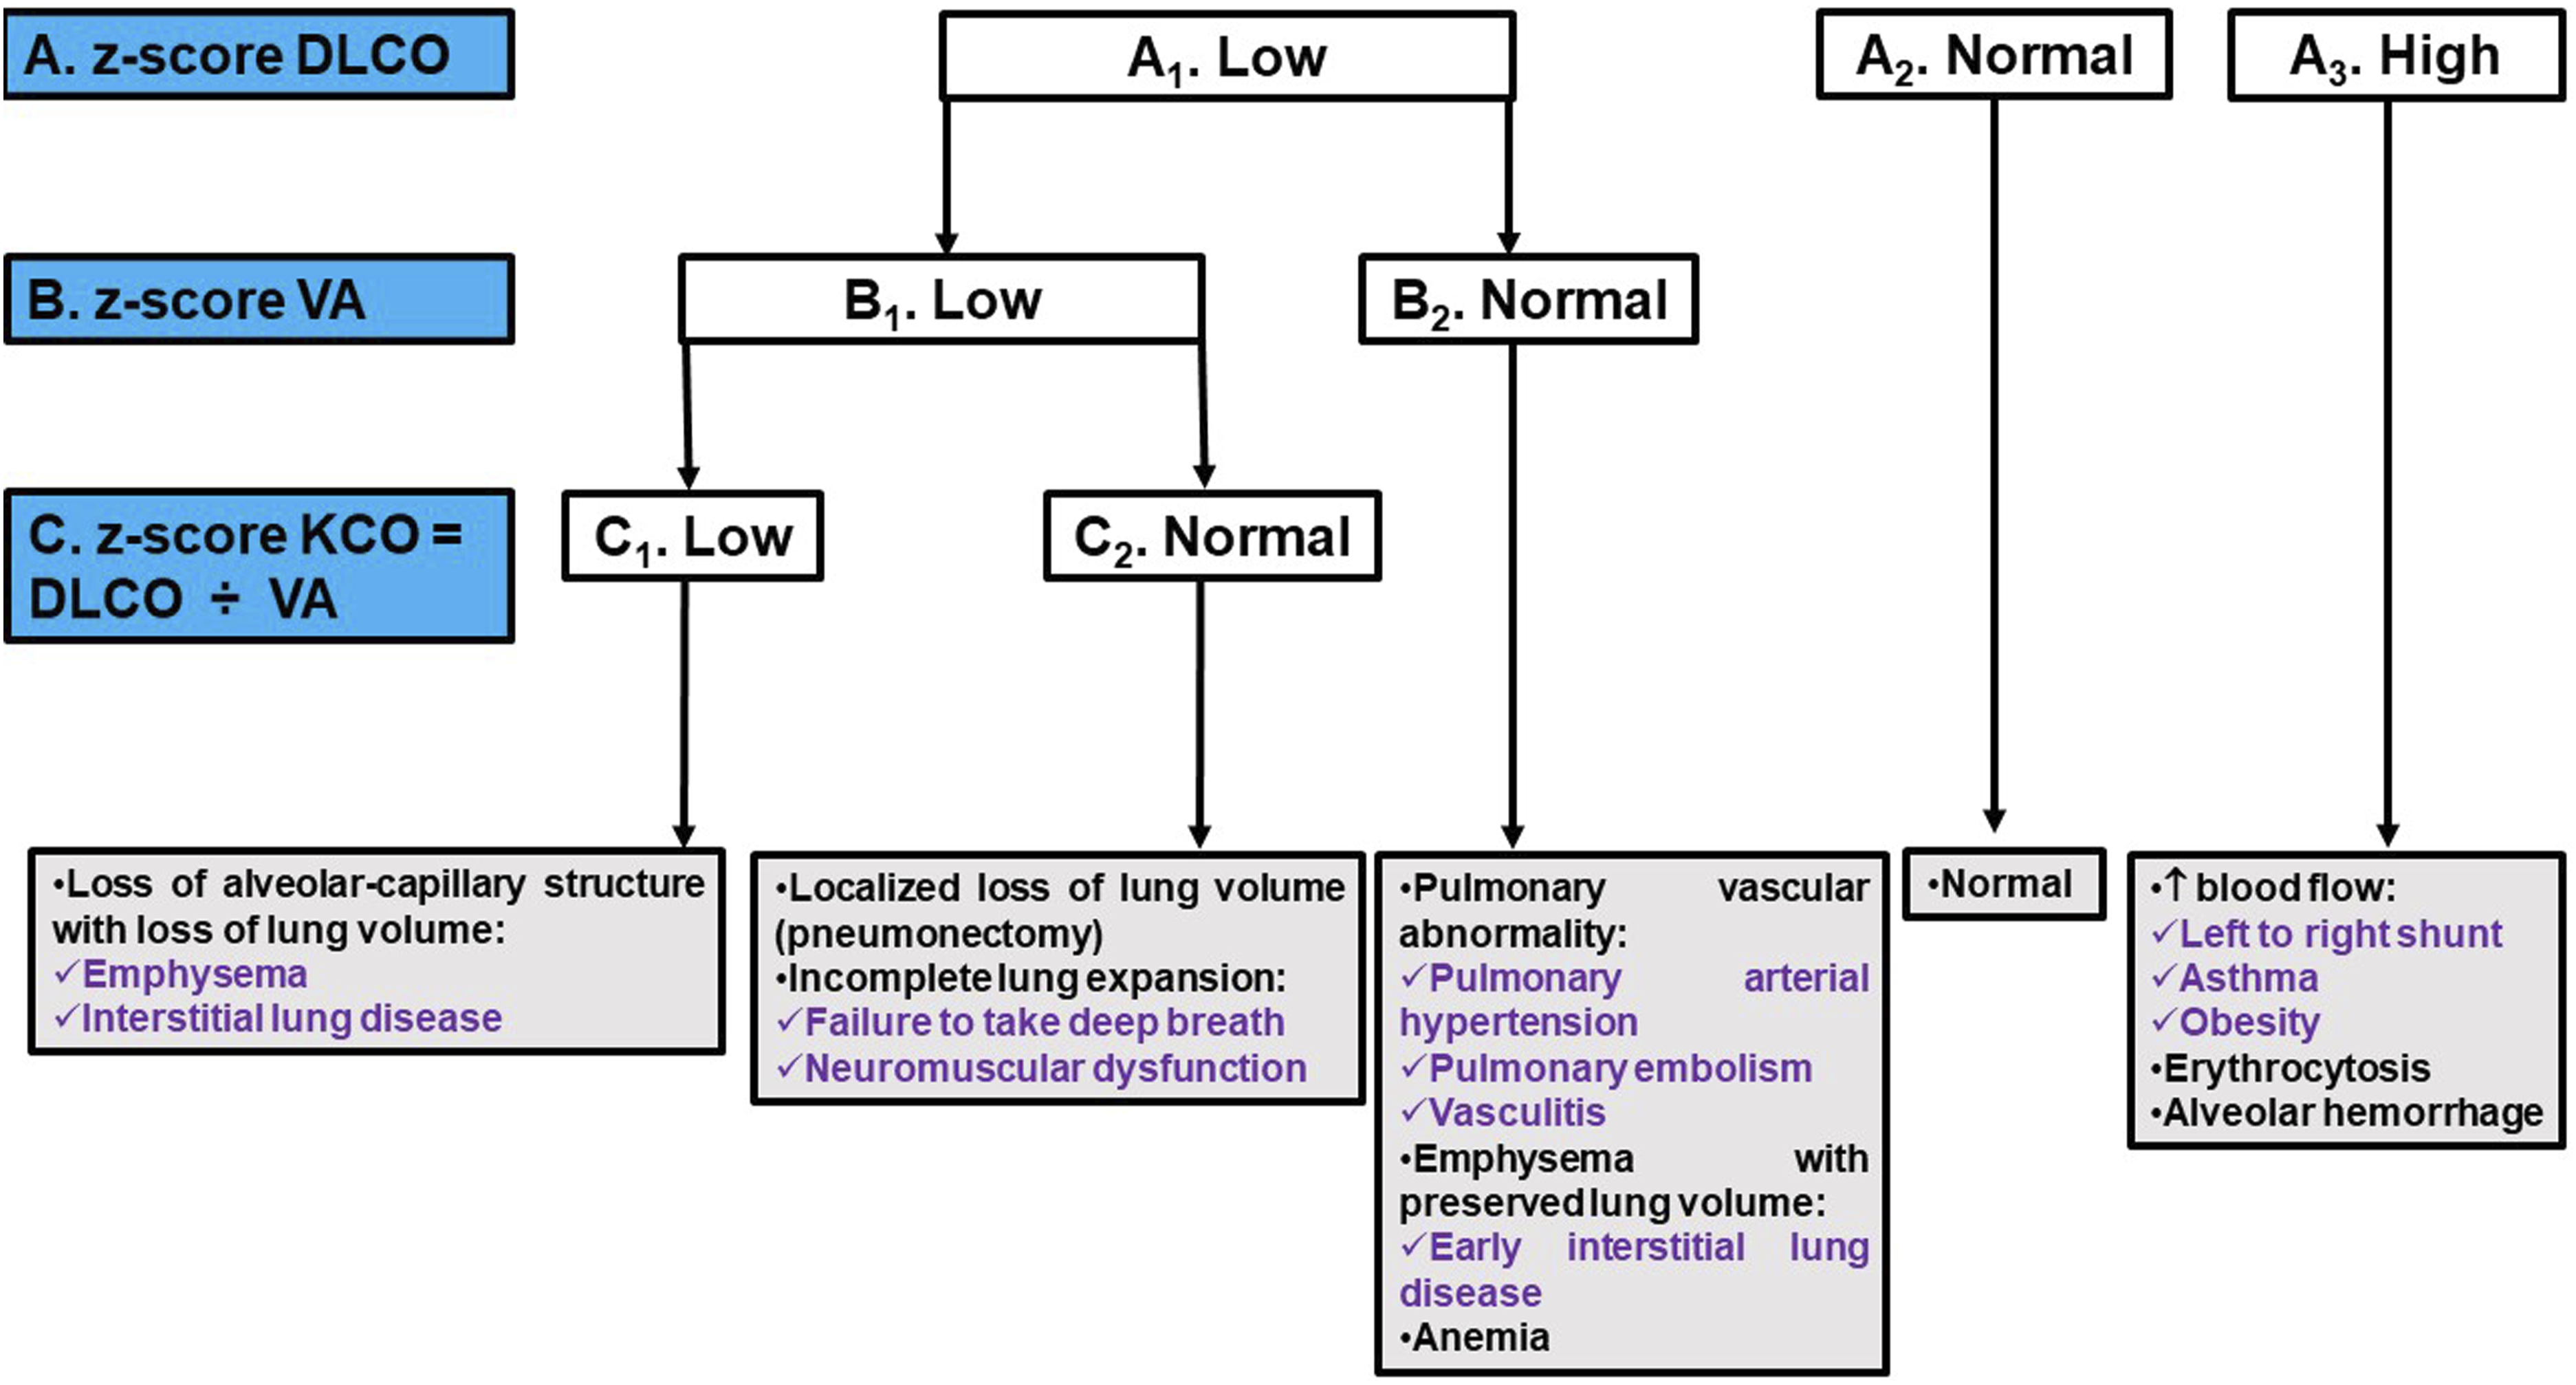
Figure 3 illustrates the algorithm for interpreting DLCO.
4
Three scenarios are outlined: (i) Low DLCO (cell A
1
). In this case, both alveolar volume (VA) and carbon monoxide transfer coefficient (KCO = DLCO ÷ VA) levels should be assessed. Low VA (cell B
1
) and KCO (cell C
1
) may indicate a loss of alveolar-capillary structure along with loss of lung volume. When accompanied by a normal KCO value (cell C
2
), low VA (cell B
1
) suggests a localized reduction in lung volume or incomplete lung expansion. Conversely, if VA is normal (cell B
2
), it could indicate a pulmonary vascular anomaly, emphysema with preserved lung volume, or anemia. (ii) Normal DLCO (cell A
2
). (iii) High DLCO value (cell A
3
). This situation could suggest increased blood flow, erythrocytosis, or alveolar hemorrhage. Carbon monoxide diffusion capacity (DLCO): algorithm of interpretation. VA: alveolar volume. KCO: carbon monoxide transfer coefficient. Notes: ✓ Low: z-score <−1.645. ✓ Normal: −1.645 ≤ z-score ≤+ 1.645. ✓ High: z-score > +1.645.
The following paragraphs will discuss the applied criteria to diagnosis some VIs such as OVI, RVI, MVI, PRISm, NSP, and gas transfer impairments.
Obstructive ventilatory impairment
The specific cases of central and upper airway obstructions have been described in previous publications.5,20,32
Regarding distal OVI, it has been historically thought that increased instantaneous flows at low lung volumes and maximal mid-expiratory flow (MMEF) are indicative of such impairment. 32 However, the performance of these parameters has proven to be poor.4,6 Instantaneous flows and MMEF exhibit high variability, poor reproducibility, and lack specificity for small airway disease. 38 Consequently, there is insufficient evidence to confirm the existence of distal OVI based solely on spirometry parameters.4,6 Nonetheless, visual analysis of the flow-volume curve may suggest the presence of distal OVI by demonstrating an upwardly concave curve aspect.4,6 Additionally, as any pulmonologist recognizes, a low MMEF, especially when FVC remains normal, is often the earliest abnormality detected in individuals at risk for COPD. 9 These individuals typically exhibit a high pre-test probability of airway disease. 9 A low MMEF (e.g.; <50% predicted value (%pred), as the LLN is often set too low 39 ) is valuable in identifying “pre-COPD” cases, serving as a crucial tool in encouraging smokers, who still have a preserved FEV1, to quit smoking sooner rather than later. 9 The SPIROMICS cohort, 40 which included smokers and ex-smokers, reported a significant variability between MMEF %pred and FEV1 %pred when the latter was within the normal range, and identified that MMEF %pred was linked to imaging evidence of increased emphysema and functional small airway disease, even after adjusting for FEV1 or FVC. Finally, other tools such as oscillometry or the “multibreath flush test” may aid in identifying distal OVI, although they are not commonly utilized in clinical practice.41,42
An OVI is characterized by a FEV1/FVC ratio falling below the LLN. 4 While this spirometric criterion for OVI aligns with the 1991-ATS 43 and the 2005-ATS/ERS 5 guidelines, it differs from the definitions provided by the global initiative for chronic obstructive lung disease (GOLD)2,44 and the ATS/ERS 45 guidelines on COPD, which use a fixed FEV1/FVC threshold of 0.70 to identify OVI. It is high time to definitively discard the 0.70 cut-off in the diagnosis of COPD.46,47 First, failing to account for the fact that the FEV1/FVC ratio changes with age leads to an underestimation of OVI prevalence in younger individuals and an overestimation in the elderly.46–48 The FEV1/FVC ratio decreases with age and height, even in non-smokers, where the LLN falls below the fixed threshold of 0.70 starting around 45 years of age. 47 The use of the 0.70 threshold results in up to a 50% overdiagnosis (misclassification) beyond this age. 47 Moreover, the fixed ratio does not adequately distinguish mild OVI, and its use introduces significant age and sex biases.46–48
Classifications of ventilatory impairments defined according to static lung volumes (modified from reference) 4 .

Notes: ✓
Under conditions of maximal effort, the presence of low FEV1/FVC with normal FEV1 in a healthy individual may result from dysanapsis growth of the airways and lung parenchyma 4 (Figure 1(B)). Dysanapsis involves unequal growth of the airways and lung parenchyma, with greater growth occurring in lung parenchyma and airway length than in airway caliber. 49 While this profile may represent a normal variant in healthy individuals, it can also indicate a predisposition to develop obstructive disease (Figure 1(C)).49–52 It is worth considering the possibility that this functional profile corresponds to a variant of normal, especially in healthy, asymptomatic adults, especially if they are male, tall and young, even more so as FVC is increased and distal flows are normal (Figure 1(C), cells B 1 and C 1 ). 49 In children, the dysanapsis growth is associated with obesity or rapid weight gain in early childhood, and is predictive of expiratory flow limitation, thus constituting an indicator of the propensity for obstruction.50–52 Determining whether dysanapsis growth signifies obstruction or a normal variant requires consideration of the clinical context and results of other complementary explorations, such as bronchodilation tests, DLCO measurements, respiratory muscle strength assessment, and cardio-pulmonary exercise tests (Figure 1(C)). 4 Additionally, it is essential to verify the correct execution of forced expiratory maneuvers before drawing any conclusions. Since FEV1 exhibits inverse effort-dependence, sub-maximal effort may lead to an overestimation of FEV1 and consequently explain such results. 49
Restrictive ventilatory impairment
RVI is defined by a low TLC 4 (Figure 2, cell A 1 ). It may result from the alteration of one of the following three forces: (i) Decrease in muscle strength (e.g.; myopathies), (ii) Increase in elastic recoil pressure (e.g.; pulmonary fibrosis), mainly due to the presence of rigid fibrotic tissue in the lungs, and (iii) Reduction in parietal compliance. 53
Measurement of SLVs is necessary to confirm a low TLC. However, RVI may be suspected on spirometry when FVC is low (Figure 1(A), cells B 2 and B 4 ) while FEV1/FVC is low (Figure 1(A), cell A 1 ) or normal (Figure 1(A), cell A 2 ). This last situation may suggest either a RVI or a NSP. 4 It is important to note that an isolated low FVC does not prove the existence of RVI, as it is associated with RVI in at least 50% of cases. 54 Since the complexity of FVC interpretation warrants careful consideration, 9 the ERS/ATS 4 conclusion that “a normal FVC can exclude RVI” should be approached with caution. 9 In practice, a significant number of patients with established ILD exhibit low TLC despite a preserved FVC, especially when RV decreases concurrently with TLC. 55
In most patients with a restrictive process, such as ILD, TLC, FVC, and FEV1 are reduced in a proportional way. 6 Thus, when expressed as a %pred, the difference between TLC%pred and FVC%pred is negligible. 6 This scenario corresponds to “simple” RVI 56 (Figure 2, cell B 2 ). However, many patients have RVI with a difference between TLC%pred and FVC%pred exceeding 10%. 56 This disproportionate decrease in FVC%pred compared to TLC%pred leads to an increase in RV and RV/TLC, indicating the presence of air trapping, without being associated with a decrease in FEV1/FVC. 56 This characterizes complex RVI (Figure 2, cell C 2 ). The air trapping observed in this case may reflect occult obstruction or mechanical incapacity to reduce thoracic cavity volume, as seen in neuromuscular diseases or obesity. 56 Lastly, according to the ERS/ATS update, 4 obesity can only be incriminated in a restrictive process for body mass index values >40 kg/m257 (Box 2). It appears that the ERS/ATS update 4 overlooks the interpretative challenges posed by the obesity epidemic, including cases of extreme obesity. 58
Mixed ventilatory impairment
The combination of a low TLC and a low FEV1/FVC indicates the simultaneous presence of obstruction and restriction, referred to as MVI 4 (Figure 2, cell C 1 ). MVI is typically characterized by pulmonary parenchymal and extra-pulmonary damage. 6 The most common scenario is the association between COPD and congestive heart failure or obesity. 59 In the absence of SLVs measurements, the association of a low FEV1/FVC with a normal FVC allows the exemption of MVI (Figure 1(A), cell B 1 ). 4 However, when both the FEV1/FVC and FVC are low (Figure 1(A), cell B 2 ), associated restriction cannot be ruled out, and the presence of MVI is thus possible. 59 SLVs measurements generally confirm this situation by indicating a low TLC in 10% of cases. 59 Typically, TLC is found to be normal, while RV and FRC are high. 4 The decrease in FVC is actually due to the increase in RV. 6 These abnormalities often signify air trapping or LH, serving as indirect indicators of obstruction (Figure 2, Box 2). In clinical practice, strict adherence to the ERS/ATS 4 recommendation that “low FVC in cases of OVI (Figure 1(A), cell B 2 ) should trigger suspicion of associated restriction, necessitating SLVs assessments” could lead to a surge in unnecessary testing 9 : In the majority of patients with COPD, but not in conditions like sarcoidosis where a low FVC might indicate associated restriction, 60 a low FVC typically reflects gas trapping. 61
Preserved ratio impaired spirometry and non-specific pattern
In the absence of TLC determination, the presence of a low FVC or FEV1 with a normal FEV1/FVC corresponds to the PRISm.62,63 PRISm is a relatively common entity, with a prevalence of approximately 10%.62,63 It may be observed in cases of true restriction or damage of small airways, 64 or may result from reduced effort, reflecting the individual’s inability to fully inspire or expire, leading to an overestimation of FEV1 and FVC. 4 In such situation, the flow-volume curve may exhibit a downward concavity at the end of the maneuver. 4 Under conditions of optimal effort, and in the absence of TLC determination, performing a bronchodilation test may be useful.4,57 If this test is clinically significant, it may indicate the existence of a certain degree of bronchial reactivity.4,57 It is also possible to complete the evaluation with a measurement of slow-vital capacity. If FVC differs from slow-vital capacity by more than 100 mL (i.e.; slow-vital capacity minus FVC ≥100 mL), this may reflect collapse of small-airways with air trapping occurring during forced expiration. 65 The aforementioned proposed 100 mL difference appears overly stringent 9 ; and a more realistic threshold of 200 mL is recommended to prevent overdiagnosis of airway disease.32,61 It is essential to note that the use of the term PRISm in situations where TLC is not available introduces a challenge. 6 The term PRISm did not exist in the Figure 8 of the ERS/ATS update 4 (nor in our Figure 1), which causes uncertainty, questions its utility, and challenges its validity in easing clinicians’ decisions.
A NSP is defined by the presence of a low FEV1, low FVC, normal FEV1/FVC (Figure 1, cell B 4 ), and normal TLC.57,66 The significance of NSP is unclear. 57 It may be a precursor sign of a restrictive or obstructive process. 66 Long-term follow-up of these patients identified that NSP remains stable in two-thirds of patients, while it progresses to restriction or obstruction in one-third of cases. 66 In the case of a restrictive process, the decrease in FVC is not yet accompanied by a decrease in RV.4,66 In contrast, in the case of an obstructive process, collapse of small-airways can lead to a decrease in FVC and an increase in RV before FEV1/FVC decreases. 4 Finally, it should be mentioned that during the evaluation of patients with pneumothorax or non-communicating bullous emphysema, a discrepancy is often observed between a low FEV1 and FVC, while FEV1/FVC and TLC determined by plethysmography are within normal limits. 32 In such situations, it is recommended to determine TLC using other techniques, particularly gas dilution. 32 It is interesting to note that the ERS/ATS update 4 presents inconsistencies between the definition of the NSP (provided in their table 5) and the complementary text, which leads to potential confusion. While in table 5 of the guideline, 4 the NSP was characterized by “low” FEV1 and FVC, with “normal” FEV1/FVC and TLC, in the complementary paragraph titled (The “non-specific” pattern: a “low” FEV 1 and FVC with “normal” FEV 1 /FVC”) in page 19, 4 the NSP was defined as having “low” FEV1 or/and FVC. 4 Furthermore, in their Figure 8, 4 the suspicion of the NSP did not take into account FEV1.
In brief, other than putting a name on an atypical spirometry impairment/pattern, the utility of
Gas transfer impairments
Four abnormal situations are possible for DLCO 4 : (i) Low DLCO, VA and KCO; (ii) Low DLCO and VA, with normal KCO; (iii) Low DLCO with normal VA; (iv) High DLCO. The possible causes of each situation are detailed in Figure 3.
According to the ERS/ATS, 4 when interpreting results, it is important to account for changes in hemoglobin, carboxyhemoglobin, met-hemoglobin, and carbon monoxide back-pressure. This is especially crucial in cases where patients are being regularly monitored for potential drug toxicity and when hemoglobin levels may fluctuate significantly, such as during chemotherapy for cancer. 4 Clinicians should consider hemoglobin concentrations on an individual basis when interpreting results, and it is recommended that reference values be adjusted according to the measured hemoglobin concentration. 4
Pristi and Johnson 16 identified some significant issues in the proposed algorithm for interpreting DLCO. 4 While the algorithm acknowledges that KCO increases at lower VA, it does not account for the predictable relationship between KCO, DLCO, and VA.16,31,67 The algorithm also overlooks the fact that patients with ILDs can have low, normal, or high KCO, and that patients with low VA due to incomplete lung expansion could have a normal DLCO when adjusted for VA. 16 Pristi and Johnson 16 suggested reporting the predicted DLCO for the patient’s VA (i.e.; DACO 68 ) alongside the measured DLCO. Instead of incorporating KCO into the DLCO interpretation algorithm, the focus should be on the %pred DACO, which corresponds to the %pred KACO and tends to be low in ILD.16,69 According to Neder, 9 the notes in the ERS/ATS update 4 that ‘defining an impaired KCO in the context of a low VA has minimal evidence to guide interpreters’ is a concern and poses misinterpretation of VA and KCO. Figure 3 modified from the ERS/ATS update, 4 suggests that a low KCO (Figure 3, cell C 1 ) in conjunction with a low VA (Figure 3, cell B 1 ) indicates loss of alveolar-capillary structure with loss of lung volume. However, an important consideration was omitted from Figure 3, 4 which is the VA/TLC ratio. 9 While a normal KCO with a low VA/TLC ratio (e.g.; <0.80) due to airway disease or emphysema may not be informative, a normal or low KCO when VA is near TLC suggests intraparenchymal restriction. 9 In contrast, a supra-normal KCO indicates extraparenchymal restriction. 70
Step 3: evaluation of ventilatory impairment’ severity and diffusing capacity of the lungs for carbon monoxide’ decrease
The ERS/ATS 4 introduced a significant innovation in the classification of the severity of OVI (Figure 1(B)), RVI and low DLCO. 4 For both OVI and RVI, a three-level severity scale is employed, based on the FEV1 z-score. Similarly, the severity scale for DLCO is based on the DLCO z-score and also includes three levels. The recommended three-level severity scale would deem a z-score >−1.645 as normal, z-scores between −1.65 and −2.50 as mild impairment, z-scores between −2.5 and −4.0 as moderate impairment, and z-scores <−4.0 as severe impairment. 4 It is important to point out that this classification solely considers mortality risk as a benchmark, and may not necessarily reflect symptom severity, risk of exacerbations, or social consequences. 4 According to Neder, 9 it is axiomatic that such classification should primarily reflect current functional impairment, not future risk, the latter a complex construct that goes well beyond lung function in individual patients. According to Bhatt et al., 10 there is a gap in the classification scheme recommended the ERS/ATS for staging OVI severity. 4
Assessing the VI severity is often challenging and uncertain.71,72 Traditionally, this assessment has involved using arbitrary thresholds to categorize results into 3–5 levels,4,5,71–73 loosely correlating with disease symptoms and mortality rates.74,75 It remains uncertain whether the ERS/ATS derived z-score three-level severity scale 4 will prove more effective than the older %pred scales. 71 When comparing different severity scales, such as FEV1 %pred, FEV1 z-score, or the recently proposed FEV1/FVC ratio, it is crucial to consider the chosen cut-off points.76,77 It seems that the suggested FEV1/FVC scale differs from the GOLD 44 criteria mainly because its tier-1 includes lower FEV1 values than GOLD 1, which only includes FEV1 >80%.76,77
Step 4: assessment of the bronchodilator test response
The bronchodilator test is utilized to assess the extent of improvement in pulmonary function following the administration of a bronchodilator.6,20 In practical terms, it entails spirometry (or a plethysmography) conducted after inhaling 400 μg of a short-acting β-2 mimetic bronchodilator (e.g.; salbutamol) and/or 30 min after inhaling 160 μg of a short-acting parasympatholytic (e.g.; ipratropium bromide).6,20 When the bronchodilator test is employed for diagnostic purposes, bronchodilators should be discontinued prior to the test with the duration of discontinuation dependent on the type of bronchodilator used. 6
According to the ERS/ATS, 4 reversibility is considered clinically significant when there is an increase in FEV1 and/or FVC of more than 10% compared with the predicted value, irrespective of the patient’s age. 4 This new reversibility criterion differs from previous guidelines 5 and may result in many patients -some with 30–50% improvement from baseline- no longer being classified as having a clinical significant reversibility. 16 This could lead to them being denied the best treatment with bronchodilators. 16 The 10% criterion does not take into account reproducibility or other indicators. 16 The main reason behind the ERS/ATS update 4 recommendation is evidence showing improved survival rates in patients with OVI who experience a reversibility of more than 8% of predicted FEV1. 78 Some experts have suggested using non-binary reversibility criteria instead, 79 especially in pediatric population. 80
According to the ERS/ATS update, 4 the choice of bronchodilator, its dosage, and method of administration are left to clinical judgment. It is worth noting that the advantages of various bronchodilator test protocols, such as the delivered dose, remain unspecified.4,81 Furthermore, while a response to bronchodilators may indicate changes in clinical status, its utility in differentiating between various airway diseases is imprecise.4,81
Step 5: identifying significant changes over time
When patients have previous PFT results, it is important to compare current findings with past ones to detect any significant changes over time. 4 Longitudinal assessment of PFT parameters enables the identification of excessive decline in pulmonary function caused by exposure to harmful agents or an underlying disease. 82 Ideally, measuring an individual’s pulmonary function before the onset of their illness should serve as a reference point. 82 To assess the decline in pulmonary function, it is crucial to compare it to the physiological one observed in the healthy population. 4 However, it is important to consider biological variability and measurement errors. 6 Therefore, to label a decline in PFT as accelerated, the observed decrease in a patient must exceed both the physiological decline and account for biological variability and measurement errors.4,6 Since test-to-test variability (e.g.; up to 150 mL for FEV1) greatly exceeds even an accelerated annual rate of decline, several measurements over an extended time are needed to establish a valid rate of decline for an individual.5,30
In adults, the FEV1Q is an interesting method for evaluating the decline in pulmonary function. 83 The FEV1Q expresses FEV1 relative to a lower limit that represents the “survival threshold” below which the risk of mortality is greatly increased. 83 The FEV1Q value is the numerical quotient obtained as FEV1 (in Liters) divided by 0.5 for males and by 0.4 for females. 83 Under normal conditions, FEV1Q decreases by one unit every 18 years in healthy individuals and by one unit every 10 years in smokers and elderly individuals. 83 FEV1Q should remain stable over a short period (and up to 1 year), and a rapid decline in its value should indicate a significant change in pulmonary function. 4 However, there are no specific thresholds to define stability or rapid decline of the FEV1Q (e.g.; what is the level of change that constitutes the minimal important difference between FEV1Q’ measurements), 13 and it can be challenging in practice to reliably detect any excessive changes. Therefore, it appears that FEV1Q may be useful, but not helpful. 13 Moreover, according to Neder, 9 FEV1Q is fraught with complexities since the first centile is likely to vary markedly as a function of age, body dimensions, and the underlying disease(s). Additionally, FEV1Q has been used to assess the severity of COPD, and unlike the traditional method based on FEV1 %pred, the FEV1Q was able to distinguish the most severe classes of COPD from less severe stages. 73
Conditional change score (CCS) for the forced expiratory volume in 1 s (FEV1) and examples of interpretation.

The GLI has developed an online PFT tracker (LUNGTRACKER.V1.1), a tool freely available at https://gli-calculator.ersnet.org/lung_tracker/. This tool is designed to monitor/visualize changes in PFT over time in both children/adolescents and adults. 89 Physicians and researchers can enter individual-level data as age, height, sex, ethnicity and spirometry measures (FEV1 and FVC) or upload an excel file. The tool returns pulmonary function level and potential change (if repeated data are entered) along with individual-level reference curves. FEV1 and FVC can be mapped and plotted for any age across the life-course (4–90 years). 89
The ERS/ATS update 4 does not address the use of additional parameters, such as FEV1, FVC and DLCO, for monitoring pulmonary function over time. 13 Historically, the values of these parameters and their temporal changes have been critical for guiding treatment decisions, making advanced referrals, and including individuals in clinical trials. 13 The 2005 ERS/ATS guidelines 5 draw attention to the importance of significant changes in FEV1, FVC, MMEF, and DLCO, which should alert healthcare providers to substantial changes in pulmonary function within the relevant clinical context. According to Rurak and Schotland, 13 the omission of these parameters raises the question of whether they should no longer be monitored, or if the significant changes reported in the 2005 ERS/ATS guidelines 5 remain the standard. The 2005 ERS/ATS guidelines 5 also pointed out that tracking too many indices simultaneously increases the risk of false-positive indications of change. 13 Was the decision to focus solely on FEV1Q for monitoring changes intended to reduce the risk of false positives and simplify the process? 13 If so, there is concern that this approach may lead to the opposite effect, with many clinicians continuing to use varied standards. 13
Challenges in interpreting the ERS/ATS update
Even years after the publication of the ERS/ATS update, 4 there are still a number of issues that pose uncertainty and require clarification. 8 ERS/ATS interpretation update was to encourage the recognition of uncertainty in the application of PFT data. 4 In a 2024 editorial, 11 some of the primary authors of the ERS/ATS update 4 stated that “understanding the inherent uncertainty of PFT interpretation and incorporating the uncertainty into making clinical decisions is an important step forward.”
For instance, in even the most straightforward cases of OVI, there will be healthy individuals who have a low FEV1/FVC ratio (i.e.; z-score <−1.645), similar to 5% of the healthy reference population.4,90 Conversely, there will be many individuals with early-stage disease who still maintain a normal ratio (i.e.; z-score ≥−1.645).4,90 While, the z-score reflects whether an individual’s value stands relative to the reference population, the diagnostic algorithms often force us into binary ‘yes/no’ decisions at the boundaries of these ranges. 12 Is it time to abandon binary interpretation of PFT data? 12 A more practical and necessary shift in practice could involve moving away from a binary interpretation of PFT data. 12 One proposed change in practice, advanced by Haynes, 12 involves implementing a three-tier system for data classification: abnormal (e.g.; z-score <−2.0), borderline (e.g.; −2.0 ≤ z-score ≤ −1.3), and normal (e.g.; z-score >−1.3 (10th percentile)). Instead, clinicians/physicians should integrate uncertainty directly into an interpretation strategy that is usable by both human interpreters and computer software. 12 In addition, when dealing with more atypical patterns (e.g.; NSP, PRISm, non-obstructive abnormal spirometry, isolated low FEV1 spirometric impairment), physiological values can be compared to the normal range, but the uncertainty in interpretation increases significantly. This uncertainty should be explicitly acknowledged in the final report. 12
Box 4 briefly exposes the following six practical challenging situations, which contributed to confusion among clinicians/researchers: (i) Non-obstructive abnormal spirometry: Low FEV1 or FVC or both with normal FEV1/FVC ratio.17,91,92 (ii) Isolated low FEV1 spirometric impairment: Low FEV1 with normal FVC and FEV1/FVC ratio.4,7,66,93,94 (iii) OVI’ severity and place of SLVs: First, while the FEV1/FVC z-score is utilized to diagnose OVI, its severity is determined by the FEV1 z-score.
4
There is a suggestion to use FEV1/FVC for classifying OVI severity.10,95 In addition, future studies comparing both criteria of OVI severity classification (e.g.; FEV1 z-score vs FEV₁/FVC z-score) are needed. Second, in their Table 7, the ERS-ATS
4
reported that RV is high during OVI. This is questionable since one previous study including 281 COPD (i.e.; FEV1/FVC post-bronchodilator <0.70) heavy smokers of more than 40 pack/years reported that 25 patients (9%) had normal RV.
96
In the ERS/ATS-2005
5
guideline (page 958), we noted the following vague sentence “Finally, the reported increase in RV in obstruction is deemed to be a marker of airway closure.97,98” (iv) RVI’ severity: While, ERS/ATS specifies that RVI should be considered in the presence of a low TLC
4
; it does not provide recommendations on which parameter to use for classifying its severity. (v) MVI’ severity: The choice of parameter(s) for classifying MVI severity is uncertain. Should we prioritize TLC or FEV1? (vi) LH’ diagnosis and severity: First, it is important to note that the LH definition advanced by the ERS/ATS update
4
is ambiguous. While in their Table 7,
4
LH is defined by high FRC/TLC and RV/TLC, in their Figure 10,
4
it is defined by high FRC/TLC or RV/TLC. Second, no z-scores are available for FRC/TLC. Third, no severity classification for LH was proposed. Given the ongoing debate surrounding the use of different scales for OVI, particularly when extensive population data is available, it is understandable that the ERS/ATS update
4
chose not to recommend severity scales for less common patterns such as LH. Six challenges in interpreting the ERS/ATS-2022 update.
4

The future of interpreting pulmonary function tests
With the advancements in artificial intelligence, one study has evaluated its diagnostic performance in interpreting PFTs. 99 This study demonstrated that artificial intelligence significantly surpasses human capabilities, especially when the clinician lacks experience. 99 However, it is also evident that collaboration between the physician and artificial intelligence can significantly enhance the interpretation of PFTs. 99
One of the most significant challenges in standardizing the interpretation of PFTs lies in the persistent divide between the ‘epidemiological population-based’ and the ‘clinical’ patient-centered’ approaches. 9 While technical standards are always beneficial, 4 their recommendations should be considered within the context of an n-of-1 trial. 9 Given the scarcity of large-scale prospective studies on PFT interpretation, a busy clinician is less likely to make errors when using a Bayesian approach to assess the probability of a suspected abnormality, 9 incorporating additional clinical information. 55
Conclusion
This review is a comprehensive framework for interpreting PFTs, incorporating the latest ERS/ATS update. 4 PFTs are vital for diagnosing and monitoring chronic respiratory diseases. The GLI standards, which consider individual characteristics and ethnic origin, have significantly advanced PFTs. They provide a comprehensive view of an individual’s lung function, aiding in early and reliable diagnosis. Since some issues pose uncertainty in clinical practice, 100 it would be beneficial to the ERS/ATS 4 to reconcile some inconsistencies and provide clearer guidance on different classifications and VIs.
Footnotes
Acknowledgements
The authors would like to express their sincere gratitude to the three reviewers for their excellent feedback, which has substantially improved the quality of this work. Their insightful comments and constructive suggestions were invaluable in refining our manuscript. The authors also wish to disclose that artificial intelligence tool (i.e., ChatGPT 3.5) was utilized to enhance the manuscript’s wording, readability, and language quality. 101 The tool was used only for language refinement and not for generating text.
Author contributions
All authors: Literature search, Manuscript preparation and Review of manuscript. All authors read and approved the final manuscript.
Declaration of conflicting interests
The author(s) declared no potential conflicts of interest with respect to the research, authorship, and/or publication of this article.
Funding
The author(s) received no financial support for the research, authorship, and/or publication of this article.