
Abstract
Ineffective efforts (IEs) are among the most common types of patient–ventilator asynchrony. The objective of this study is to validate IE detection during expiration using pressure and flow signals, with respiratory effort detection by esophageal pressure (Pes) measurement as the reference, in patients with neuromuscular diseases (NMDs). We included 10 patients diagnosed with chronic respiratory failure related to NMD. Twenty-eight 5-minute recordings of daytime ventilation were studied for IE detection. Standard formulas were used to calculate sensitivity, specificity, positive predictive value (PPV), and negative predictive value (NPV) of IE detection using pressure and flow signals compared to Pes measurement. Mean sensitivity and specificity of flow and pressure signal-based IE detection versus Pes measurement were 97.5% ± 5.3% and 91.4% ± 13.7%, respectively. NPV was 98.1% ± 8.2% and PPV was 67.6% ± 33.8%. Spearman’s rank correlation coefficient indicated a moderately significant correlation between frequencies of IEs and controlled cycles (ρ = 0.50 and p = 0.01). Among respiratory cycles, 311 (11.2%) were false-positive IEs overall. Separating false-positive IEs according to their mechanisms, we observed premature cycling in 1.2% of cycles, delayed ventilator triggering in 0.1%, cardiac contraction in 9.2%, and upper airway instability during expiration in 0.3%. Using flow and pressure signals to detect IEs is a simple and rapid method that produces adequate data to support clinical decisions.
Keywords
Introduction
Optimal patient–ventilator synchrony is crucial to ensure maximal tolerance of noninvasive ventilation (NIV) and to avoid poor gas exchange, wasted effort, and sleep disruption. 1 –6 Ineffective efforts (IEs) are the most frequent asynchronous events occurring during mechanical ventilation, with a prevalence of 45% in patients with neuromuscular diseases (NMDs). 7 IE is defined as an inspiratory muscle activation that fails to trigger the ventilator. The trigger usually consists in an inspiratory pressure or flow threshold, depending on the characteristics of the inspiratory circuit (with or without an inspiratory valve). 8 In the absence of leaks or obstructive events, IEs may result from dynamic hyperinflation, respiratory muscle weakness, reduced respiratory drive, or inadequate trigger threshold setting. 3,5,6
The frequency of IEs is important to determine in order to optimize ventilation. Esophageal pressure (Pes) monitoring is the reference standard for IE onset detection and IE quantification but is an invasive technique. 9,10 In daily life conditions, IEs can be more simply detected as a decrease in airway pressure (Paw) with a simultaneous drop in expiratory flow during expiration, followed in some cases by inspiratory flow initiation that fails to trigger the ventilator or, if the expiration has ended, by an inspiratory flow increase that does not trigger the ventilator. 11 This noninvasive method can be easily used with the data provided by ventilators’ software. However, whether it is sufficiently sensitive in patients with impaired inspiratory muscle function due to neuromuscular disease is unclear.
The aim of this study was to assess the performance of noninvasive IE detection based on pressure and flow signals, using Pes monitoring as the reference standard.
Methods
The study complied with the Declaration of Helsinki and was approved by the institutional review board. All participants provided written informed consent before the study.
Patients
During 18 months, we recruited consecutive patients with chronic respiratory failure due to neuromuscular disease who were referred to the home ventilation unit of the Raymond Poincaré University Hospital (Garches, France) for NIV initiation 12 and who underwent Pes monitoring.
Ventilator settings
Positive end-expiratory pressure was used only in patients with nocturnal obstructive events, and the level was determined by nocturnal titration using auto-titrating continuous positive Paw. Pressure support (PS) was determined during daytime trials. Inspiratory pressure was set initially at 8 cm H2O then increased in steps of 1 cm H2O to the level associated with maximal comfort. The inspiratory pressure delivery slope (pressurization rate) was set initially at the fastest level then progressively modified to obtain maximal comfort. The inspiratory trigger was set initially at the most sensitive value and lower sensitivities were then tested to maximize patient comfort. When possible, PS was started with an expiratory trigger at 25% of the maximal inspiratory flow, then increased in 5% steps to 50% of the maximal inspiratory flow to achieve maximal patient comfort. The backup rate was set at 10 breaths/minute and adjusted slightly below the spontaneous respiratory rate, so that the patient could choose to be passively ventilated.
The patients then tested different ventilators with the Pes probe (Gaeltec, Dunvegan, Isle of Skye, UK) in place to allow optimal adjustment of the ventilator settings. 5,13 Further recordings were performed when the Pes change induced by cardiac contraction was less than 1/3 of the Pes swing related to the spontaneous breathing effort (Figure 1). The Pes probe included a portion inserted into the stomach, with a sensor that measured gastric pressure (Pga). Pes and Pga were used to compute transdiaphragmatic pressure (Pdi) as follows: Pdi = Pga − Pes. In contrast to Pes, Pdi measures the strength of the diaphragm contraction without the intercostal and accessory respiratory muscles contribution and the elastic chest-wall recoil. 14 All 10 patients were naive to ventilation before study initiation.

Example of a preincluded patient who was excluded because the Pes change caused by cardiac contraction (d in the figure) was more than 1/3 of the Pes swing related to the spontaneous breathing effort (D in the figure). Pdi: transdiaphragmatic pressure; Pes: esophageal pressure; Paw: airway pressure.
Study protocol
Three ventilators (EliséeTM 150, ResMed, Paris, France; VS IntegraTM, ResMed, Savigny-le-Temple, France; and AiroxTM LegendairTM, COVIDIEN, Hampshire, UK) were used in PS mode with a nasal mask and expiratory valve circuit. Flow was measured using a Fleisch #2 pneumotachograph (Lausanne, Switzerland) situated between the mask and ventilatory circuit. Mask pressure was measured using a differential pressure transducer (Validyne MP 45 ± 100 cm H2O, Northridge, California, USA). Pes and Pga were recorded using a catheter-mounted transducer system (Gaeltec, Dunvegan, Isle of Skye, UK). The position of the catheter was checked by performing an occlusion test. All signals were sampled at 128 Hz and passed to a computer using an analogic-numeric system (MP100, Biopac System, Goleta, California, USA). All measurements were recorded over 5 minutes, at the bedside.
Lung function tests and arterial blood gas analysis were performed. Maximal inspiratory and expiratory pressures were measured.
Detection of IEs
Flow and Paw signals were analyzed visually by the clinician with (invasive method) and without (noninvasive method) Pes to identify IEs. With the noninvasive method, IE was detected as a Paw decrease coinciding with a notch in the flow curve, with no inspiratory triggering of the ventilator. With the invasive method, IE was detected as a Pes swing with no inspiratory triggering of the ventilator. 11,14,15
Statistical analysis
The statistical analysis was conducted using SPSS 15.0 Command Syntax Reference 2006 (SPSS, Chicago, Illinois, USA). Continuous variables were described as mean ± SD and range and dichotomous or categorical variables as percentages. Pes measurement was the reference standard for diagnosing IE. A true-positive result was an IE detected using the noninvasive method and confirmed by the invasive method (Figure 2), a true-negative result was cycling of all breaths by the ventilator (Figure 2), a false-positive result was an IE detected using the noninvasive method but not confirmed by the invasive method, and a false-negative result was an IE detected by the invasive method but missed by the noninvasive method. Standard formulas were used to calculate sensitivity, specificity, positive predictive value (PPV), and negative predictive value (NPV). We used the nonparametric Spearman’s correlation coefficient (ρ) to assess correlations between continuous variables. p Values <0.05 were considered to indicate significant differences.
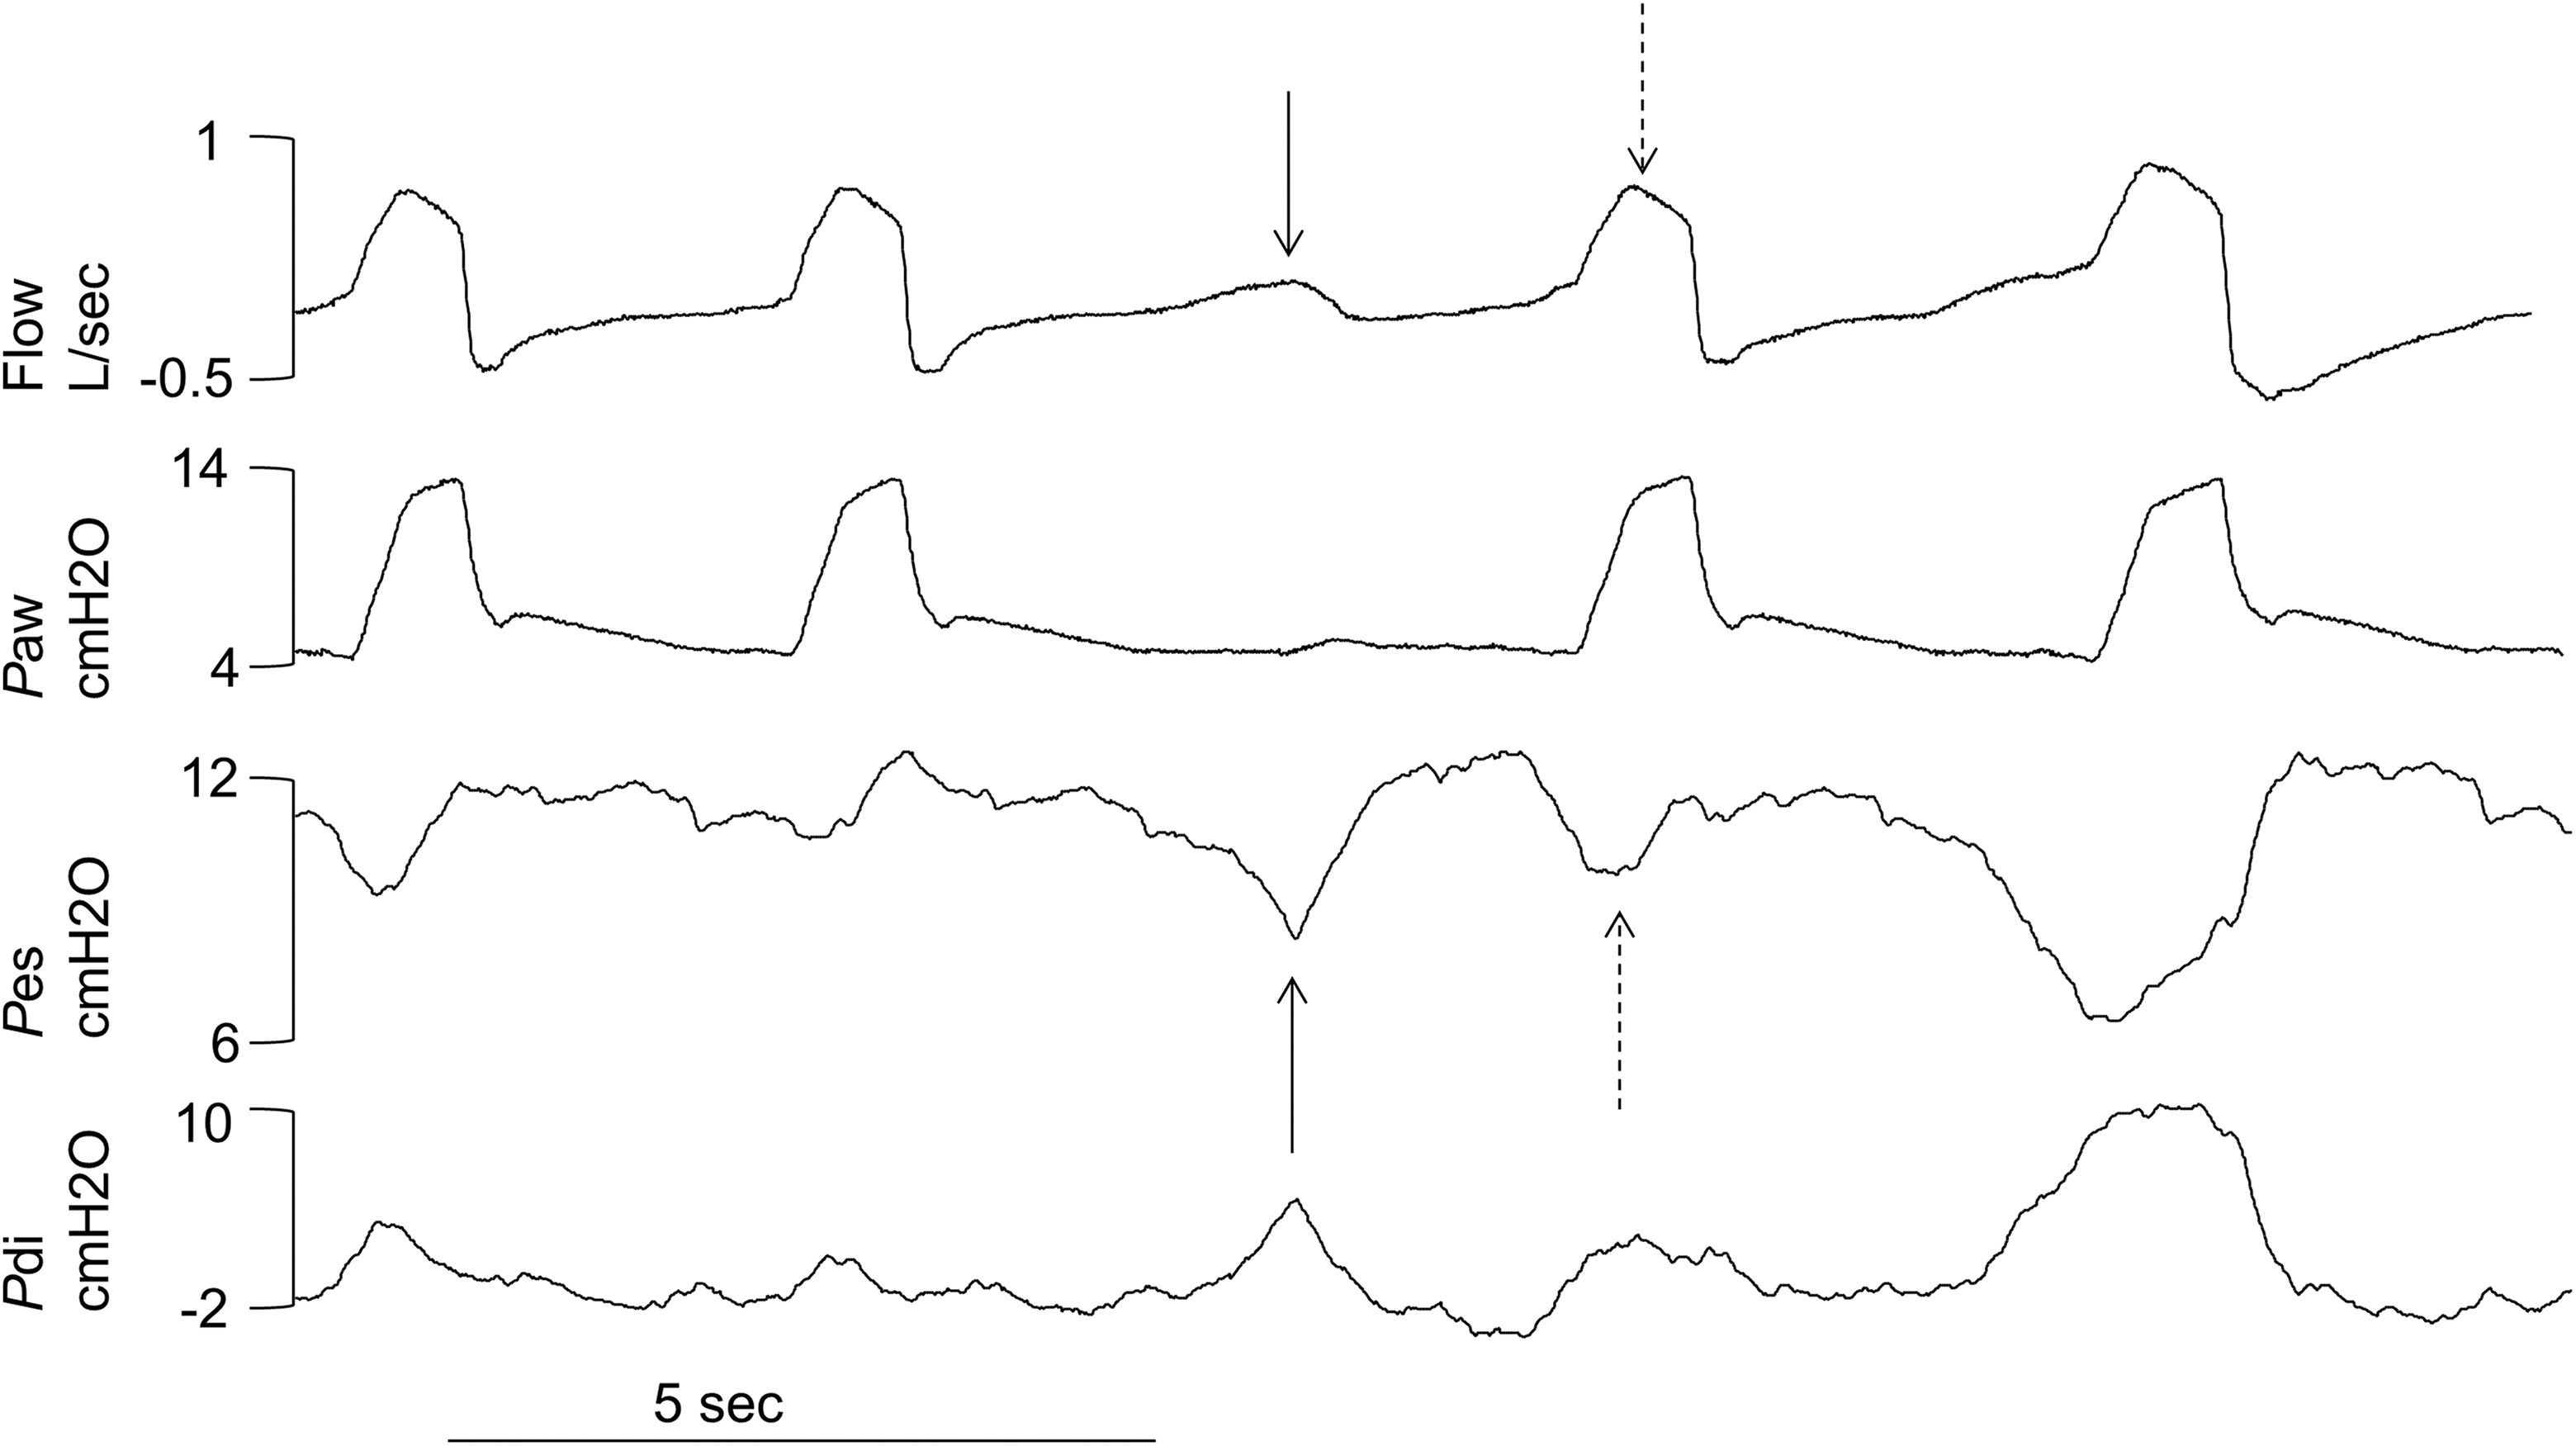
Example of an ineffective effort (black arrows) classified as a true-positive, followed by a breathing effort assisted by the ventilator (dashed arrows) classified as a true-negative. Pdi: transdiaphragmatic pressure; Pes: esophageal pressure; Paw: airway pressure.
Results
Patients
Ten patients were included. Among them, eight tested three ventilators while the remaining two (#9 and #5) tested two ventilators, yielding 28 recordings, each lasting 5 minutes. Table 1 reports the characteristics of the patients. The severity of the restrictive syndrome due to the neuromuscular disease ranged from moderate to severe (mean vital capacity (VC), 58%; lowest VC, 16%). Most patients had diurnal hypercapnia.
Baseline characteristics of the study population.

BMI: body mass index; VC: vital capacity; %pred: percentage of the predicted value; PImax: maximal inspiratory pressure; MD1: myotonic dystrophy type 1; DMD: Duchenne muscular dystrophy; ALS: amyotrophic lateral sclerosis; PaCO2: arterial blood pressure of CO2; PaO2: arterial blood pressure of O2.
Detection of ineffective efforts (IEs)
Of the 2784 respiratory cycles studied, 246 (8.8%) presented IEs detected by Pes monitoring and 354 (12.7%) were controlled by the ventilator. Spearman’s rank correlation coefficient indicated a moderate, statistically significant correlation between the percentage of IEs and the percentage of ventilator-controlled cycles (ρ = 0.50 and p = 0.01).
The noninvasive method identified 311 (11.2%) false-positive IEs overall. The mechanisms of false-positive IEs were distributed as follows: 1.6% premature cycling, 0.1% delayed ventilator triggering, 9.2% cardiac contraction, and 0.3% upper airway instability during expiration.
We found a negative correlation between VC and the prevalence of IE (ρ = −0.70, p = 0.04). Thus, the number of IEs increased as VC declined. In contrast, maximal inspiratory pressure did not correlate with the prevalence of IEs.
IEs during the inspiratory phase
IEs during the inspiratory phase occurred in a single patient (#9), who had 20 such events, all of which were detected by both methods. No other inspiratory IEs were detected by the noninvasive method and the invasive method.
IEs during the expiratory phase
Table 2 reports the expiratory IEs in individual patients. Sensitivity could not be determined for one recording in four patients (#3, #5, #7, and #10) due to the absence of true positives. Mean sensitivity and specificity of the noninvasive method versus the invasive method of IE detection were 97.5% ± 5.3% and 91.4% ± 13.7%, respectively. NPV was 98.1% ± 8.2% and PPV was 67.6% ± 33.8%.
Se and Sp of the pressure and flow signal-based method for detecting ineffective efforts in each patient with each ventilator.

IPAP: inspiratory positive airway pressure; EPAP: expiratory positive airway pressure; CC: controlled cycles; BR: backup rate; bpm: breaths per minute; Se: sensitivity; Sp: specificity.
Although the patients were ventilated with an expiratory valve circuit, we measured the leaks during the 5-minute test by comparing inspiratory and expiratory volumes. Mean leak volume was 3.8 ± 2.5 L/minute (Table 2). Mean leak value did not correlate significantly with sensitivity or specificity of noninvasive expiratory IE detection (ρ = 0.1 and p > 0.05). No correlation was found between the number of expiratory IEs and the PS level.
Discussion
Using flow, Paw, Pes, and Pdi signals, we observed a mean IE index of 8.8%. Our results are similar and even greater than in other studies performed on awake neuromuscular patients. 5,6 One possible explanation is that all our patients were naive to ventilation upon inclusion. Another explanation could be that the majority of our patients presented a myotonic dystrophy type 1 (MD1). Marked respiratory effort instability is a well-known feature of MD1 16,17 and this population frequently presents irregular breathing during wakefulness. 18 This may increase the difficulty in ventilator settings adaptations in order to avoid IE, especially the inspiratory trigger sensitivity and the inspiratory pressure level which are usually adjusted with the patient’s usual and relatively stable inspiratory effort. This foreseeable difficulty of ventilator settings adaptations in this subpopulation due to the instability of the ventilator control, may partly explain the important nonadherence to NIV which in turn may jeopardize the survival of DM1 patients. 19 Interestingly, in the past, studies exploring patient–ventilator interaction in different chronical pathologies did not find differences despite very different underlying diseases, 6,20 or did not specify the diagnosis of the neuromuscular disorders. 5,6 Nevertheless, even if IE could be more frequent in MD1 patients than in other neuromuscular disorders, these asynchronies have also been observed in other neuromuscular disorders such as Duchenne muscular dystrophy patients 21 and amyotrophic lateral sclerosis patients. 22 Moreover, the standard method used in our study for the detection of IE (Pes) is a reliable method which is not influenced by the type of underlying disease.
In this observational study, a noninvasive method based on airway flow and pressure signals had good sensitivity and specificity for detecting IEs, compared to the reference standard based on Pes and Pdi. Sensitivity was above 90% except in two patients with MD1. These patients had neither severe inspiratory dysfunction nor severe leaks. However, as MD1 patients present respiratory effort instability, 16 –18 the lower sensitivity in these two patients is ascribable to a small number of inspiratory efforts detectable only by Pes measurement. Despite these false negatives, the overall good performance of the noninvasive method translated into a high NPV.
On the other hand, specificity was ≤90% in four patients. Specificity was lowest in patient #10, in whom inspiratory efforts were readily confused with cardiac contractions affecting both Paw and airway flow signals, leading to a high false-positive rate (Figure 3). Such cardiac artifacts could be easily detected by combining flow and pressure signal monitoring with an electrocardiographic signal or a pulse oximeter plethysmograph waveform.

Patient #5: cardiac contractions affecting both airway pressure and flow signals were mistaken for ineffective efforts, leading to a high false-positive rate. Pdi: transdiaphragmatic pressure; Pes: esophageal pressure; Paw: airway pressure.
The other main source of false positives was premature cycling of the ventilator (patients #3, #4, and #8) 11 which may affect both flow and pressure curves, therefore simulating a new inspiratory effort (Figure 4). In premature cycling, inspiratory flow termination by the ventilator occurs too early, before the end of the patient’s inspiratory effort. The usual exponential expiratory flow curve is altered by the persistence of the inspiratory effort producing a pattern that suggests an IE. It is important not to confuse premature cycling with an IE considering that premature cycling can be corrected by changes in inspiratory time or cycling settings, whereas ineffective efforts require different adjustments such as changes in level of positive end expiratory pressure.
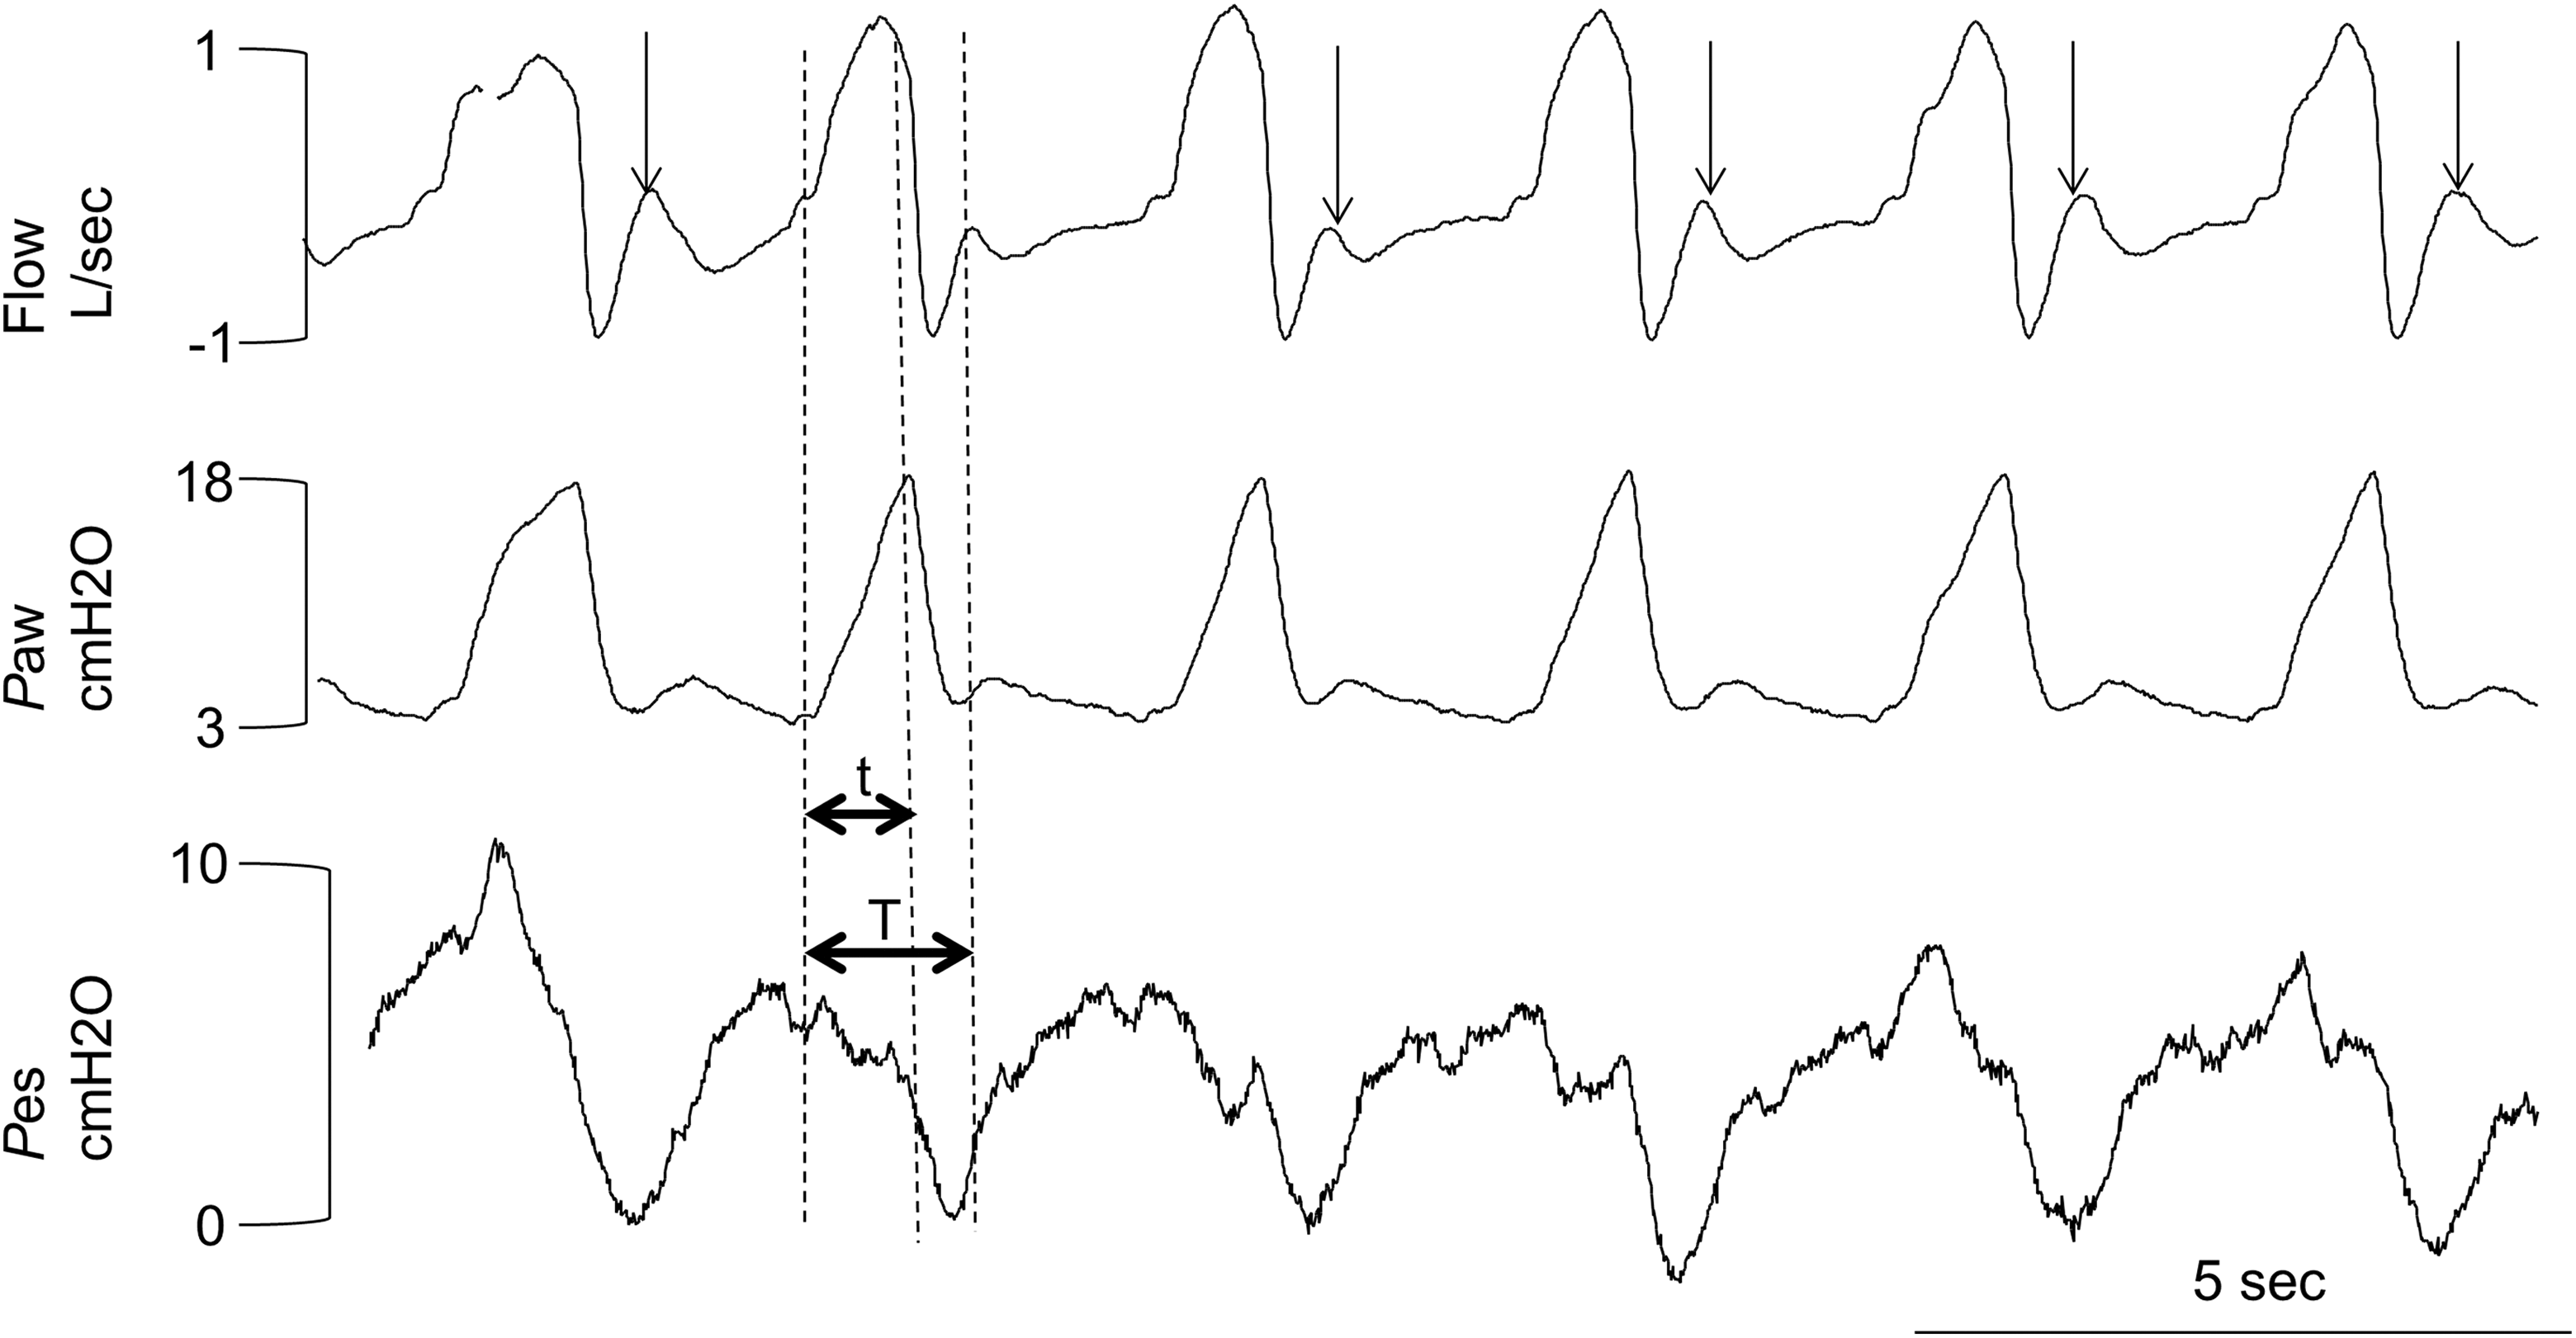
Example of premature cycling of the ventilator (horizontal black arrows where t represents the insufflation duration and T the inspiratory effort duration) simulating ineffective efforts (false positives) when analyzing only flow and Paw without Pes. Pdi: transdiaphragmatic pressure; Pes: esophageal pressure; Paw: airway pressure
Another source of false-positive IE detection, that decreased specificity, was upper airway obstruction during expiration, as seen in patient #1. Upper airway obstruction can be detected during wakefulness and is correlated with sleep-disordered breathing. 23,24 Intermittent upper airway obstruction has been documented during both inspiration and expiration in awake healthy individuals and patients with obstructive sleep apnea syndrome, during muscular relaxation. 25 Our patients may have been at high risk for upper airway obstruction due to both the mechanical ventilation (which promotes muscle relaxation) and the neuromuscular disease. Mechanisms may include pharyngeal hypotonia or neuropathy, bulbar function impairment, macroglossia, and low pulmonary volumes. 7 Furthermore, NIV can induce central hypocapnic events responsible for expiratory pharyngeal narrowing, 5,7,26 as shown by the recording from patient #1 with the Legendair ventilator (Figure 5).

Example of abrupt changes in the expiratory flow signal due to upper airway obstruction during expiration simulating ineffective efforts and therefore leading to a high positive rate, whereas no respiratory effort was detected on the Pes signal. Pdi: transdiaphragmatic pressure; Pes: esophageal pressure; Paw: airway pressure.
In patient #7, false-positive IEs were induced by delayed ventilator triggering (Figure 6), which was probably due to the high threshold at which the ventilator trigger was set.

Delayed triggering of the ventilator simulating ineffective efforts. The dashed line indicates zero flow. The solid vertical line and black arrow mark the beginning of an inspiratory effort, indicating delayed triggering of the ventilator. Pdi: transdiaphragmatic pressure; Pes: esophageal pressure; Paw: airway pressure.
Finally 82% of false-positive values were due to cardiac contractions found in a single patient (#10). These false positive values could be excluded by using an electrocardiographic signal or a pulse oximeter plethysmograph waveform which would improve the positive predictive value from 68% to 90%. In our study, 14% of false-positive IEs were due to premature cycling. This asynchrony has been described as a positive deflection just after the end of inspiratory phase of the flow waveform. 27 It can be identified visually by an experienced clinician. The false-positive values due to this asynchrony were excluded, and in the hypothetical case of the detection of IE by a very experienced clinician, we would have obtained a positive predictive value of 75%.
Leaks correlated neither with sensitivity nor with specificity of noninvasive IE detection. This may be due to the small leak volumes or to the conditions of the recordings as, during wakefulness, patients are more able to control their upper airway muscles than during sleep.
In conclusion, our data demonstrate that flow and pressure signals, which can be provided by the ventilator, can be used to efficiently detect IEs. This noninvasive method is easy to use, fast, and requires no additional parameters than those routinely recorded. Adding electrocardiographic recordings and/or pulse oximeter plethysmography would be helpful to differentiate IEs from cardiac artifacts. Our results suggest that IEs may correlate with the number of controlled cycles, which is rarely provided by ventilator software. Providing this information in addition to pressure and flow signals may improve the detection of periods at high risk for IEs.
Footnotes
Declaration of conflicting interests
The author(s) declared no potential conflicts of interest with respect to the research, authorship, and/or publication of this article.
Funding
The author(s) disclosed receipt of the following financial support for the research, authorship, and/or publication of this article: This study was supported by a grant from the French Ministry of Health (PHRC).