
Abstract
Introduction
The Singapore Study of Macro-Angiopathy and microvascular Reactivity in Type 2 Diabetes (SMART2D) is a prospective cohort study which was started in 2011 to investigate the effect of risk factors on vascular function and diabetes-related complications in Asians. We aimed to compare the longitudinal change in risk factors by accounting for batch effect and assess the tracking stability of risk factors over time in patients recruited for SMART2D. In this study, we (1) described batch effect and its extent across a heterogenous range of longitudinal data parameters; (2) mitigated batch effect through statistical approach; and (3) assessed the tracking stability of the risk factors over time.
Methods
A total of 2258 patients with type 2 diabetes mellitus (T2DM) were recruited at baseline. The study adopted a three-wave longitudinal design with intervals of 3 years between consecutive waves. The changes in a few selected risk factors were assessed after calibration, assuming patients with similar demographic and anthropometry profile had similar physiology. The tracking pattern of the risk factors was determined with stability coefficients derived from generalised estimating equations.
Results
The medians of the longitudinal differences in risk factors between the waves were mostly modest at <10%. Larger increases in augmentation index (AI), aortic systolic blood pressure (BP) and aortic mean BP were consistently observed after calibration. The medians of the longitudinal differences in AI, aortic systolic BP and aortic mean BP between the waves were <2% before calibration, but increased slightly to <5% after calibration. Most of the risk factors had moderate to high tracking stability. Muscle mass and serum creatinine were among those with relatively high tracking stability.
Conclusions
The longitudinal differences in parameters between the waves were overall modest after calibration, suggesting that calibration may attenuate longitudinal differences inflated by non-biological factors such as systematic drift due to batch effect. Changes of the hemodynamic parameters are robust over time and not entirely attributable to age. Our study also demonstrated moderate to high tracking stability for most of the parameters.
Introduction
Diabetes Mellitus (DM) poses a major worldwide public health concern. 1 It is one of the top 10 global causes of mortality. 1 According to the International Diabetes Federation, the total number of adults with DM is about 537 million in 2021, and this is expected to increase to 643 million by 2030. 2 The most common type of DM is Type 2 Diabetes Mellitus (T2DM) which accounts for about 90% of all DM. 2
DM leads to a myriad of dysfunctions in the cardiovascular system, retina, kidney, liver, foot, brain and peripheral nervous system. 3 Given that the pathophysiological mechanisms underlying the development and progression of complications in T2DM remain poorly understood, it is imperative to move beyond glycemic control and explore other risk factors which may serve as potential therapeutic targets for future intervention and clinical management. These risk factors can be traditional (e.g. blood pressure and lipids) or novel (e.g. body composition, vascular dysfunction, proteomics and metabolomics).
While a longitudinal study design provides useful information on the trajectories of clinical parameters over time, it is important to account for the biological (i.e. more likely to be “signals” that are informative) and non-biological (i.e. probably non-informative “noise” that will require some mitigation) effects from the time gaps between sample collection. 4 Biological changes may arise due to aging, lifestyle modification and treatment for the diseases that develop over time. Batch effects are data variation arising from technical sources such as different experimental locations, handlers, machine types, reagents, instrument drift, technical variation within workflow and biological artifacts.4–6 For example, there may be batch effects if two technicians conducted different subsets of an experiment or two different lots of reagents were used for an experiment. 7 Batch effect will interfere with downstream statistical analysis, for example, by detecting false positive differential expression between batches that have no biological meaning. However, careless correction of batch effect can result in failure to detect true biological signal within the data. Proper handling of batched data is thus paramount for accurate and reproducible research.
Another essential aspect of describing longitudinal development of exposures and outcomes over time is tracking.8–11 Tracking describes the ability of a characteristic to remain stable over time.9–11 It also allows prediction of later measurements based on earlier measurements.10–12 Tracking clinical parameters can facilitate decision on whether subjects should be screened early in life to develop preventive strategies.10–12
Using data from T2DM patients recruited and followed up from a longitudinal study in Singapore, this study aims to (1) describe batch effect and its extent across a heterogenous range of longitudinal data parameters which include clinical measurements, laboratory-developed parameters and research-based laboratory parameters; (2) mitigate batch effect through statistical approach; and (3) assess the tracking stability of risk factors over time. The findings will shed light on how the data changes with and without calibration. The findings may also guide us on the use of the longitudinal parameters in future assessment of diabetic complications.
Methods
The Singapore Study of Macro-Angiopathy and microvascular Reactivity in Type 2 Diabetes (SMART2D) was started in 2011 to study the impact of T2DM on blood vessel function and diabetes-related complications including diabetic kidney disease, retinopathy, diabetic foot syndrome, cognitive dysfunction and mood disorders. It is a prospective cohort study that recruited T2DM patients from a public hospital and primary care polyclinics in the northern region of Singapore. It adopted a three-wave longitudinal design with intervals of 3 years between consecutive waves. The patients were first recruited between 2011 and 2014 (first wave). They were followed up between 2014 and 2017 (second wave). The second follow-up occurred from 2019 onwards and is ongoing (third wave). The following exclusion criteria were applied: active malignancy, active inflammation, intake of oral steroids with dosage more than 7.5 mg per day and/or intake of non-steroidal anti-inflammatory drugs on the day of assessment. Patients’ data were collected from clinical measurements, laboratory-developed tests and research-based laboratory tests. The National Healthcare Group Domain Specific Review Board in Singapore granted ethics approval for the study. All the participants gave written informed consent. This study adhered to the guidelines outlined in the STrengthening the Reporting of OBservational studies in Epidemiology (STROBE) Statement.
Data collection
Trained research nurses collected data on demographics, medical history and medications using a standardised questionnaire. The information were also verified with clinical case-notes.
Body weight and height were measured using standard weighing scale and stadiometer respectively. Body mass index (BMI) was calculated as body weight divided by square of height (kg/m2). Waist circumference (WC) was measured with a tape measure level with the navel and from the top of the hip bone all the way around the waist. Hip circumference was measured with a tape measure around the largest part of the hips. Waist-hip ratio (WHR) was calculated as WC divided by hip circumference.
Clinical measurements
Pulse wave velocity (PWV) was measured with SphygmoCor® (AtCor Medical, Sydney, Australia). This instrument has good validity and reproducibility even in subjects with DM.13,14 It utilises the foot-to-foot technique to measure carotid-femoral PWV. 15 An applanation tonometer was used to detect the pulse waveform at the carotid and femoral arteries. Based on 9 to 10 waves for each analysis, the mean amount of transit time for the waves between carotid and femoral arteries was determined. PWV was calculated as the distance between the recording areas in metres divided by passage time in seconds. 14 It is a measurement of arterial stiffness and is known to be an independent predictor of cardiovascular risk in T2DM patients. 16 Aortic systolic blood pressure (SBP) and aortic diastolic blood pressure (DBP) were quantitated as the maximum and minimum pressures of the central waveform respectively by SphygmoCor®. 17 The SphygmoCor® also generated reading of aortic mean blood pressure (BP), which is the average pressure for the aortic waveform, and augmentation index (AI), which is calculated as the ratio of augmentation pressure (difference between first peak and second peak) over pulse pressure (difference between SBP and DBP). 18
Body composition was assessed using tetra-polar multi-frequency bio-impedance analysis (BIA) (InBody-S10, South Korea). Having fasted for at least 6 hours overnight, the patients lay in a supine position with electrodes attached to their four limbs in a tetra-polar formation. Weak alternating electric currents were passed through the electrodes at frequencies of 1, 5, 50, 250 and 1000 kHz. 19 Extracellular water (ECW), skeletal muscle mass (SMM) and visceral fat area (VFA) were quantified based on cell membrane resistance to frequency currents. 20 Batch effect from each wave could have arisen from different research nurses measuring the data. However, as these clinical parameters were captured on the spot that the patients were recruited or followed up, we expect them to be the least vulnerable to batch effect compared to the other parameters from blood and urine samples, which are additionally exposed to contamination, freeze-thaw and storage effect.
Laboratory-developed parameters
Fasted blood and urine samples were collected in the morning and delivered to the hospital laboratory for quantification as follows: haemoglobin A1c (HbA1c) using Tinaquant Haemoglobin A1c Gen.3; serum creatinine, low-density lipoprotein cholesterol (LDL-C), high-density lipoprotein cholesterol (HDL-C), total cholesterol (TC) and triglycerides (TG) using enzymatic colorimetric test; and fasting plasma glucose (FPG) using hexokinase method (COBAS-Roche, Mannheim, Germany). These laboratory-developed parameters were measured on the day that the patients were recruited in the first wave and on the days that the patients were followed up in subsequent waves. Though the biochemical assay methodology remained the same throughout the period of SMART2D and the samples were processed almost immediately, batch effects from each wave could have arisen from different handlers.
Research-based laboratory parameters
Fasting plasma C-peptide was measured with ELISA (Mercodia, Uppsala, Sweden). HOMA2-B (%) and HOMA2-IR were calculated based on fasting glucose and C-peptide (https://www.dtu.ox.ac.uk/homacalculator/, version 2.2.3). Though these research-based laboratory parameters were collected on the day that the patients were recruited or followed up, they were processed at a later period on a need-to basis. As the fasting plasma C-peptide samples from the third wave were amid processing at the point of our analysis, they were excluded from our study. Though proper storage facilities and processes were in place, batch effect from each wave could have arisen from the storage duration and we expect these research-based laboratory parameters to be the most vulnerable to batch effect compared to the other parameters.
Outcomes
The outcomes are (i) longitudinal differences in the parameters between the waves and (ii) stability coefficients for these parameters.
Statistical analysis
The characteristics of the patients at the three waves of SMART2D were summarised using number with percentage for categorical variables, and median with interquartile range for continuous variables.
Calibration is a statistical technique that attempts to reduce systematic confounding between data measured from consecutive time points. Calibration was done in an attempt to account for biases that might arise due to time gap between the various waves of SMART2D. 4 The calibration factor was calculated based on patients who were successfully followed up and matched by variables that we postulated will affect physiology over time. Among patients who were successfully followed up, individual-level pairwise differences in parameters between the first and second waves of SMART2D and between the second and third waves were summarised using median (absolute value) and median absolute deviation (variability) of the differences. As the parameters were in varying units, we also looked at the relative pairwise differences in percentage. Sign test was used to compare the pairwise differences and comparisons were done before and after calibration. Ideally, calibration will reduce batch effect, hence the pairwise differences should narrow after calibration and remain in the same direction as before calibration. Two sets of matching variables were used in calibration (first set comprising age, gender, BMI and WHR; second set comprising age, gender, HOMA2-IR and HOMA2-B).
Patients lost to follow-up in the second and third wave of SMART2D were excluded from the analysis of pairwise differences in parameters. The reasons for loss-to-follow-up were not captured, but we postulated that it could be due to study fatigue, lack of time or death. Missing data were imputed using multiple imputation by chained equation and calibration without matching were performed as part of sensitivity analysis to see how robust our results are. More details are described in Supplementary Appendix 1 and Supplementary Figure 1.
A population-level stability coefficient for each parameter was estimated using generalised estimating equation (GEE). GEE is a statistical method for analysis of correlated data whereby individuals can have different number of measurements at different time points (e.g. serial creatinine). 21 A stability coefficient of more than 0.7 indicates that the parameter is longitudinally stable and predictable whereby its trend could be flat, rising or dropping over time, whereas a stability coefficient of less than 0.3 indicates that the parameter fluctuates over time. 11 Ideally, narrower differences in parameters after calibration in the same direction as before calibration were expected. However, if wider differences and/or differences in opposite direction were observed after calibration, we would gauge if the parameter was inherently unstable (based on its stability coefficient) or if our calibration process needed to be improved. To account for possible confounding by changes in age, BMI and WHR over time as well as differences by gender, these variables were included as covariates in the GEE. The analysis was repeated using age, gender, HOMA2-B and HOMA2-IR as covariates in the GEE. More details are described in Supplementary Appendix 2.
All statistical analyses were conducted using STATA Version 14.0 (STATA Corporation, College Station, Texas). A p-value less than 0.05 was deemed as statistically significant.
Results
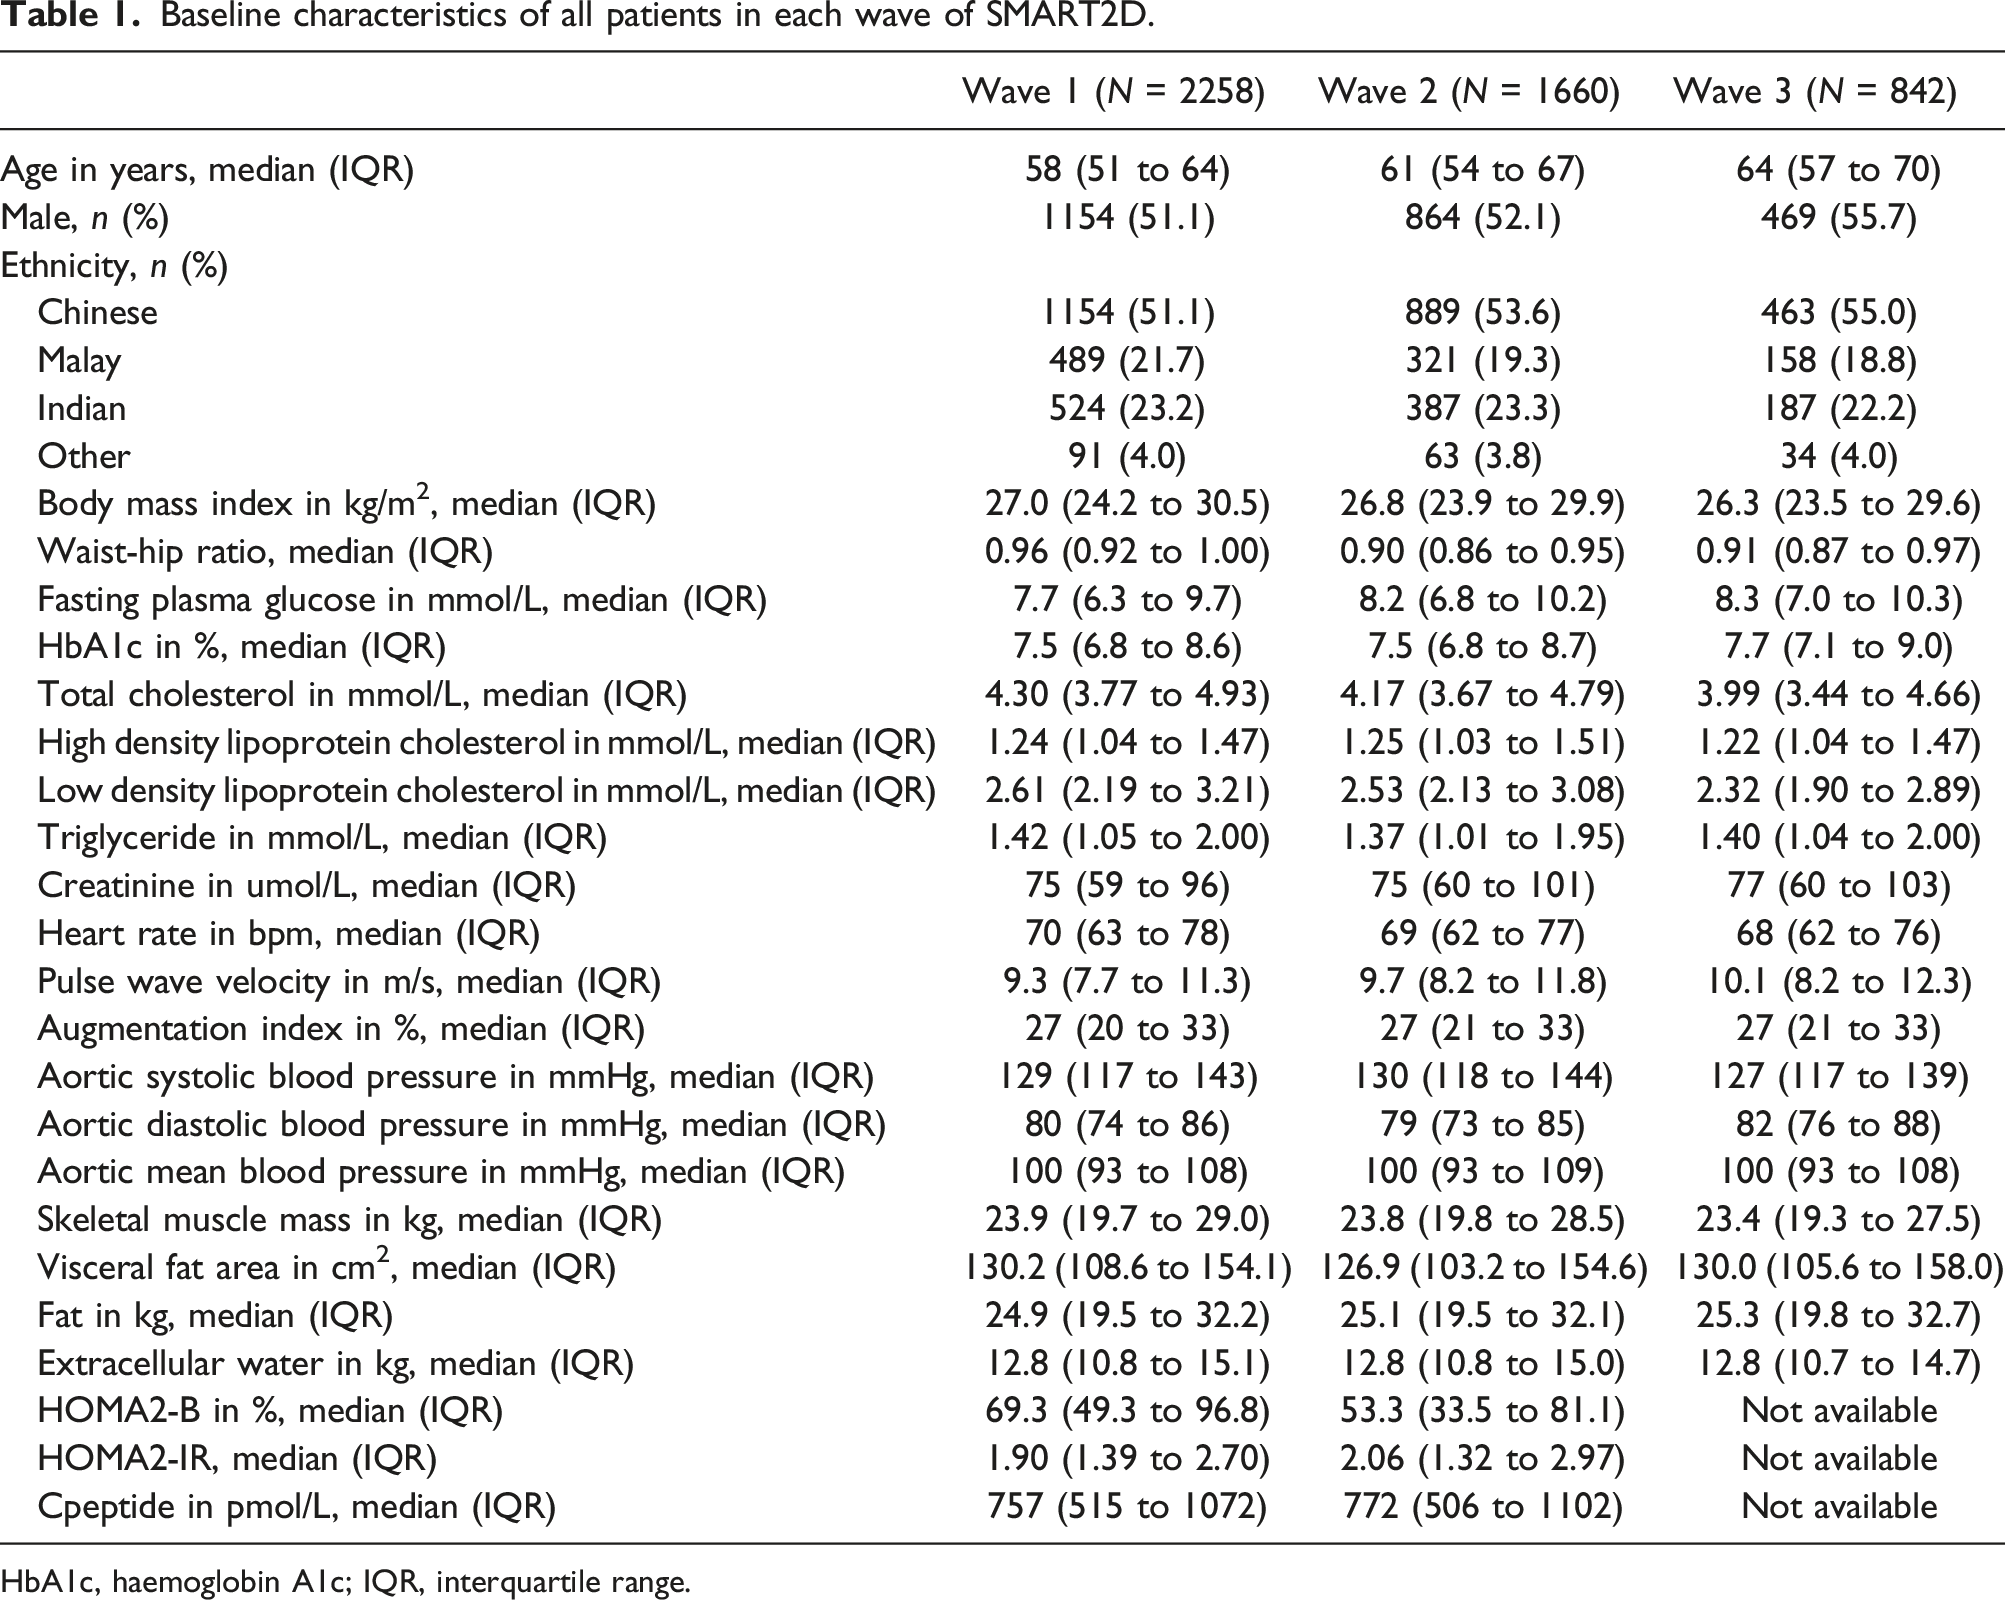
We included all patients with valid data at baseline and those who were successfully followed up for subsequent waves of SMART2D (Figure 1). Of the 2258 patients recruited at baseline, 1660 were followed up in the second wave and 842 remained in the third wave. The characteristics of patients in each wave were shown in Table 1. The median age was 58 years (IQR 51-64) at baseline and increased correspondingly by 3 years for each subsequent wave that was about 3 years apart. Slightly more than half of the patients were males and the proportion of males increased slightly in the third wave. Slightly more than half of the patients were Chinese, close to a fifth were Malays and close to a quarter were Indians across the three waves of SMART2D. Overview of patients at each wave of SMART2D. Baseline characteristics of all patients in each wave of SMART2D. HbA1c, haemoglobin A1c; IQR, interquartile range.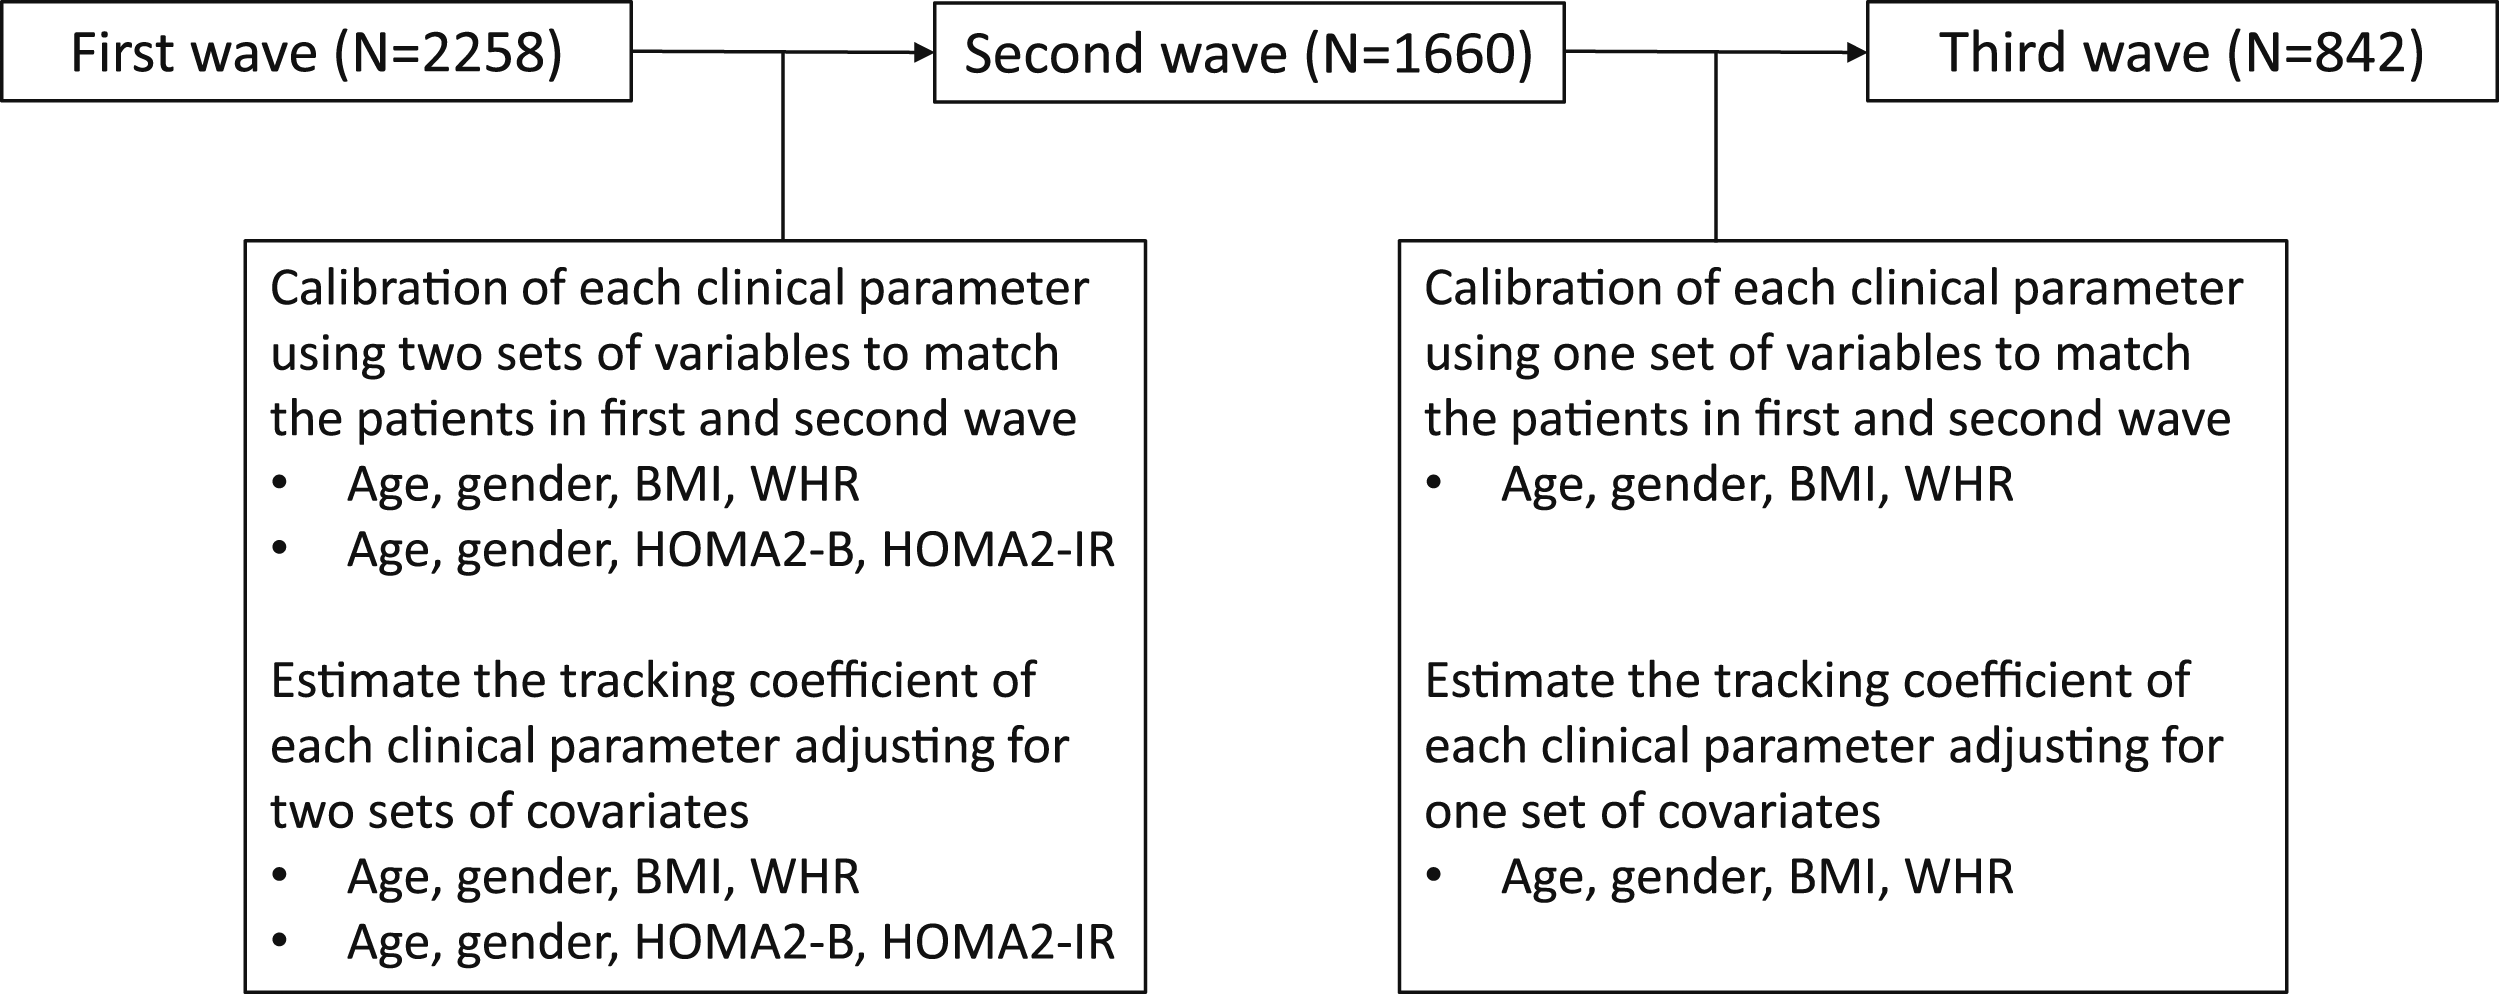
Individual-level longitudinal differences between the first and second waves
Absolute [wave 2 – wave 1] and relative [(wave 2 – wave 1)/(wave 1)] pairwise differences between the first and second waves of SMART2D, before and after calibration by age, sex, BMI, WHR.

BMI, body mass index; HbA1c, haemoglobin A1c; IQR, inter-quartile range; MAD, median absolute deviation; WHR, waist-hip ratio.
p-values <0.05, denoting statistical significance, were shown in bold.

Comparison of the pairwise difference (shown using median with interquartile range in A and B) and stability coefficient (shown using mean with 95% confidence interval in C and D) of the parameters between the first and second waves of SMART2D. BMI, body mass index; WHR, waist-hip ratio; FPG, fasting plasma glucose; HbA1c, haemoglobin A1c; TC, total cholesterol; HDL-C, high-density lipoprotein-cholesterol; LDL-C, low-density lipoprotein cholesterol; TG, triglycerides; Cr, creatinine; HR, heart rate; PWV, pulse wave velocity; AI, augmentation index; ASBP, aortic systolic blood pressure; ADBP, aortic diastolic blood pressure; AMBP, aortic mean blood pressure; SMM, skeletal muscle mass; VFA, visceral fat area; ECW, extracellular-to-total body water.
Absolute [wave 2 – wave 1] and relative [(wave 2 – wave 1)/(wave 1)] pairwise differences between the first and second waves of SMART2D, before and after calibration by age, sex, HOMA2-B, HOMA2-IR.

BMI, body mass index; HbA1c, haemoglobin A1c; IQR, inter-quartile range; MAD, median absolute deviation; WHR, waist-hip ratio.
p-values <0.05, denoting statistical significance, were shown in bold.
Population-level tracking stability in the first and second waves
Having adjusted for age, gender, BMI and WHR, the stability coefficients ranged from 0.23 to 0.90, with most of the parameters being at least moderately stable (Table 2 and Figure 2(c)). The stability coefficient for creatinine was the highest at 0.90 (95%CI 0.86 to 0.94). On the other hand, the stability coefficients were low for ECW (0.23, 95%CI 0.20 to 0.26) and FPG (0.29, 95%CI 0.24 to 0.33). HOMA2-B (0.37, 95%CI 0.29 to 0.45) and HOMA2-IR (0.32, 95%CI 0.26 to 0.39) also had stability coefficients that were moderately-low.
Similarly, the stability coefficients were above 0.30 for all parameters except for FPG after adjustment for age, gender, HOMA2-IR and HOMA2-B (Table 3 and Figure 2(d)). The stability coefficient for creatinine was the highest (0.87, 95%CI 0.77 to 0.98), while it was the lowest for FPG (0.26, 95%CI 0.16 to 0.35). Notably, stability improved for parameters related to body composition (muscle mass, VFA, fat, ECW), compared to adjustment for age, gender, BMI and WHR.
Individual-level longitudinal differences between the second and third waves
Absolute [wave 3 – wave 2] and relative [(wave 3 – wave 2)/(wave 2)] pairwise differences between the second and third waves of SMART2D, before and after calibration.

BMI, body mass index; HbA1c, haemoglobin A1c; IQR, inter-quartile range; MAD, median absolute deviation; WHR, waist-hip ratio.
p-values <0.05, denoting statistical significance, were shown in bold.
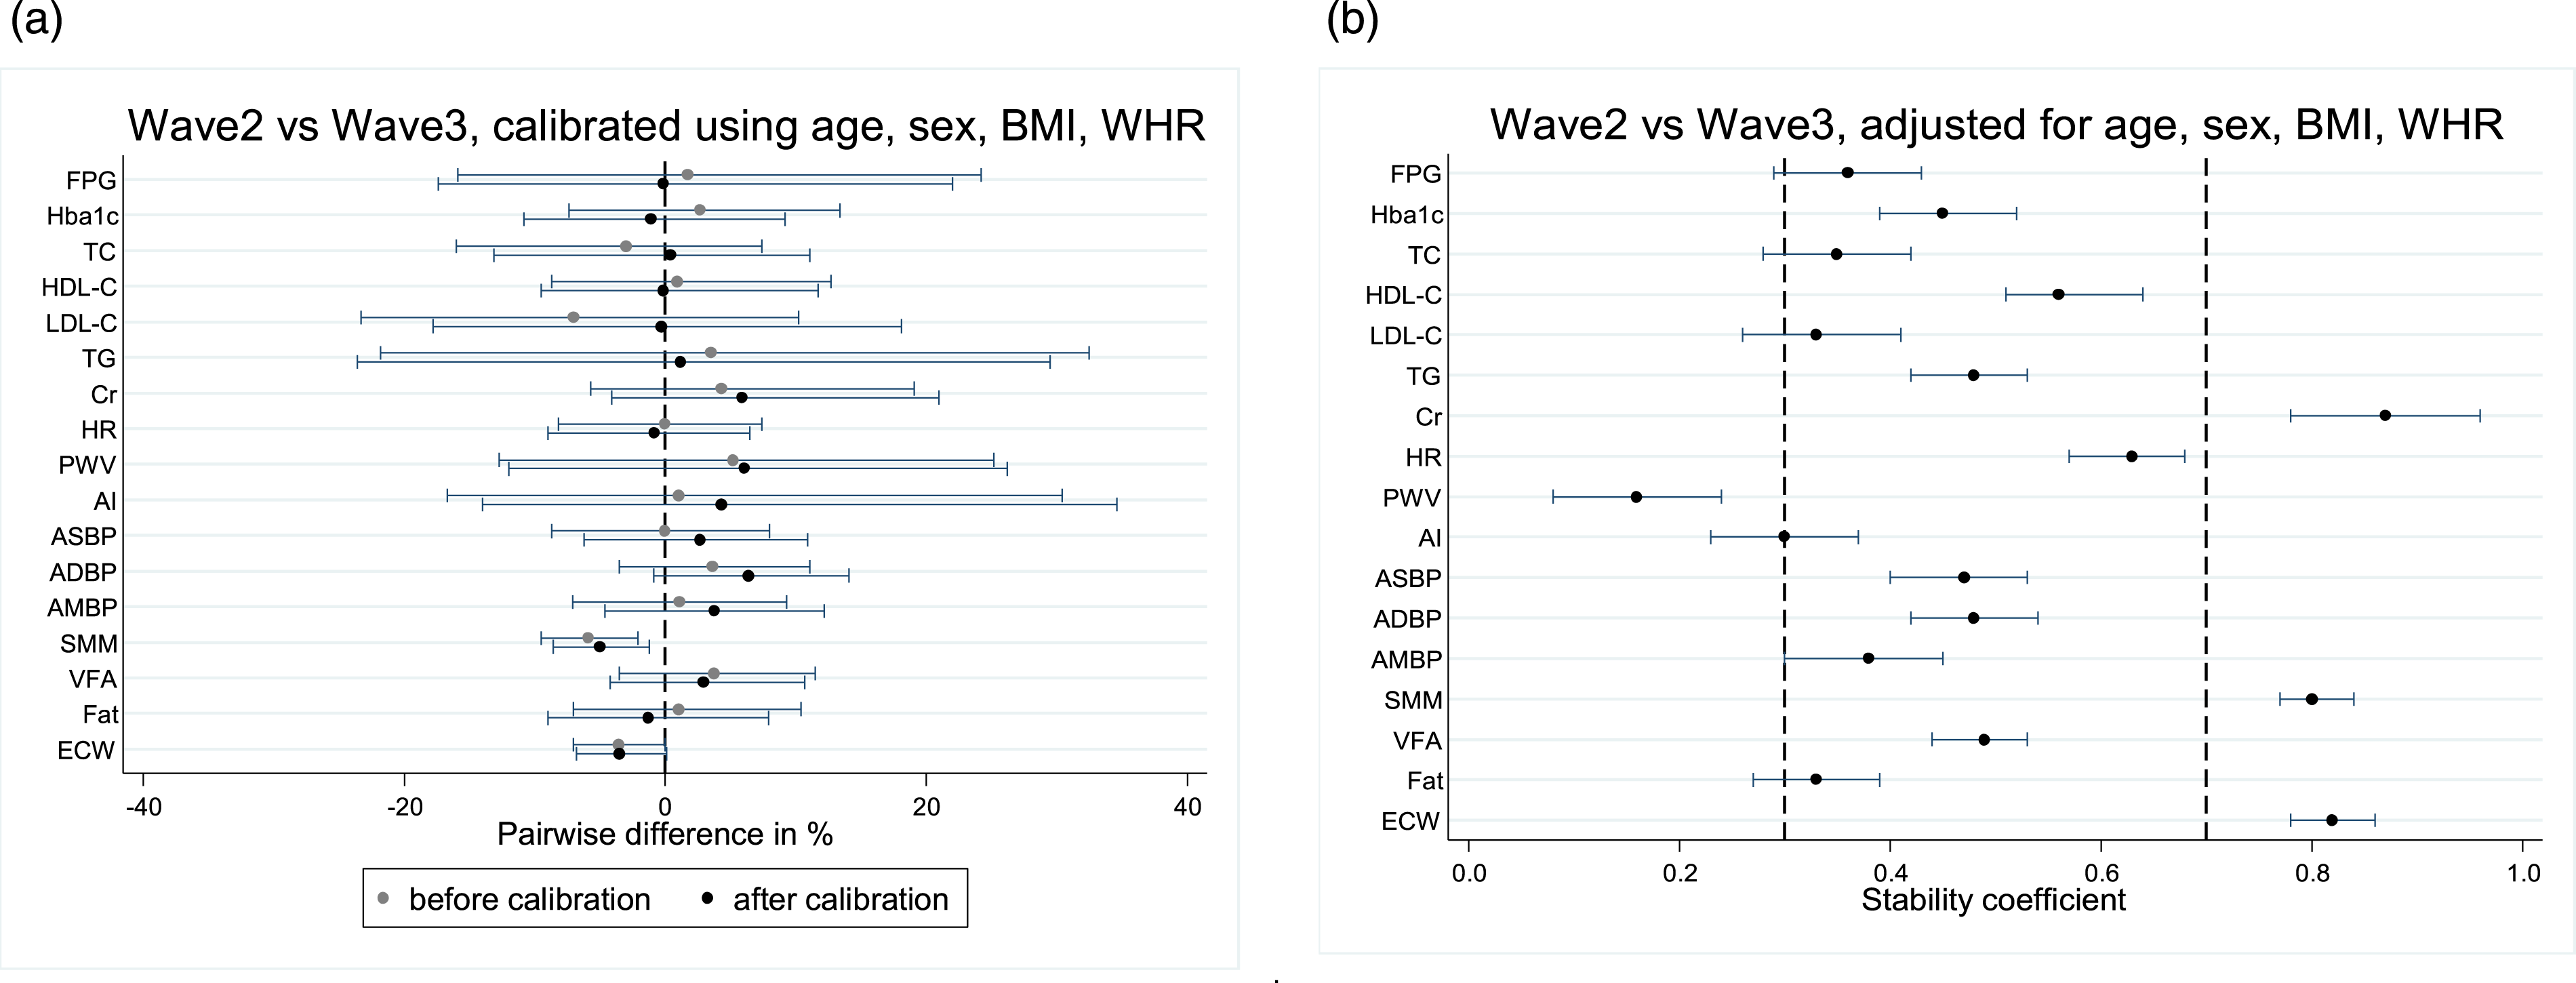
Comparison of the pairwise difference (shown using median with interquartile range in A) and stability coefficient (shown using mean with 95% confidence interval in B) of the parameters between the second and third waves of SMART2D. BMI, body mass index, WHR, waist-hip ratio; FPG, fasting plasma glucose, HbA1c, haemoglobin A1c; TC, total cholesterol; HDL-C, high-density lipoprotein-cholesterol; LDL-C, low-density lipoprotein cholesterol; TG, triglycerides; Cr, creatinine; HR, heart rate; PWV, pulse wave velocity; AI, augmentation index; ASBP, aortic systolic blood pressure; ADBP, aortic diastolic blood pressure; AMBP, aortic mean blood pressure; SMM, skeletal muscle mass; VFA, visceral fat area; ECW, extracellular-to-total body water.
Population-level tracking stability in the second and third waves
Having adjusted for age, gender, BMI and WHR, most of the stability coefficients were above 0.30, ranging from 0.16 (95%CI 0.08 to 0.24) for PWV to 0.87 (95%CI 0.78 to 0.96) for creatinine. Tracking stability was consistently high for serum creatinine and muscle mass, but low for FPG.
Sensitivity analyses
The similarities in results based on the original data (complete-case analysis with imputation) and those after imputation of missing data, give us confidence that the inferences drawn from the original data hold despite having some bias from lost to follow-up (Supplementary Tables 2A to 2C). When calibration was done without matching for any variable, pairwise differences for almost all parameters disappeared, indicating that such calibration would have simply balanced out the differences in data from various waves. This highlights that proper calibration is essential to differentiate the true effect (for retention) from batch effect (for removal).
Discussion
We have attempted to show that the proposed calibration method by Makinen VP and Colleagues (2022) 4 could address part of the inherent batch effect from repeated measurements over time. The longitudinal differences in parameters between the waves were overall modest after calibration, suggesting that calibration may attenuate longitudinal differences inflated by non-biological factors such as systematic drift due to batch effect. The calibration method revealed consistent larger increases in AI, aortic SBP and aortic mean BP over time. The consistent larger increases after calibration suggested that prospective changes in these measurements may be real and pronounced. There was moderate to high stability for most of the parameters. The stability of AI, aortic SBP and aortic mean BP was lower than most of the other parameters, implying that random fluctuations were higher among these parameters. Muscle mass and serum creatinine were among the parameters with consistently high tracking stability between consecutive waves. On the other hand, the stability coefficient for FPG was relatively low. Using different sets of variables to match the patients for calibration and to adjust as covariates for estimation of stability coefficients will affect different parameters differently.
Larger increase in HOMA2-B and HOMA2-IR between first and second waves
We observed relatively larger increase in HOMA2-B and HOMA2-IR after calibration by age, sex, BMI and WHR. Of note, the Pearson correlations between HOMA2-B and HOMA2-IR with BMI and WHR were weak with correlation coefficients as follows: HOMA2-B and BMI (r = 0.175), HOMA2-B and WHR (r = 0.128), HOMA2-IR and BMI (r = 0.252), and HOMA2-IR and WHR (r = 0.175). The weak correlations may suggest that the matching variables (BMI and WHR) may not be suitable for calibration of HOMA2-B and HOMA2-IR. As the stability coefficients of HOMA2-B and HOMA2-IR were moderately-low, their volatility may have also affected the calibrated results.
Larger increase in post-calibrated augmentation index, aortic systolic blood pressure, aortic mean blood pressure
The larger temporal rise in AI, aortic SBP and aortic mean BP could be related to aging. Of note, vascular aging is characterised by structural changes involving elastin fragmentation and degeneration, arterial wall thickening and progressive arterial dilation, which eventually result in blood vessels stiffening and increase in aortic PWV. 22 Arterial stiffening, which is reflected by increased PWV, is also associated with widened pulse pressure (calculated as the difference between aortic or peripheral SBP and DBP).18,22 The central aortic pressure comprises forward wave generated from the peripheral arteries and backward wave generated by the left ventricular contraction. 23 The velocities of forward and backward arterial waves increase in tandem with increase in arterial stiffness, thus causing the augmentation of the aortic SBP. 23 AI is expressed as a percentage of this augmentation pressure on pulse pressure.23,24 However, our study showed that calibration by age did not suppress the age-related changes in these parameters. This suggests that the changes of these parameters are robust over time and not entirely attributable to age. Furthermore, these measurements are likely dependent or vulnerable to handler or operator effects. We hypothesize that the vascular impact of aging may have been over-shadowed by the angiopathic dysmetabolism associated with T2DM. For example, metabolic perturbations, involving elevated levels of monosaccharides and amino acids such as tyrosine, proline and leucine, may lead to generation of advanced glycation end-products via crosslinks between amino acids and sugars. 25 This phenomenon occurs in central elastic arterial walls, leading to changes in collagen and elastin fibers and increasing aortic stiffness. 25
High tracking stability of muscle mass and serum creatinine
The high tracking stability of muscle mass and serum creatinine in our study could be attributed to the consistent decline in these two parameters over time. After 30 years of age, muscle mass declines about 3%–8% every decade. 26 The rate of muscle mass decline accelerates after 60 years of age. 26 The age-related decline in muscle mass could be attributed to several factors such as reduction of anabolic hormones which increase muscle protein synthesis (e.g. testosterone hormone and insulin-like growth factor-1 (IGF-1)), 26 changes in body composition (e.g. intermuscular adipose tissue) that drive an increase in insulin resistance and a decrease in insulin sensitivity,26,27 and impaired ability of muscle cells to appropriately respond to circulating insulin with enhanced protein synthesis. 26 Of note, the declines in testosterone in men and IGF-1 are known to be gradual over time. 26 This may account for the high stability of muscle mass. Even though estradiol (another anabolic hormone) in women decreases abruptly during menopause, studies have demonstrated that there was no accelerated decline in muscle mass after menopause, suggesting that menopause may not play a key role in development of sarcopenia. 26
Another highly stable parameter in our tracking stability analysis was serum creatinine. Creatinine is produced almost exclusively from muscle. 28 It is considered a surrogate marker of muscle mass. 29 This likely explains the decline of serum creatinine in tandem with the decrease in muscle over time in our study. Other factors which may influence the production of creatinine are dietary protein intake, malnutrition and medications. 30
Low tracking stability of fasting plasma glucose
As expected, FPG has a relatively lower tracking stability in our study. We speculate that the lower tracking stability could be due to the nature of fasting samples. Although our research protocol required all participants to fast for at least 6 hours, we could not ascertain if every participant had fasted fully for 6 hours. Another possible reason is that FPG is heavily subjected to therapeutic interventions and sensitive to patient’s behavioural change. However, we did not have complete data on medications, physical activity and dietary intake. Future studies could incorporate these measures in the analysis.
Confounding in longitudinal data
While the longitudinal differences of some parameters narrowed after calibration, some showed larger differences. Results varied when different sets of variables were used to match the patients for calibration and to adjust as covariates for estimation of stability coefficients. Furthermore, the rate of change over time varied across the parameters even when the same set of variables was used for calibration and stability estimation. It is likely that there were other factors beyond BMI, WHR, HOMA2-B and HOMA2-IR, that affect the change in parameters over time, whereby interaction between the factors existed and each factor affected each parameter differently. There is no clear evidence on how well the calibration method works, but using age, gender, BMI and WHR to match the patients, the generally concordant longitudinal differences between pre- and post-calibration and between consecutive pairs of waves seem promising. The smaller sample size available for matching using age, gender, HOMA2-B and HOMA2-IR could have resulted in the fewer concordant longitudinal differences between pre- and post-calibration. One must also be cognizant of the effects of missing data in a longitudinal study. Missing data, especially in the older subjects, may arise due to illness, physical or cognitive decline and death. 31 High percentage of missing data may reduce statistical power, lead to selection biases and affect the validity of results when the analysis excludes missing data. 32
Research and clinical implications
There are a few research and clinical implications from this study. First, as the scaling factor was unique to each parameter in the calibration process, it attempts to control the extent of batch effect which is likely to differ by parameter due to varying sensitivity. Moreover, as the scaling factor was consistent across all patients for each parameter in the calibration process, the association between each parameter and subsequent outcome of interest (e.g. renal trajectory) will not be affected even if the scaling factor was erroneously estimated. Calibration might have brought the trajectories of risk factors closer to the truth while retaining their relationships with the progression of diabetic complications over time. While we provide quantitative results to support scientific research, data users will have to decide whether to utilise the calibrated data based on their own perspectives and context.
Current guidelines recommend regular monitoring of HbA1c and blood pressure at every follow-up and annual monitoring of renal function and lipids in patients with T2DM. 33 The notably high tracking stability in serum creatinine suggests that it is an appropriate choice of laboratory measurement for the longitudinal monitoring of renal function. However, those parameters with low tracking stability such as FPG may need calibration, especially if the magnitude of visit-to-visit change is larger than clinical expectation. Further studies can be done to validate these findings before calibration is implemented in clinical management of T2DM and in prospective study design.
Strengths and limitations
To the best of our knowledge, this is the first study which evaluated the change in risk factors by accounting for batch effect and the tracking stability of risk factors over time in patients with T2DM. The sample size was larger than most of the earlier studies.8,10,11,34 The follow-up period was over a decade across three phases. A comprehensive suite of parameters was evaluated, including clinical measurements, laboratory-developed tests and research-based laboratory tests, in the longitudinal analyses. Two separate calibrations were performed to see if using different set of variables for matching would affect the magnitude and direction of change over time.
However, some limitations need to be acknowledged. This study was conducted on patients with T2DM and hence the findings cannot be generalised to individuals without T2DM. We also lacked data on medications and behavioural risk factors such as diet and physical activity, which may affect the cardio-metabolic risk factors, body composition and vascular function. We used BIA to assess body composition instead of dual-energy X-ray absorptiometry (DEXA), which is the standard method. 35 However, BIA correlates well with DEXA in body composition. 36 BIA is also less costly, easily accessible and free from radiation. 37 To differentiate batch effect from biological changes, especially for laboratory-developed parameter and research-based laboratory parameters, ideally we would need three samples from the same patients: sample collected and measured at earlier wave, sample collected at earlier wave but measured at later wave, and sample collected and measured at later wave. These observed measurements could then be compared with our calibrated measurements to assess how good our calibration was in addressing batch effect. Unfortunately, we only had one sample per patient. Though we might not have found a solution that could handle batch effect adequately, we are now better informed of the relative extent of batch effect and stability of each parameter.
Conclusions
The longitudinal differences in parameters between the waves were overall modest after calibration. Our study also demonstrated larger increases in AI, aortic SBP and aortic mean BP over time post-calibration, suggesting that changes of the hemodynamic parameters are robust over time and not entirely attributable to age. There was moderate to high tracking stability (longitudinal predictability) for most of the parameters, suggesting that any longitudinal change observed could be “signal” rather than “noise”. Muscle mass and serum creatinine had relatively higher tracking stability. The results may support the use of the parameters in future assessment of diabetic complications.
Supplemental Material
Supplemental Material - Longitudinal profiling and tracking stability in the Singapore study of macro-angiopathy and microvascular reactivity in type 2 diabetes cohort
Supplemental Material for Longitudinal profiling and tracking stability in the Singapore study of macro-angiopathy and microvascular reactivity in type 2 diabetes cohort by Serena Low, Huili Zheng, Liu Jian-Jun, Angela Moh, Keven Ang, Wern Ee Tang, Ziliang Lim, Tavintharan Subramaniam, Chee Fang Sum, and Su Chi Lim in Diabetes & Vascular Disease Research.
Footnotes
Declaration of conflicting interests
The author(s) declared no potential conflicts of interest with respect to the research, authorship, and/or publication of this article.
Funding
The author(s) disclosed receipt of the following financial support for the research, authorship, and/or publication of this article: The SMART2D cohort is supported by the Singapore Ministry of Health’s National Medical Research Council under its CSIRG (MOH-000066). The corresponding author is supported by the Singapore Ministry of Health’s National Medical Research Council under its Clinician Scientist Award (NMRC/CSA-INV/0020/2017). The first author is supported by the Singapore Ministry of Health’s National Medical Research Council under its Research Training Fellowship (NMRC/MOH000226).
Data Availability Statement
The data used in this study may be shared on reasonable request to the corresponding author.
Supplemental Material
Supplemental material for this article is available online.
References
Supplementary Material
Please find the following supplemental material available below.
For Open Access articles published under a Creative Commons License, all supplemental material carries the same license as the article it is associated with.
For non-Open Access articles published, all supplemental material carries a non-exclusive license, and permission requests for re-use of supplemental material or any part of supplemental material shall be sent directly to the copyright owner as specified in the copyright notice associated with the article.