
Abstract
Aims
To analyze the association between hemoglobin glycation index (HGI) and the long-term prognosis of patients with coronary artery disease (CAD) after percutaneous coronary intervention (PCI).
Methods
Predicted glycated hemoglobin (HbA1c) level was calculated using an established formula and HGI represented the difference between laboratory measured HbA1c and predicted HbA1c. A total of 1780 patients were stratified into three subgroups (HGI < −0.4, −0.4 ≦ HGI < 0.12 and HGI ≧ 0.12). The primary endpoints included all-cause mortality (ACM) and cardiac mortality (CM). The secondary endpoints were major adverse cardiac events (MACEs) and major adverse cardiac and cerebrovascular events (MACCEs).
Results
ACM occurred in 54 patients: 22 (3.7) in the low-HGI subgroup, 8 (1.3) in the moderate-HGI subgroup and 24 (4.1) in the high-HGI subgroup (p = .012). After adjusting for the traditional clinical prognostic factors, multivariate Cox regression analysis showed that patients in both the low and high HGI subgroups had significantly increased risk of ACM as compared with patients in the moderate HGI subgroup (hazard ratio [HR] = 4.979, 95% confidence interval [CI]: 1.865–13.297, p = .001 and HR = 2.918, 95% CI: 1.075–7.922, p = .036). However, we did not find significant differences in the incidence of CM, MACEs and MACCEs.
Conclusion
HGI can predicts risk for long-term mortality in patients undergoing PCI. This index could be helpful for the effective clinical management of the CAD population.
Keywords
Introduction
At present, cardiovascular disease (CVD), which produces immense health and economic burdens in globally, is still a major cause of morbidity and mortality. 1 CAD is driven by both genetic susceptibility and environmental risk factors, leading to myocardial ischemia and hypoxia. 2 Early identification and intervention of the risk factors can delay or reverse the occurrence and development of CAD. To date, PCI is an important treatment method in CAD patients. 3 PCI relieves symptoms and improves long-term prognosis in patients with CAD,4,5 also altering the natural history of acute coronary syndromes. 6 Although effective and safe treatments have been developed, adverse clinical outcomes and complications still may occur in patients considered to be at high CAD risk. 7 Therefore, it was very important to identify and treat the risk factors and predictors of CAD.
Over the past few decades, some studies confirmed that CAD has been linked to certain risk factors such as smoking, 8 dyslipidemia, 9 hypertension, 10 hyperglycemia, 11 and obesity. 12 Among them, raised glucose concentration is considered a significant risk factor for CAD. 13 Many studies have confirmed that a significant relationship between various measures of glycaemia, including fasting plasma glucose (FPG) and HbA1c, and the incidence of CAD events.14,15 However, these two parameters can be affected by some uncontrollable factors, leading to inter-individual variations and affecting the accuracy and stability of studies. 16 So the HGI is proposed to quantify the individual differences between measured HbA1c and mean blood glucose level. 17 Researches found that HGI was a clinically practical biomarker of risk for chronic vascular disease in people with or without diabetes. 18
To our knowledge, there are no clinical or epidemiological studies to detect the correlation between HGI and clinical outcomes of patients with CAD after PCI. Using the Clinical Outcomes and Risk Factors of Patients with Coronary Heart Disease after PCI in Zhengzhou (CORFCHDZZ) cohort, this study aimed to investigate the association of HGI with prognosis of CAD After PCI.
Methods
Study design and population
In the present study, all the patients were from a large, single-center retrospective cohort study (CORFCHD-ZZ, identifier: ChiCTR1800019699), which has been registered on http://www.chictr.org.cn. The CORFCHD-ZZ study included 3561 CAD patients who were hospitalized at the First Affiliated Hospital of Zhengzhou University from January 2008 to December 2017, based on case records and follow-up registry. These patients underwent coronary angiography and received at least one stent via implantation. After excluding participants with acute infectious, severe cardiac insufficiency (LVEF < 40% or NYHA Grade III/IV), terminal-stage renal dysfunction, under hemodialysis, severe liver dysfunction (alanine aminotransferase or total bilirubin greater than 3 times the normal upper limit) and missing data of HbA1c and FPG, 1780 participants were enrolled in the present study. This study complies with the Declaration of Helsinki, and the protocol was approved by the Ethics Committee of The First Affiliated Hospital of Zhengzhou University. Flow chart of participant selection is shown in Figure 1. Flowchart of patient enrollment.
Demographic, clinical and laboratory characteristics
The demographic characteristics of all participants were collected and recorded, including age, sex, smoking status, history of diabetes and hypertension, family history of CAD. Smoking status was divided into three groups: never, past and current. Diabetes mellitus was defined as fasting plasma glucose ≧ 7.0 mmol/L or two-hour postprandial glucose ≧ 11.1 mmol/L or taking antidiabetic drugs. 19 Hypertension was defined as the systolic blood pressure ≥ 140 mmHg and/or diastolic blood pressure ≥ 90 mmHg that adults repeatedly measured in the clinic on different days or taking antihypertensive drugs. 20
Blood samples of participants was performed prior to coronary angiography. The parameter values were measured strictly according to operational procedures by professionals in standard basic laboratory, including blood routine, FPG, blood lipid profile, HbA1c, and liver and kidney function.
Definition of HGI
HGI was calculated using the formula 21 :
HGI = measured HbA1c value - predicted HbA1c value.
We used simple linear regression to estimate the relation between baseline FPG and baseline HbA1c from 1780 study participants. (Regression equation: HbA1c = 0.435 × FPG (mmol/L) + 4.023, r = 0.699 and p < .001) (Figure 2). Predicted HbA1c levels were then calculated from this regression equation using each subject’s FPG value. Finally, the participants were assigned to low, moderate, or high HGI subgroups. HGI cut-off points were as follows: low HGI < −0.4 (n = 594), moderate HGI −0.4 to 0.120 (n = 595) and high HGI ≧ 0.12 (n = 591). Regression of fasting plasma glucose on glycated haemoglobin. The oblique line represents the simple linear regression line of the equation: HbA1c = 0.435 × FPG (mmol/L) + 4.023, r = 0.699, adjusted r2 = 0.488 (p < .001).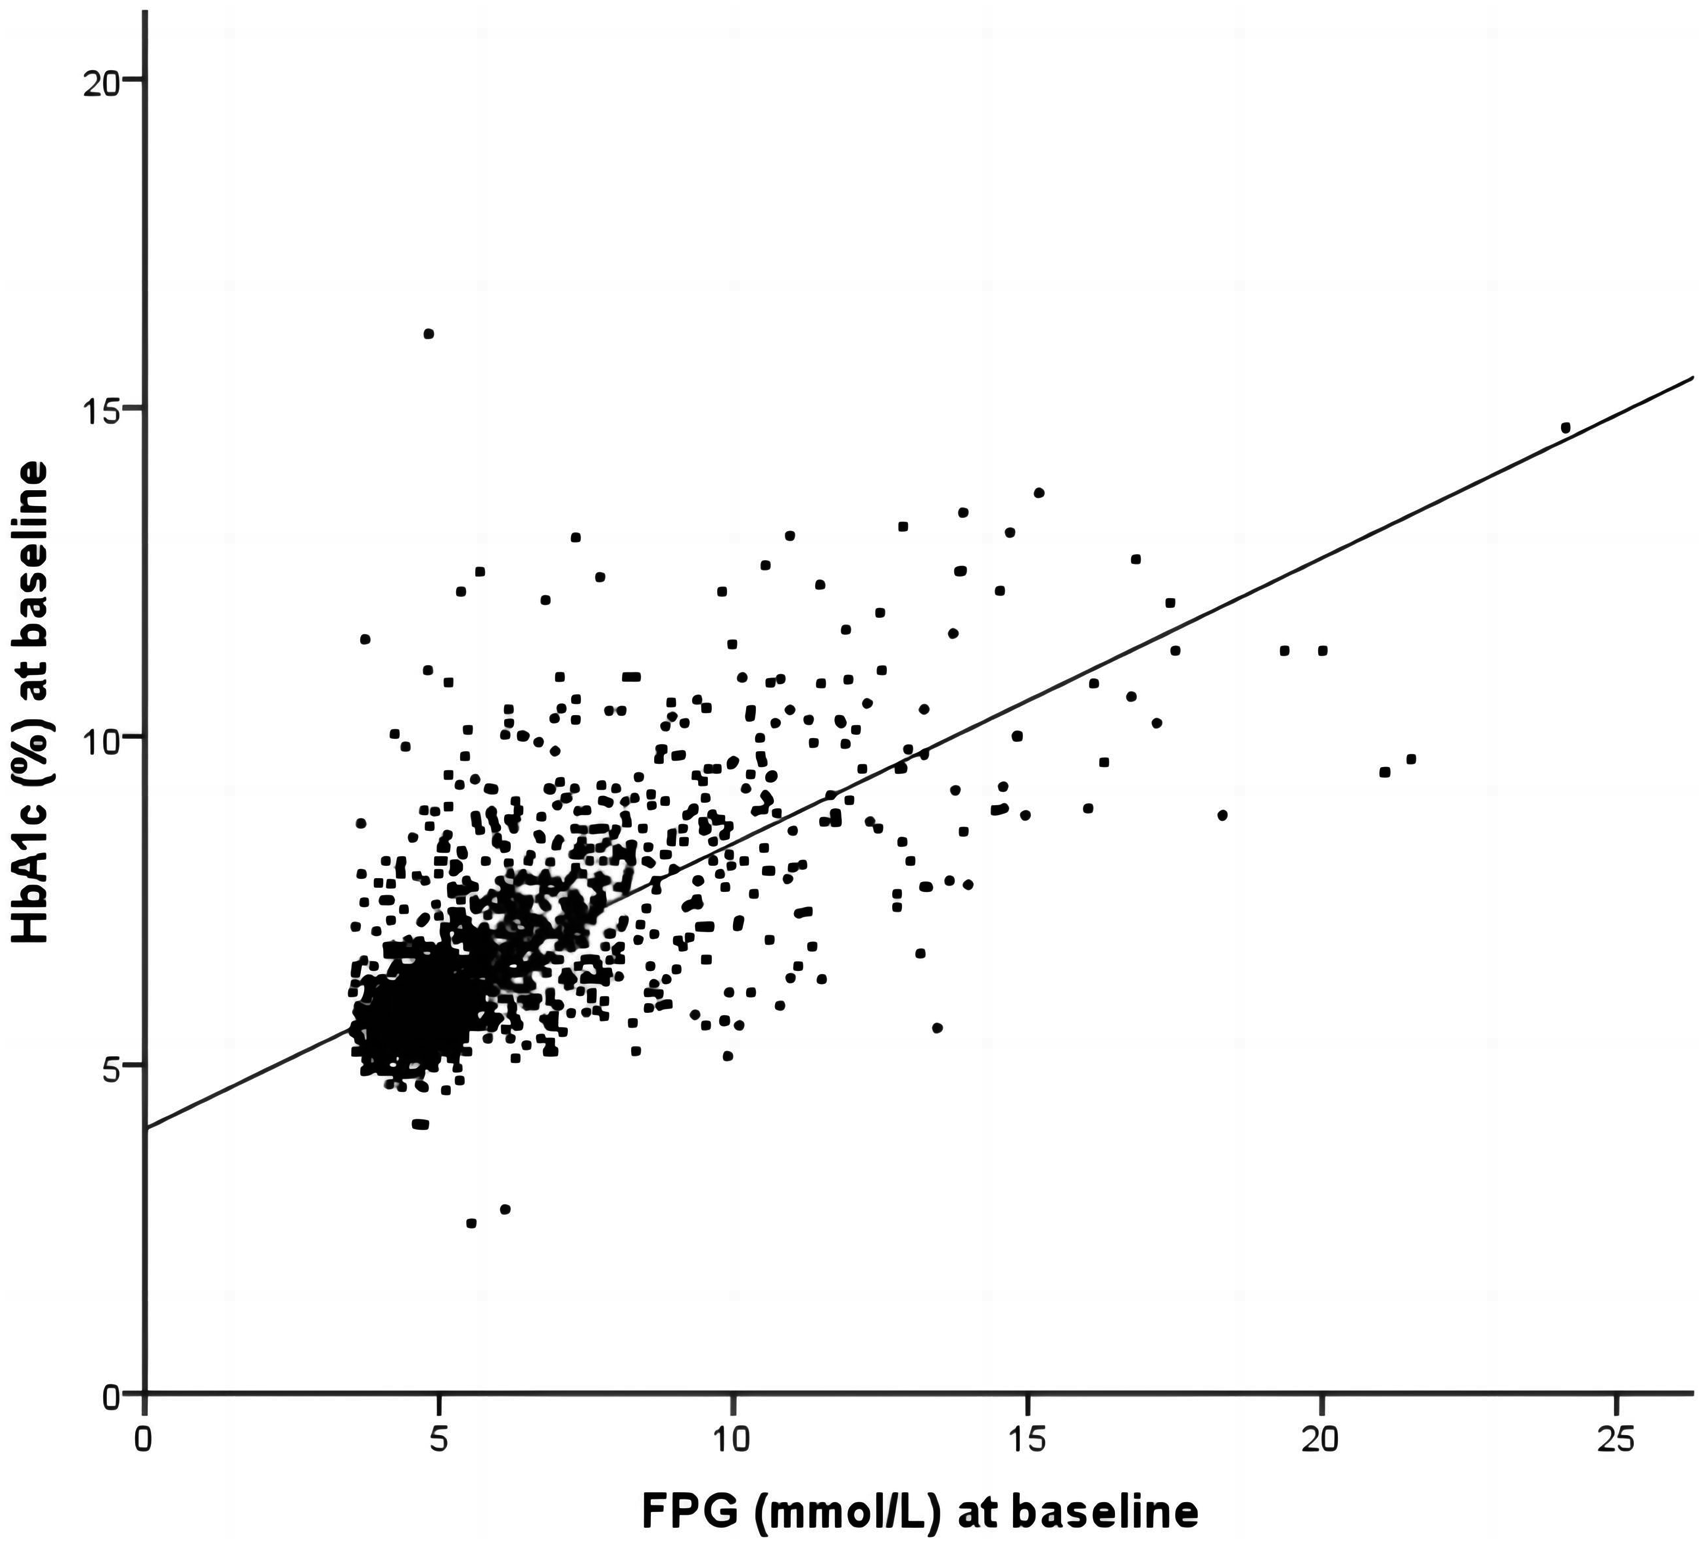
Endpoints
The primary endpoint was the long-term mortality, including ACM and CM. The secondary endpoints were MACEs—defined as the combination of cardiac death, recurrent myocardial infarction (RMI) and target vessel revascularization—and MACCEs—defined as MACEs plus stroke. 22
Deaths were considered a result of a cardiac condition unless a definite noncardiac cause of death was identified. Stroke was defined as a sudden onset of vertigo, numbness, aphasia or dysarthria caused by cerebrovascular disease, including hemorrhage, embolism, thrombosis or aneurysm rupture, and persisting for >24 h. RMI was defined as a new Q wave and an increased concentration of creatine kinase isoenzyme MB to more than five times the upper limit of the normal range within 48 h after the PCI, or as a new Q waves or that concentration of creatine kinase isoenzyme MB increased above exceeding the upper limit of the normal range plus ischemic symptoms or signs if occurring >48 h after procedure. 22
Follow-up
In the present study, all of the patients were followed up at least 1 year by reviewing all medical records and contacting the patients or their families. The mean follow-up time was 37.59 ± 22.24 months. Drug compliance and adverse events were evaluated at each follow-up.
Statistical analyses
The SPSS 24 statistical software was used for all analyses. Continuous variables were expressed as the mean ± standard deviation. Categorical variables were shown as frequencies and percentages. Group comparisons used ANOVA or Kruskal-Wallis tests for normally distributed and nonnormally distributed continuous variables, respectively. The Chi-squared test (χ2) was used to compare categorical variables. Then we used Kaplan–Meier analysis to construct the survival curves and the log-rank test to compare the differences between two group. Multivariable Cox proportional hazard regressions were performed to evaluate the predictive value of the HGI for outcomes. HR and 95% CI were calculated, and a p-value less than 0.05 was considered statistically significant.
Results
Baseline data
Baseline characteristics.

Abbreviations: HGI, Hemoglobin glycation index; LVEF, Left ventricular ejection fractions; ALB, Albumin; Cr, Creatinine; UA, Uric acid; TG, Triglyceride; TC, Total cholesterol; HDL-C, High-density lipoprotein cholesterol; LDL-C, Low-density lipoprotein cholesterol; CCB, Calcium channel blocker; ACEI, Angiotensin-converting enzyme inhibitor; ARB, Angiotensin receptor blocker. Note: The boldfaced p-Values are statistically different.
Clinical outcomes
Outcomes comparison among the three subgroups.

Abbreviations: HGI, Hemoglobin glycation index; ACM, All-cause mortality; CM, Cardiac mortality; MACEs, The major adverse cardiac events; MACCEs, The major adverse cardiovascular and cerebrovascular events. Note: The boldfaced p-Values are statistically different.

Kaplan-Meier curves for survival analysis of ACM in all patients. The X axis represents the follow-up time, and the Y axis represents the cumulative incidence of ACM. The red line indicates the high HGI subgroup, the green line indicates the intermediate HGI subgroup, and the blue line indicates the low HGI subgroup. Abbreviations: ACM, All-cause mortality; HGI, Hemoglobin glycation index.
Multivariable Cox regression analysis results for long-term ACM.

Abbreviations: ACM, All-cause mortality; Cr, Creatinine; UA, Uric acid; TG, Triglyceride; HDL-C, High-density lipoprotein cholesterol; HGI, Hemoglobin glycation index. Note: The boldfaced p-Values are statistically different.
Discussion
This study evaluated the prognostic value of HGI in CAD patients who underwent PCI and demonstrated that HGI index was an independent poor prognosis factor at levels <−0.4 or ≥0.12. To the best of our knowledge, this may be the first study to detect the correlation between HGI and adverse outcomes in CAD patients following PCI.
HbA1c is the gold standard for evaluating the glycemic control status in the short term, witch is known to has adverse effects on cardiovascular system.23,24 However, HbA1c levels can be influenced by many factors in addition to preceding blood glucose levels. 25 In 2002, HGI was first proposed to overcome that HbA1c is not necessarily correlated with blood glucose levels and to quantify the magnitude of the disagreement between the observed value of HbA1c and the one predicted on the basis of blood glucose levels. 17 Multiple clinical studies have investigated possible correlations between HGI and chronic vascular disease. A high value of the HGI has been confirmed to be independently associated with greater risk for CVD in normal, 26 prediabetes 27 and type 2 diabetes 28 study populations. Furthermore, the higher absolute value of HGI was also closely associated with higher incidence of contrast-induced acute kidney injury in patients undergoing coronary angiography and PCI. 29 In our study, HGI was proved to predicts risk for long-term mortality in patients who underwent PCI, providing a novel information on the link between HGI and CAD.
Previous studies mainly focused on the relationship between HGI and complications of diabetes. In a substudy of the Diabetes Control and Complications Trial (DCCT), a high HGI was associated with increased risk of retinopathy and nephropathy in patients with type 1 diabetes mellitus (T1DM) 30 A cross-sectional study showed that HGI is inversely associated with peripheral nerve conduction velocity in patients with type 2 diabetes mellitus (T2DM). 21 High HGI has also been shown to correlate with a higher prevalence of extensive CAD in individuals with T2DM. 28 The exact mechanism of diabetes complications caused by high HGI remains unclear. The main explanation might be that advanced glycation end products, which had been shown to cause metabolic disorders and endothelial dysfunction, increased with the increase of HGI.26,27 In addition, a substudy of the ACCORD trial found increased mortality and greater risk of hypoglycaemia with intensive treatment of patients with T2DM in the highest tertile of HGI. 31 This was supported by the fact in the AleCardio trial. 32 Researchers suggested that the association between HGI and adverse outcomes might be explained by the possibility of iatrogenic hypoglycaemia, since patients in the high HGI subgroup need and likely get more intensive treatment to lower their HbA1c than is necessary to control their blood glucose. However, the hypothesis is not supported by a substudy of the ADVANCE trial, which found that high HGI have a lower risk for mortality when on intensive treatment. 33 These studies on HGI as a risk factor for CVD differed in characteristics of study populations and type of blood glucose measurement, making the findings difficult to fully interpret. So the value of HGI impact on CVD and mortality is still debated.
It is important to note that in an observational cohort study from China, a U-shaped relationship was reported between HGI levels and incidence of MACCEs in acute coronary syndrome patients with or without diabetes. Both lower and higher HGI could cause an increased risk of poor outcomes. 34 Interestingly, our study focused on a population study of 1780 CAD patients undergoing PCI, and found that both lowest and highest tertile of HGI values were observed to increase the risk of long-term mortality more obviously even after adjusting for traditional CVD risk factors. These are different from the linear relation between HGI and vascular complications of diabetes reported in previous studies. In addition, we also found that the incidence of MACEs was significantly lower in the moderate HGI subgroup than in the high and low HGI subgroups, but did not reach statistical significance (p = .084). Multicenter studies with larger sample sizes may be needed to further confirm the findings.
In view of our present results, the possible explanations are as follows. Because HGI represented the difference between laboratory measured HbA1c and predicted HbA1c levels, individuals with HGI that were significantly lower or higher than zero were considered to have measured HbA1c levels that were significantly lower or higher than the average HbA1c level for the population at the same FPG. 17 HGI seems to reflect the interindividual glycaemic variability that could lead to inappropriate diabetes management decisions, including more intensive treatment to lower their HbA1c for patients in the highest HGI subgroup and the acceptance of erroneous HbA1c levels as evidence of good glucose control for patients in the lowest HGI subgroup. A previous study believed that HGI was merely a surrogate for HbA1c, assuming that inverse relationship between HGI and myocardial infarction in T2DM patients with previous CVD might possibly have been due to the fact that low HGI (and, thus, low HbA1c) could be an indicator of frequent hypoglycaemia. 35 Another explanation may be postprandial hyperglycemia, which is known to be a predictor of cardiovascular events. 36 In our study, the prevalence of diabetes was significantly higher in the high subgroup (more than 3 times higher than the other groups). Variation in postprandial glucose contributes to HGI variation in people with diabetes. 18 Furthermore, different classes of diabetes medications can differentially affect fasting or postprandial glucose levels. Basal long-acting insulin treatment lowers fasting blood glucose levels more than HbA1c levels, which could lead to higher HGI. 27 Thus, higher HGI may reflect higher postprandial glucose levels compared with FPG, or the consequence of treatment for high blood glucose. Because there were no recorded data on use of diabetes medications and continuous glucose monitoring in our cohort, we cannot interpret and verify our findings. In the future, more research is required to assess the findings.
This study has some limitations. First, our study used only FPG, not the mean blood glucose, to estimate the correlation with HbA1c. So the level of postprandial glucose could have affected HGI level. Second, our study mainly focused on a population study of CAD patients undergoing PCI and enrolled patients with or without diabetes, so the calculation of HGI used in our study cannot be generalized to other populations. New regression models need to be derived for each study population. This presents a challenge to the broad adoption of HGI as a clinical marker. Third, there was a possibility of selection bias because we could only select participants with HbA1c and FPG values simultaneously to calculate HGI. Last, our study is a single-center retrospective cohort study. Therefore, our results need to be further verified by a multicenter, prospective study.
In conclusion, our study has demonstrated a substantial association between HGI and long-term prognosis in patients undergoing PCI, which enriches the research content of HGI as a risk factor for CVD. Use of this index could be helpful for the effective clinical management of the CVD population.
Footnotes
Acknowledgements
The authors are grateful to the Department of Cardiology at the First Affiliated Hospital of Zhengzhou University for their help and expertise in conducting this study.
Author contributions
MDC and YYZ designed the study and wrote the manuscript. YYZ performed the data analyses. ZYL, QQG, JCZ, ZLZ, FHS, KW, LZJ, LF, XTY, YB, XYD and RJZ collected the data. MDC, JNT, and YYZ revised the manuscript. JYZ supervised the study. All authors read and approved the final manuscript.
Declaration of conflicting interests
The author(s) declared no potential conflicts of interest with respect to the research, authorship, and/or publication of this article.
Funding
The author(s) disclosed receipt of the following financial support for the research, authorship, and/or publication of this article: This research was funded by the National Natural Science Foundation of China (81870328, 81760043 and 81800267).