
Abstract
Aim:
This study aims to investigate the altered expression signature of long non-coding RNAs, mRNAs and deregulated pathways related to diabetic cardiomyopathy disease pathogenesis.
Method:
We utilize the previously established in vitro diabetic cardiomyopathy model of human induced pluripotent stem cell–derived human cardiomyocytes to perform long non-coding RNA and mRNA expression analysis on glucose (11 mM), endothelin-1 (10 nM) and cortisol (1 µM) stimulated human induced pluripotent stem cell–derived human cardiomyocytes to interrogate diabetic cardiomyopathy associated RNA expression profile.
Result:
Out of 20,730 mRNAs and 40,173 long non-coding RNAs being screened, 2046 long non-coding RNAs and 1582 mRNAs were differentially regulated (fold change > 2, p < 0.05) between diabetic cardiomyopathy and control group, of which more than half were intergenic and antisense long non-coding RNAs. Most of the coding transcripts were associated with processes like inflammation, structural reorganization, metabolism, smooth muscle contraction, focal adhesion and repair contributing towards the development of diabetic cardiomyopathy. The subgroup analysis further revealed 411 long non-coding RNAs being co-expressed with neighbouring genes. However, our coding–non-coding co-expression analysis showed an overall 48,155 co-expression network connections. In addition to that, the long non-coding RNAs with highest network connections were profoundly enriched for focal adhesion, cell-matrix adhesion and muscle contraction.
Conclusion:
These results provide comprehensive data about the pathways and regulatory mechanisms associated with diabetic cardiomyopathy and indicate that long non-coding RNAs may play a crucial role in diabetic cardiomyopathy.
Introduction
Diabetic cardiomyopathy (DCM) is an independent risk factor associated with heart failure even after adjusting for coronary artery disease (CAD), hypertension or valvular heart disease. 1 Increasing evidence has demonstrated that the development of DCM is a multifactorial process which primarily involves metabolic disturbance (myocardial insulin resistance with suppressed glucose oxidation, leading to increased lipid metabolism, hyperlipidaemia, myocardial insulin resistance and hyperinsulinaemia). 2 Moreover, the myocardium develops inflammation, mitochondrial dysfunctionality, oxidative stress, apoptosis, impaired calcium handling and the reduction of myocardial efficiency.3,4 Clinical studies depict that DCM is one of the significant risk factors and leading causes of apparent heart failure affecting approximately 12% of diabetic patients worldwide.5,6 Reversal of DCM can impede the cardiac stroke attenuating cardiovascular disease (CVD) morbidity. Despite these past studies, the underlying mechanism contributing towards DCM disease pathogenesis is poorly understood, and an effective prognostic and therapeutic strategy has not been established.
In the past couple of decades due to the limitation of available human cardiomyocytes (CMs), the functional studies of DCM have been primarily conducted in animal models.4,7 Although animal models have provided us the advantage of having age-matched controls, yet the recapitulation of major human disease phenotypes has been a challenge. With the advancement of stem cell technology in the past decade, researchers have widely used stem cells for modelling human diseases. 8 Human induced pluripotent stem cell–derived CMs (hiPSC-CMs) with their unique potential to recapitulate the functional features of human ventricular CMs have made them one of the suitable candidates for the cardiovascular research.
To study the effect of the pro-diabetic stimulus on human CMs, hiPSC-CMs were treated with high glucose, hormone mediators like endothelin-1 (ET-1) and cortisol as described previously. 9 Past studies depict that diabetic patients tend to exhibit elevated plasma level of ET-1 and cortisol.10,11 An elevated level of ET-1 and cortisol has been associated with neurohormonal stimulation of pro-inflammatory transcription factor (TF)–like nuclear factor-kappaB (NF-kB), G-Protein coupled receptor-induced structural remodelling of CMs, modulation of gene expression via glucocorticoid receptor and oxidative stress contributing towards pathological hallmarks of diabetic CMs.12–14 Despite these past studies, the synergistic molecular mechanisms of glucose, ET-1 and cortisol are yet to be deciphered. These in vitro cell models have been promising and extremely helpful in understanding the mechanistic foundation and progression of cardiac diseases overall allowing us to generate environmentally and genetically driven robust in vitro models in human cells for studying diabetic complications like DCM.
Advances in high-throughput RNA profiling and sequencing have provided evidence to support the functional role of long non-coding RNAs (lncRNAs) in cardiac development and cardiopathological diseases.15,16 LncRNAs are 200 or more nucleotides long with no protein-coding capacity. 17 These lncRNAs seem to have a profound effect on the genome due to their easy accessibility as they can epigenetically modify the chromatin, acting like a molecular scaffold.18,19 Several studies show that lncRNAs regulate the apoptotic axis in diabetic complexities in animal models.20,21 Here, we investigate the profiles of mRNA and lncRNAs in hiPSC-CMs in response to pro-diabetic stimulation. In addition, we performed the bioinformative analysis of the altered lncRNAs and mRNAs, and identified the potential signalling, which may help us in the identification and understanding of their roles in DCM development and regulation.
Materials and methods
DCM model
Following the previously described methodology, CMs derived from hiPSCs were used to determine the deregulated lncRNA and mRNA as a function of disease. These hiPSC-CMs represent the highly purified population of CMs depicting functional and structural similarity to that of ventricular CMs. Purified CMs were cultured in a modified medium or ‘maturation medium’ (MM) for 3 days followed by 2 days of culturing in diabetic medium (DM) made up of glucose (11 mM), ET-1 (10 nM) and cortisol (1 µM). All hiPSC-CMs for our experiment were obtained from three independent batches, at a post-digestion stage. These hiPSC-CMs were plated at a seeding density of 0.1 × 10⁶ cells/well in a 12-well plate, pre-coated with Matrigel in RPMI/B27 plus insulin for 5 days followed by cardiac maturation and diabetic modelling. To validate the MM and DCM model expression level of maturation and cardiomyopathy, related markers were evaluated using real-time quantitative polymerase chain reaction (RT-qPCR). The primers used for validation are shown in Supplementary Table 1. Glyceraldehyde-3-Phosphate dehydrogenase (GAPDH) was used as an endogenous control to normalize the entire mRNA candidates. Level of brain-type natriuretic peptide (BNP) was further evaluated using enzyme-linked immunosorbent assay (ELISA).
RNA isolation and quality check
Total cellular RNA was isolated by using Triazol Reagent (Invitrogen, Waltham, MA, USA) as per manufacturer guidelines. RNA concentration (OD260) and quality (OD260/280 ratio and OD260/230 ratio for protein and the organic compound contamination) were measured on the NanoDrop ND-1000. The RNA quality was also assessed by agarose gel electrophoresis on a non-denaturing gel, whereas the RNA integrity was determined using Bioanalyzer 2100 (Agilent Technologies, Santa Clara, CA, USA).
Array hybridization and data analysis
Expression profiling for differentially expressed long non-coding RNAs (DE-lncRNAs) and mRNAs was performed using Human lncRNA Array v4.0 (8 × 60K) having 40,173 lncRNA and 20,730 mRNA probes. The array slides were prepared using the Gene Expression Hybridization Kit (Agilent Technologies). The hybridized arrays were washed, fixed and scanned with using the Agilent DNA Microarray Scanner (part number G2505C). Agilent Feature Extraction software (version 11.0.1.1) was used to analyse acquired array images, whereas we used the GeneSpring GX v12.1 software package by Agilent Technologies to perform the normalization and subsequent data processing for our lncRNA + mRNA array data. DE-lncRNAs and mRNAs with statistical significance were identified through Volcano Plot filtering between two groups with the threshold fold change ⩾2.0 and Benjamini–Hochberg corrected p value ⩽0.05 (Student’s t-test). Hierarchical clustering was performed using the R software.
Microarray data validation
The microarray results were validated using RT-qPCR. To validate the expression profile data obtained from the microarray, the total RNA was isolated from three samples each from the DCM and Osmotic Control (OC) group. A total of 1 µg of RNA was converted to Complementary DNA (cDNA) as per manufacture guidelines. The expression level of lncRNA and mRNA was determined by RT-qPCR using SYBR Mix ExTaq (Applied Biosystems, Waltham, MA, USA); the designed primers are depicted in Supplementary Table 1. GAPDH was used as an endogenous control to normalize the entire lncRNA and mRNA candidate.
Gene ontology and pathway enrichment analysis in DCM
The gene ontology (GO) categories were derived using tools from http://www.geneontology.org, which comprise three structured networks of defined terms that describe gene product attributes. Pathway enrichment analysis was performed using Kyoto Encyclopedia of Genes and Genomes (KEGG; http://www.genome.jp/kegg) database. Pathway and GO analysis were calculated by Fisher’s exact test. The significance level of GO and pathway was reflected by p value, where smaller p value represents a greater level of significance. Both GO and pathway analysis were significant if they had a p < 0.05.
LncRNA classification and subgroup analysis
LncRNA classification was based on their transcript location and their relationship with the neighbouring (distance < 300 kb) coding genes (fold change > 2, p < 0.05).
LncRNA-mRNA co-expression network
For lncRNA-mRNA correlation analysis, we calculated the Pearson correlation of lncRNA expression value with that of each mRNA to identify significantly co-expressed lncRNAs and mRNAs with the standard of a Pearson correlation >0.995 or <−0.995 and a p value <0.05. A coding–non-coding gene co-expression network (CNC network) was constructed based on the positive or negative correlation analysis between DE-lncRNAs and mRNAs by using the open-source bioinformatics software Cytoscape.
Statistical analysis
All the statistical analysis was performed using GraphPad Prism 5.0 (GraphPad software, La Jolla, CA, USA). The fold change and non-parametric Mann–Whitney test were used to compare the gene expression between two groups, whereas Benjamini–Hochberg False Discovery Rate (FDR) (cutoff 0.05) was applied for multiple-testing correction; p value of <0.05 (two-tailed) was considered to be statistically significant.
Results
Differentiation of iPSCs to CMs and DCM model validation
CM differentiation was attained via temporal modulation of Wnt pathway as described in the past 22 (Figure 1(a)). Spontaneously contracting cells were reseeded post digestion and metabolically manipulated for achieving purified CMs. All the refined CMs were positively stained for cardiac-specific troponin-T and alpha sarcomeric actinin protein, depicting high (99.8%) purified CMs (Supplementary Figure S1). Purified CMs were metabolically manipulated in the MM, and expression level of maturational markers was consistent with the previously reported studies 9 (Supplementary Figure S2). To characterize the model of DCM, we performed various experiments, which include RT-qPCR for DCM markers. To validate the DCM model expression level of cardiomyopathy, related markers were evaluated, including NPPA, NPPB and ACTA-1. Once the cells were cultured for 48 h in DM comprising of glucose (10 mM), ET-1 (10 nM) and cortisol (1 µM), the expression pattern of all the cardiomyopathy-related markers was significantly upregulated (Figure 1(b)). Level of BNP was further evaluated using ELISA, which seems to be remarkably high in the DM-CMs when compared to the OC-CMs (Figure 1(c)).
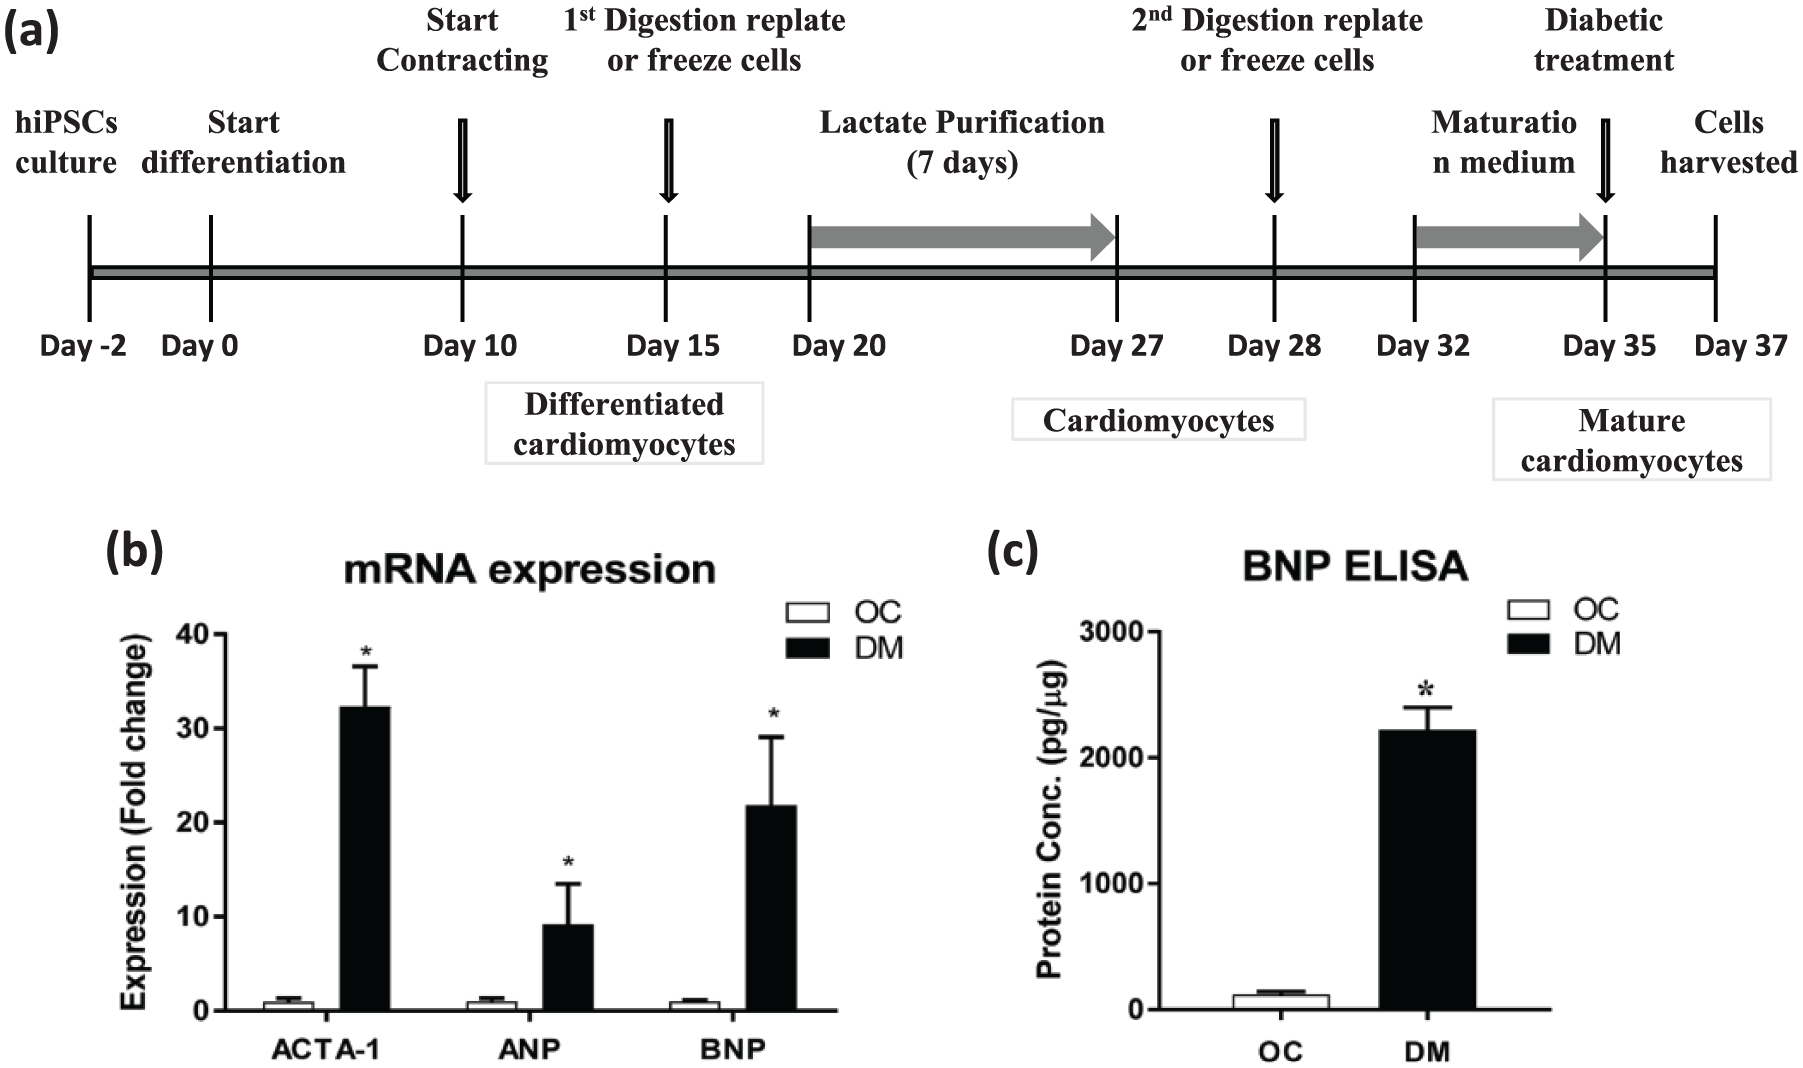
Schematic representation of cardiac differentiation from human induced pluripotent stem cells (hiPSCs) and diabetic cardiomyopathy model validation. (a) The protocol used to induce the diabetic cardiomyopathy in mature cardiomyocytes. Diabetic stress and control conditions were applied for 2 days before harvesting cells for assays. (b) mRNA expression of ACTA-1, ANP and BNP in hiPSC-CMs cultured in Diabetic Medium (DM) and Osmotic Control (OC); mRNA was normalized to GAPDH. Data represented as mean ± SEM, *p ⩽ 0.05, of three independent experiments. (c) BNP secretion post 48 h exposure of DM and OC in the culture supernatant was quantified using ELISA. Data represented as mean ± SEM, *p ⩽ 0.05, of three independent experiments.
LncRNA and mRNA expression profile in DCM and data validation
To have a better insight of the deregulated gene and the lncRNA expression, we conducted the microarray analysis on samples from both DM-CM (n = 3) and OC-CM (n = 3) groups. Having the cutoff for fold change >2.0 and a p value <0.05, we found 2046 DE-lncRNAs and 1582 differentially expressed-mRNAs (DE-mRNAs) among two groups. In 2046 DE-lncRNAs, 924 were upregulated and 1122 were downregulated, whereas DE-mRNAs showed 599 upregulated and 983 downregulated candidates. DE-lncRNAs and mRNAs are presented as a scatterplot (Supplementary Figure S3(a) and (b)) and evaluated by volcano plot (Figure 2(a) and (b)). Differentially expressed signatures of both lncRNA and mRNA are depicted by hierarchical clustering analysis (Figure 2(c) and (d)). In the attempt to validate our expression profile data, we performed RT-qPCR on the candidates who had a fold change >2.0, p < 0.05, and are believed to be associated with DCM. The quantitative polymerase chain reaction (qPCR) results had similar expression pattern as the microarray results for all the candidates (Figure 2(e) and (f)).
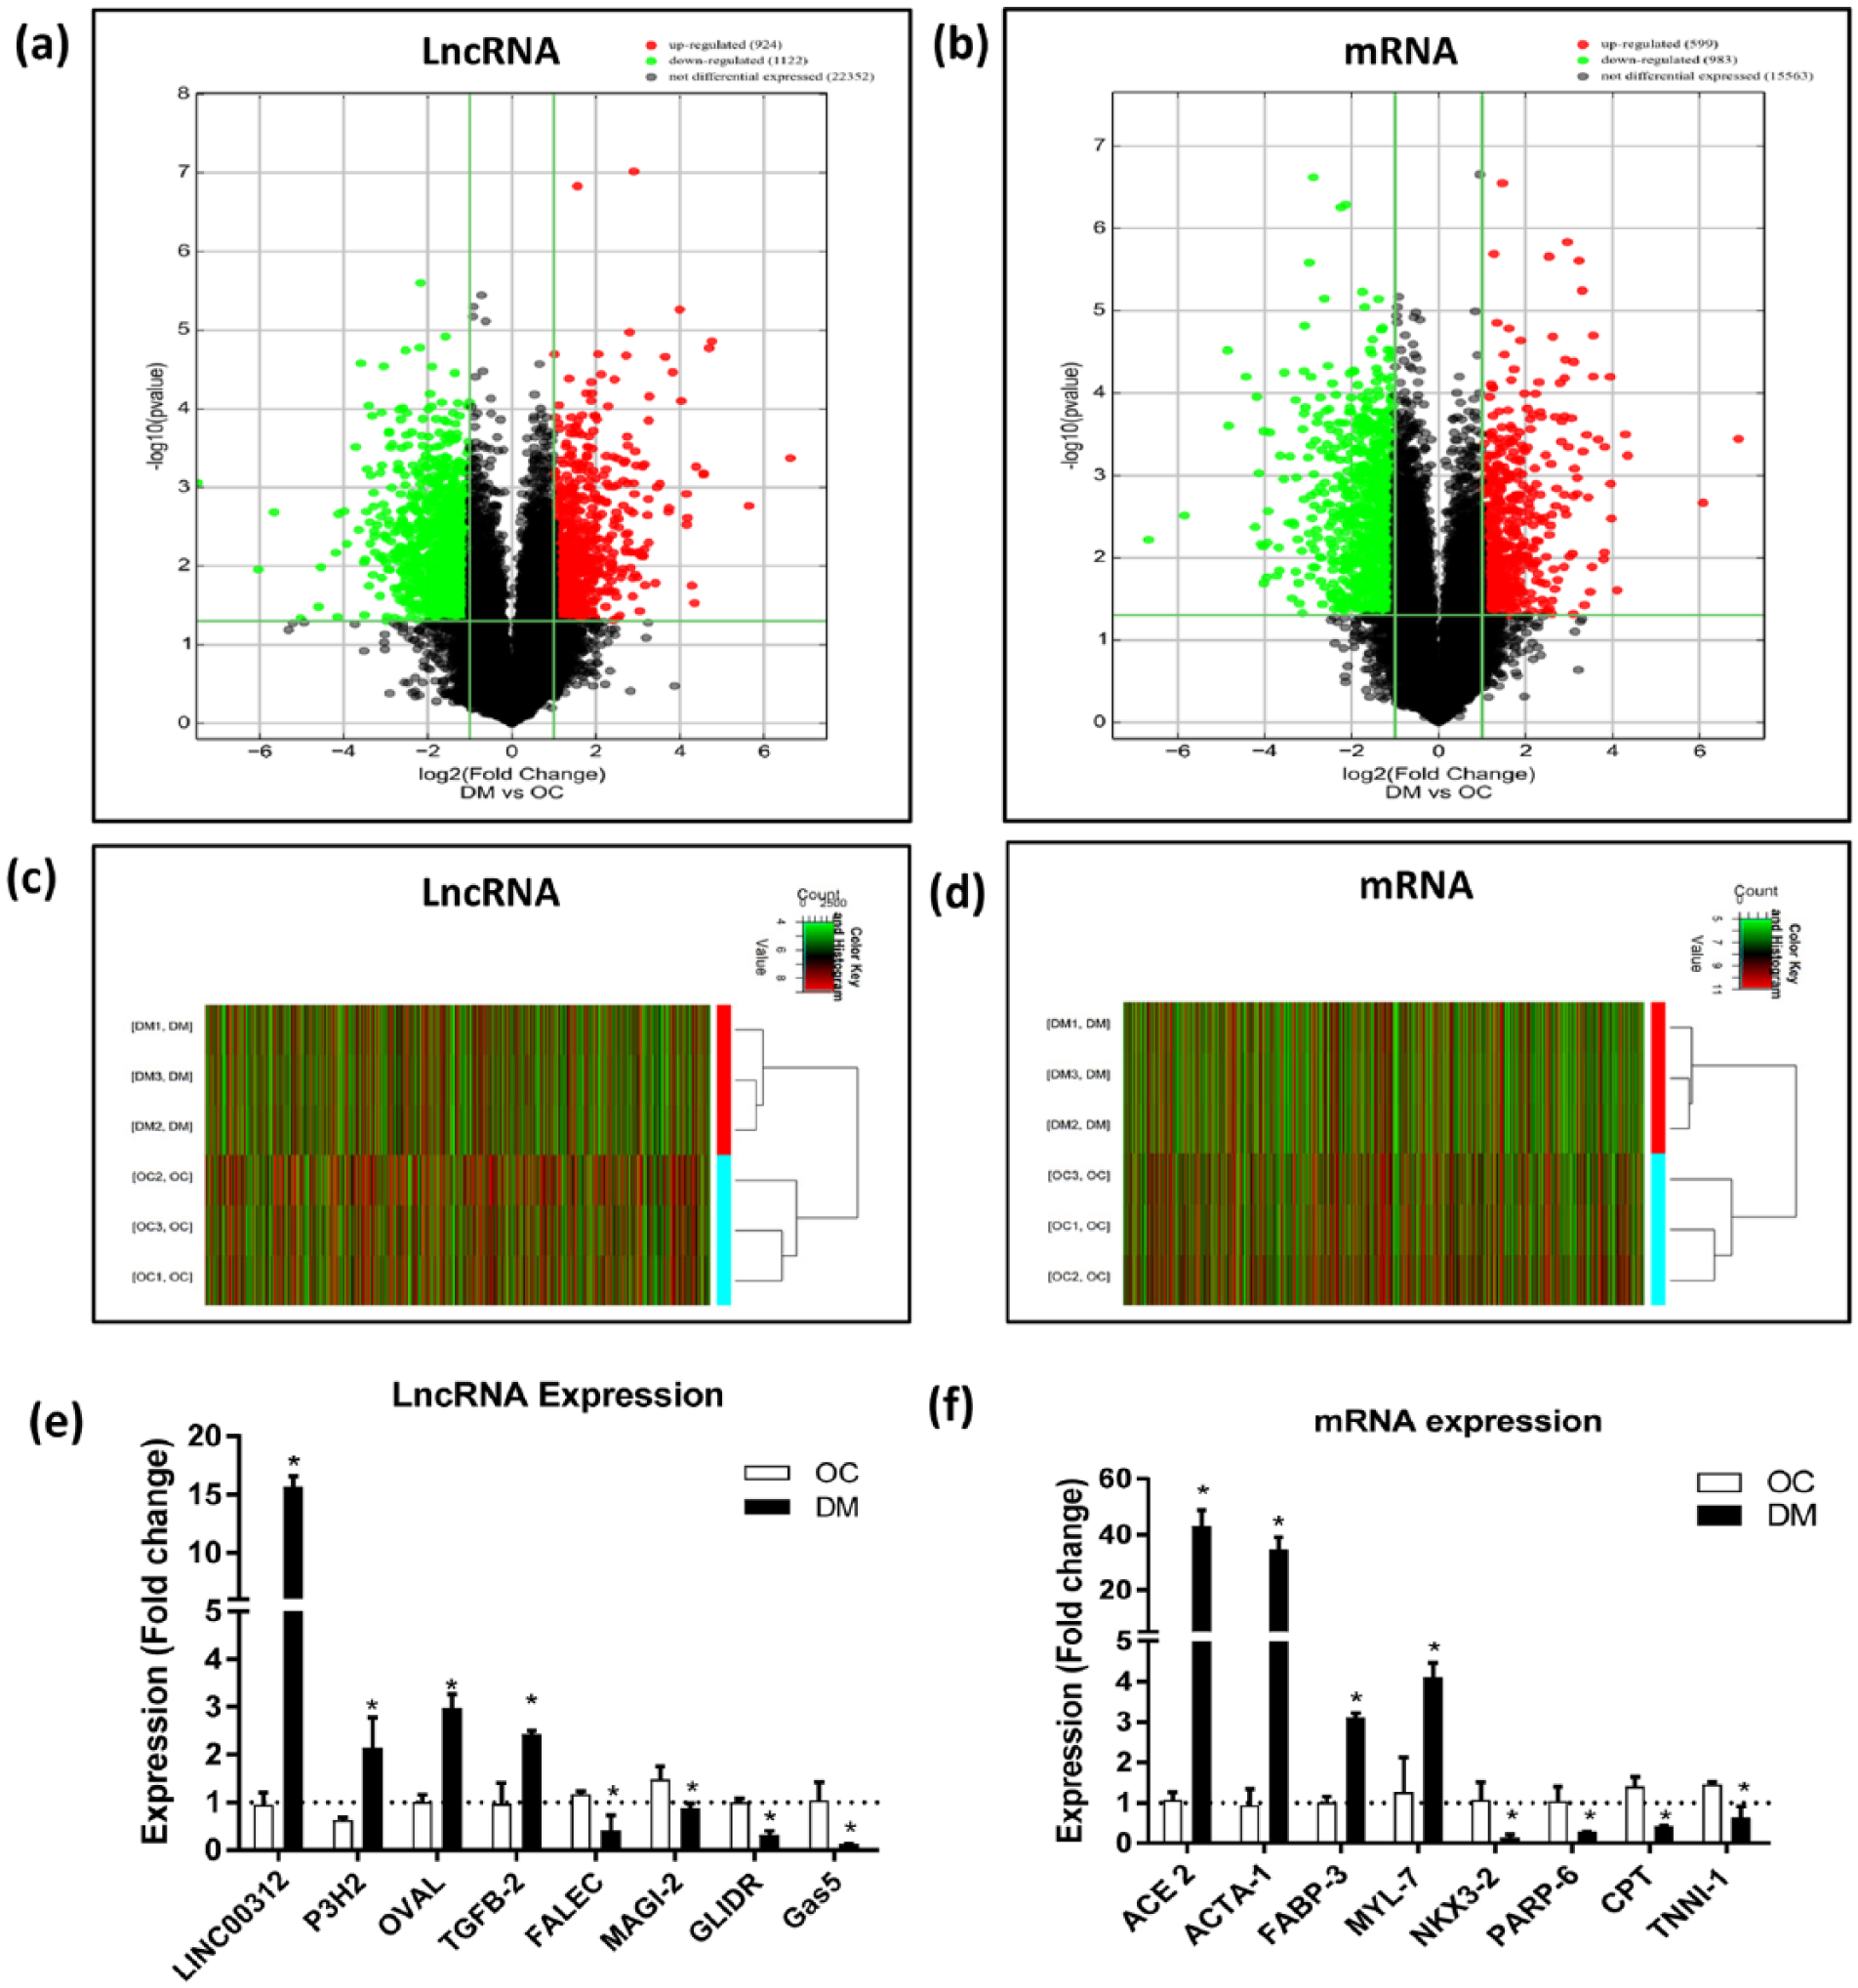
LncRNA and mRNA expression profiles based on microarray profiling data and validation. (a, b) Volcano plots of the differentially expressed (a) lncRNAs and (b) mRNAs. The red and green points in the plot represent the differentially expressed lncRNAs and mRNAs having statistical significance. The horizontal green line depicts *p ⩽ 0.05, whereas vertical green line shows a twofold change of up and down. (c, d) Hierarchical clustering shows a distinguishable (c) lncRNA and (d) mRNA expression profile between the two groups with expression fold change >2.0 and *p ⩽ 0.05. Red and green represent up- and downregulated genes, respectively. (e, f) Validation of microarray data by qRT-PCR: (e) lncRNA and (f) mRNA plots here represent the analysis of RNA samples extracted from hiPSC-CMs (n = 3 per group). Relative expression of each lncRNA and mRNA was normalized to GAPDH. Data represented as mean ± SEM, *p ⩽ 0.05, of three independent experiments.
LncRNA classification and subgroup analysis
We also characterized the chromosomal location of DE-lncRNA and DE-mRNA. The results indicated that altered lncRNA and mRNA were significantly enriched on chromosomes 1 and 2 (Figure 3(a)). Studies in the past have clearly depicted the regulatory role of lncRNA and their influence on the neighbouring gene loci. 23 In our study, we examined the co-expression pattern of the mRNA transcribed from the loci (<300 kb) for 2046 DE-lncRNA. Our results show that out of 2046 DE-lncRNA, 411 had their neighbouring mRNA co-expressed (Figure 3(b)), with 236 being upstream and 175 localized downstream from the neighbouring DE-mRNA (Figure 3(c)). Our results also reveal the expression pattern of lncRNAs with context to the nearby co-expressed-coding gene. We found that 256 DE-lncRNA and their co-expressed mRNA had similarity in their expression direction, whereas 155 DE-lncRNA had different expression direction (Figure 3(b)). The information related to the genomic location of these lncRNAs with respect to the neighbouring protein-coding gene is presented in Figure 3(c). To have a better insight into the potential function of DE-lncRNAs, we divided them among five subgroup types: intergenic, sense, antisense, intronic and bidirectional (Supplementary Figure S4). Intergenic lncRNAs were most profoundly expressed and accounted for 60.8% of all (660/2037 were upregulated and 579/2037 were downregulated) followed by antisense (12.9%, 88/2047 upregulated and 176/2047 downregulated, lncRNAs).
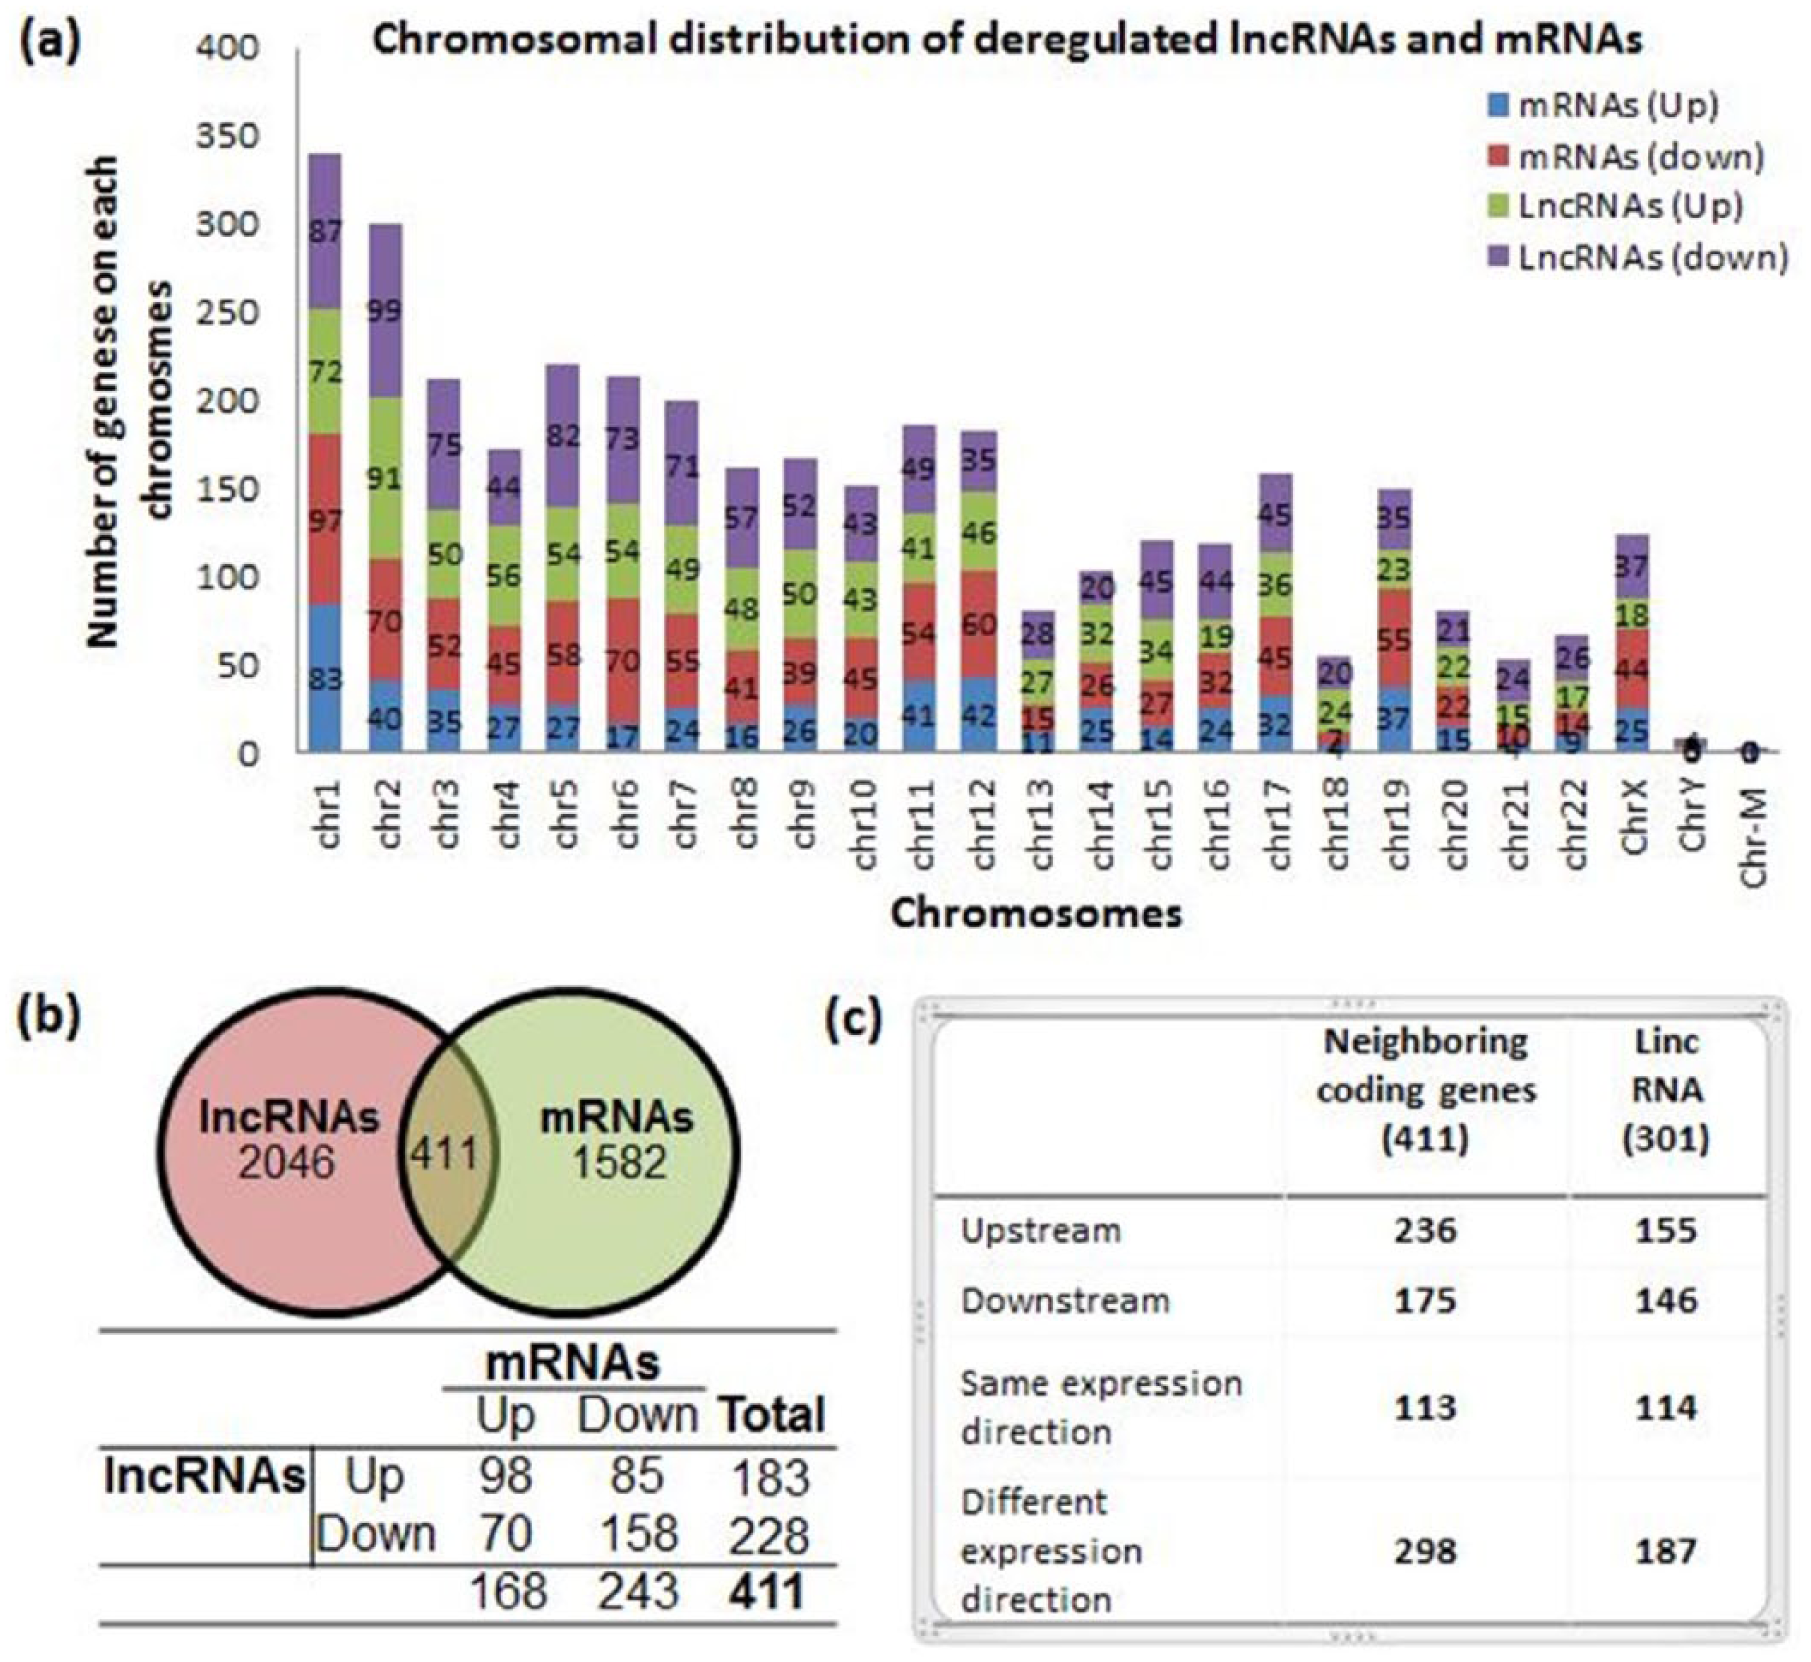
Distribution pattern of differentially expressed lncRNAs and mRNAs on chromosomes and their co-expression relationship. (a) Chromosomal distribution of deregulated lncRNAs and mRNAs, green and violet, depicts up- and downregulated lncRNAs, whereas blue and red show up- and downregulated mRNAs. (b) Crossover of DE-lncRNAs-associated coding gene with DE-mRNAs, whereas the table lists the expression correlation of DE-lncRNAs and their neighbouring coding genes. (c) Co-expression pattern of the mRNA transcribed from loci (<300 kb) for DE-lincRNAs.
Pathway and GO analysis depict the regulatory role of lncRNAs in DCM-CMs
To determine the role of deregulated mRNA in DCM, we performed GO and pathway analysis. Past studies substantiate that lncRNAs can regulate the genes found in their close vicinity as well as one who is away from them. 24 To decipher the functional role of these lncRNAs in disease pathogenesis, it is extremely important to zero in on their neighbouring or co-expressed protein-coding genes. GO enrichment analysis of deregulated mRNA helps us to functional annotate the deregulated lncRNAs in various diseases. Our GO analysis of molecular function, cellular components and biological processes showed similarity in the expression pattern of both significantly upregulated and downregulated mRNA. In the context of the biological process, the most significantly enriched upregulated mRNAs were associated with cytoskeleton organization, actin–myosin organization, myofibril assembly and striated muscle differentiation and development (Figure 4(a)). The downregulated gene which was enriched for the biological processes was associated with the metabolic process, fatty acid synthesis and one responding to stress (Figure 4(b)). For the cellular component, the significantly enriched mRNAs were profoundly associated with the structural organization like myofilament, actin cytoskeleton, myofibrils and contractile fibres (Figure 4(a)), whereas the downregulated genes were mostly associated with smooth endoplasmic reticulum (SER) and endoplasmic reticulum (ER) membranes (Figure 4(b)). In the category of molecular function, the genes related to ion binding like calcium, cytoskeletal protein binding and cell adhesion molecule binding were upregulated (Figure 4(a)). The downregulated genes were primarily coding for proteins which were enzymatic having dehydrogenase, oxidoreductase, nucleotide diphosphatase and hydrolase activity (Figure 4(b)). To have a better insight about the correlation of deregulated gene and cellular pathway, we performed pathway analysis. Our pathway analysis result indicated that the significantly upregulated mRNAs were associated with dilated and hypertrophic cardiomyopathy, whereas focal adhesion signalling was upregulated as well (Figure 4(c)). The downregulated pathways were lysosomal, protein processing and metabolic (Figure 4(d)).
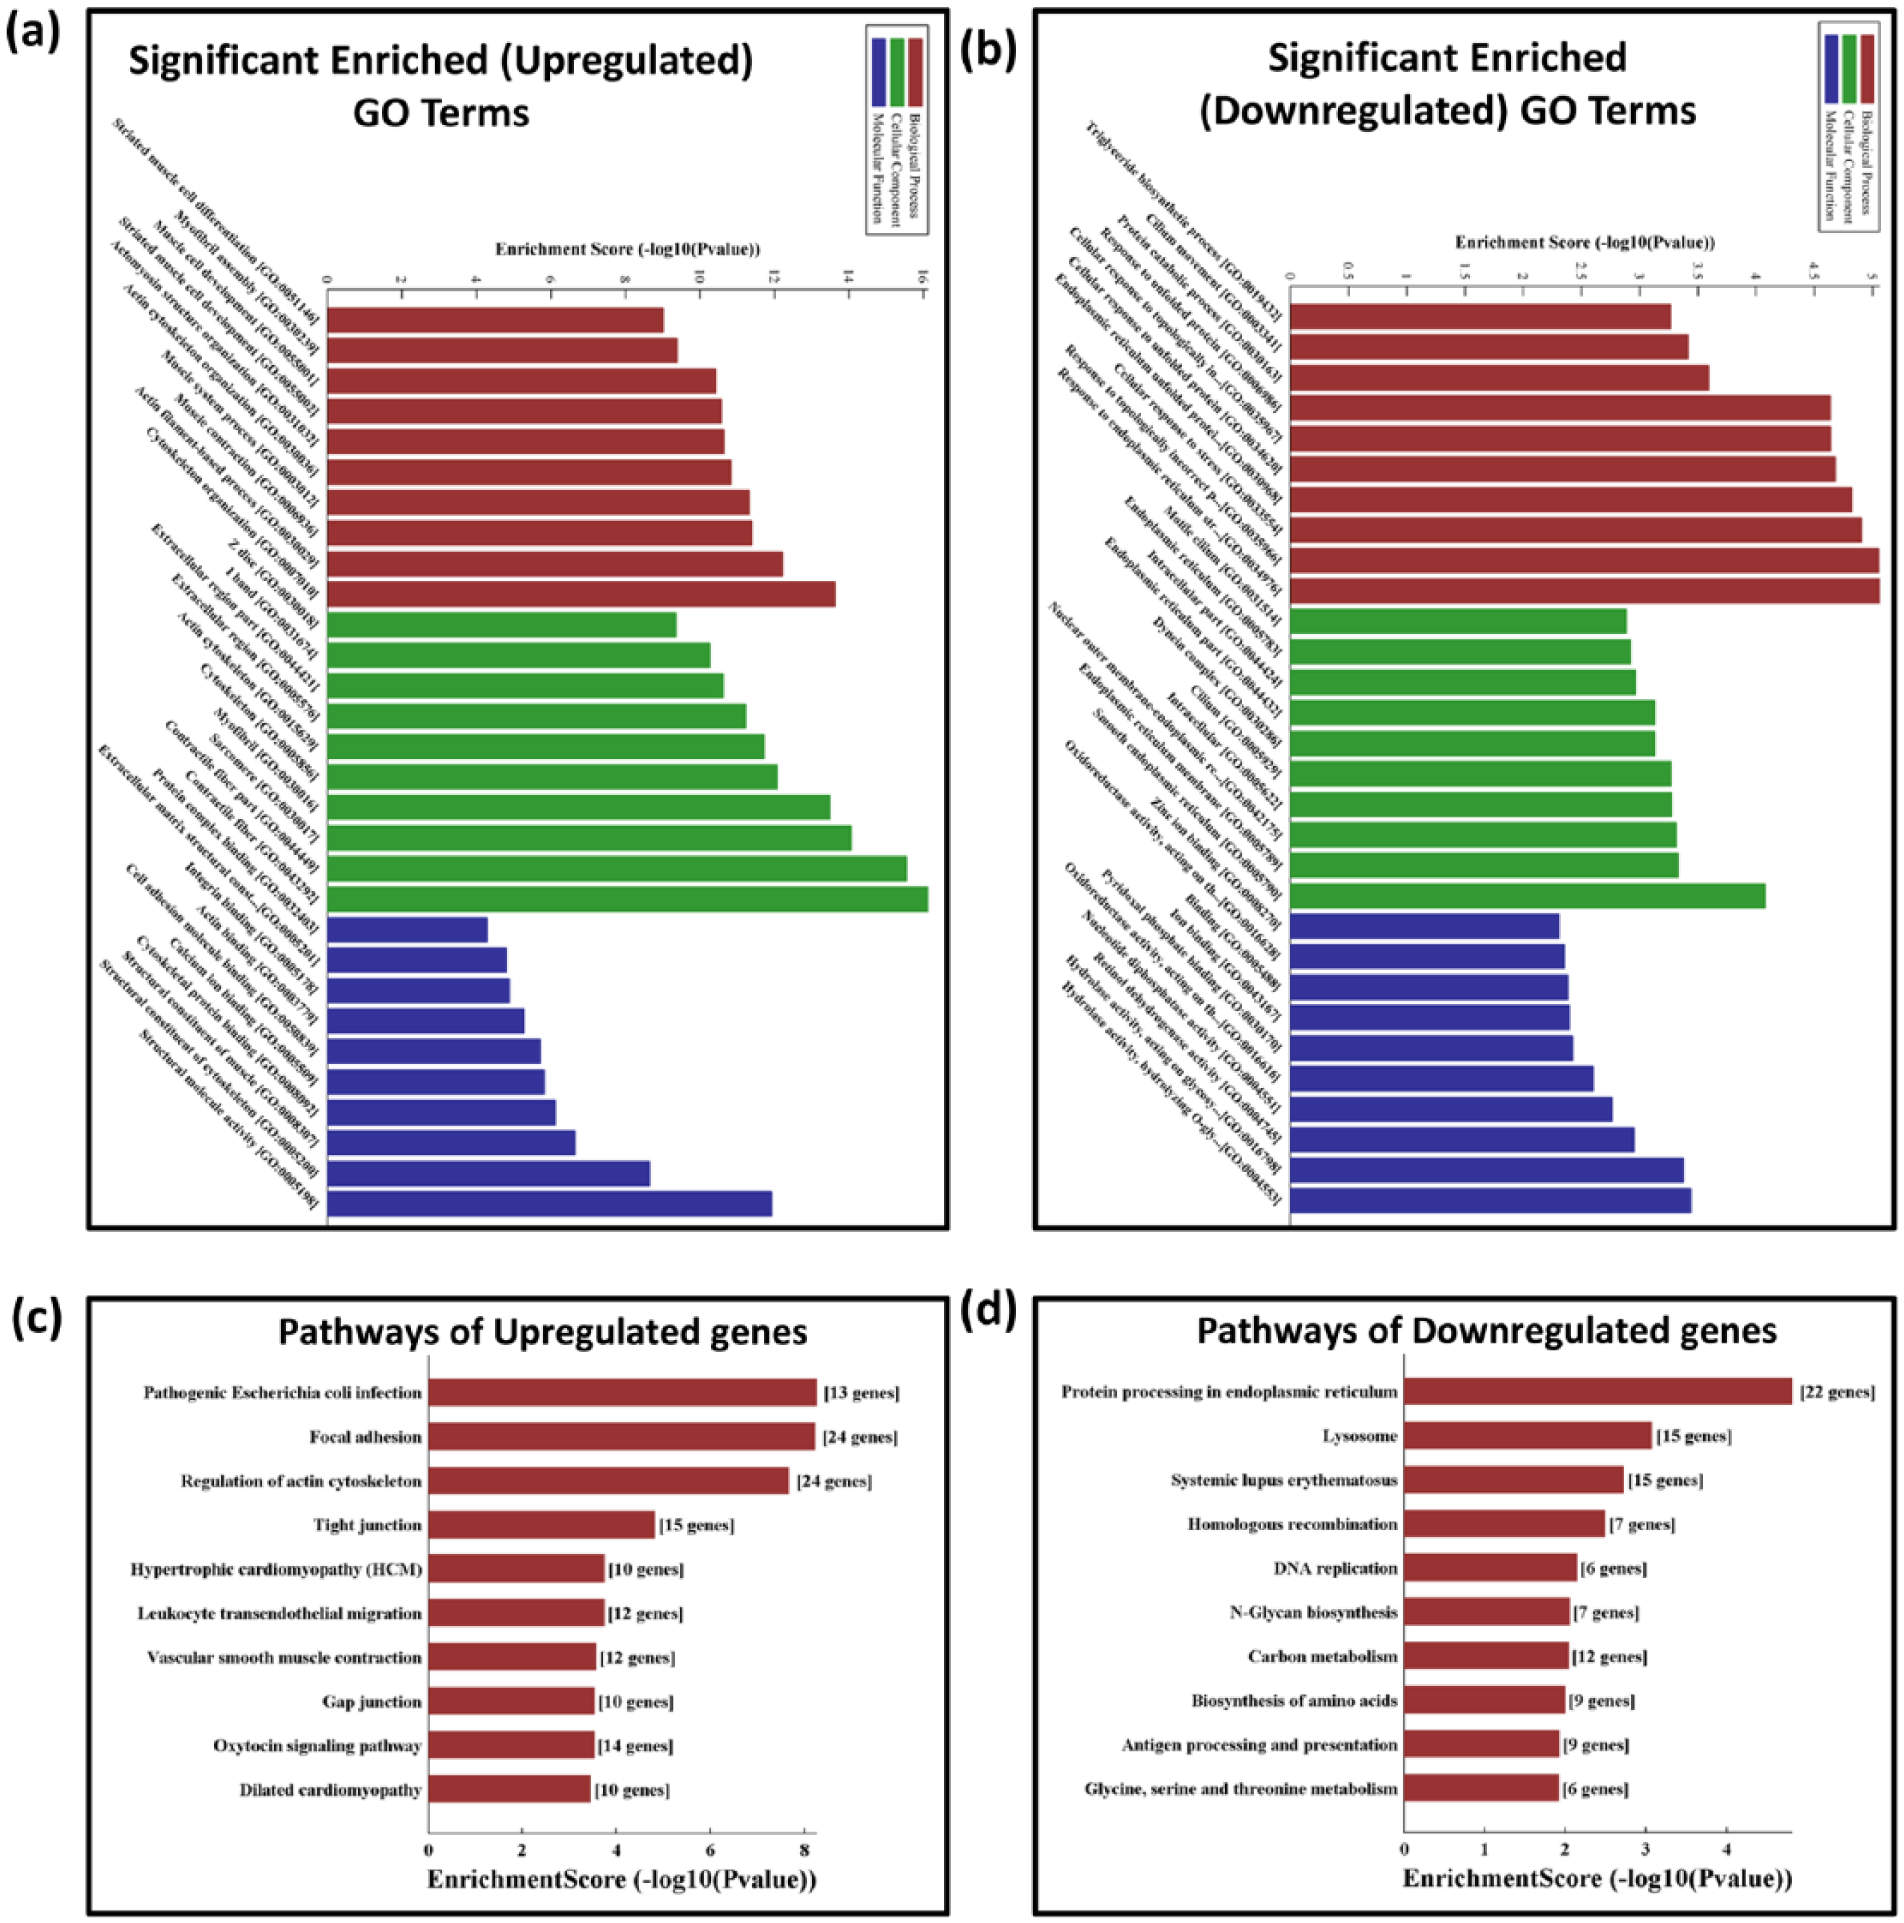
Bioinformatics analysis of the differentially expressed genes and pathway analysis. (a, b) Top 30 GO terms (comprises of cellular component (CC), molecular function (MF) and biological process (BP)); the p value denotes the significance of GO terms enrichment in the DE genes: (a) significantly enriched upregulated GO term and (b) significantly enriched downregulated GO term. (c, d) Top 10 pathways depicting significant difference among the DM and OC groups: (c) significantly upregulated pathway term and (d) significantly downregulated pathway term.
LncRNA-mRNA co-expression network
To gain insight into the role played by the DCM lncRNAs, we took advantage of an lncRNA-mRNA co-expression network (CNC) that was built based on the positive or negative correlations as reflected by the normalized intensity of respective transcript. The correlation analysis of lncRNAs, mRNA and TF to identify common genes involved in lncRNA regulation. Network analysis identified 1741 nodes and 34,953 connections displaying significant direct or inverse correlation (FDR < 0.05; Supplementary Figure S5). Pathway analysis of DE-mRNAs is intended to provide insight into the cellular pathways associated with these genes. Our results demonstrated that 10 pathways corresponded to upregulated transcripts and 10 to downregulated transcripts. Co-expression networks related to these pathways are in Supplementary Figures S6 and S7. This suggests that these pathways may harbour significance and/or may contribute to the pathogenesis and biochemical characteristics of DCM.
To explore how lncRNAs may participate in gene regulation and the pathogenesis of DCM, we analysed 10 highly DE-lncRNA (five upregulated lncRNA: XLOC_004049, XLOC_007354, HRAT17, uc.87 and RP11-550A5.2; and five downregulated lncRNA: G055978, CTB-12O2.1, RPPH1, XLOC_004430 and RP11-71H9.1) for cis- and trans-predictions. There were 46 DE-mRNAs (EMP2, S100A10, CAV1, SLC7A11, CDON, NECTIN1, MYL9, CNN1, CTGF, GAA, LMOD1, ANKRD2, ARG2, MYL6, MYLK, ACTA-1, ACE-2, SCN10A, TNNT3, ACTN2, FBLN5, ITGA4, ITGA7, NID1, ZYX, FGR, CFL2, NUPR1, PAX5, KRT8, OBSCN, MYLK3, AHNAK2, ABRA, PDLIM1, ARHGEF15, REN, APLN, CHL1, RTN4RL1, LGALS1, LRRC38, LAMB1, ACTB, RRAS and DIAPH3) associated with these 10 DE-lncRNAs (Figure 5(a)). The target gene–associated DE-lncRNAs were highly enriched for the most significant GO terms (Figure 5(b)), including actomyosin structure organization (GO:0031032), muscle contraction (GO:0006936), membrane raft assembly (GO:0001765), drinking behaviour (GO:0042756), focal adhesion (KEGG:04510), skeletal muscle tissue development (GO:0007519) and cell-matrix adhesion (GO:0007160).
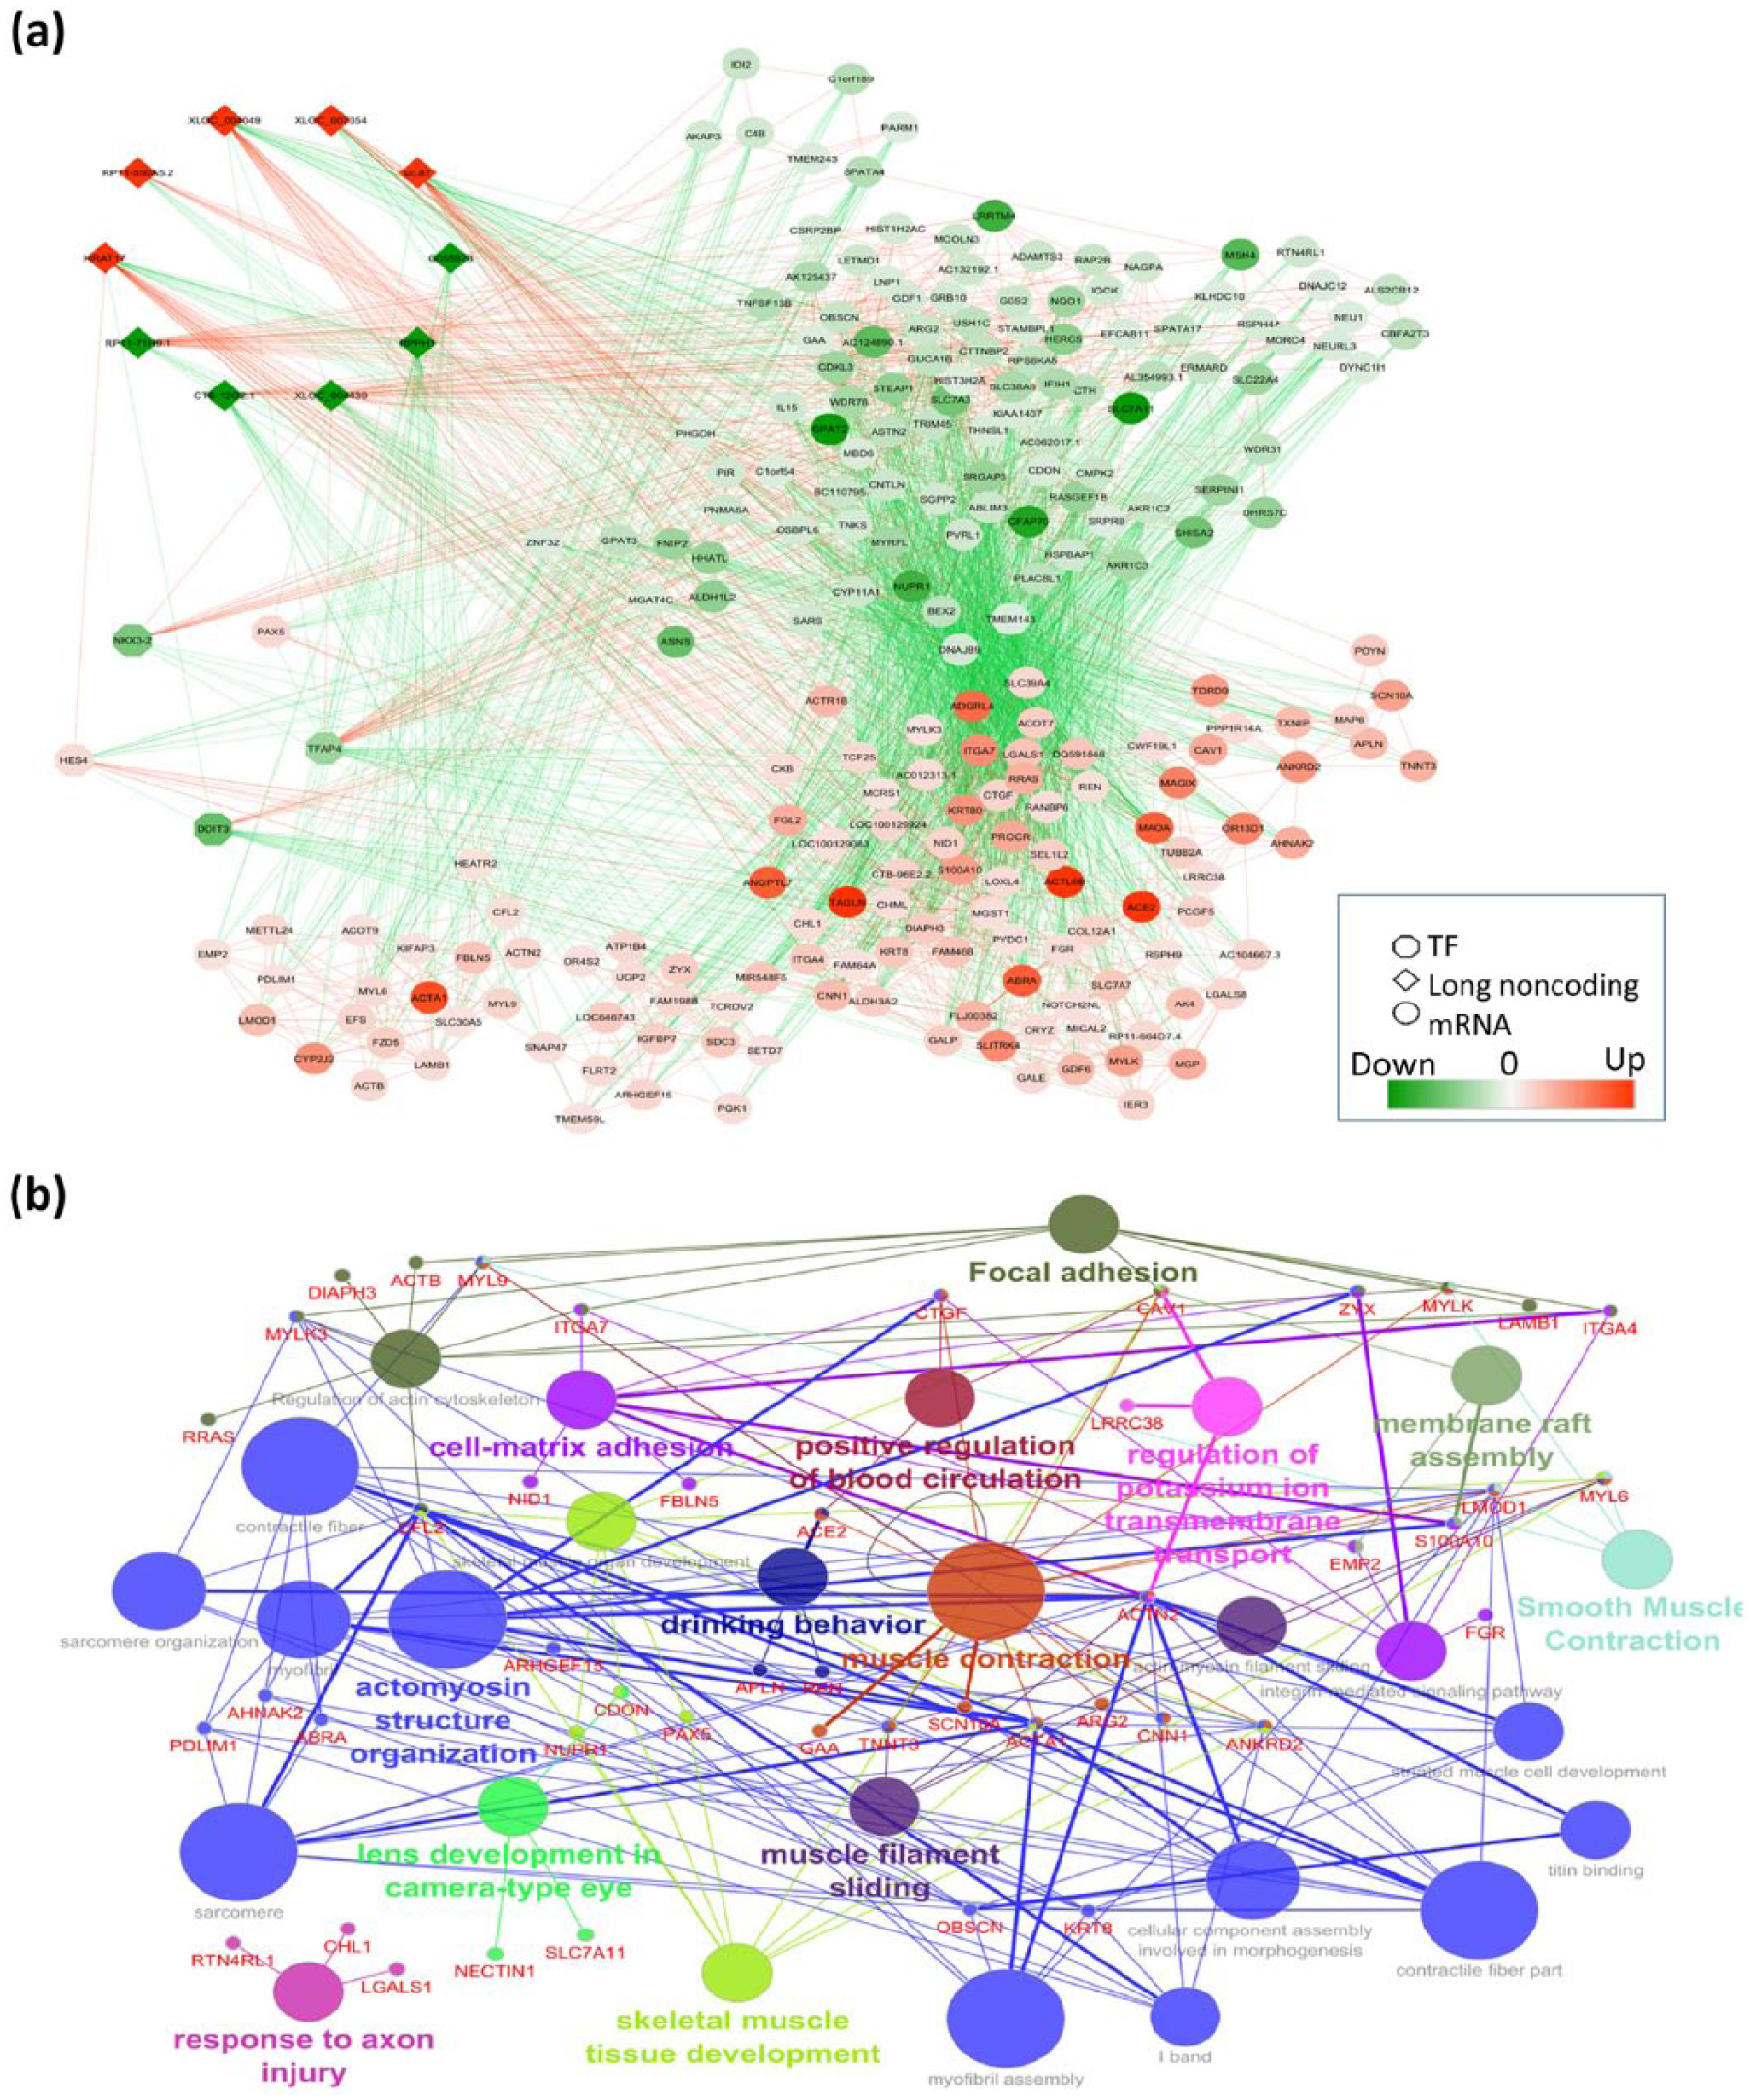
The network of differentially expressed lncRNAs, co-expressed genes, and TFs associated for top 10 deregulated pathways in DCM and pathway analysis of differentially expressed co-expressed genes. Diamond, circle and octagonal shapes of nodes represent lncRNAs, mRNAs and TFs: (a) upregulation and downregulation of nodes represented by red and green colour. Solid red and green line edges represent positive interaction and negative interaction between nodes. (b) The text represented in red correlated with 10 highly DE-lncRNAs associated with DCM. Different pathways represented in distinct colour.
Discussion
In the present study, we generated an in vitro human DCM model using hiPSC-CMs. We recapitulated the DCM features in hiPSC-CMs by treating cells with glucose, ET-1 and cortisol, which are well-known hormone mediators of diabetes. We conducted whole transcriptome microarray profiling of lncRNAs and mRNAs, and found the deregulated lncRNAs and mRNAs between the DCM and control samples. These deregulated lncRNAs (Gas-5, MIAT, H-19) and mRNAs (NPPA, NPPB, ACE-2, FABP-3, TNNI-1) are believed to be associated with disease pathogenesis. Our microarray data provide useful candidates who may serve as potential diagnostic biomarkers or therapeutic targets enhancing the efficacy of disease diagnostics and therapeutics in the future.
Advances in the field of stem cell technology allow us to use human iPSC-CMs for in vitro disease modelling. Using these iPSCs, we can understand not only the cardiac development but also model human CMs in healthy and diseased states. 9 Despite the extensive use of animal models to understand the DCM disease pathogenesis, the limitation is that all the disease-associated features cannot be recapitulated entirely highlighting the need of a robust platform for the development of therapeutic candidates having clinical significance. In this study, we applied the in vitro hiPSC-CM DCM model to study the potential lncRNA changes in the DCM. Most of the foetal-enriched genes like NPPA, NPPB and ACTA-1 were significantly upregulated in the DCM group to the OC group. We observed that most of the studied markers had significant expression change in our study. To strengthen the reliability of our disease model apart from looking at the expression of just a few specific hypertrophic markers, we also performed mRNA expression arrays on hiPSC-CMs to study the global gene expression profile. Interestingly, our array data represented the upregulation of most of the canonical hypertrophic markers like NPPA, NPPB and ACTA-1. Re-expression of natriuretic peptides (NPs) and their elevated circulating level in the plasma are widely accepted prognostic biomarkers for patients with heart failure and DCM.25,26
Some evidence has been provided in the past on the regulatory role of lncRNAs in heart development and diseases. 21 Using our established cardiomyopathy model based on hiPSC-CMs opens new possibilities to explore the pattern of lncRNAs expression changes as a function of disease along with their possible role in DCM pathogenesis. To investigate DCM-induced changes in lncRNAs expression, we performed microarray profiling, and our results show that 2046 lncRNAs were differentially expressed in the DCM group to OC-CMs. The expression difference regarding upregulated or downregulated DE-lncRNAs and DE-mRNAs in our DCM-CMs was twofold higher as compared to the OC-CMs. The ratio of upregulated and downregulated DE-lncRNA candidates was almost equal, indicating that both expression patterns are equally contributing towards disease pathogenesis. However, the downregulated candidates dominated for DE-mRNAs, although further investigation is required to ascertain which candidates are responsible for disease progression and pathogenesis. The DE-lncRNAs candidates were shown to be linked with diabetic complications as reported in our study and past studies. In the context of the chromosomal distribution of these DE-lncRNAs, most were long intergenic non-coding RNAs (lincRNAs) and antisense distributed on chromosomes 1, 2, 11 and 12. In-depth analysis revealed that the 60% of lincRNAs and its adjacent genes were co-expressed in the similar direction, which in future can be useful to decipher the regulatory mechanisms as for how they act on the genes in their vicinity. Moreover, most of these lincRNAs are associated with more than four neighbouring coding genes, whereas various aberrantly expressed lincRNAs regulate the expression of one protein-coding gene. Although the expression signature of these lincRNAs cannot substantiate their role in regulating the adjacent gene, it still opens a possibility for future studies.
The RT-qPCR was performed to validate the mRNA and lncRNA microarray results. Of the previously established mRNA associated with diabetic complications and heart failure, in our microarray expression profile, we found ACE-2, NPPA, NPPB, ACTA-1, FABP-3 and MYL-7 upregulated, while TNNI-1, CPT, PARP-6 and NKX.6 were downregulated significantly. Most of the predicted mRNA genes in our study are associated with the regulation and development of the CVD and DCM. NPPA, NPPB and ACTA-1 are predominantly expressed in the heart during the embryonic and foetal development; however, the expression of the same markers tends to attenuate gradually during foetal to postnatal switching. In the present study, we show reactivation of the foetal gene program (NPPA, NPPB and ACTA-1) post pro-diabetic stimulus similar to the pattern observed in pathophysiologic conditions like DCM. 27 Interestingly, we detected gene like FABP-3 (fatty acid binding protein–3), the protein product of which have been shown to facilitate the intake of free fatty acid (FFA) in the cardiac muscles promoting insulin resistance leading to cardiac dysfunction and heart failure. 28 Other significant targets like ACE-2 are also detected which have been shown to be altered in diabetic complications and are involved in CM hypertrophy and apoptosis in conjunction with increased oxidative damage development and regulation of DCM. 29 Our study further confirms the pro-hypertrophic and cardiomyopathy effect of the diabetic environment as targets like TNNI-1, CPT, PARP-6 and NKX.6 which are expressed in the heart show significant deregulation which is consistent with the past studies as these genes are essential components of cardiomyopathy signalling pathways and their depletion alters the mechanical properties of myocardium often seen in the advanced stages of heart failure.30,31 The altered expression of all the cardiomyopathy markers provides firm evidence that the surrogate DCM phenotype observed in our cell model is induced by pro-diabetic stimulus and recapitulates the in vivo changes induced by glucose, ET-1 and cortisol observed in humans with DCM. The observations in the present study substantiate the role of the mRNA gene expression in disease pathogenesis.
In the current study hypertrophy, lncRNAs like MIAT and Gas-5 also seem to be consistent with the mice and human studies. In the past, MIAT has been associated with CVDs such as myocardial infarction, microvascular dysfunction and CAD. Recent studies report that MIAT plays a very crucial role in the disease pathogenesis of STZ (Streptozotocin)-induced DCM in rats.20,32–34 The expression level of MIAT was upregulated in our profiling data and was consistent with previous studies. Our microarray data also show Gas-5 level to be downregulated in the DCM group, which resembles past studies conducted with serum samples of 96 US military veterans showing that decreased level of Gas-5 in serum samples was related to diabetes. 35 All of these results depict the diversified role of lncRNAs in diabetes disease progression and pathogenesis.
To gain mechanistic insight into the potential function of the targets of deregulated lncRNAs, GO and KEGG pathway enrichment analyses were performed. Our study revealed that deregulated genes were profoundly associated with inflammation, structural reorganization, focal adhesion, basic metabolic processes and signal transduction which are consistent with the researches in the past. Previous studies depict that the signalling pathways like leukocyte trans-endothelial migration, focal adhesion and regulation of the actin cytoskeleton are associated with DCM pathogenesis. Besides these, the results from our study also demonstrate that the pathways like gap junction, tight junction and cell cycle were involved in the pathogenesis of DCM. These pathway analysis results show that the phenotype changes induced by the DM in the dish recapitulate the expression pattern observed in vivo in a diabetic patient with progressive DCM. Therefore, these results provide new possibilities for further studies on DCM.
Although the detailed mechanism regarding the role of specific lncRNAs in DCM is unknown, the altered lncRNAs may act as a vital regulator of coding genes contributing towards DCM pathogenesis. To decipher the regulatory role of lncRNAs, using the bioinformatics approach we performed the CNC network analysis for our profiling data showing that one coding transcript can be influenced by multiple lncRNAs. Our CNC network provides a comprehensive view of all the possible coding–non-coding interactions associated with DCM background. There has been increasing evidence that has reported the use of these CNC networks to get a better understanding about the disease aetiology and also identifying potential lncRNAs associated with significantly deregulated pathways which in future may turn out to be functionally relevant.36,37 Our CNC network showed 48,155 meaningful connections made up from 2046 lncRNAs and 1582 mRNA network nodes. From the lncRNA-mRNA co-expression network for significantly deregulated pathways in our study, we found that lncRNAs XLOC_004049, XLOC_007354, HRAT17, uc.87, RP11-550A5.2, G055978, CTB-12O2.1, RPPH1, XLOC_004430 and RP11-71H9.1 had the most robust correlation and were co-expressed with maximum mRNA, which in the past have been shown to be key contributors in the development of cardiac abnormalities.29,38 As most of the lncRNAs in our CNC network, are not studied well in the past, it will be exciting to perform a detailed study in the future which will allow us to have a better understanding of the underlying mechanisms associated with them.
In summary, DCM remains one of the major factors contributing towards CVD and heart failure. The hiPSCs not only serve as an immortal resource to generate healthy CMs but also allow us to manipulate in vitro the non-genetic components involved in the disease pathogenesis. This model will enable us to direct the external environment, opening the possibility to study the changing molecular pathways and gene expression as a function of epigenetic modifications. These epigenetic modifications are understood to play a profound role in disease progression and pathogenesis. With limitations in the current therapeutic options, lncRNAs are emerging as promising therapeutic targets. Our microarray profiling data for lncRNAs and mRNAs not only provide a better understanding of their underlying molecular mechanisms but also reveal new lncRNAs and gene targets, playing a crucial role in diabetic progression. We believe that focusing on these novel therapeutic targets will mitigate cardiac apoptosis and inflammation, and upregulate cardioprotective pathways in the near future.
Supplemental Material
dvdres-may-2018-00078-File003-Supplemntary-File – Supplemental material for Microarray analysis of long non-coding RNA and mRNA expression profiles in diabetic cardiomyopathy using human induced pluripotent stem cell–derived cardiomyocytes
Supplemental material, dvdres-may-2018-00078-File003-Supplemntary-File for Microarray analysis of long non-coding RNA and mRNA expression profiles in diabetic cardiomyopathy using human induced pluripotent stem cell–derived cardiomyocytes by Tarun Pant, Manoj K. Mishra, Xiaowen Bai, Zhi-Dong Ge, Zeljko J. Bosnjak and Anuradha Dhanasekaran in Diabetes & Vascular Disease Research
Footnotes
Acknowledgements
A.D., T.P. and Z.J.B. helped in conceptualization; T.P. helped in data curation; A.D., T.P. and Z.J.B. helped in formal analysis; Z.J.B., helped in funding acquisition; T.P., M.K.M., X.B., A.D., Z-DG and Z.J.B., helped in investigation; T.P., M.K.M. and A.D. verified methodology; T.P., A.D. and Z.J.B. supervised project administration; Z.J.B. and A.D., helped in finding the resources; T.P. and M.K.M. helped out in software; T.P., M.K.M., A.D., X.B. and Z.J.B. helped in validation; T.P., A.D., Z.J.B. and M.K.M. helped in visualization; T.P., Z.J.B. and A.D. contributed to the writing of the original draft; and A.D., X.B. and Z.J.B. took the lead in writing, review and editing.
Declaration of conflicting interests
The author(s) declared no potential conflicts of interest with respect to the research, authorship, and/or publication of this article.
Funding
The author(s) disclosed receipt of the following financial support for the research, authorship, and/or publication of this article: This work was supported, in part, by a National Institutes of Health research grant P01GM 066730 to ZJB from the United States Public Health Services, Bethesda, Maryland, USA & MHRDCEMA F.NO-5-3/2015-TS VII and BUILDER program BT/PR12153/INF/22/200/2014 to AD. We acknowledge the financial support from DST-UKEIRI DST/INT/UK/P-50/2012 to TP. The funding body had no role in the design of the study, collection, analysis, and interpretation of data, and in writing the manuscript.
Supplemental material
Supplemental material for this article is available online.
References
Supplementary Material
Please find the following supplemental material available below.
For Open Access articles published under a Creative Commons License, all supplemental material carries the same license as the article it is associated with.
For non-Open Access articles published, all supplemental material carries a non-exclusive license, and permission requests for re-use of supplemental material or any part of supplemental material shall be sent directly to the copyright owner as specified in the copyright notice associated with the article.