
Abstract
Propose:
To investigate the temporal relationship between plasma fibroblast growth factor 21 levels, insulin resistance, metabolic dysfunction and cardiac fibroblast growth factor 21 resistance in long-term high-fat diet–induced obese rats.
Methods:
In total, 36 male Wistar rats were fed with either a normal diet or high-fat diet for 12 weeks. Blood was collected from the tail tip, and plasma was used to determine metabolic profiles and fibroblast growth factor 21 levels. Rats were sacrificed at weeks 4, 8 and 12, and the hearts were rapidly removed for the determination of cardiac fibroblast growth factor 21 signalling pathways.
Results:
Body weight and plasma fibroblast growth factor 21 levels were increased after 4 weeks of consumption of a high-fat diet. At weeks 8 and 12, high-fat diet rats had significantly increased body weight and plasma fibroblast growth factor 21 levels, together with increased plasma insulin, HOMA index, area under the curve of glucose, plasma total cholesterol, plasma low-density lipoprotein cholesterol, serum malondialdehyde and cardiac malondialdehyde levels. However, plasma high-density lipoprotein cholesterol levels and cardiac fibroblast growth factor 21 signalling proteins (p-FGFR1 Tyr154, p-ERK1/2 Thr202/Tyr204 and p-Akt Ser473) were decreased, compared with normal diet rats.
Conclusion:
These findings suggest that plasma fibroblast growth factor 21 levels could be an early predictive biomarker prior to the development of insulin resistance, metabolic disturbance and cardiac fibroblast growth factor 21 resistance.
Keywords
Introduction
Fibroblast growth factor 21 (FGF21) is known to be a key regulator of various metabolic functions involving both glucose and fat metabolism. 1 High levels of FGF21 have been observed in the models of obese insulin-resistant animals and diabetic animals.2,3 Clinical studies demonstrated that increased circulating FGF21 may be associated with the development of insulin resistance and metabolic syndrome.4–6 Lee et al. 7 found that serum FGF21 levels showed a positive correlation with lipid profiles, insulin resistance and pericardial fat volume, but the correlations were independent of obesity in metabolic syndrome patients. Moreover, a recent clinical study also suggested that higher circulating FGF21 levels could be a predictor of future adverse cardiovascular events in type 2 diabetic patients. 8 However, currently, the temporal association between FGF21 level and insulin resistance is still unclear. Understanding this temporal association including an early detection of increases in circulating FGF21 levels could be important in the prediction and prevention of future metabolic status and adverse cardiovascular events.
We have previously reported that long-term high-fat diet (HFD) consumption caused obese insulin resistance along with cardiac autonomic imbalance in an obese insulin-resistant model, which was observed at week 8 after the start of consumption of an HFD, whereas cardiac dysfunction was observed later, at week 12 after the start of consumption of an HFD.9,10 In addition, we also found that plasma FGF21 levels and cardiac FGF21 resistance were observed in conditions of obese insulin resistance induced by HFD consumption.3,11 However, the temporal changes in FGF21 as well as whether alterations in levels of plasma FGF21 and cardiac FGF21 signalling pathways occur prior to or simultaneously with insulin resistance in HFD-induced obese insulin-resistant rats have never been investigated. In addition, the association between FGF21 level and other metabolic parameters and lipid profiles is still unknown.
We tested the hypothesis that increased plasma FGF21 develops prior to insulin resistance, metabolic disturbance and cardiac FGF21 resistance in HFD-induced obese insulin-resistant rats.
Materials and methods
Ethical approval
All experiments in this study were approved by the Faculty of Medicine, Chiang Mai University Institutional Animal Care and Use Committee (permit no. 006/2557), in compliance with National Institutes of Health (NIH) guidelines and in accordance with the ARRIVE guidelines for reporting experiments involving animals.
Animals and diet
In total, 36 adult male Wistar rats weighing 180–200 g were obtained from the National Animal Center, Salaya Campus, Mahidol University, Bangkok, Thailand. All rats were housed in a controlled temperature and humidity environment, with a 12:12-h light–dark cycle. Rats were fed with either a normal diet (ND: a standard laboratory rat diet, containing 19.77%E fat, CP 082, Bangkok, Thailand) or HFD (a diet containing 59.28%E fat) for 12 weeks. The ND and HFD components have been described previously. 11
The experiments and study protocol
After allowing 1 week for acclimatization, rats were divided into two groups and were given either ND (n = 18) or HFD (n = 18) for 12 weeks. Body weight and food intake were recorded every week. All rats were fasted for 5 h prior to being subjected to blood collection to determine all metabolic parameters. Prior to the oral glucose tolerance test (OGTT), rats were fasted overnight. At the end of the experiments (weeks 4, 8 and 12), rats were sacrificed, and hearts were removed for the determination of cardiac FGF21 signalling pathways. In addition, after euthanasia using Zoletil (zolazepam/tiletamine) 50 mg/kg combined with xylazine 3 mg/kg via intramuscular injection, the visceral fat was removed from the rats and weighed. 12
Metabolic parameters and plasma FGF21 assessments
A commercial colorimetric assay kit (BioVision, Milpitas, CA) was used for determining the plasma high-density lipoprotein cholesterol (HDL-C) level.11,13 Then, the Friedewald equation was used to calculate the plasma low-density lipoprotein cholesterol (LDL-C) levels.11,14,15 A commercial colorimetric assay kit (Erba Diagnostics Mannheim GmbH, Mannheim, Germany) was used for the determination of fasting plasma glucose (FPG), plasma total cholesterol (TC) and plasma triglyceride (TG) levels.11,14,16 The commercial sandwich enzyme-linked immunosorbent assay (ELISA) kit (LINCO research, St Charles, MO) was used to determine the plasma insulin levels.11,13,14 The degree of insulin sensitivity was determined using the homeostasis model assessment (HOMA) index, an increase in the HOMA index indicates an increase in the insulin resistance.11,17 Moreover, a quantitative sandwich enzyme immunoassay technique using a mouse/rat FGF21 ELISA kit (R&D systems, Inc., Minneapolis, MN) was used for the determination of plasma FGF21 levels.11,18
OGTT and area under the curve of glucose
The OGTT was investigated at baseline and at the end of weeks 4, 8 and 12 of the dietary periods. The animals were fasted for 12 h before they underwent an OGTT. Blood was collected from a small cut at the tip of the tail immediately before 2 g/kg body weight glucose feeding via oral gavage and then blood was collected at 15, 30, 60 and 120 min after glucose feeding. The glucose analysis was performed with a colorimetric assay kit (ERBA Mannheim, Mannheim, Germany).16,17 Moreover, the area under the curve of glucose (AUCg) was investigated from glucose curve by OGTT.16,17
Determination of serum and cardiac malondialdehyde concentration
HPLC-based assay (Thermo Scientific, Bangkok, Thailand) was used for the determination of cardiac tissue and plasma malondialdehyde (MDA) concentrations.9,11,13 Plasma and cardiac tissue were mixed with H3PO4 and thiobarbituric acid (TBA) to produce TBA reactive substances (TBARSs). The plasma and cardiac TBARS concentration were determined directly from a standard curve and reported as equivalent to the MDA concentration.9,11,13
Determination of cardiac protein expression by western blot analysis
Cardiac tissues for determining the FGF21 signalling pathways were obtained from the fresh hearts at the LV apex. 11 The general procedures of western blot analysis are described in previous studies.11,19,20 The FGF21 signalling proteins expression were determined including FGFR1 and p-FGFR1 Tyr154 (1:200 and 1:200 dilution, respectively; Sigma–Aldrich, China); β-Klotho, ERK1/2, p-ERK1/2 Thr202/Tyr204, PGC-1α and β-actin (1:200, 1:1000, 1:1000, 1:1000 and 1:2000 dilution, respectively; Santa Cruz, Starr County, TX); Akt and p-Akt Ser473 (1:1000 and 1:1000 dilution, respectively, Cell Signaling Technology, Danvers, MA). 11 The primary antibody was detected by horse anti-mouse immunoglobulin G (IgG) conjugate horseradish peroxidase (HRP)-linked antibody (1:2000 dilution; Cell Signalling Technology) for β-actin11,20 and rabbit anti-goat IgG conjugate HRP-linked antibody (1:2000 dilution; Santa Cruz) for β-Klotho. Moreover, FGFR1, p-FGFR1 Tyr154, ERK1/2, p-ERK1/2 Thr202/Tyr204, Akt, p-Akt Ser473 and PGC-1α were detected by goat anti-rabbit IgG conjugate HRP-linked antibody (1:2000 dilution; Cell Signalling Technology). 11 The membranes were developed using the ChemiDoc touch imaging system (Bio-Rad Laboratories, Hercules, CA) on chemiluminescence mode.11,21–24 The densitometric analysis was determined using the image J program.11,25 Each protein expression was normalized with β-actin expression. 11
Statistical analysis
Data were expressed as mean ± SEM. A two-way repeated measures analysis of variance (ANOVA) was used to test the difference between group and time point. Data were analysed using SPSS statistics software version 22. A value of p < 0.05 was considered statistically significant.
Results
Metabolic dysfunction was found at weeks 8 and 12
At baseline (week 0), all metabolic parameters were similar in both the ND and HFD groups (Figure 1). At week 4, in the ND group, the body weight was significantly increased, compared to the ND group at baseline (Figure 1(a)). In the HFD group, the body weight was increased, compared to the HFD group at baseline and ND group at week 4 (Figure 1(a)).
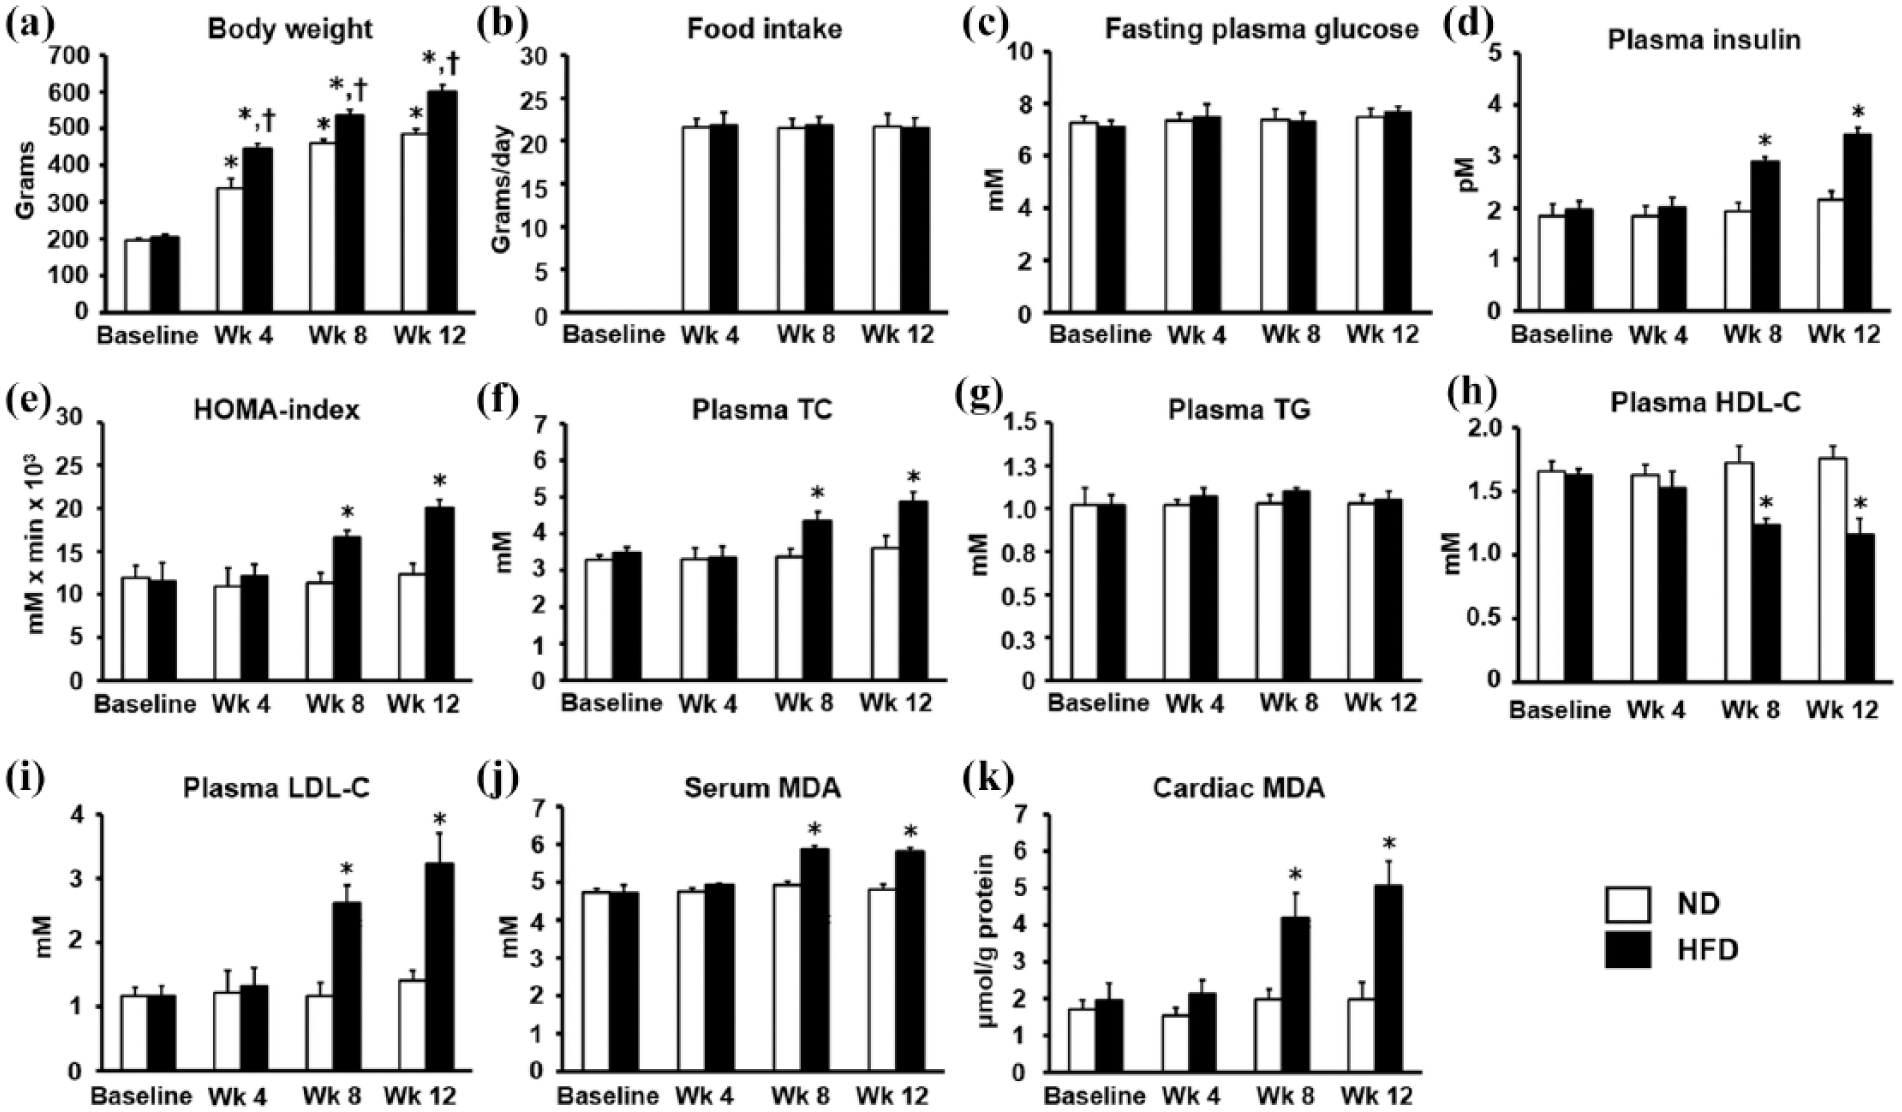
The effects of ND and HFD consumption at different time points on metabolic parameters, insulin resistance and lipid peroxidation levels (n = 6/group): (a) body weight, (b) food intake, (c) fasting plasma glucose, (d) plasma insulin, (e) HOMA index, (f) plasma TC, (g) plasma TG, (h) plasma HDL-C, (i) plasma LDL-C, (j) serum MDA levels and (k) cardiac MDA levels.
At week 8, in the ND group, the body weight was significantly increased, compared to the ND group at baseline (Figure 1(a)). In the HFD group, the body weight was increased (Figure 1(a)), along with increased plasma insulin, HOMA index, plasma TC, plasma LDL-C, serum MDA and cardiac MDA levels (Figure 1(d) to (f), (i) to (k), respectively), whereas plasma HDL-C was significantly decreased (Figure 1(h)), when compared to the HFD group at baseline and the ND group at week 8.
At week 12, in the ND group, the body weight was significantly increased when compared to the ND group at baseline (Figure 1(a)). Moreover, in the HFD group, the visceral fat weight was significantly increased when compared to the ND group (59 ± 4 g versus 30 ± 5 g, p < 0.05). In the HFD group, the body weight was increased (Figure 1(a)), along with increased plasma insulin, HOMA index, plasma TC, plasma LDL-C, serum MDA and cardiac MDA levels (Figure 1(d) to (f), (i) to (k), respectively), whereas plasma HDL-C was significantly decreased, compared to the HFD group at baseline and the ND group at week 12.
Insulin resistance was found at weeks 8 and 12
At baseline and week 4, plasma glucose curve and AUCg by OGTT at each time point were unchanged between groups (Figure 2(a), (b) and (e), respectively). At week 8 and week 12, significant increases in plasma glucose levels at 30, 60 and 120 min were found in HFD group, when compared to the ND group (Figure 2(c) and (d), respectively). Moreover, the AUCg by OGTT was increased at week 8 and week 12 in the HFD group, when compared to the ND group (Figure 2(e)).
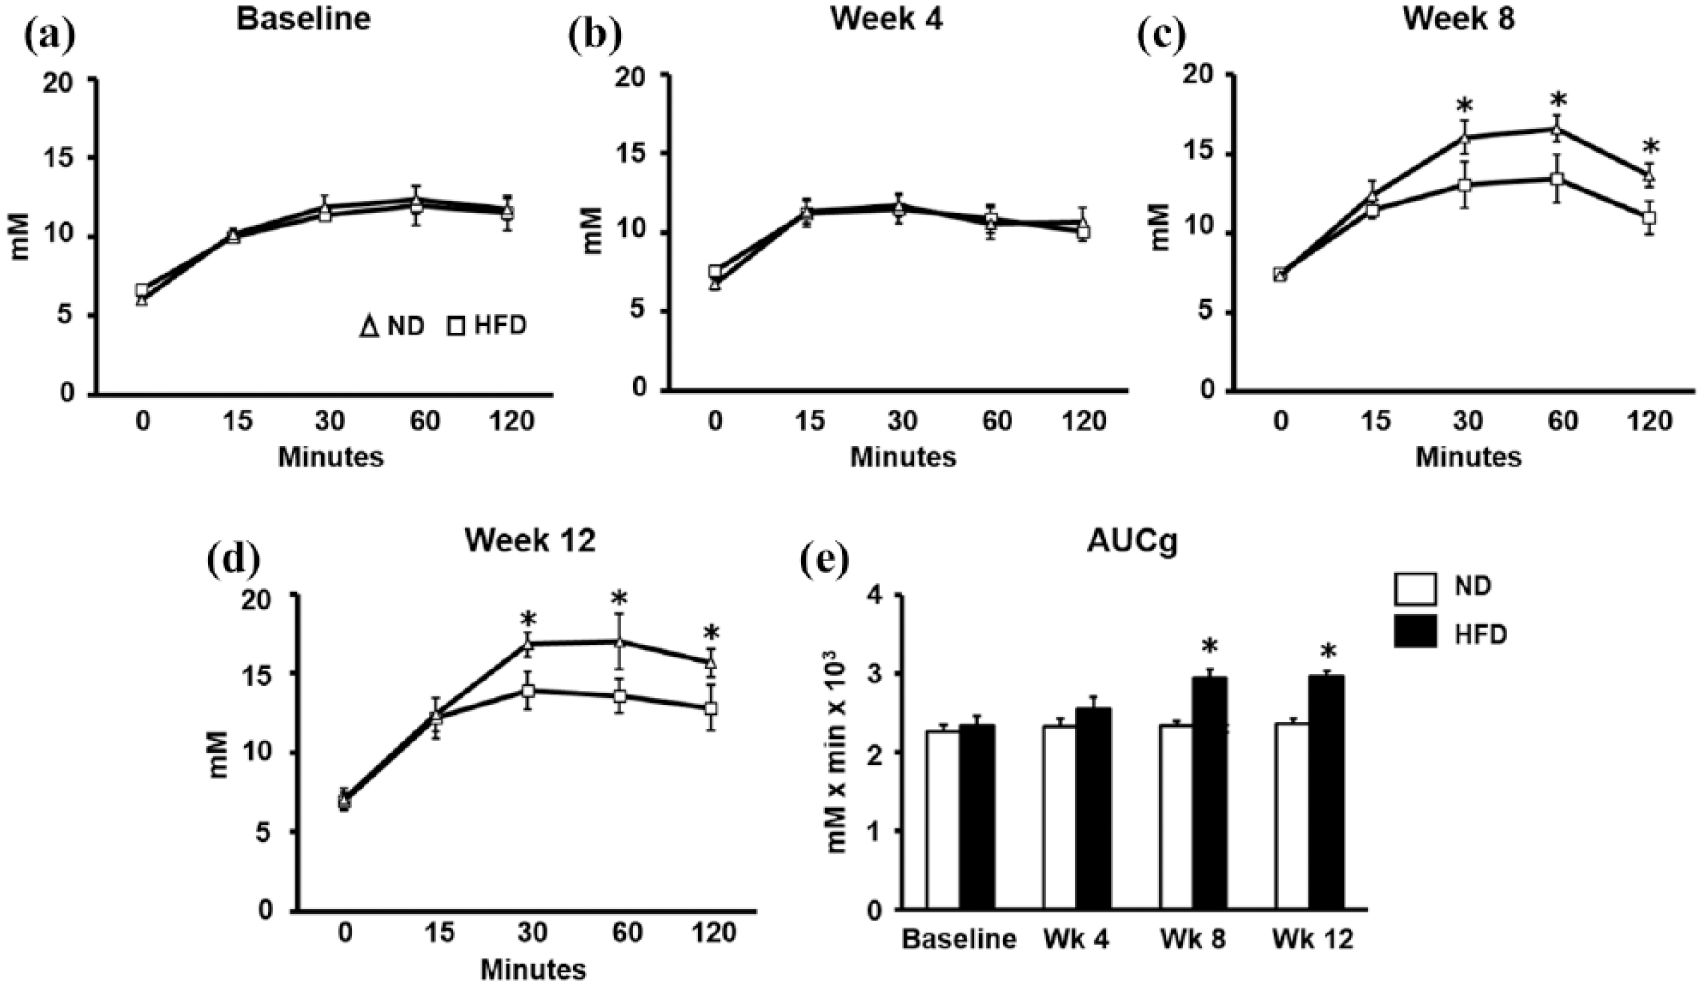
The effects of ND and HFD consumption at different time points on plasma glucose levels and AUCg by oral glucose tolerance test (OGTT; n = 6/group): (a) plasma glucose curve at baseline, (b) plasma glucose curve at week 4, (c) plasma glucose curve at week 8, (d) plasma glucose curve at week 12 and (e) AUCg.
Plasma FGF21 levels elevated precede the impairment of cardiac FGF21 signalling pathways
At week 4, significant increases in plasma FGF21 levels were found in the HFD group, compared to the ND group (Figure 3(a)). FGF21 signalling pathways including p-FGFR1 Tyr154, FGFR1, β-Klotho, p-ERK1/2 Thr202/Tyr204, ERK1/2, p-Akt at Ser473, Akt and PGC-1α expression in the HFD group showed no change, compared to the ND group (Figure 3(c) to (j), respectively). At week 8, significant increases in plasma FGF21 levels were found in the HFD group, compared to the ND group (Figure 3(a)). In addition, significant decreases in p-FGFR1 Tyr154, p-ERK1/2 Thr202/Tyr204, p-Akt at Ser473 and PGC-1α expression were found in the HFD group, compared to the ND group (Figure 3(c), (f), (h) and (j), respectively). Similar results as week 8 were observed at week 12. However, the FGFR1, β-Klotho, ERK1/2 and Akt expressions were not changed between groups (Figure 3(d), (e), (g) and (i), respectively).
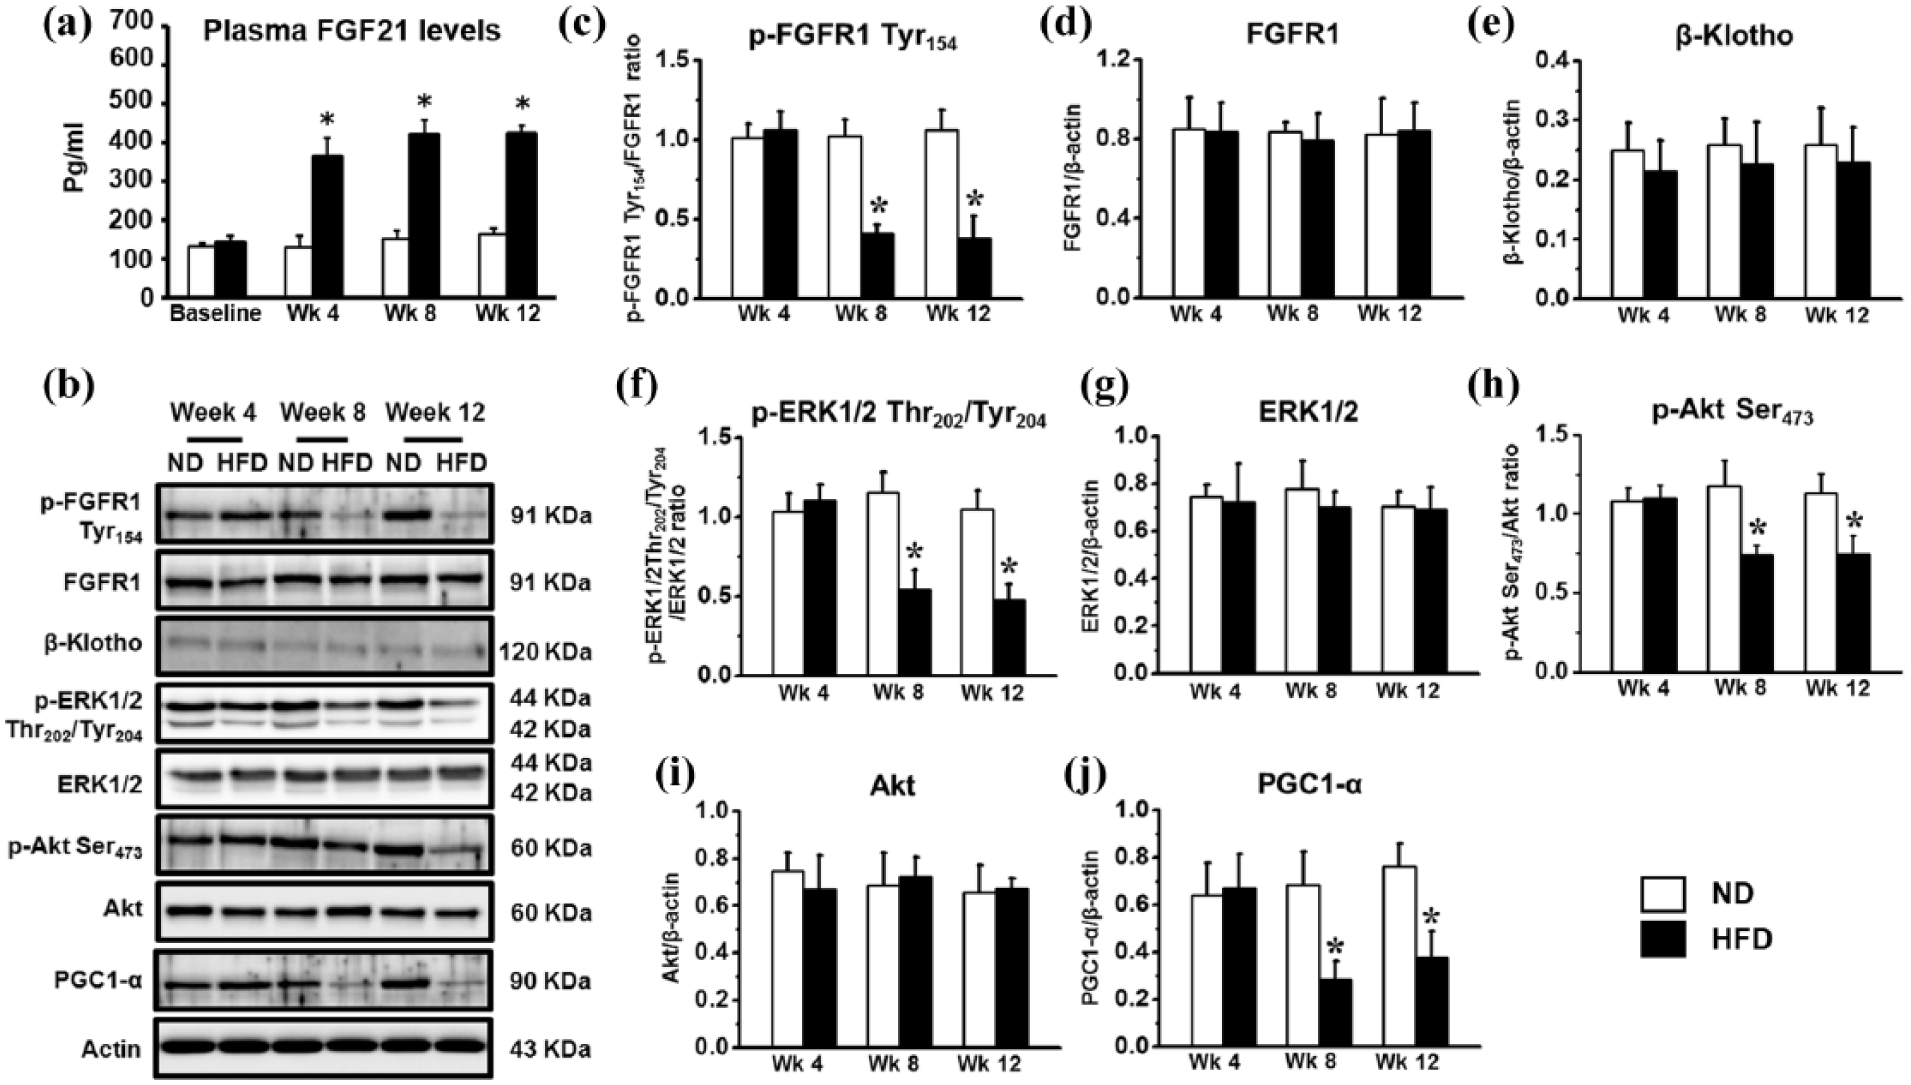
The temporal changes of p-FGFR1 Ser154, FGFR1, β-Klotho, p-Erk1/2 Thr202/Tyr204, Erk1/2, p-Akt Ser473, Akt and PGC1-α expression in the heart tissue after HFD consumption (n = 5–6/group): (a) plasma FGF21 levels, (b) Western bands of FGF21 signalling pathways, (c) p-FGFR1 Tyr154, (d) FGFR1, (e) β-Klotho, (f) p-Erk1/2 Thr202/Tyr204, (g) Erk1/2, (h) p-Akt Ser473, (i) Akt and (j) PGC-1α in ND and HFD rats at week 4, week 8 and week 12.
Discussion
The major findings of this study are as follows: (1) increased plasma FGF21 levels and body weight were first found after 4 weeks of HFD consumption; this occurred prior to peripheral insulin resistance and other metabolic disturbances. (2) Impaired cardiac FGF21 signalling pathways were found at week 8 and week 12 of HFD consumption.
FGF21 levels are elevated in HFD-induced obesity.2,4 In obese individuals, excessive fat accumulation has been shown to activate FGF21 synthesis and release 26 via several mechanisms which involve G-protein-coupled receptor (GPR) activation 26 and peroxisome proliferator-activated receptor (PPAR) protein family activation 27 and correspond to conditions of FGF21 resistance.2,4,28 This mechanism leads to increased plasma FGF21 in obese individuals. The temporal changes of FGF21 after HFD-induced obese insulin resistance demonstrated that FGF21 levels were increased prior to alteration of other metabolic parameters, except for body weight and visceral fat weight gain. These data suggest that FGF21 levels are associated with increase in body weight and visceral fat weight gain following HFD consumption. These changes were not observed in the ND group, indicating the influence of the amount of body fat accumulation, calorie intake and/or percentage of fat in the diet. However, future investigation is needed to give more detailed evidence concerning these findings.
Fisher et al. 2 reported that 22 weeks of feeding with a high-fat/high-sucrose diet in mice causes FGF21 resistance in the liver and white adipose tissues. Moreover, it has also been shown that FGF21 resistance in the heart of obese rats was found at 12 weeks after HFD feeding.2,3,11,28,29 However, the time-course study to investigate the actual development of FGF21 resistance in the heart before 12 weeks of HFD feeding was not available. The results in this study demonstrated that the increasing plasma FGF21 levels preceded cardiac FGF21 resistance. Since the FGF21 signalling pathways in the heart play an important role in the regulation of redox homeostasis, anti-apoptosis, anti-oxidative stress, anti-inflammation and myocardial biogenesis,30–33 the FGF21 resistance in the heart may contribute to a higher impact on the pathogenesis of cardiovascular diseases than FGF21 resistance in other tissues. Moreover, the understanding in the alteration of systemic FGF21 levels and FGF21 signalling pathways in the heart could be clinically useful especially for the cardioprotective interventions. However, this hypothesis is also still unknown and will need further investigation.
PGC1-α is an essential transcriptional coactivator and acts as an important regulators of mitochondrial metabolism in the heart.34,35 Moreover, PGC1-α is well known to interact with a nuclear receptors PPAR family especially alpha subtype (PPAR-α) in the heart.34,35 This interaction in the heart plays an important role in myocardial biogenesis especially for the regulation of fatty acid uptake and fatty acid β-oxidation (FAO) enzyme synthesis.34–36 Since FAO is a primary source of ATP production for cardiac metabolism under physiological condition,30,37 a decrease in PGC1-α expression in the heart may impair a myocardial biogenesis through a decreasing in fatty acid uptake and FAO.
FGF21 resistance remains a key focus for explaining the effects of HFD-induced FGF21 release.2,28 This resistance to FGF21 after consumption of an HFD was characterized by increased FGF21 levels in the cited tissues and organs2,3,28,38 along with impaired FGF21 receptor function,2,3,28,38 plus low response to exogenous FGF21.2,28 Although long-term HFD consumption can activate an FGF21-resistant condition, the characteristic of FGF21 resistance in each organ is specific. However, the role of HFD consumption on the characteristics of FGF21 resistance, especially in the heart, is still controversial.3,11,28 Our present study demonstrated that cardiac FGF21 receptor function and downstream signalling pathways are still intact at week 4 in the HFD group, whereas at weeks 8 and 12 after the start of consumption of an HFD, impairment of cardiac FGF21 receptor function and downstream signalling pathways were shown. These findings suggested that the elevation of plasma FGF21 levels may be an indicator of the pre-insulin-resistant state. Moreover, high FGF21 levels may be an early predictive biomarker for the development of insulin resistance and metabolic dysfunction.
Conclusion
An early state of FGF21 resistance developed prior to insulin resistance and other metabolic disturbances, and was associated with body weight gain in HFD-fed rats. These findings suggest that increased plasma FGF21 levels could be a predictive biomarker for future development of insulin resistance and metabolic dysfunction.
Footnotes
Acknowledgements
The authors would like to thank Ms Maria Love for her editorial assistance with this article.
Declaration of conflicting interests
The author(s) declared no potential conflicts of interest with respect to the research, authorship and/or publication of this article.
Funding
This work was supported by an NSTDA Research Chair Grant from the National Science and Technology Development Agency Thailand (NC), grants from the Thailand Research Fund Royal Golden Jubilee PhD Program (PT&SC) and RTA6080003 (SC) and a Chiang Mai University Center of Excellence Award (NC).