
Abstract
Objective:
To non-invasively evaluate differences in oxidative metabolism in individuals with obesity compared to normal weight using the near-infrared spectroscopy and vascular occlusion technique during hyperglycaemia.
Methods:
In all, 16 normal-weight individuals (body mass index: 21.3 ± 1.7 kg/m2) and 13 individuals with obesity (body mass index: 34.4 ± 2.0 kg/m2) had five vascular occlusion tests (pre, 30, 60, 90 and 120 min after glucose ingestion). Oxygen utilization was estimated from the area under the curve of the deoxyhemoglobin [HHb] signal during occlusion. Muscle reperfusion was derived from the area above the curve after cuff release.
Results:
The deoxyhemoglobin area under the curve during occlusion of the normal-weight individuals increased from 15,732 ± 2344 (% . s) at pre to 18,930 ± 3226 (% . s) (p < 0.05) at 90 min after glucose ingestion. The deoxyhemoglobin area under the curve during occlusion decreased significantly from 14,695 ± 3341 (% . s) at pre to 11,273 ± 1825 (% . s) (p < 0.05) and 11,360 ± 1750 (% . s) (p < 0.05) at 30 and 60 min, respectively, after glucose ingestion. The area above the curve of deoxyhemoglobin during reperfusion decreased significantly from 6450 ± 765 (% . s) at pre to 4830 ± 963 (% . s) (p < 0.05) at 60 min and to 4210 ± 595 (% . s) (p < 0.01) at 90 min in normal-weight individuals after glucose ingestion, with no changes observed in individuals with obesity.
Conclusion:
This study confirmed in vivo and non-invasively the metabolic inflexibility of skeletal muscle in individuals with obesity during hyperglycaemia.
Introduction
Obesity is a prevalent chronic disease that is tightly linked to insulin resistance and, consequently, longer exposure to postprandial hyperglycaemia.1–3 Acute hyperglycaemia is known to upregulate mitochondrial function which in turn increases oxidative metabolism.4–6 Exposure to high concentrations of glucose increases the rate of respiration by increasing pyruvate formation and activating the mitochondrial carbonic anhydrases. 4 These enzymes generate bicarbonate, which combine with pyruvate to form oxaloacetate, a key regulator of oxidative metabolism. 7 Importantly, previous studies have shown that obesity is associated with reduced markers of mitochondrial biogenesis, mitochondrial dysfunction and impaired oxidative metabolism.8,9 Additionally, it has been observed that myocyte cells taken from human quadriceps of individuals with obesity showed reduced capacity to switch between oxidizing fat and glucose compared to normal-weight individuals, when exposed to hyperglycaemia. 10
Although changes in glucose metabolism and the adjustments of the oxidative system are important to study in individuals with obesity, oxidative metabolism has been mainly assessed through invasive approaches or in animal models.5,6,11,12 Recently, a study comparing mitochondrial respiratory capacity using non-invasive near-infrared spectroscopy (NIRS)-derived changes in deoxyhemoglobin with the high-resolution respirometry technique showed that both techniques were strongly correlated for assessing oxidative metabolism. 13 Furthermore, measurements of deoxyhemoglobin in the microvasculature assessed by NIRS have been shown to be able to detect differences between individuals with mitochondrial dysfunction and healthy controls. 14
Therefore, this study aimed to non-invasively evaluate differences in oxidative metabolism in individuals with obesity compared to normal weight using NIRS measurements combined with a vascular occlusion technique (VOT), before and after a hyperglycaemic challenge.
Materials and methods
Participants
In total, 16 young normal-weight individuals (25.2 ± 1.2; 10 males and 6 females) and 13 young individuals with obesity (23.4 ± 1.1; 9 males and 4 females) who had not been diagnosed with any disease took part in this study. Participants who had systolic blood pressure higher than 139 mmHg and/or diastolic blood pressure higher than 89 mmHg or who were smokers or on long-term medications were excluded from the study. After reading and signing an informed consent form, the participants were submitted to the experimental procedure. This study was approved by the Conjoint Health Research Ethics Board of the University of Calgary. This study adhered to the principles established in the Declaration of Helsinki.
Experimental procedure
Participants were required to arrive in the laboratory after 12 h of overnight fasting for baseline measures (pre) before ingesting a high-glucose content beverage. This portion of the testing included taking measures of blood pressure and blood glucose concentration and recording the NIRS-derived deoxyhemoglobin (HHb) signal before, during and immediately after a period of blood flow occlusion. After the Pre measures were completed, the participants ingested a beverage containing 75 g of glucose dissolved in 296 mL of water (Azer Scientific, Morgantown, PA, USA). Blood glucose concentration as well as deoxyhemoglobin data were assessed similarly to pre at 30, 60, 90 and 120 min after glucose ingestion (Figure 1). Capillary blood samples were collected by a finger prick using a lancet (Unistik 3; Owen Mumford, Maneta, GA, USA), and blood glucose concentration was measured with a glucometer (OneTouch Ultra2; LifeScan, Zug, Switzerland) 1 min prior to each testing time.
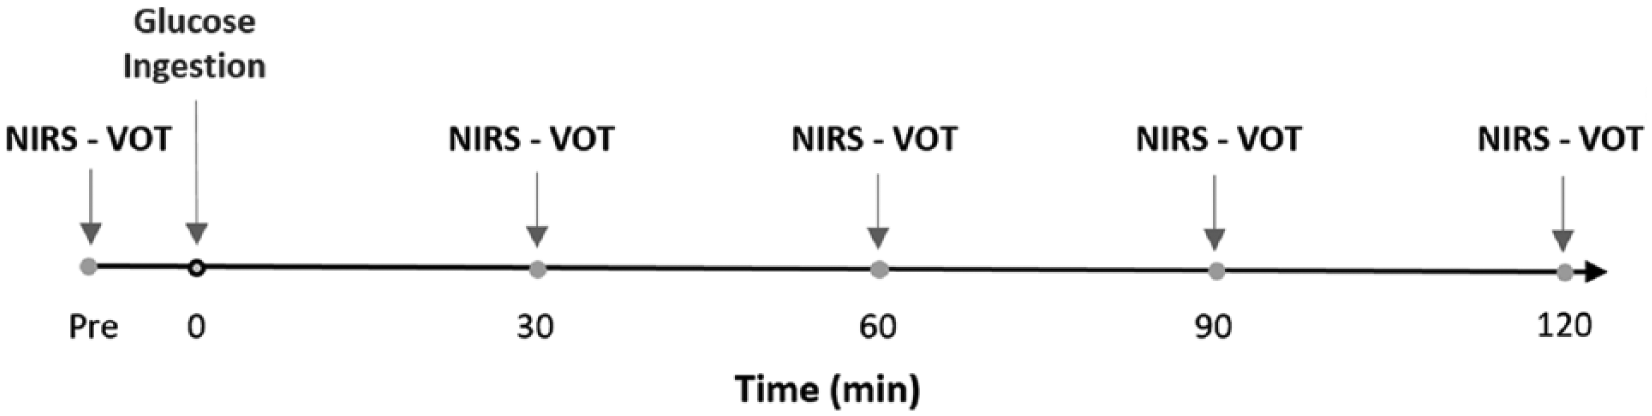
Experimental protocol describing the interventions performed at each time point before and subsequent to the glucose ingestion.
Microvascular assessment
Participants laid supine on an examination table for 10 min, with a small pillow placed underneath the ankle joint for comfort. Following the 10-min rest period, the NIRS probe was placed on the muscle belly of the tibialis anterior, secured via a tightened black elastic strap to mitigate movement and covered with an optically dense, black vinyl sheet to minimize the intrusion of extraneous light. An elastic tensor bandage was then loosely wrapped around the site, as not to constrict blood flow, but to further minimize movement and light intrusion. The probe stayed attached to the subject for the duration of testing. The tibialis anterior muscles were selected as measurements in the lower limb that are involved in daily activities as locomotion would minimize the likelihood of finding differences that might be attributed to disuse. Additionally, it was important to test a muscle that was easily accessible and not largely affected by a large amount of subcutaneous adipose tissue in the obese participants, as this would affect the amplitude of the measurement and the quality of the signal. A pneumatic cuff connected to an automatic rapid inflation system (Hokanson E20 AG101, Bellevue, WA, USA) was used for occlusion of blood flow and placed below the knee (approximately 5 cm distal to the popliteal fossa). Occlusion pressure was set to 250 mmHg for the occlusion time. NIRS measurements were collected continuously at an output frequency of 2 Hz for the entire duration of each test (5 min of baseline, 5 min of occlusion and 8 min following cuff release). Each test was separated by 30 min of rest between occlusions to allow blood flow to return to baseline resting levels. 15
The baseline of the deoxyhemoglobin signal was calculated as the average of the last 2 min prior to ischaemia. The deoxyhemoglobin area under the curve during occlusion (AUCocc) was calculated as the total area under the curve of the percent variation in the deoxyhemoglobin signal from the baseline value to the end of the 5 min before cuff release (Figure 2). The deoxyhemoglobin area above the curve (AACrep, representing the reperfusion period) was calculated as the total area above the curve of the percent variation in the deoxyhemoglobin signal from the cuff inflation until the end of the 8 min post cuff release (Figure 2). For both area under the curve during occlusion and area above the curve during reperfusion calculations, the baseline value for each test represented 0% of variation.
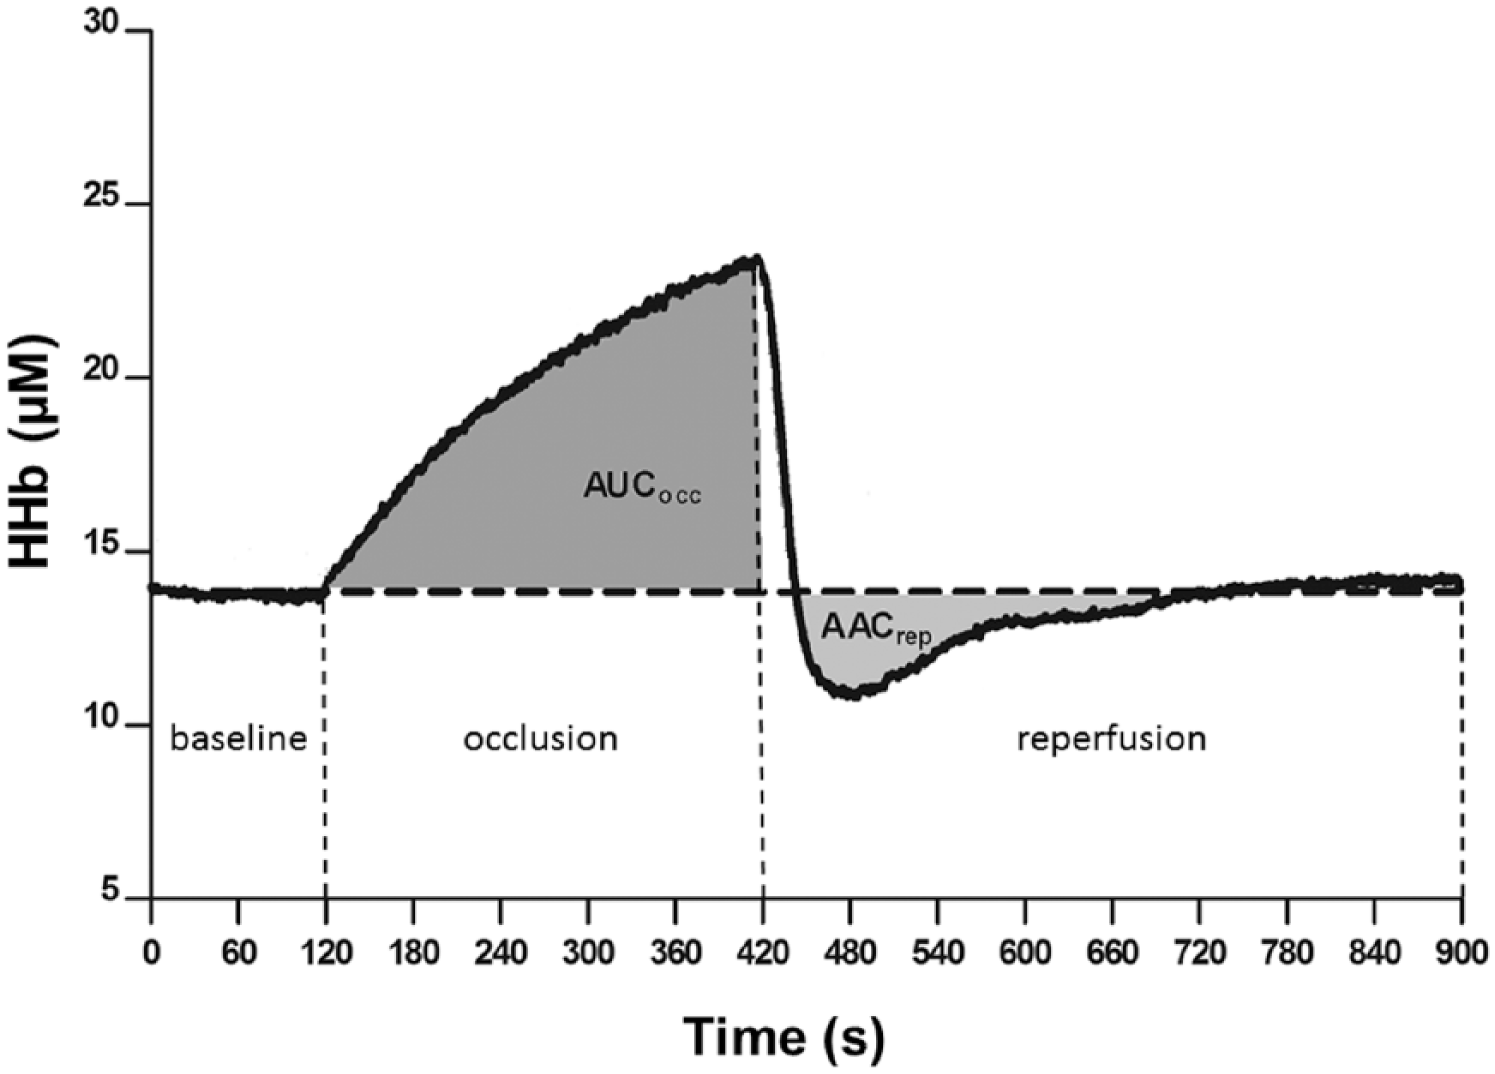
Representative figures of the profile of the deoxyhemoglobin signal (HHb) during each of the interventions for the experimental protocol.
NIRS
Deoxyhemoglobin of the tibialis anterior muscle was monitored continuously throughout each vascular occlusion test with a frequency-domain multidistance NIRS system (OxiplexTS; ISS, Champaign, IL, USA). Briefly, the system was composed of a single channel consisting of eight laser diodes operating at two wavelengths (λ = 690 and 828 nm, four at each wavelength), which were pulsed in rapid succession, and a photomultiplier tube. The lightweight plastic NIRS probe (connected to laser diodes and a photomultiplier tube by optical fibres) consisted of two parallel rows of light emitter fibres and one detector fibre bundle; the source-detector separations for this probe were 2.0, 2.5, 3.0 and 3.5 cm for both wavelengths. By measuring changes in light absorption at different wavelengths, changes in deoxyhemoglobin can be measured continuously. The NIRS device was calibrated at the beginning of the session following an instrument warm-up period of at least 30 min. The calibration was done with the probe placed on a calibration block (phantom) with absorption (μa) and reduced scattering coefficients (μs’) previously measured; thus, correction factors were determined and were automatically implemented by the manufacturer’s software for the calculation of the μa and μs’ for each wavelength during the data collection. Calculation of deoxyhemoglobin reflected continuous measurements of μs’ made throughout each testing session (i.e. constant scattering value not assumed).
Blood pressure
Blood pressure was assessed by an appropriately sized blood pressure cuff and sphygmomanometer according to the guidelines from the American Heart Association. 16
Statistical analysis
Data are presented as mean ± standard error. All data were tested for normality using D’Agostino–Pearson normality test. Unpaired Student’s t-test was applied to compare the anthropometric characteristics between groups. Blood glucose concentration data were analysed by one-way repeated-measures analysis of variance (ANOVA) with between-subject factor and nonparametric data were analysed by Kruskal–Wallis for between-subject and Friedman’s test for within-subject comparisons. Dunnett’s post hoc test with corrections for multiple comparisons was applied. A p value <0.05 was considered as the level of statistical significance. Data analysis was performed using the SPSS 23.
Results
The presented data are part of a larger study that also examined the effects of hyperglycaemia on vascular responsiveness. Thus, the participant’s characteristics and blood glucose profile (Table 1) have been presented in another manuscript (under review). The area under the curve of deoxyhemoglobin during occlusion of the participants with normal weight increased significantly from 15,732 ± 2344 (% . s) at pre to 18,930 ± 3226 (% . s) (p < 0.05) at 90 min after glucose ingestion (Figure 3, Panels A and C). In the individuals with obesity, the area under the curve of deoxyhemoglobin during occlusion decreased significantly from 14,695 ± 3341 (% . s) at pre to 11,273 ± 1825 (% . s) (p < 0.05) and 11,360 ± 1750 (% . s) (p < 0.05) at 30 and 60 min, respectively, after the glucose challenge (Figure 3, Panels B and C).
Participant characteristics and blood glucose concentrations (mean ± SEM).
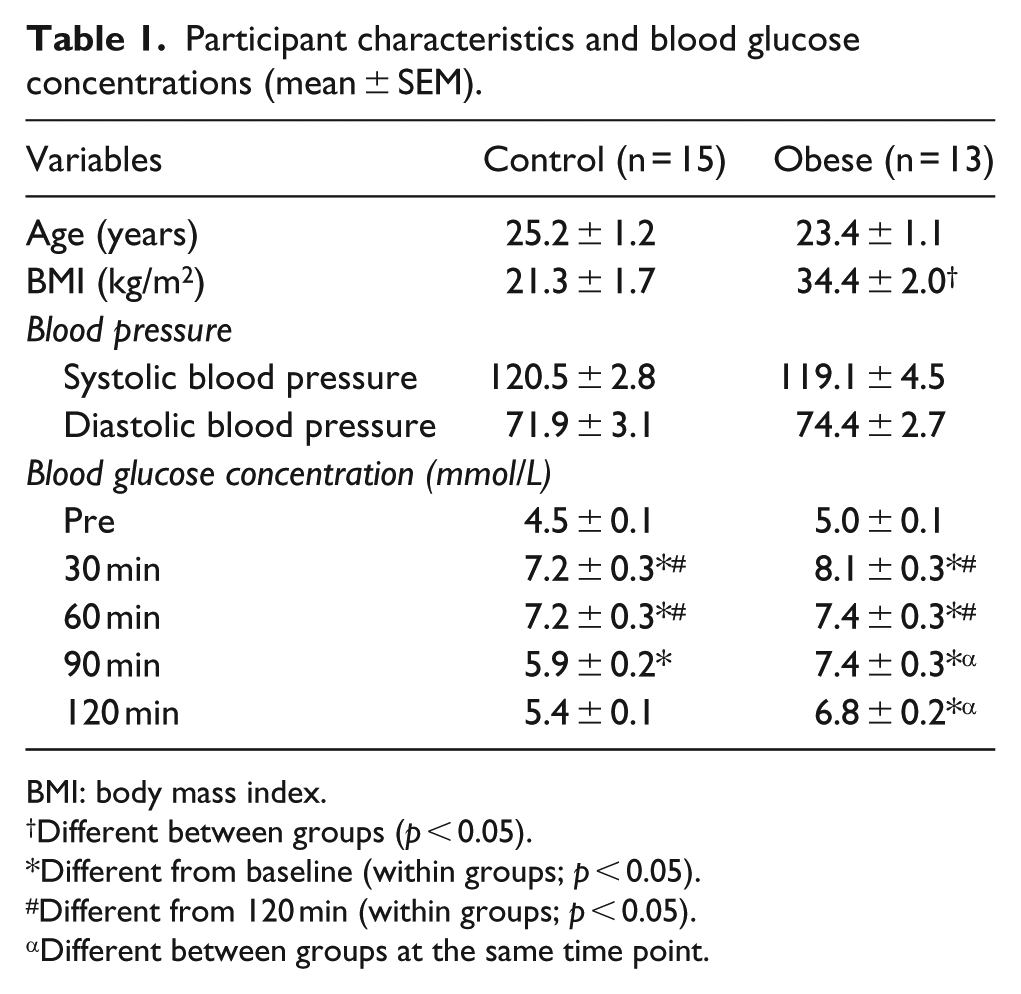
BMI: body mass index.
Different between groups (p < 0.05).
Different from baseline (within groups; p < 0.05).
Different from 120 min (within groups; p < 0.05).
Different between groups at the same time point.
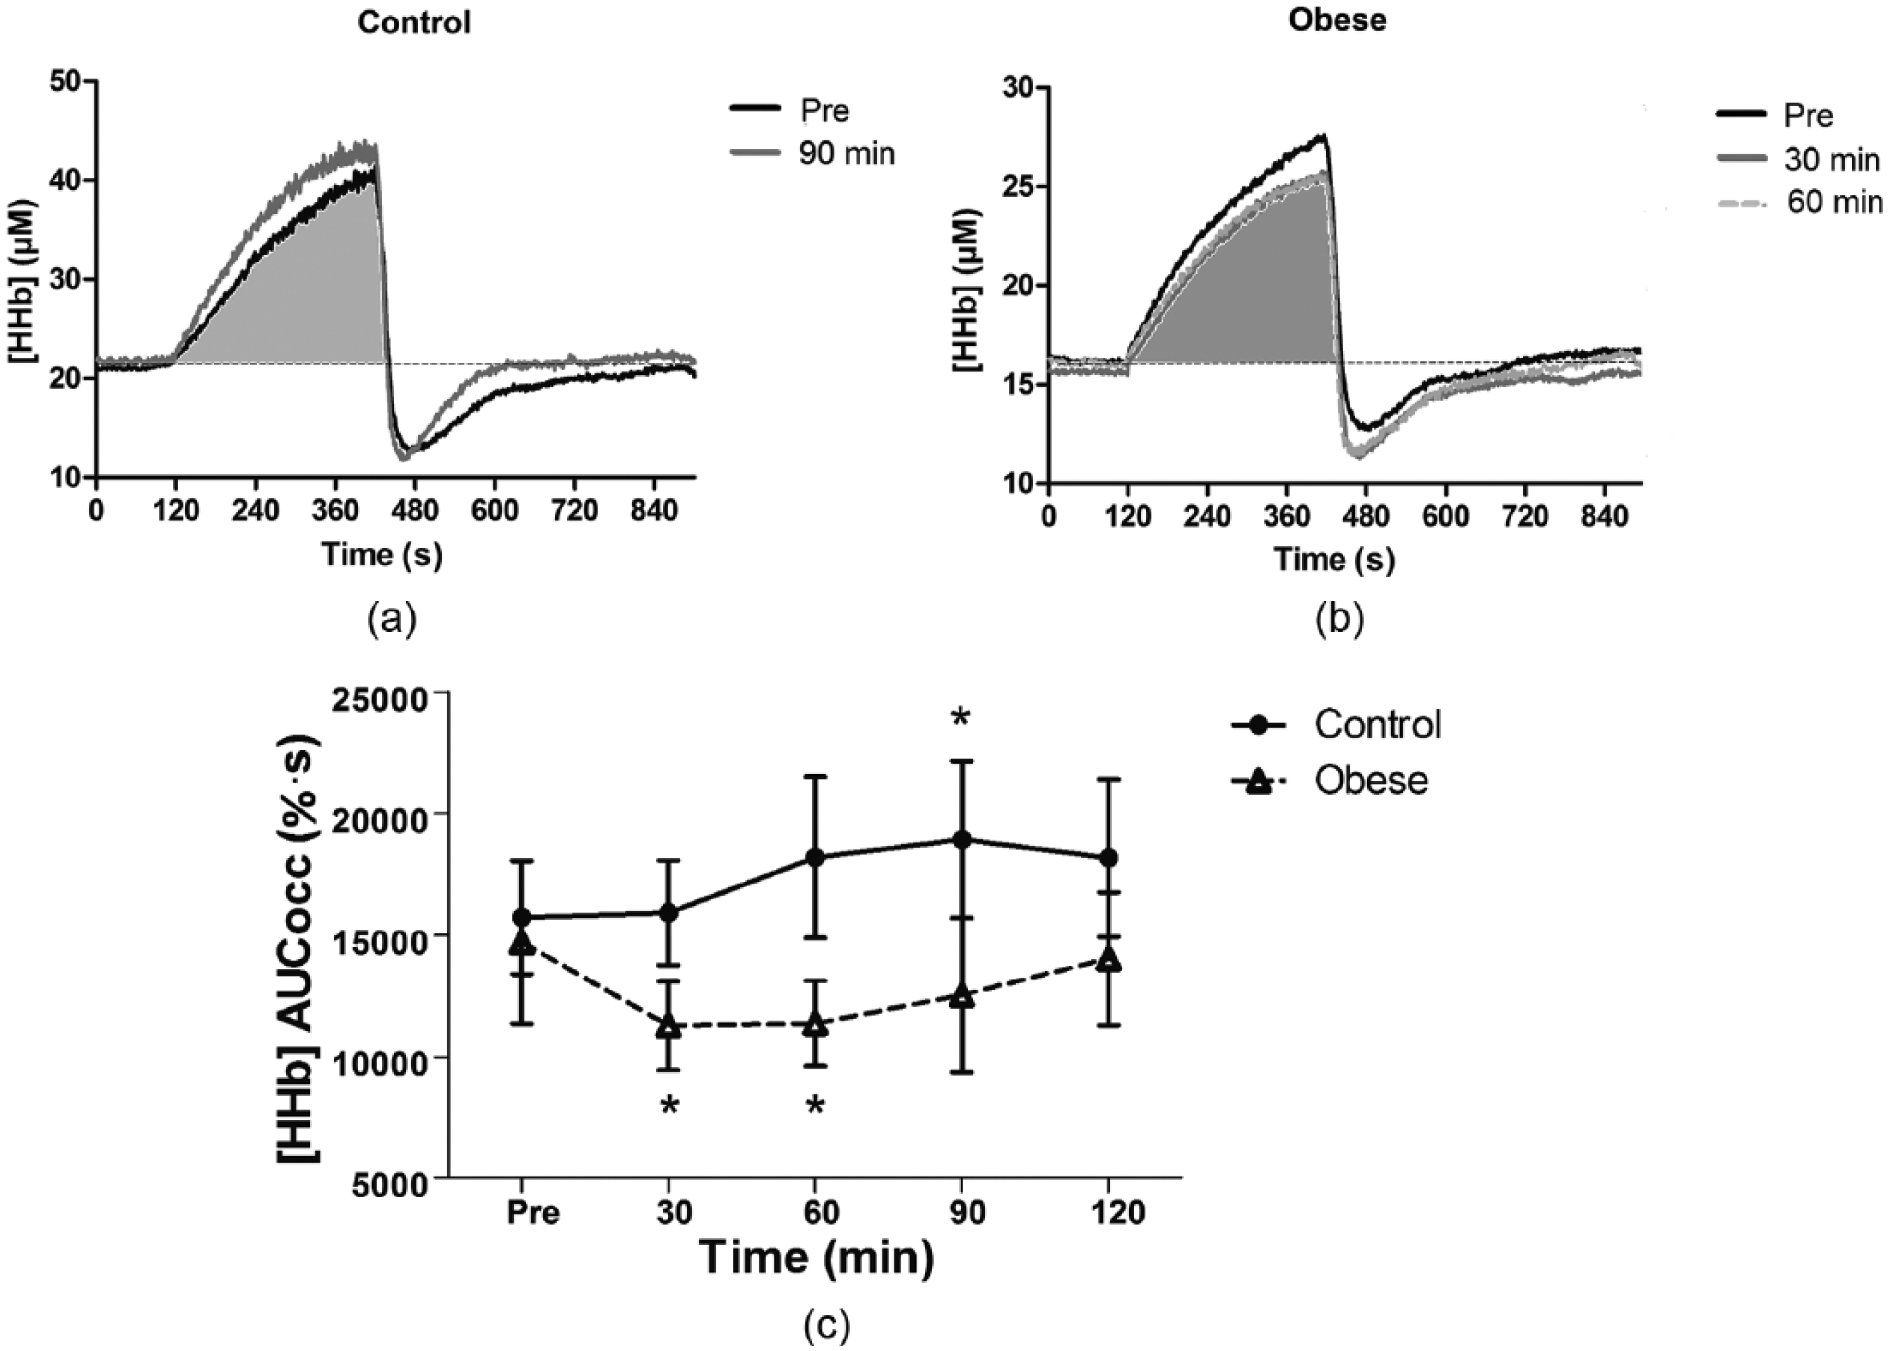
HHb profiles during occlusion period (AUCocc) at pre and at the time points at which significant differences were observed. (a) The smaller area under the curve of deoxyhemoglobin during occlusion period at pre (filled in grey) when compared to 90 min after glucose ingestion in control subjects. (b) The smaller area under the curve of deoxyhemoglobin during reperfusion at 30 and 60 min (filled in grey) when compared to the pre glucose ingestion in subjects with obesity. (c) The mean and standard error of the area under the curve of deoxyhemoglobin signal at different time points for control and for individuals with obesity.
Figure 3 shows that the area above the curve of deoxyhemoglobin during reperfusion decreased significantly from 6450 ± 765 (% . s) at pre to 4830 ± 963 (% . s) (p < 0.05) at 60 min and to 4210 ± 595 (% . s) (p < 0.01) at 90 min in normal-weight individuals after glucose ingestion (Figure 4(a) and (c)). No significant differences were observed in the individuals with obesity for the area above the curve of deoxyhemoglobin during reperfusion.
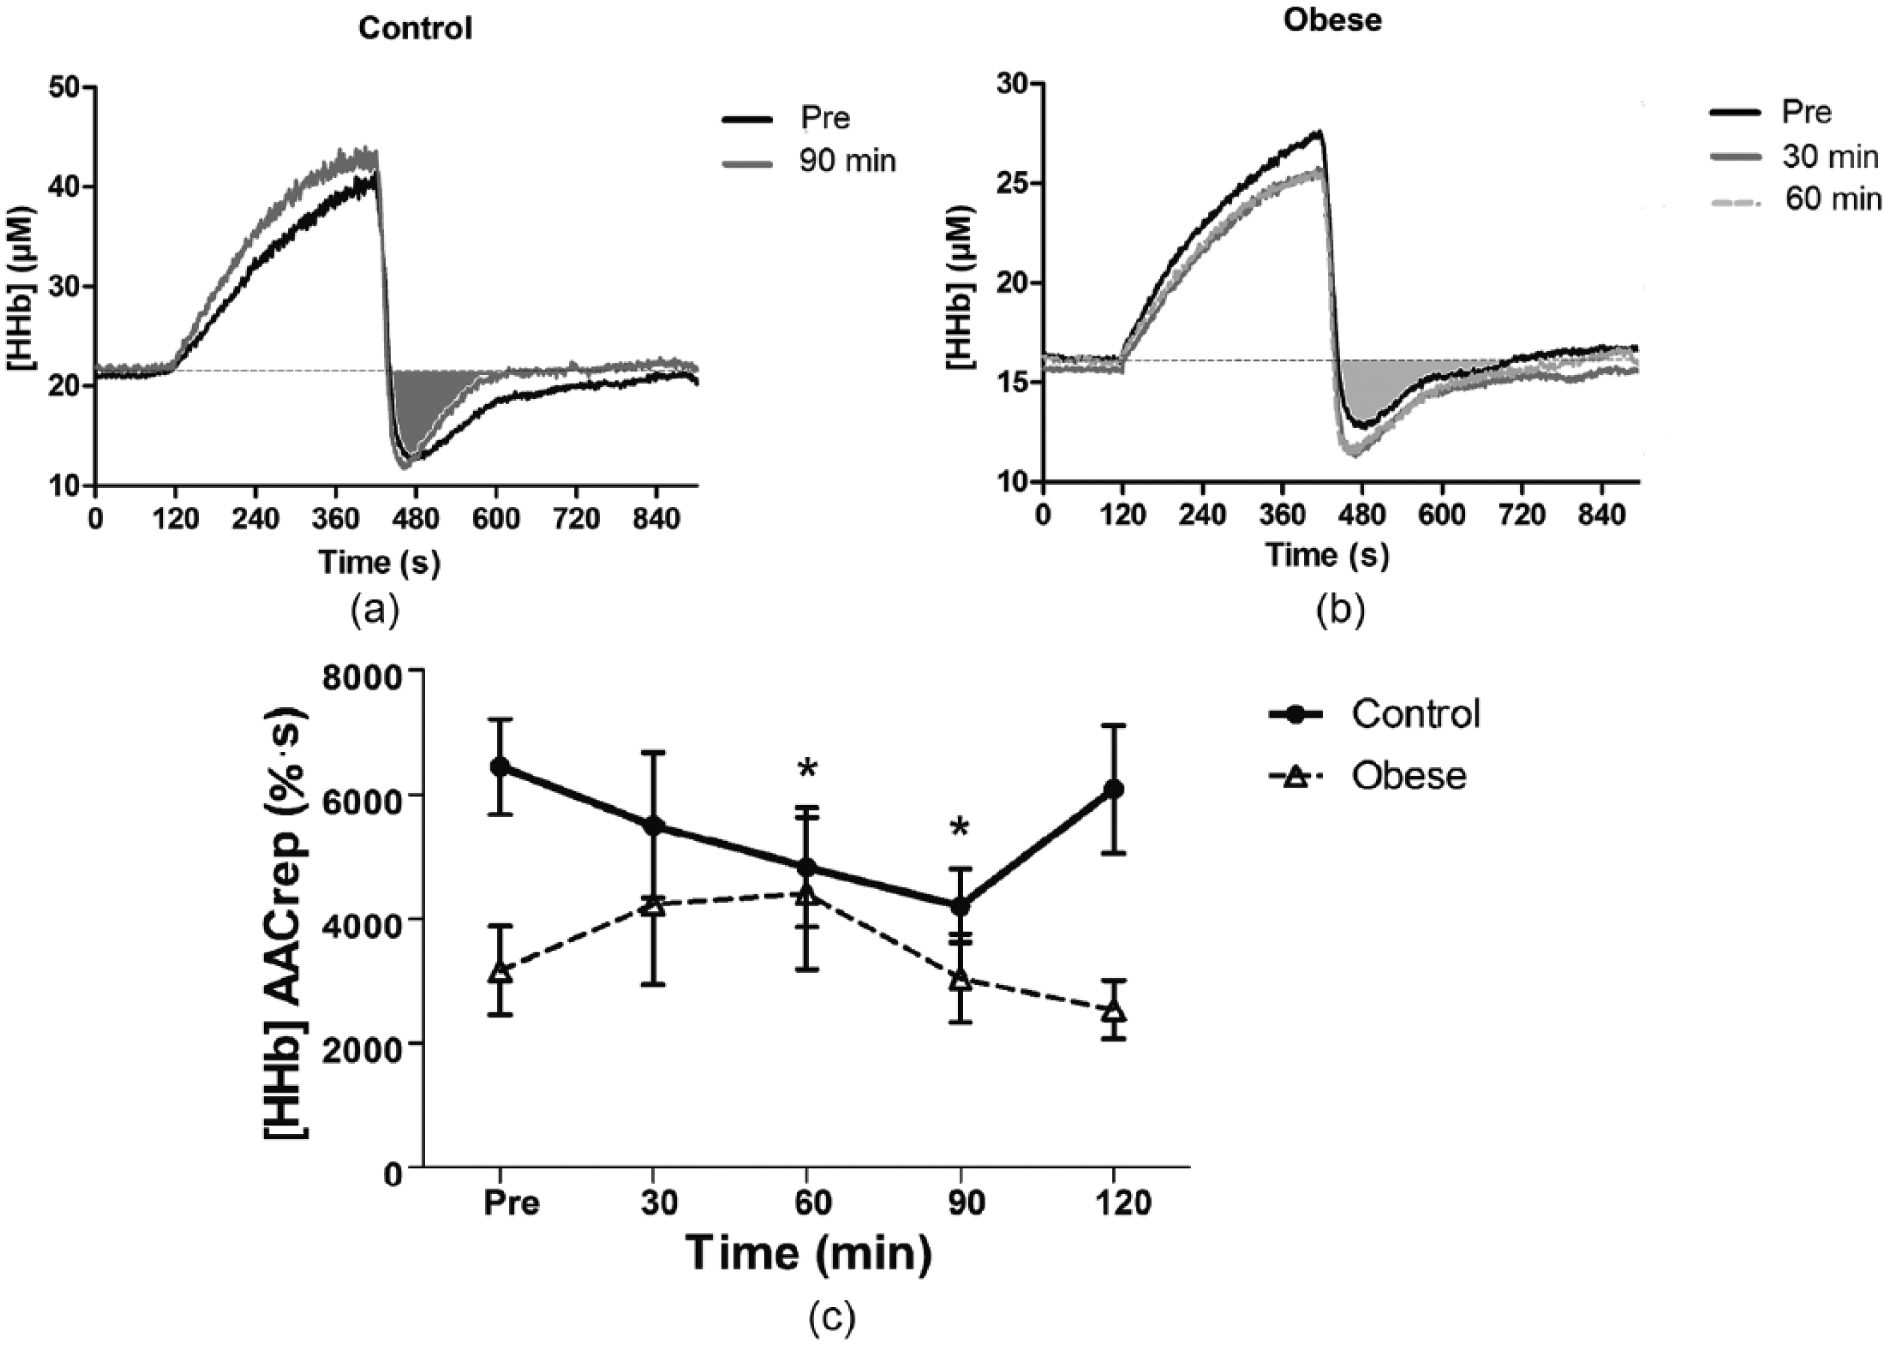
HHb profiles during reperfusion period (AACrep). (a) The smaller area under the curve of deoxyhemoglobin during reperfusion period at pre (filled in grey) compared to 90 min after glucose ingestion in the control participants. (b) The area under the curve of deoxyhemoglobin during reperfusion profiles at pre (filled in grey), 30 and 60 min after glucose ingestion in participants with obesity. (c) The mean and standard error of the area above the curve of deoxyhemoglobin during reperfusion at different time points for lean and individuals with obesity.
Discussion
To our knowledge, this is the first study to evaluate differences in muscle oxygen utilization during hyperglycaemia between individuals with obesity versus normal-weight using NIRS-VOT. Two main findings can be highlighted: (1) during the blood flow occlusion period, hyperglycaemia resulted in increase in muscle oxygen utilization in the normal-weight participants at 90 min post ingestion of the high-glucose beverage. On the contrary, the individuals with obesity showed a rapid decrease in muscle oxygen utilization at 30 and 60 min following glucose ingestion. (2) Whereas hyperglycaemia increased muscle oxygen extraction during reperfusion at 90 min after glucose ingestion in normal-weight individuals. There were no significant differences in the muscle oxygen extraction during reperfusion in the individuals with obesity.
Animal studies and more invasive investigations in humans have shown that hyperglycaemia increases the mitochondrial activity in muscle cells and different tissues, consequently increasing oxygen utilization.4–6 Our findings showed that oxidative metabolism, assessed through the variation in the deoxyhemoglobin signal induced by the blood flow occlusion (i.e. the changes in the oxygen extraction signal in the absence of blood flow represent the changes in oxygen utilization), increased during hyperglycaemia in the normal-weight individuals, showing statistical significance at 90 min after glucose ingestion. Interestingly, the effects of acute glucose ingestion in oxidative metabolism in individuals with obesity were the opposite. Hyperglycaemia rapidly decreased oxidative metabolism so that oxygen utilization was lower at 30 and 60 min after the glucose challenge in this group. An in vitro study using skeletal muscle cells observed that insulin sensitivity, percentage of body fat, and fitness influenced the flexibility of skeletal muscle to switch between oxidizing fat and glucose. 10 In fasting condition, the skeletal muscle of normal-weight individuals can rely heavily upon fat oxidation, while individuals with obesity do not show the same efficacy. During insulin-stimulated conditions (i.e. hyperglycaemia), the skeletal muscles of normal-weight individuals show a strong fat oxidation suppression and high reliance upon glucose oxidation, whereas in individuals with obesity a reduced stimulation of glucose oxidation by insulin and a blunted suppression of fat oxidation is observed. 10 In this sense, a previous invasive study showed that lean individuals had a ~3-fold increase in glucose oxidation, slight decrease in fat oxidation and increase in the leg respiratory quotient (RQ) during insulin clamp, while individuals with obesity showed no differences in fat and glucose oxidation and RQ. 17 Additionally, it was observed that insulin resistance (highly associated with obesity) was negatively correlated with changes in the leg metabolism. 17 These results are in agreement with the blood glucose profiles found in this study. Our result showed a persistent hyperglycaemia in the individuals with obesity when compared with lean which might be associated with the insulin resistance previously observed in the obese population.18,19 Then, the likely higher exposure to insulin in individuals with obesity might have contributed to an impairment in metabolic switching from fat to glucose oxidation. This impairment in the skeletal muscle of individuals with obesity in switching between fat and glucose oxidation compared to the dynamic response in skeletal muscle of normal-weight individuals has been described as ‘metabolic inflexibility’ of skeletal muscle 10 and could partly explain the results observed in this study.
Differences in oxidative metabolism could also be noticed during reperfusion. After cuff release (end of occlusion period), oxygen provision was increased in the normal-weight participants (smaller area above the curve of deoxyhemoglobin during reperfusion) at 60 and 90 min after glucose ingestion, and no statistical differences were found in individuals with obesity as described in Figure 4, even at time points where differences in oxygen utilization during occlusion (ischaemia) were found. Among other effects, the lack of oxygen during prolonged ischaemia induces certain level of mitochondrial dysfunction, cell swelling and rupture, and cell death by different mechanisms. 20 Then, re-establishing oxygen delivery and nutrients to support the metabolic demand and remove potentially damaging by-products of cellular metabolism after an ischaemia period is fundamental. 20 A previous study exploring the physiological significance of abnormal microvascular reperfusion responses using NIRS found that the group with the most abnormal response was the one with the larger body mass index (BMI; approximately 30.5 kg/m2). 11 In agreement with the aforementioned findings, the present results showed that the lean individuals were capable of compensating for the increased oxygen utilization during ischaemia with a higher oxygen provision during reperfusion at the time point where metabolic demand was increased, whereas in individuals with obesity, it seems that this compensation mechanism was impaired during hyperglycaemia. In support of this assertion, obesity is associated with lower arterial compliance, endothelial dysfunction and reduced blood flow when compared to individuals with normal weight,21–24 and these impairments in the vasculature may reduce the functional hyperaemic responses in individuals with obesity. 25
Previous studies using NIRS have shown that measurement of the deoxyhemoglobin signal provides a valid non-invasive assessment for measuring oxidative metabolism in human muscles at rest and during exercise in healthy and diseased individuals.14,26–30 In this sense, a previous study comparing in vivo measurements of skeletal muscle mitochondrial respiratory capacity using NIRS with in situ measurements of high-resolution respirometry (considered the gold standard for measurements of oxidative phosphorylation) in muscle fibres obtained from biopsy samples found that assessment of in vivo skeletal muscle mitochondrial respiratory capacity by NIRS was correlated and in close agreement with the high-resolution respirometry assessment of mitochondrial respiratory capacity in skeletal muscle fibres. 13 Additionally, a study evaluating whether peripheral oxygenation measured with NIRS would differ between patients suffering from mitochondria myopathy (MM), a disease that impairs mitochondrial function, and healthy control adults showed significantly lower deoxyhemoglobin for MM patients, 14 reinforcing the usefulness of NIRS to assess mitochondrial function and suggesting that the NIRS method could be also used as an evaluation tool for assessment of mitochondria function in the diseased state and interventional pharmacological studies. 14
In conclusion, this study confirmed in vivo and non-invasively that the flexibility of skeletal muscle switching between fat and carbohydrate oxidation is blunted in individuals with obesity when compared with normal-weight participants. Additionally, it was demonstrated that the non-invasive NIRS–vascular occlusion test technique was capable of detecting differences in the oxidative metabolism during hyperglycaemia in normal-weight individuals compared to individuals with obesity. The clinical significance of this technique warrants further studies combining the NIRS-VOT and oral glucose tolerance test (OGTT) following different interventions (i.e. drugs, nutrients and exercise) in an attempt to attenuate the metabolic inflexibility in individuals with obesity.
Footnotes
Acknowledgements
The authors acknowledge the Coordenadoria de Aperfeiçoamento de Pessoal de Nível Superior (CAPES) Brazil for the support.
Declaration of conflicting interests
The author(s) declared no potential conflicts of interest with respect to the research, authorship and/or publication of this article.
Funding
The author(s) received no financial support for the research, authorship and/or publication of this article.