
Abstract
Objective:
Few exercise trials have focused on patients with both type 2 diabetes and coronary artery disease. We investigated the effects of 1 year of exercise training on HbA1c and VO2peak in these patients.
Methods:
Patients with type 2 diabetes and coronary artery disease (n = 137) were randomised to combined exercise training or control group. HbA1c was measured at the beginning and end of the study. Changes in VO2peak, and also ventilatory threshold and time to exhaustion, were assessed by cardiopulmonary exercise testing.
Results:
No differences in changes between the randomised groups were observed in HbA1c and VO2peak, whereas ventilatory threshold and time to exhaustion increased significantly in the exercise group compared with the controls (p = 0.046 and p = 0.034). In patients without previous acute myocardial infarction and diabetes microvascular complications (n = 46), the exercise group did improve HbA1c and VO2peak compared with the controls (p = 0.052 and p = 0.035).
Conclusion:
No significant effects of exercise training on HbA1c or VO2peak were observed in patients with type 2 diabetes and coronary artery disease, although improvements were seen in patients without vascular complications beyond coronary artery disease, implying that the degree of vascular disease may influence exercise responses. Ventilatory threshold and time to exhaustion did increase significantly, indicating improved exercise performance despite the minor change in VO2peak.
Keywords
Introduction
The prevalence of type 2 diabetes in the world is rising, 1 and with the enhanced risk of cardiovascular disease (CVD) in these patients, there has been an increasing focus on patients with the combination of type 2 diabetes and coronary artery disease (CAD). 2 Observational studies have indicated that approximately two-thirds of asymptomatic patients with type 2 diabetes have atherosclerotic disease. 3
Exercise training is an established part of the treatment in type 2 diabetes, and several clinical trials have shown that structured exercise training improves CVD risk factors, glycaemic control and exercise capacity in these patients.4,5 A scientific statement from 2009 showed an overall reduction in HbA1c of 0.8% across several exercise trials, 6 and a meta-analysis by Boule et al. 7 of aerobic exercise interventions demonstrated an increase of 11.8% in VO2peak. It has further been shown that combined aerobic and resistance training may improve glycaemic control more efficiently than aerobic or resistance training alone. 8
Exercise capacity holds important prognostic information in both healthy and diseased individuals,9,10 and it has been indicated that exercise capacity is reduced by approximately 20% in patients with type 2 diabetes compared to individuals without diabetes. 11 Kokkinos et al. 9 reported that mortality in individuals with type 2 diabetes is reduced by 19% for each metabolic equivalent (MET) increase in exercise capacity.
Many exercise trials in type 2 diabetes have excluded patients with CAD or investigated a mixture of patients with diabetes with and without CAD. Not many studies have focused on the effects of exercise in patients with the combination of type 2 diabetes and CAD. The presence of CAD in patients with type 2 diabetes may impact the types and intensities of exercise training that can be utilised and may in addition represent long-standing and complicated disease, both of which may influence the effects of exercise training. Cardiac rehabilitation (CR) studies have shown increased exercise capacity in CAD patients with type 2 diabetes,12,13 but there are studies indicating that these patients may not experience the same improvements as compared to non-diabetic cardiac patients. 13 These are, however, observational studies comparing CAD patients with and without type 2 diabetes. Other studies in type 2 diabetes have discussed subgroup findings in patients with additional CAD/CVD, 14 but to our knowledge, not with regard to changes in glycaemic control and/or exercise capacity.
The primary aim of this randomised controlled study was to investigate the effects of 12-month combined aerobic and resistance training on HbA1c and VO2peak in patients with both type 2 diabetes and stable CAD. We hypothesised that exercise training would improve these parameters.
Materials and methods
Study design and participants
Patients with type 2 diabetes and CAD (n = 137) were included at the Department of Cardiology, Oslo University Hospital – Ullevål, Oslo, Norway, between August 2010 and March 2012. The last follow-up was in March 2013. All study participants had known type 2 diabetes and verified CAD by coronary angiography. Exclusion criteria were presence of proliferative retinopathy, end-stage renal disease, cancer, stroke or acute myocardial infarction (AMI) within the last 3 months, unstable angina, uncompensated heart failure, serious arrhythmia, severe valvular disease, severe rheumatologic disease, chronic obstructive pulmonary disease stadium GOLD IV, thromboembolic disease, ongoing infections, severe musculoskeletal disorders and other disabilities limiting the ability for physical activity. All patients gave informed, written consent to participate in the study. The study was approved by the Regional Ethics Committee, was conducted according to the Declaration of Helsinki and is registered at http://www.clinicaltrials.gov (NCT01232608). At the time of inclusion, the patients were randomised to either the exercise group or the control group. The control group continued with normal follow-up by their general practitioner. Randomisation was performed by use of consecutively numbered, non-translucent envelopes containing allocation message to either of the randomised groups in a 1:1 ratio according to tables of random numbers, arranged by the Unit of Epidemiology and Biostatistics, Oslo University Hospital – Ullevål.
A thorough medical history was recorded, and full physical examination was performed at the time of inclusion, including blood pressure, electrocardiogram (ECG) and monofilament test. Microvascular complications were defined as history of nephropathy, neuropathy or retinopathy, and/or abnormal monofilament test and/or albuminuria (including microalbuminuria). Body weight was measured with light clothing on the same weight before and after the intervention. Waist circumference was measured horizontally at the level of the iliac crest and at the end of a normal expiration. All measurements were set to the nearest 0.5 cm or kg.
Exercise intervention
The study participants randomised to the exercise group underwent a 12-month combined aerobic and resistance training programme planned and conducted in collaboration with the Norwegian School of Sports Sciences, Oslo, Norway. The exercise programme consisted of group-based exercise sessions of 60-min duration twice a week under the supervision of qualified instructors and a third weekly home-based individual exercise session. The total exercise volume was 150 min per week, and approximately two-thirds were aerobic and one-third resistance exercises. All supervised exercise sessions included 10–15 min of warm-up and 5–10 min of cool down and alternated between several exercise programmes: (1) circuit training containing 10 aerobic and resistance exercises of large muscle groups (40 s work, 20 s break); (2) interval training uphill walking (running) outdoors (20 s on/off for 3–4 min, 5–6 sets); (3) interval step training indoors (3-min series with basic steps, side steps and crossover steps, 4–5 sets) and resistance training; and (4) spinning on a bike (including pyramid intervals 6 × 20, 4 × 40 and 2 × 60 s) and resistance training. Resistance training was performed with free weights and included exercises for chest, biceps, shoulder, triceps, back and front. Series of 10–15 repetitions were performed. The patients in the exercise group were familiar with Borg’s rated perceived exertion (RPE) scale, 15 and this was used by the instructors to guide the intensity of the exercise sessions. Each of the supervised exercise sessions included parts with high-intensity interval training (RPE ⩾ 15; 5–15 min duration). The rest of the exercises were of moderate intensity (RPE = 12–14). The patients in the exercise group were also equipped with a Polar heart rate monitor during some of the supervised training sessions, and heart rate during these exercises was analysed retrospectively. The same two instructors supervised all the exercise sessions, making it easy to individualise the exercise programme to ensure right training progression for each participant. The weekly, unsupervised home-based exercise session was registered in exercise diaries and contained optional activities according to personal interests (e.g. walking, swimming, bicycling, cross-country skiing and resistance training in health studios). Attendance to the supervised training sessions was registered, and combined with the exercise diaries, a total adherence to the exercise intervention was determined for each patient in the exercise group at the end of study (0%–100%). All medical events occurring during the study period were registered as potential adverse events, and these events were classified as more or less serious depending on whether they required in-hospital treatment.
Cardiopulmonary exercise test
A cardiopulmonary exercise test (CPET) on treadmill was performed at the beginning and end of the study (approximately 1 week after the last exercise session) using a modified Balke protocol. 16 Gas exchange and ventilatory variables were continuously measured by breathing into a Hans Rudolph two-way breathing mask (2700 Series; Hans Rudolph, Inc., Kansas City, MO, USA), connected to a metabolic cart (Vmax SensorMedics, Yorba Linda, CA, USA). The highest oxygen uptake (VO2peak) was reported as the highest consecutive 30 s average of oxygen uptake during the test. The achieved VO2peak was included in the analyses also when the test was terminated because of functional limitations. Time to exhaustion (TTE) and maximal respiratory exchange ratio (RER) during the treadmill tests were registered. A capillary blood lactate sample was taken during seated rest 1–3 min after termination of the exercise test using haemolysed blood (ABL 700 Series; Radiometer, Copenhagen, Denmark). The Borg scale (6–20) was used to assess RPE. 15 Heart rate and ST-deviations were recorded continuously from the 12-lead ECG record (Cardiosoft; GE Marquette Medical Systems, Milwaukee, WI, USA). The ventilatory threshold (VT) was calculated by the ventilatory equivalent method and was determined by two blinded, independent investigators. 17 In cases of disagreement, a third investigator was consulted. If two investigators were not able to determine the VT, the variable was excluded.
Laboratory measures
Blood samples were drawn at the beginning and end of the study by standard venipuncture between 08:00 and 10:00 a.m. after overnight fast and without medication taken since the preceding evening for determination of HbA1c, fasting glucose and insulin. HbA1c was measured by turbidimetric inhibition immunoassay (Roche, Basel, Switzerland) and insulin by the DELFIA method (PerkinElmer, Waltham, MA, USA). Insulin resistance was estimated by the updated homeostatic model assessment 2 of insulin resistance (HOMA2-IR).18,19 Urine samples from the same morning were collected for the determination of albumin/creatinine ratio.
Dietary registrations
A 24-h dietary recall was used for assessment of dietary intake at baseline and after the 1-year intervention. Portion sizes were estimated by a photographic atlas. The dietary interviews were coded manually, and dietary calculations were performed by the software ‘Mat på Data’ 5.1, 2006. 20
Statistical analysis
On the basis of previous published exercise studies in patients with type 2 diabetes, we expected a relative 10% decrease in HbA1c in the exercise group while unchanged in the control group. With a power of 80% and type 1 error of 5%, calculations indicated 57 patients in each arm, a sample that was multiplied by a factor of 1.2 to take account of dropouts in the study.
We initially intended to perform ‘intention-to-treat’ (ITT) analyses, but as some patients in the intervention group had low exercise adherence, we also performed ‘per-protocol’ (PP) calculations to investigate the effects of actually performed exercise training. We accepted patients with an average adherence down to 40% in these calculations, although we realise that this may be considered as a ‘liberal’ definition of ‘per protocol’. There is, however, a lack of knowledge about how much exercise is needed to observe beneficial effects in patients with chronic diseases, and it is possible that physiological adaptations might occur in patients with exercise volumes down to this level (>60 min per week for 12 months).
Demographic data are given as proportions, mean (±standard deviation (SD)) or medians (25, 75 percentiles) with skewed data. Adherence is presented as median (25, 75 percentiles). Changes from baseline to 12 months are presented as mean (95% confidence interval (CI)). Differences between the randomised groups at baseline were calculated by independent sample t-test, chi-square test or Mann–Whitney test as appropriate. A one-way analysis of covariance (ANCOVA) was conducted to compare the main effects of the intervention in the exercise group with the control group, whereas a two-way ANCOVA was conducted to explore possible interactions between relevant baseline variables and the intervention. The following variables were tested for interaction with the intervention: gender, Caucasian/non-Caucasian, age > 65 years (median), previous AMI, years of diabetes > 9 (median), body mass index (BMI) > 29 kg/m2 (median), exercise-induced ischaemia (during baseline CPET), metabolic syndrome (the International Diabetes Federation definition) and microvascular complications (defined as known nephropathy/neuropathy/retinopathy and/or (micro-)albuminuria and/or positive monofilament test at baseline). Within-group changes from baseline to 12 months were assessed by paired-samples t-test or Wilcoxon signed-rank test as appropriate. Correlation between changes in HbA1c and changes in VO2peak was calculated by Spearman’s correlation and trend analyses by linear regression. Statistical calculations were performed using SPSS version 18.0 for Windows. p value < 0.05 was defined as statistically significant.
Results
Study flow and patient demographics
Figure 1 shows the flow diagram of the study. Two patients in the exercise group discontinued the intervention because of worsening of claudication and one patient because of a foot ulcer. One patient in the exercise group died after suffering sudden cardiac arrest not in close proximity in time to exercise training. Baseline characteristics of the study participants are presented in Table 1. There were no significant between-group differences at baseline (p > 0.05).
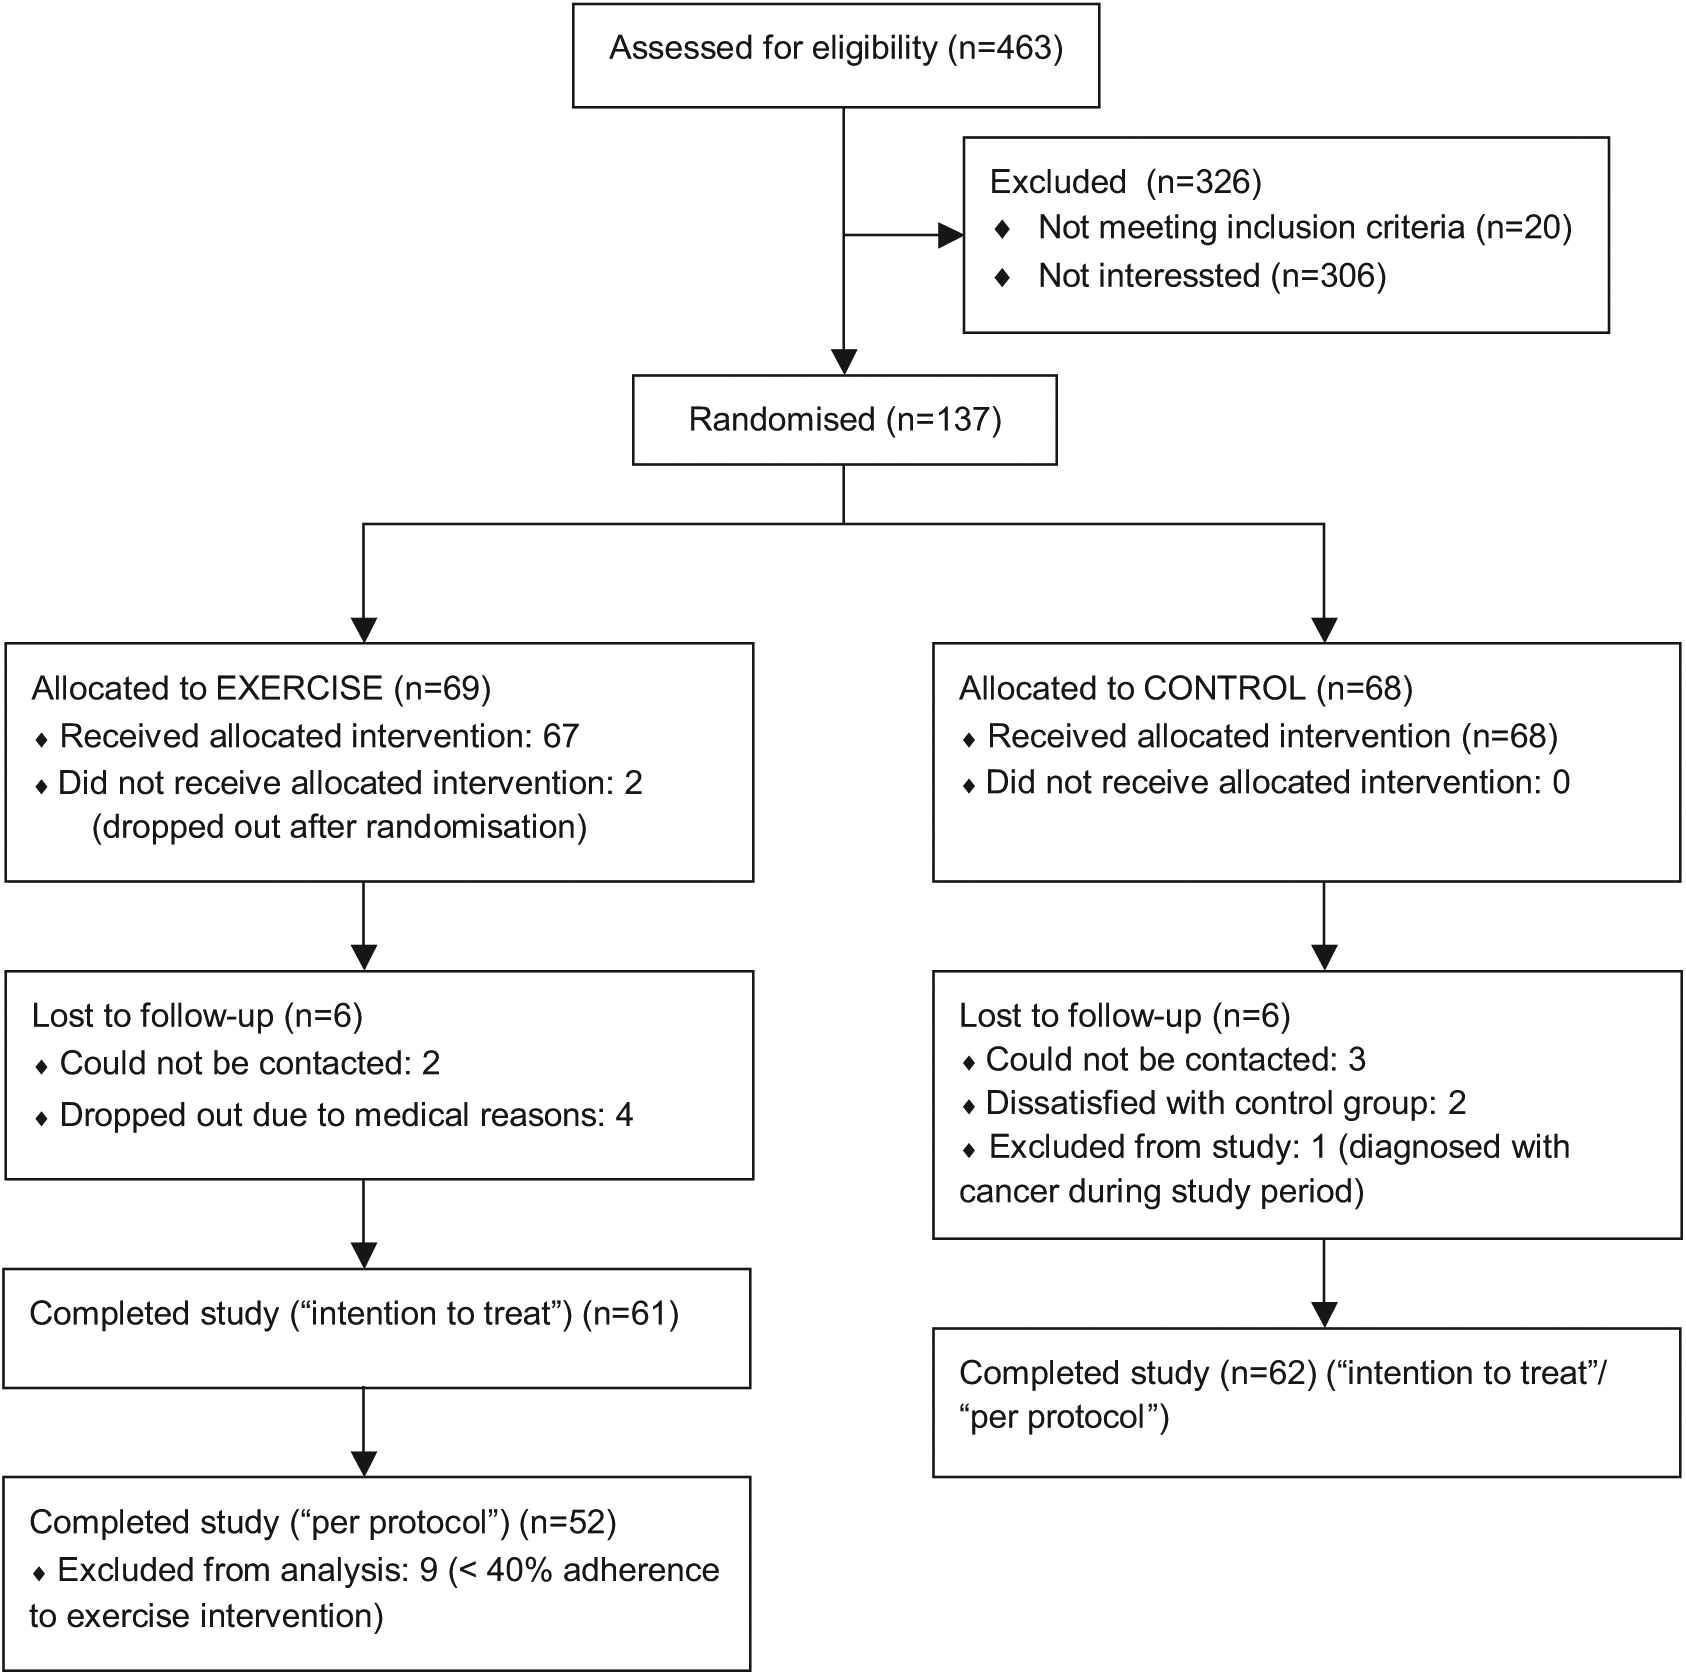
Flow diagram of the study patients.
Baseline characteristics.
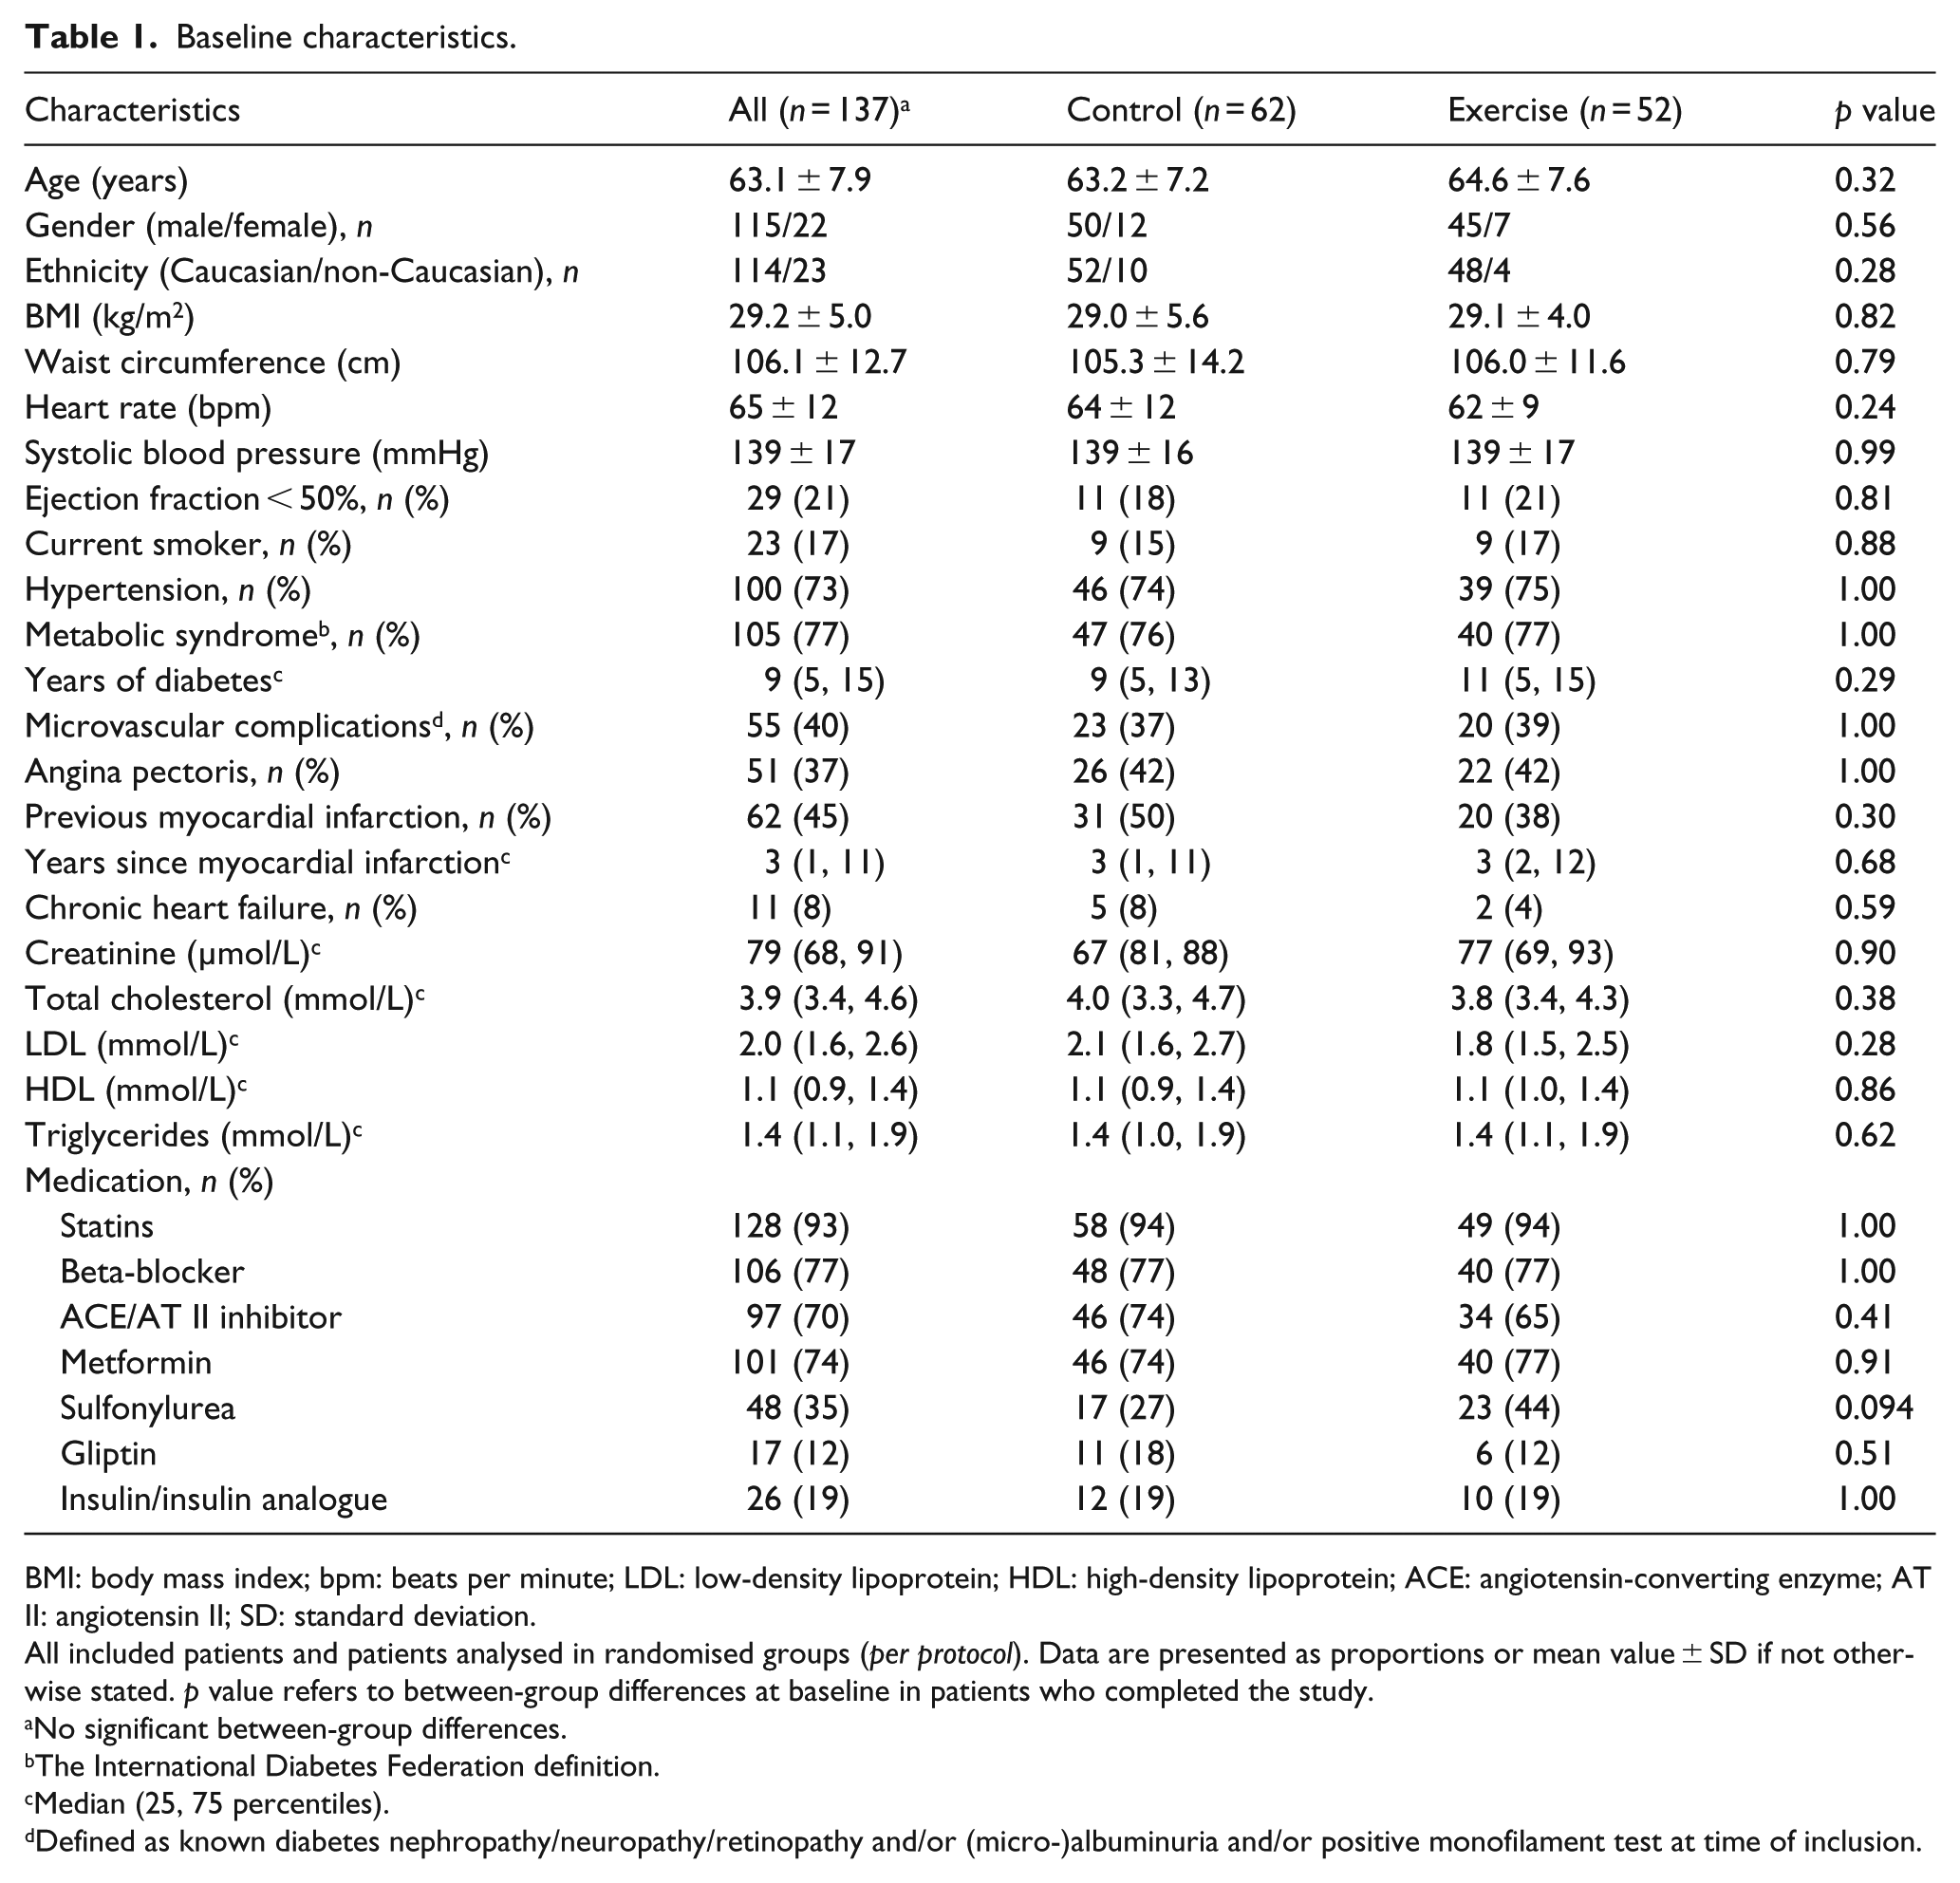
BMI: body mass index; bpm: beats per minute; LDL: low-density lipoprotein; HDL: high-density lipoprotein; ACE: angiotensin-converting enzyme; AT II: angiotensin II; SD: standard deviation.
All included patients and patients analysed in randomised groups (per protocol). Data are presented as proportions or mean value ± SD if not otherwise stated. p value refers to between-group differences at baseline in patients who completed the study.
No significant between-group differences.
The International Diabetes Federation definition.
Median (25, 75 percentiles).
Defined as known diabetes nephropathy/neuropathy/retinopathy and/or (micro-)albuminuria and/or positive monofilament test at time of inclusion.
Exercise adherence
There were nine patients in the exercise group with an average exercise adherence of less than 40%, and these patients were excluded from the PP analyses (Figure 1). These patients were younger, and the proportion of non-Caucasians was greater compared with patients with an adherence above 40% (57.1 vs 63.1 years, p = 0.011; 44% vs 8%, p = 0.013). The average total adherence to the exercise programme was 67% (55%, 83%; PP), and 21 patients had an exercise adherence above 70%. Heart rate monitoring during the supervised exercise sessions showed an average mean heart rate of 105 ± 16 beats per minute (bpm), whereas average peak heart rate was 130 ± 20 bpm, corresponding to 75% and 94% of the average peak heart rate reached during the baseline CPET (139 ± 19 bpm). Results below are presented according to PP analyses. There were no significant differences between the randomised groups in changes of glucometabolic control or exercise performance according to ITT analyses.
Effects of exercise training on glucometabolic control
Table 2 presents the glucometabolic variables at baseline and after 12 months according to the randomised groups. There were no differences between the groups in changes of HbA1c, fasting glucose, insulin or HOMA2-IR during the study, although a non-significant reduction in HbA1c of 0.25% (95% CI: 0.06–0.58) was observed within the exercise group (p = 0.113). When dividing baseline HbA1c levels in the exercise group into quartiles, a more pronounced reduction was seen with increasing quartiles (p for trend < 0.005).
Glucometabolic variables in the total population at baseline and according to the randomised groups at baseline and after 12 months.
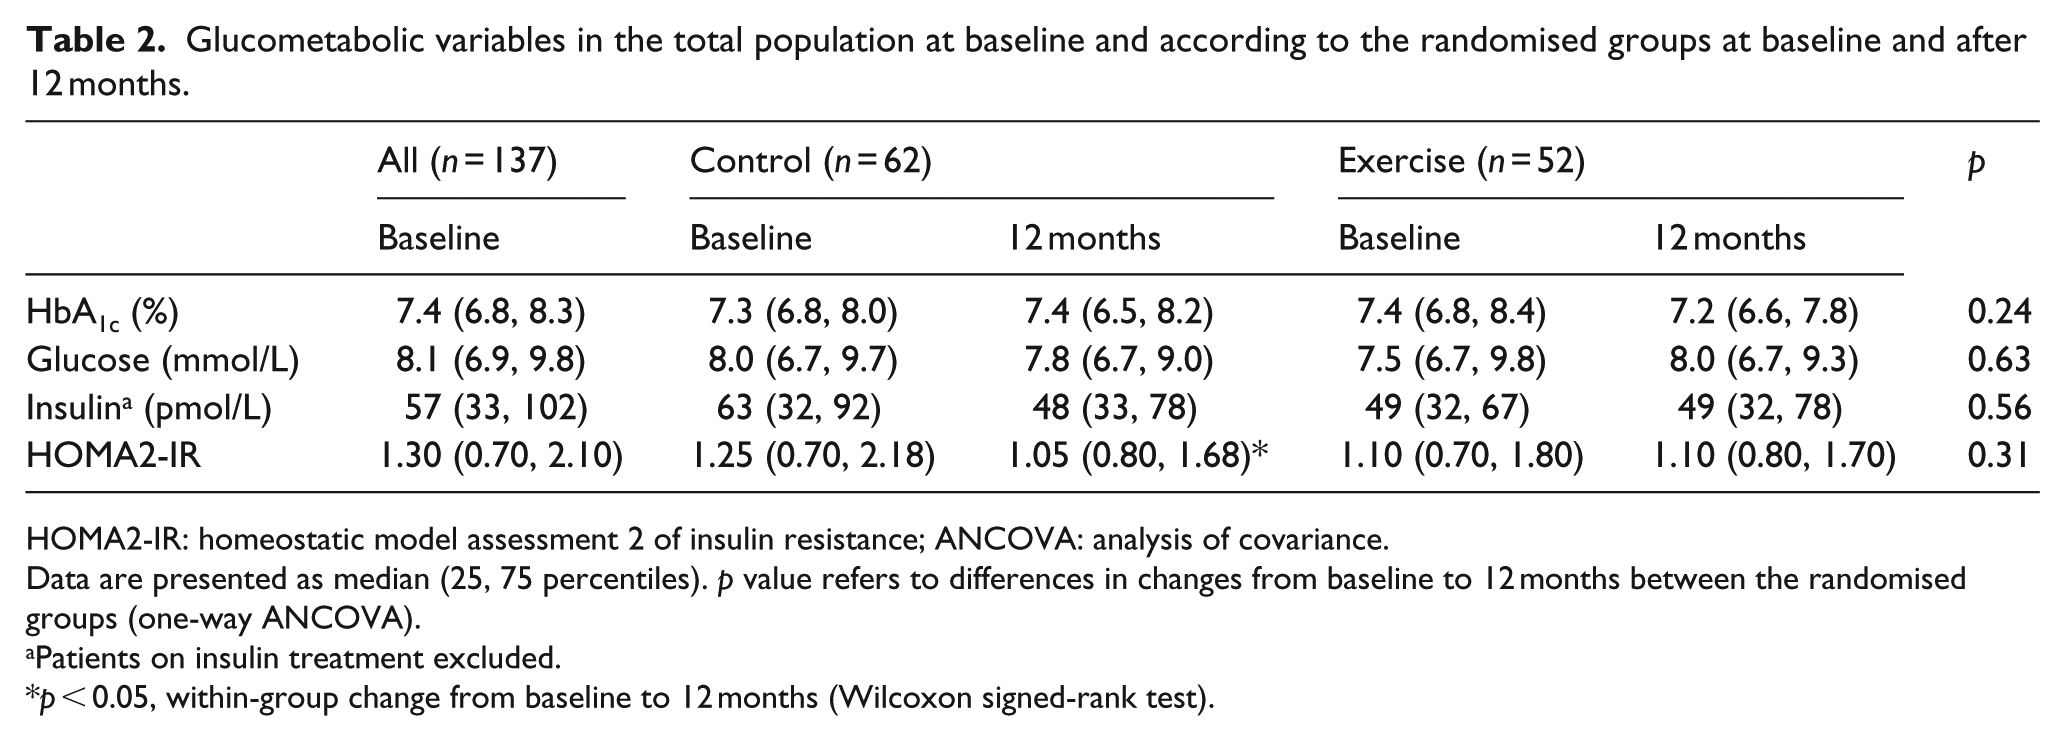
HOMA2-IR: homeostatic model assessment 2 of insulin resistance; ANCOVA: analysis of covariance.
Data are presented as median (25, 75 percentiles). p value refers to differences in changes from baseline to 12 months between the randomised groups (one-way ANCOVA).
Patients on insulin treatment excluded.
p < 0.05, within-group change from baseline to 12 months (Wilcoxon signed-rank test).
Effects of exercise training on exercise capacity and performance
Variables of exercise performance at baseline and after 12 months according to the randomised groups are shown in Table 3, and their relative changes during the study are illustrated in Figure 2. VO2peak tended to increase in the exercise group compared with the controls (Table 3). Within the exercise group, we observed a non-significant increase in VO2peak of 0.8 mL/kg/min (95% CI: −0.2 to 1.8; p = 0.107), and dividing baseline VO2peak into quartiles, larger improvements were observed with decreasing quartiles (p for trend = 0.038). Changes in VO2peak were inversely correlated with changes in HbA1c in the exercise group (r = −0.30, p = 0.024).
Variables of exercise performance in the total population at baseline and according to the randomised groups at baseline and after 12 months.
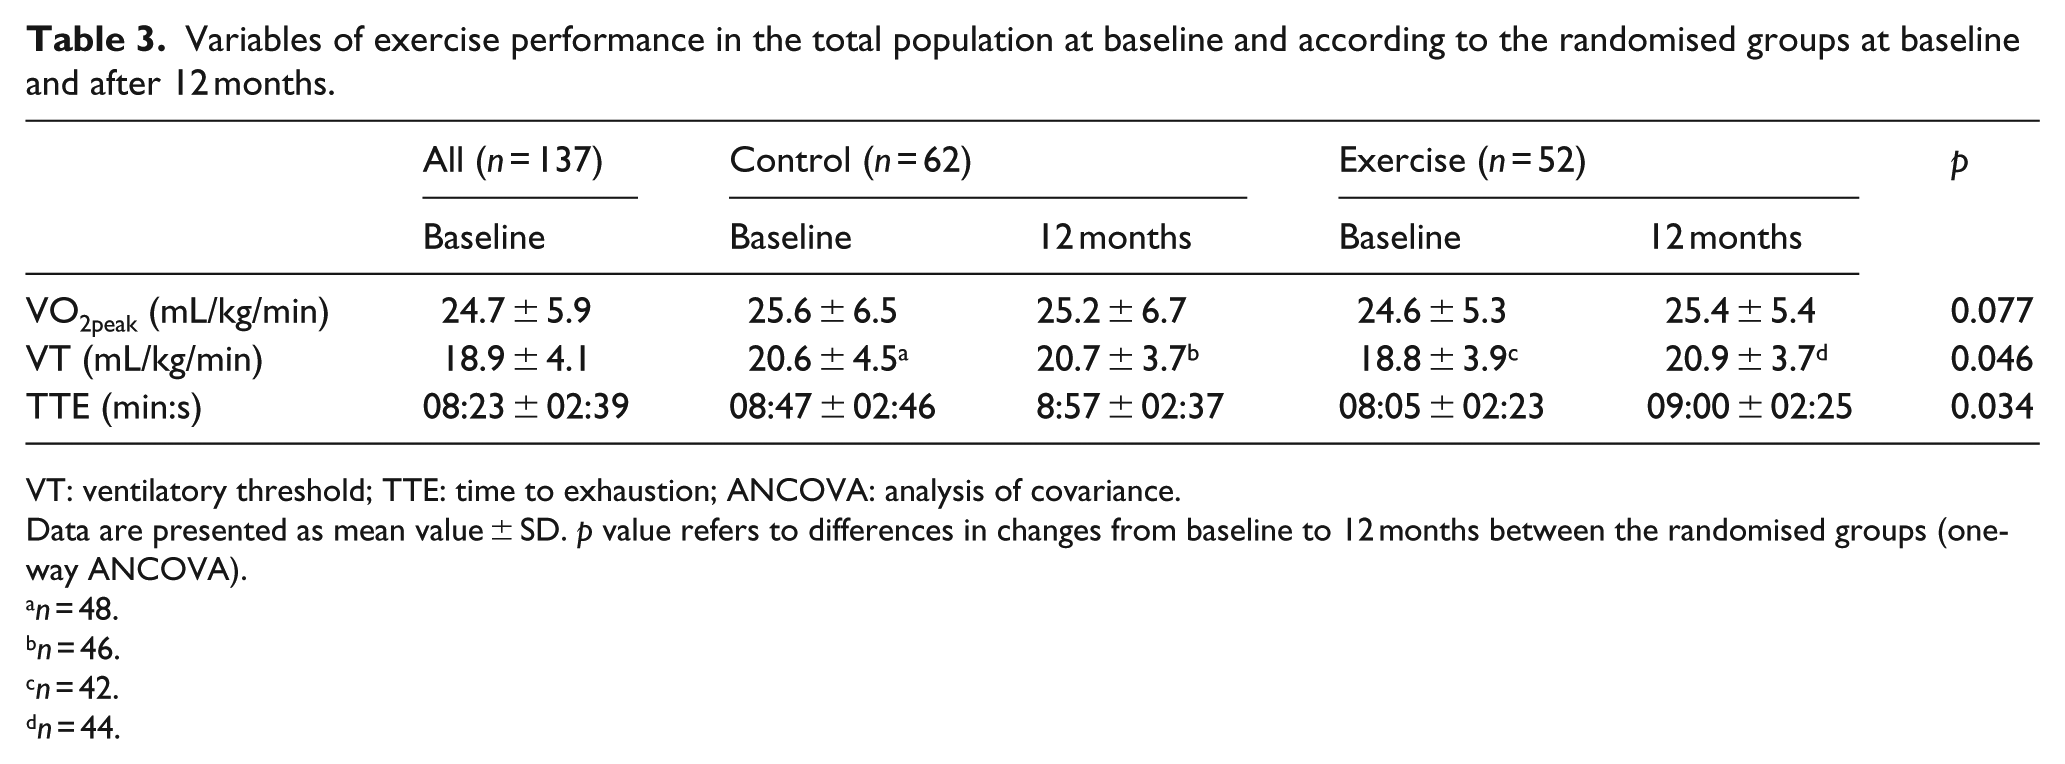
VT: ventilatory threshold; TTE: time to exhaustion; ANCOVA: analysis of covariance.
Data are presented as mean value ± SD. p value refers to differences in changes from baseline to 12 months between the randomised groups (one-way ANCOVA).
n = 48.
n = 46.
n = 42.
n = 44.
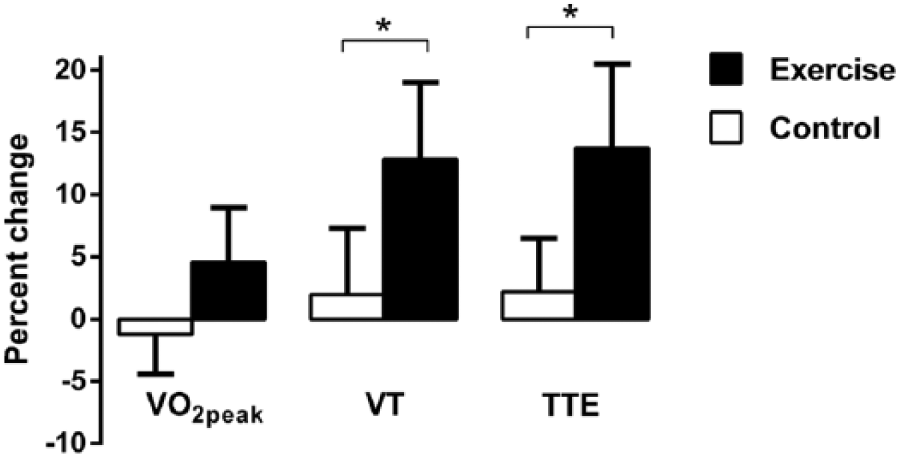
Changes in exercise performance. Relative changes from baseline to 12 months in variables of exercise performance according to the randomised groups, illustrated as mean (95% CI).
VT and TTE improved significantly in the exercise group compared to the control group (Table 3; Figure 2), and the relative increases in these variables within the exercise group were 12.8% ± 18% and 13.7% ± 24%, respectively. By comparison, the relative increase in VO2peak was 4.5% ± 15%.
Interactions between exercise effects and vascular complications
Previous AMI and presence of diabetes microvascular complications both interacted with the treatment principle with regard to changes in HbA1c (p = 0.066 and p = 0.065, respectively). When these two features were combined to define an advanced vascular disease group (previous AMI and/or diabetes microvascular complications in addition to CAD), the interaction was strengthened (p = 0.036). When stratified by this group, the exercise patients without advanced vascular disease improved HbA1c compared with the controls (p = 0.052; Figure 3). Advanced vascular disease also tended to interact with treatment principle with respect to changes in VO2peak (p = 0.063), and the exercise patients without advanced vascular disease significantly improved their VO2peak compared with the controls [2.20 mL/kg/min (95% CI: 0.80–3.60) vs 0.01 mL/kg/min (95% CI: −1.45 to 1.47), p = 0.035]. No interactions were observed with regard to changes in VT or TTE (both p > 0.2). There were no significant differences in adherence or heart rate during exercise sessions between patients with or without advanced vascular disease, indicating comparable exercise volume and intensity in these groups.
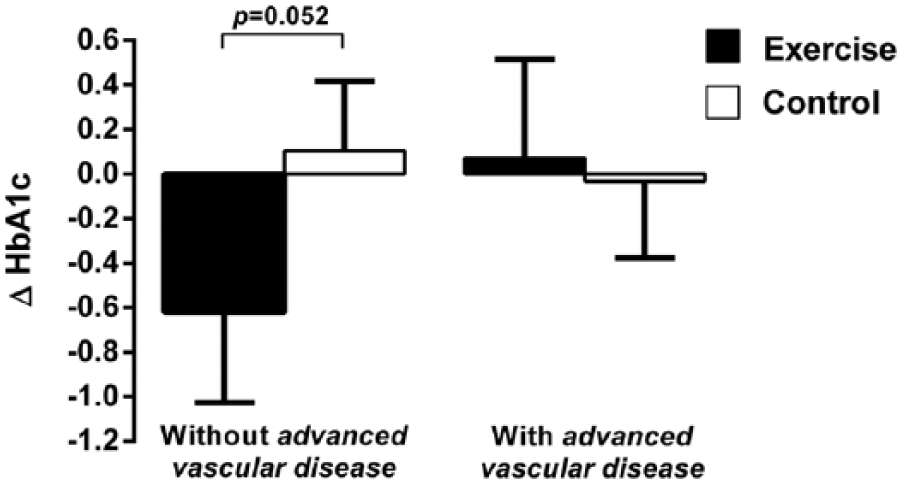
Changes in HbA1c according to presence of advanced vascular disease. Absolute changes in HbA1c in patients with (n = 68) and without (n = 46) advanced vascular disease according to randomised groups. Advanced vascular disease was defined as previous AMI and/or diabetes microvascular complications [history of nephropathy, neuropathy or retinopathy, and/or abnormal monofilament test and/or (micro-) albuminuria at baseline]. Changes are illustrated as mean (95% CI; unadjusted for baseline values). p value refers to difference in changes from baseline to 12 months between randomised groups in patients without advanced vascular disease (one-way ANCOVA).
Other CPET parameters at baseline and 12 months
Maximal values of RPE, RER and blood lactate during baseline CPET were 17 (17, 19), 1.16 (1.07, 1.23) and 6.2 mmol/L (5.5, 8.2) and at 12 months 17 (18, 18), 1.15 (1.09, 1.22) and 7.4 mmol/L (5.1, 8.8). There were no significant between-group differences in these parameters at any time point, indicating comparable effort during exercise testing in the two groups. A total of 43 patients (38%) at baseline and 47 (41%) at 12 months experienced exercise-induced ischaemia during CPET (defined as ST-depressions > 0.1 mV and/or typical angina pectoris symptoms), whereas 105 (92%) and 99 (87%) patients achieved the definition of ‘maximal test’ (RER ⩾ 1.10 and/or RPE ⩾ 17) at baseline and 12 months. There was no difference in responses to the intervention between those who achieved ‘maximal test’ or not.
Changes in weight, waist, diet and medication
There were no significant between-group differences in changes in weight, waist circumference, energy intake percentages of main nutrients or diabetes medication during the study period.
Adverse events
In total, 88 adverse events were registered during the study period in 76 study patients, the majority of these patients being part of the exercise group (45 vs 31, p = 0.032). The incidence of serious events, primarily cardiovascular events [worsening of stable angina pectoris and chronic heart failure (CHF), unstable angina pectoris, AMI, stroke and sudden cardiac arrest], was equally distributed between the exercise and control groups (11 vs 12). Musculoskeletal events (including skin ulcers, lower back pain, tendinitis, joint pain and fractures), however, tended to be more frequent among patients in the exercise group (21 vs 11, respectively, p = 0.077). No cardiovascular events occurred in close relation to the exercise sessions or CPET. There were few reported episodes of hypoglycaemia during the study period, and none of these events resulted in contact with health professionals.
Discussion
In this study, we could not demonstrate any significant effects of combined aerobic and resistance training on HbA1c or VO2peak in patients with both type 2 diabetes and stable CAD. However, VT and TTE did increase significantly in the exercise group compared to controls, indicating improved exercise performance despite the minor change in VO2peak. We further observed that patients in the exercise group without advanced vascular disease did improve their HbA1c and VO2peak compared to the control group, implying that the degree of vascular disease in patients with type 2 diabetes and CAD may influence how these patients respond to exercise training.
Our study was a relatively large randomised clinical trial with a long intervention period. The inclusion criteria were broad, and the exclusion criteria were mainly related to acute medical conditions and diseases and physical limitations affecting the ability to follow an exercise programme. The training programme consisted of basic and simple exercises that easily can be performed by regular patients. These factors increase the generalisability of the results.
The exercise adherence achieved in this study was lower than expected. We experienced a relatively high prevalence of somatic symptoms and complaints affecting the compliance to the exercise intervention. Many patients in the exercise group were unable to follow the training programme for shorter or longer periods. This may have reduced the exercise effects observed in the study. On the other hand, accepting that these patients with two serious chronic diseases are vulnerable and susceptible to medical problems, the achieved adherence and study results may give a realistic estimate of what can be expected in this group of patients.
Many patients in the study had angina pectoris, and this may have influenced the time of interruption of the exercise tests and thereby the CPET parameters. However, most of the patients achieved the criteria for ‘maximal test’. Angina pectoris may also have affected the training intensity of the exercise intervention in general.
Patients who were already engaged in exercise training were allowed to take part in the study if their level of activity at time of inclusion did not exceed the training programme in the study. This may have resulted in higher baseline fitness and a lower potential for further improvements compared with a situation where only sedentary patients were included. Indeed, the baseline VO2peak in this study was high compared with other studies, 7 and improvements in VO2peak were inversely related to baseline VO2peak.
We are not aware of previous randomised exercise trials in patients with type 2 diabetes and CAD with glycaemic control and/or exercise capacity as outcomes. Some exercise studies in patients with type 2 diabetes have included patients with CAD/CVD, but this combination has amounted for only a proportion of the study population.8,21 The effect of CR on exercise capacity in patients with both diseases has been investigated in some trials. One CR study reported smaller increase in this group of patients, 13 while others did not. 12 However, these studies were observational studies comparing CAD patients with and without type 2 diabetes.
Several trials have shown beneficial effects of exercise training on glycaemic control in patients with type 2 diabetes only, 22 and large studies have reported greatest reduction in HbA1c with combined aerobic and resistance training.8,23 However, a recent meta-analysis showed similar magnitude of HbA1c reduction across different exercise modalities (aerobic, resistance or combined aerobic and resistance). 24 This study also showed that exercise durations of 150 min or less per week were associated with smaller HbA1c reduction compared with interventions with higher exercise volume.
The relatively good glycaemic control in our study population at baseline may have influenced the changes in HbA1c. A previous study showed that patients with HbA1c below 7.5% experienced smaller reductions compared with those with values above. 23 In line with this, we observed a significant trend in the exercise group for greater reduction in HbA1c through increasing quartiles of baseline HbA1c.
Although VO2peak showed only minor change, VT and TTE increased significantly, indicating that training does improve exercise performance in patients with type 2 diabetes and CAD. The increase in TTE was probably related to the improvements in VT. An increase in VT of approximately 13% is probably clinically relevant and noticeable for the patient as enhanced working capacity during daily activities. There are also indications that increased VT has prognostic implications. It has been shown that VT below 11 mL/kg/min identifies CHF patients at high risk for early death, 25 and in a study of patients undergoing major colonic surgery, VT was an independent predictor of postoperative complications and was used to discriminate patients with and without complications. 26
The discrepancy between the relative changes in VO2peak and VT may reflect characteristic features of patients with both type 2 diabetes and CAD. Previous studies have indicated that patients with CAD increase their VO2max primarily by increasing arteriovenous oxygen extraction.27,28 Thus, the limited increase in VO2peak in our patients could be due to an attenuated improvement in peripheral oxygen extraction. As the significant increase in VT may indicate ‘normal’ skeletal muscle oxidative function, this may imply impaired perfusion of the skeletal muscles in these patients. It has previously been proposed that the exercise impairments in type 2 diabetes are related to perfusion disturbances, 29 and it is possible that such disturbances limit the maximal skeletal muscle blood flow and thereby oxygen uptake during maximal exercise.
Our subgroup analysis indicates that exercise training may improve HbA1c and VO2peak in patients with type 2 diabetes without complicated vascular disease beyond the presence of CAD. This may imply that the overall lack of significant changes in HbA1c and VO2peak in our study was related to the fact that the majority of the study patients had advanced vascular disease. In light of our previous discussion, it is possible that these patients have more pronounced perfusion disturbances compared with patients without advanced vascular disease and that this may restrict the exercise-induced improvements of VO2peak and HbA1c. The significant increase in VT, without any influence of advanced vascular disease, may suggest that VT is less dependent on the degree of vascular disease and function than VO2peak.
Although not directly comparable, our main results are in line with previous studies indicating that patients with type 2 diabetes and CVD may experience less benefits from lifestyle modification and intensive glucose regulation as compared with patients without CVD.14,30
In summary, we could not demonstrate any overall significant effects of 1 year of combined exercise training on HbA1c or VO2peak in patients with both type 2 diabetes and CAD. However, we observed significant improvements of VT and TTE, indicating beneficial effects on exercise performance despite the minor change in VO2peak. We also observed that patients without vascular complications beyond CAD did improve their HbA1c and VO2peak, implying that the degree of vascular disease may influence the exercise responses in patients with type 2 diabetes and CAD.
Footnotes
Acknowledgements
The authors want to thank Mette Svendsen, Elisabeth Edvardsen, Marthe Aulie, Lars Amund Toftegaard, Bente Neraal, Sissel Åkra, Vibeke Bratseth, Beate Vestad and Charlotte Holst Hansen for valuable contributions to the study.
Declaration of conflicting interests
The authors declare that there is no conflict of interest.
Funding
This research received no specific grant from any funding agency in the public, commercial or not-for-profit sectors.