
Abstract
We investigated the effect of angiotensin II (Ang II) on matrix metalloproteinase-1 (MMP-1)/tissue inhibitor of metalloproteinase-1 (TIMP-1) balance in regulating collagen metabolism of diabetic skin. Skin tissues from diabetic model were collected, and the primary cultured fibroblasts were treated with Ang II receptor inhibitors before Ang II treatment. The collagen type I (Coll I) and collagen type III (Coll III) were measured by histochemistry. The expressions of transforming growth factor-β (TGF-β), MMP-1, TIMP-1 and propeptides of types I and III procollagens in skin tissues and fibroblasts were quantified using polymerase chain reaction (PCR), Western blot or enzyme-linked immunosorbent assay (ELISA). Collagen dysfunction was documented by changed collagen I/III ratio in streptozotocin (STZ)-injected mice compared with controls. This was accompanied by increased expression of TGF-β, TIMP-1 and propeptides of types I and III procollagens in diabetic skin tissues. In primary cultured fibroblasts, Ang II prompted collagen synthesis accompanied by increases in the expressions of TGF-β, TIMP-1 and types I and III procollagens, and these increases were inhibited by losartan, an Ang II type 1 (AT1) receptor blocker, but not affected by PD123319, an Ang II type 2 (AT2) receptor antagonist. These findings present evidence that Ang-II-mediated changes in the productions of MMP-1 and TIMP-1 occur via AT1 receptors and a TGF-β-dependent mechanism.
Introduction
Diabetic skin tissues manifest reduced growth capacity of the dermal fibroblasts associated with abnormalities in extracellular matrix (ECM) metabolism. Disturbance in the balance between ECM production and degradation leads to the formation of chronic ulcers.1,2 As an extracellular macromolecule, collagen is the main component of ECM and the most abundant structural protein in skin tissues. The dermis of skin consists of 80% collagen type I (Coll I), and the rest is mostly collagen type III (Coll III). 3 The fibroblast is pivotal for collagen production, and numerous collagen structures need to be reconstituted after skin injury. 4 Special tissue growth factors, such as transforming growth factor-β (TGF-β), the most potent growth factor involved in wound healing, play a key role in the inflammatory response, angiogenesis, re-epithelialisation, ECM deposition and remodelling in abnormal collagen metabolism within diabetic skin tissues.5–7 TGF-β could modulate the expression of matrix metalloproteinases (MMPs), a family of zinc-dependent endopeptidases that are collectively capable of cleaving all the components of ECM and basement membrane. 8 In diabetic skin, the balance between MMPs and its preferential inhibitors [tissue inhibitor of metalloproteinase-1 (TIMP-1)] is disturbed, leading to the microstructural change of skin tissues.9–11
There has been evidence to suggest that diabetic chronic complications, such as diabetic nephropathy and skin lesion, are related to the local components of the renin–angiotensin system (RAS). RAS expressed by tissues and organs is called local/tissue RAS, which plays an important role in the pathogenesis of wound repair and tissue reconstruction.12,13 Angiotensin II (Ang II) affects proliferation, apoptosis, migration, collagen metabolism and capillary formation of skin cells via its receptors.14,15 Our previous study has suggested that Ang II and its functional receptors were significantly increased in diabetic skin fibroblasts, 16 indicating that the upregulation of Ang II type 1 (AT1) receptor might influence diabetic fibroblast functions related to ECM remodelling. Previous reports also suggested the role of Ang II in MMP and TIMP system regulation through a TGF-β-dependent mechanism in some cell lines, including proximal tubule cells; 17 however, the effect of Ang II on MMP-1/TIMP-1 balance in collagen metabolism of diabetic skin remains unknown.
Thus, the aim of our study is to gain insight into collagen synthesis and degradation in diabetic skin tissues and determine the role of Ang II on collagen metabolism in skin fibroblasts. Furthermore, the relationship between Ang II and TGF-β-mediating MMP-1/TIMP-1 balance in collagen metabolism is also explored.
Methods
Animal experiment
In total, 16 clean-grade Spreqne-Dawley rats, each weighted about 220 g, were randomised into control and experimental groups after fed adaptively for 1 week. Diabetes was induced by injection [intraperitoneally (i.p.)] of streptozotocin (STZ; Sigma, USA) at 35 mg/kg prepared in 0.1 mol/L citrate buffer (pH = 4.2) for three consecutive days. Animals injected with buffer alone were used as normal controls (n = 8). Blood glucose (BG) was measured by a OneTouch II® Glucometer (LifeScan, USA) 72 h after STZ injection, and animals were considered to be diabetic when the concentration of BG was ≥16.7 mmol/L. Rats were further housed for 8 weeks before being killed. All interventions and experiments with animals were performed in accordance with the Guidelines and Policies for Animal Surgery provided by our university (Sun Yat-sen University, Guangzhou, China) and were approved by the Institutional Animal Care and Use Committee.
Histological examination and Sirius red staining
At the end of the 8-week period, animals were i.p. injected with 1% pentobarbital (40 mg/kg), and central dorsal skin tissues, 1–5 cm from the skull, were obtained. Skin tissues were fixed in 4% formaldehyde and then embedded in paraffin. Skin tissue sections were stained for collagen with Sirius red as described by Junqueira et al. 18 Unbound dye was removed by washing, and the bound complex was dissolved in 0.5% sodium hydroxide. Polarised light microscope was used to observe Coll I and Coll III. The percentage of the stained Coll I and Coll III in skin tissues was measured with a computerised image analysis system (Photoshop).
Fibroblast cell culture
The dorsal skin tissues of Spreqne-Dawley rats were cut into 2 mm × 5 mm stripes and placed in 0.2% dispase (Sigma) at 4°C for digestion of about 20 h. Then, epidermis and dermis were separated, and dermis was cut into small pieces with addition of 0.25% trypsin/0.02% EDTA (Sigma), which were kept at 37°C for 15 min to digest into single-cell suspension. Fibroblasts from diabetic and normal rats were resuspended, respectively, with high-glucose or normal-glucose Dulbecco’s modified Eagle’s medium (DMEM; Invitrogen, Guangzhou, China) containing 10% fetal calf serum (FCS). Cells were cultured in 37°C and 5% CO2 condition, and culture medium was changed every 2 days. After reaching 80% confluence, the cells were digested with 0.25% trypsin/0.02% EDTA at 37°C and then subcultured. The second-generation fibroblasts were used in this study. To identify fibroblasts, antibody to vimentin was used (data not shown).
Cell treatment
Primary fibroblasts from diabetic and normal rats were cultured with high-glucose or normal-glucose DMEM (Invitrogen) containing 10% FCS (Hyclone, Rockville, MD). After reaching 80% confluence, cells were shifted into DMEM containing 0.5% FCS for 24 h. For some experiments, the AT1 receptor inhibitor losartan (10−5 mol/L) or the Ang II type 2 (AT2) receptor inhibitor PD123319 (10−5 mol/L) was added 30 min before Ang II treatment. Then, 10−7 mol/L Ang II was added and cells were treated for 24 h.
Enzyme-linked immunosorbent assay
Homogenate of skin tissues was centrifuged at 4°C, 3000 r/min for 15 min. Supernatant was stored at −80°C or below. Cell culture medium of fibroblast in different groups was collected and centrifuged at 3000 r/min for 15 min. The concentration of TGF-β, carboxyterminal propeptide of type I procollagen (PICP), aminoterminal propeptide of type III procollagen (PIIINP) and cross-linked carboxyterminal telopeptide of type I procollagen (ICTP) in skin homogenate from diabetic and normal rats, and fibroblasts of different groups were analysed with enzyme-linked immunosorbent assay (ELISA; R&D systems, China).
Reverse transcriptase–polymerase chain reaction
Total RNA in skin tissues was extracted (TRIzol, Invitrogen) and was then transcribed reversely by the reverse transcriptase (First Strand cDNA Synthesis Kit, Fermentas) into complementary DNA (cDNA) for PCR. Primers were designed and synthesised by Bioengineering Techniques from Shanghai Public Health Services Ltd. PCR primer sequences and product sizes were shown in Table 1. Primers against rat glyceraldehyde-3-phosphate dehydrogenase (GAPDH) were used as an internal control. After electrophoresis, they were photographed and scanned for electrophoretic bands with AlphaImager 2200 software. The semi-quantitative test results of target-amplified fragments were the greyscale ratio of the specially amplified DNA fragment bands with the inner reference bands at the same time (optical density of the target gene/optical density of GAPDH).
Primer sequences used for RT-PCR.
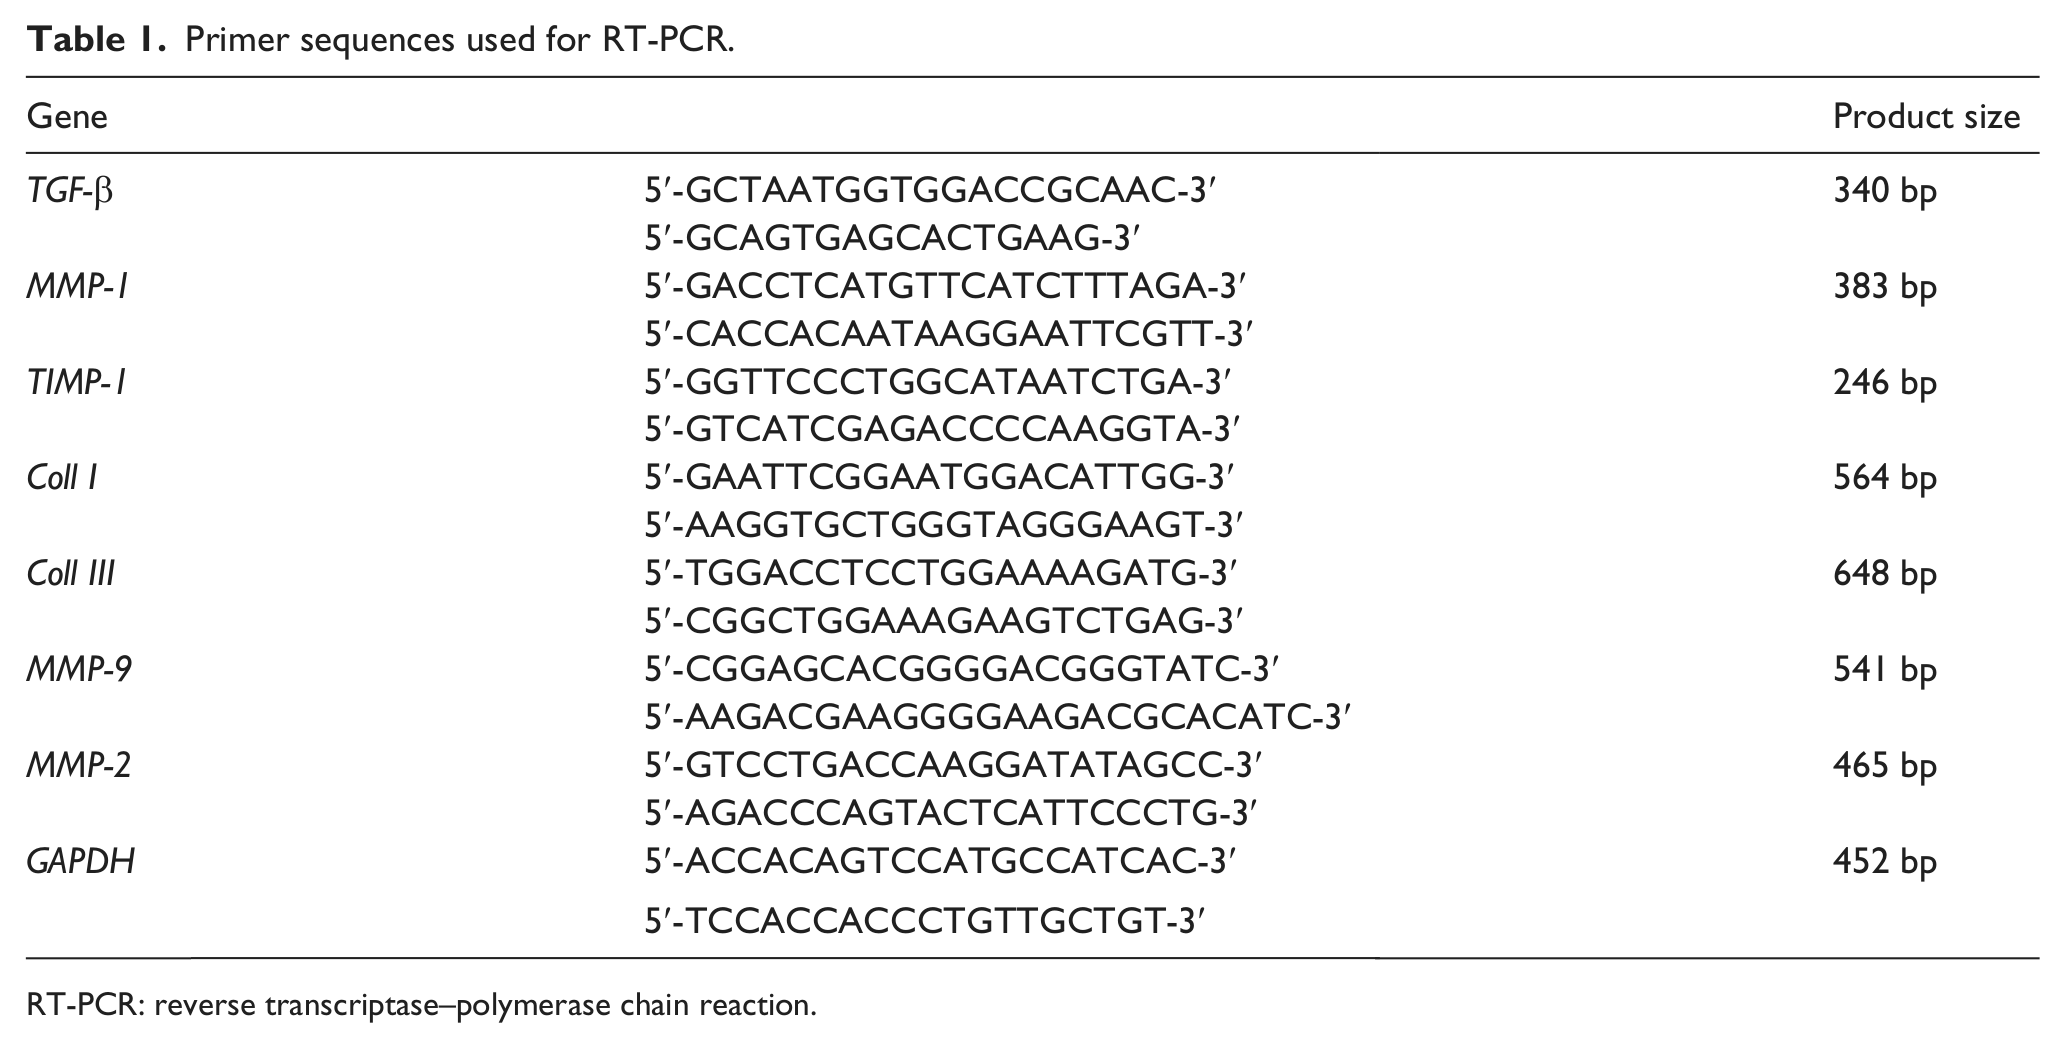
RT-PCR: reverse transcriptase–polymerase chain reaction.
When the fibroblasts from diabetic and normal rats reached 80% confluence, they were washed with D-Hanks solution, and total RNA was extracted. The remaining steps were similar to that of assay of messenger RNA (mRNA) levels of TGF-β, MMP-1, TIMP-1, Coll I, Coll III, MMP-9 and MMP-2 in skin tissues.
Western blot
Total proteins in skin tissues and fibroblasts were extracted. Protein concentrations were determined using BCA Protein Concentration Determination Kit (Bio-Rad, CA, USA). An amount of 25 µg of protein was separated by 10% sodium dodecyl sulphate polyacrylamide gel electrophoresis (SDS-PAGE) gels and electrotransferred onto polyvinylidene difluoride (PVDF) membranes. Then blots were blocked with phosphate-buffered saline (PBS) containing 0.1% Tween 20 and 5% dry milk for 1 h at room temperature and incubated overnight at 4°C with anti-MMP-1 antibody (1:500; Abcam), anti-MMP-9 antibody (1:800; Abcam), anti-MMP-2 antibody (1:800; Abcam) or anti-TIMP-1 antibody (1:800; Abcam, Cambridge, MA, USA). After incubation with second antibody, immune complexes were detected using enhanced chemiluminescence (ECL) method, and immunoreactive bands were quantified using AlphaImager 2200. Values were corrected with the absorbency of the internal control (GAPDH).
Statistical analysis
All experiments were repeated at least three times. Values are given as mean ± standard deviation (SD). Statistical analysis was carried out using either Student’s t-test or one-way analysis of variance (ANOVA) for comparison of more than two groups. Data were analysed using SPSS 11.0 software (SPSS Inc., Illinois, USA); p < 0.05 was considered statistically significant.
Results
Collagen structure in normal and diabetic rat skin tissues
Our previous results of haematoxylin and eosin–stained sections revealed that dermal features from normal and diabetic skin were consistently different. The thickness of dermis of diabetic skin tissues was significantly thinner, with thin, degenerated and fractured collagen fibres. 16 In this study, we observed the distribution of collagen and calculated the percentages of Coll I and Coll III in skin tissues. When observed in light microscope, the collagen demonstrated red colour (Figure 1(a) and (b)). Specifically, results from polarised light microscope observation showed that Coll I presented red or yellow colour with strong light refraction, while Coll III demonstrated green fibre bundles with weak light refraction (Figure 1(c) and (d)). In normal skin tissues, Coll I fibres were thick and arranged densely, while in diabetic skin tissues, Coll I fibres were arranged sparsely with wide spaces. The percentages of Coll I and Coll III in normal skin tissues were 83.31% ± 15.80% and 13.93% ± 5.60%, respectively, while the percentages of these two kinds of collagen were 58.42% ± 9.43% and 35.75% ± 4.31% in diabetic skin tissues.
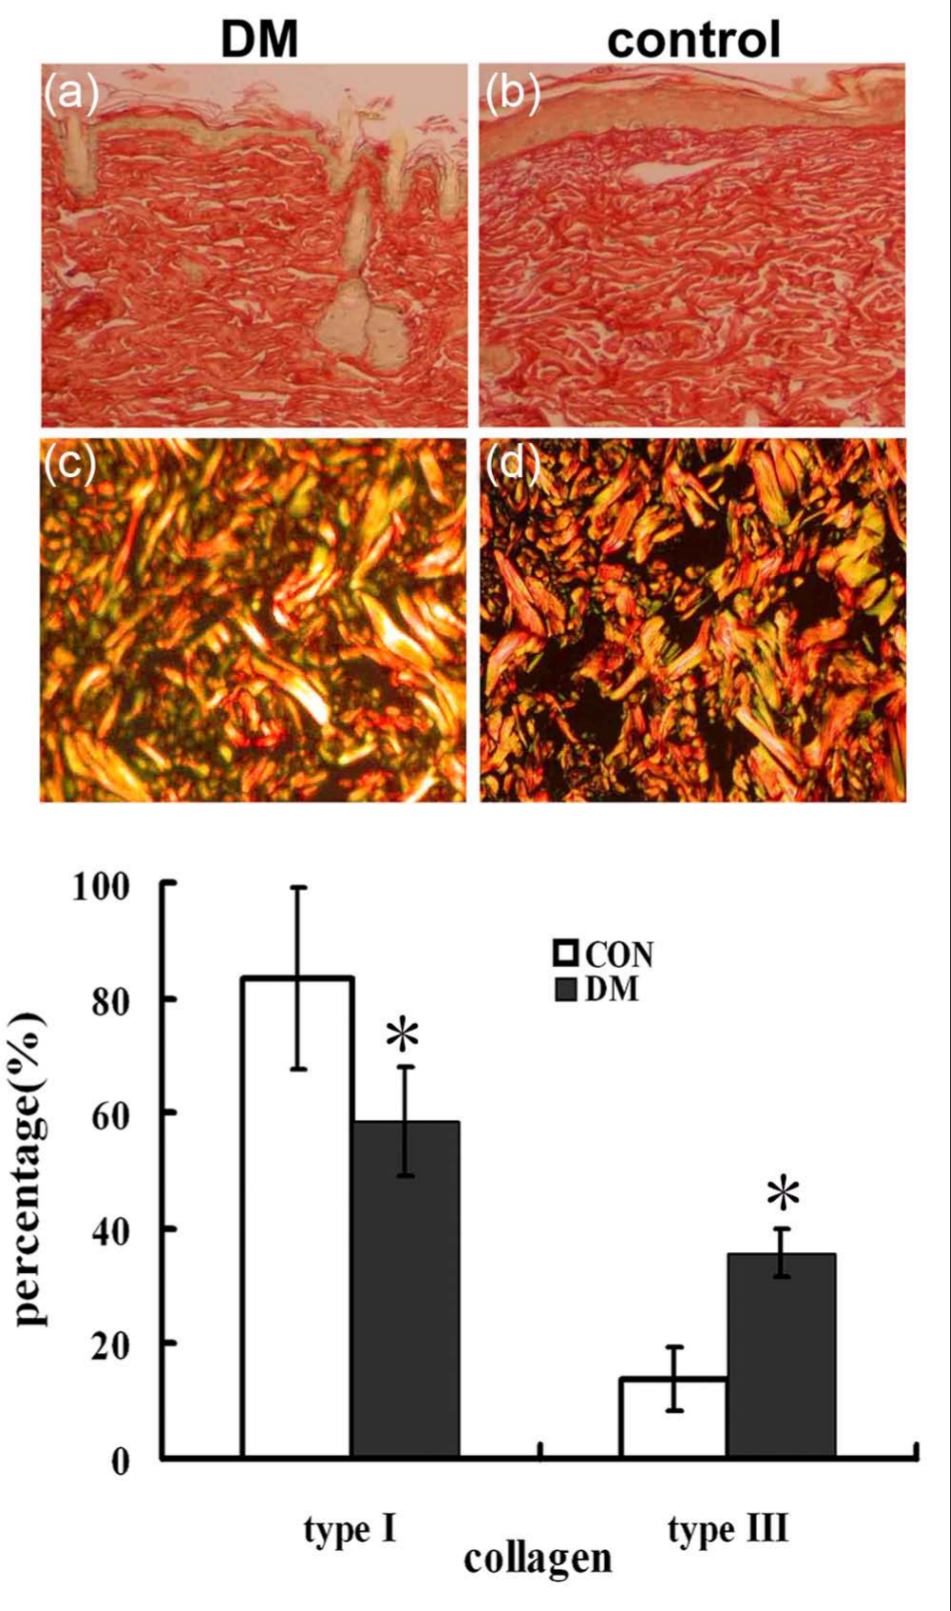
Sirius red staining of collagen content in dermal of normal and diabetic skin tissues. Tissues were fixed overnight in 4% polyformaldehyde, embedded in paraffin, and sectioned at 4 µm with a microtome. Sections were then stained with Sirius red staining. (a and b) Light microscope results and (c and d) polarised observation of Sirius red–stained type I (orange/red) and type III (yellow/green) collagens were shown. Histogram plots represented the results corresponding to the mean ± SD of three independent experiments of the percentages of type I and type III collagens in normal and diabetic rat skin tissues. Magnifications: (a and b) ×100; (c and d) ×200. *p < 0.05 compared with control group.
mRNA expressions of TGF-β, MMP-1, TIMP-1, Coll I, Coll III, MMP-9 and MMP-2 in skin tissues
Compared with control group, the mRNA expression of TGF-β was increased in diabetic skin tissues. Although MMP-1 and MMP-2 mRNA expressions did not show any differences between these two groups, the TIMP-1 level was decreased, thus the ratio of MMP-1 to TIMP-1 expression was significantly higher in diabetic groups. Furthermore, the MMP-9 mRNA expression was increased in diabetic rats. Reverse transcriptase–polymerase chain reaction (RT-PCR) results also showed that mRNA expressions of Coll I and Coll III could be detected in skin tissues of both diabetic and control groups. The expression levels in diabetic rats were relatively higher than those in normal control (Figure 2).
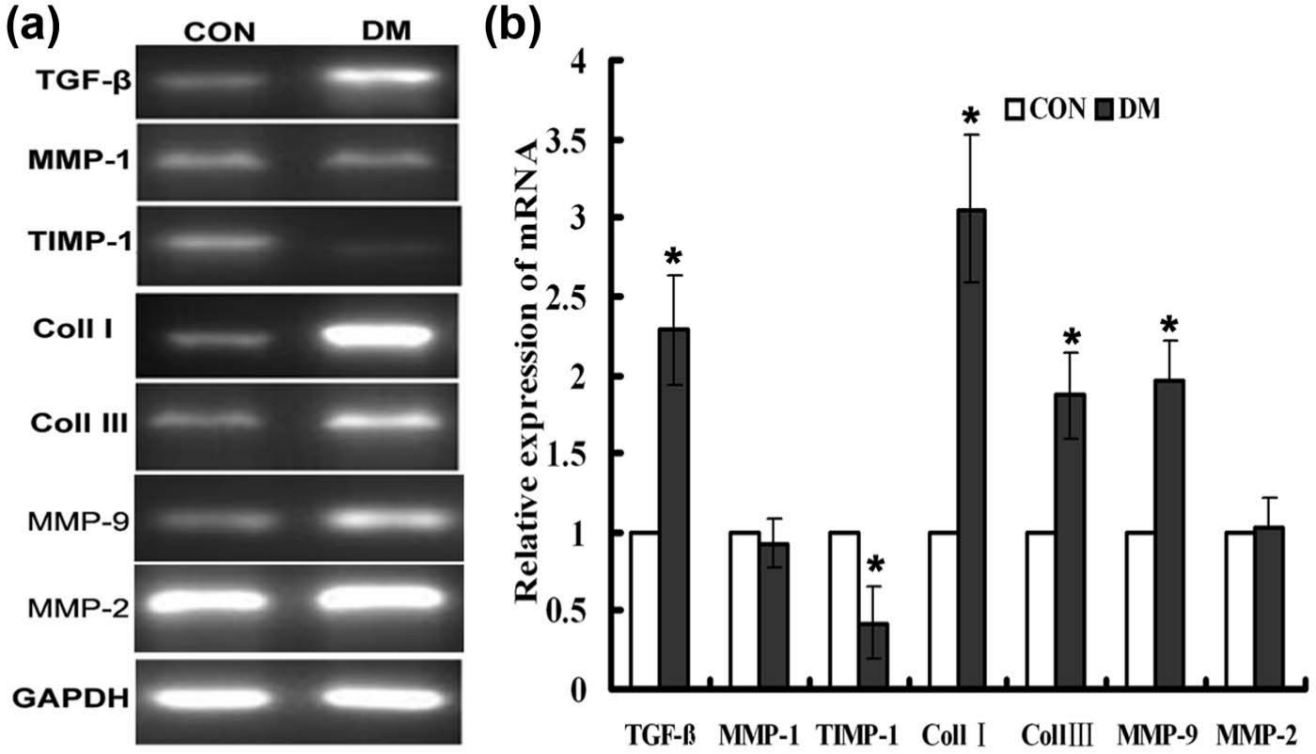
mRNA expressions of TGF-β, MMP-1, TIMP-1, Coll I, Coll III, MMP-9 and MMP-2 in control and diabetic skin tissues. (a) mRNA expressions of TGF-β, MMP-1, TIMP-1, Coll I, Coll III, MMP-9 and MMP-2 in skin tissues were analysed by RT-PCR. GAPDH was used as an internal control to standardise the amount of total RNA used. (b) Histogram plots represented the densitometric analysis corresponding to the mean ± SD of three independent experiments. *p < 0.05 compared with control group.
Protein levels of TGF-β, MMP-1, TIMP-1, MMP-9, MMP-2 and propeptides of type I and type III collagens in skin tissues and fibroblasts
Similar to mRNA expression, protein expressions of MMP-1, MMP-9, MMP-2 and TIMP-1 could be detected in skin tissues of both normal and diabetic rats (Figure 3(a) and (b)). Diabetic group demonstrated decreased TIMP-1 expression, while the expression of MMP-1 and MMP-2 did not show any significant change between these two groups. MMP-9 also demonstrated increased protein expression in diabetic rats than in non-diabetic groups. The concentrations of TGF-β (Figure 3(c)), PICP (Figure 3(d)), ICTP (Figure 3(e)) and PIIINP (Figure 3(f)) were measured through ELISA. In diabetic skin homogenate, the concentrations of TGF-β, ICTP and PIIINP were all higher than those in normal control, while PICP level did not show any significant difference between these two groups. Furthermore, the concentrations of these four factors could also be measured in the supernatant of primary cultured fibroblasts. Similar to the results of skin tissues, the concentrations of TGF-β, PICP, ICTP and PIIINP were all higher in diabetic fibroblasts, especially the concentration of ICTP. Thus, the ratio of ICTP to PICP increased to 40% in diabetic group as compared to that in control.
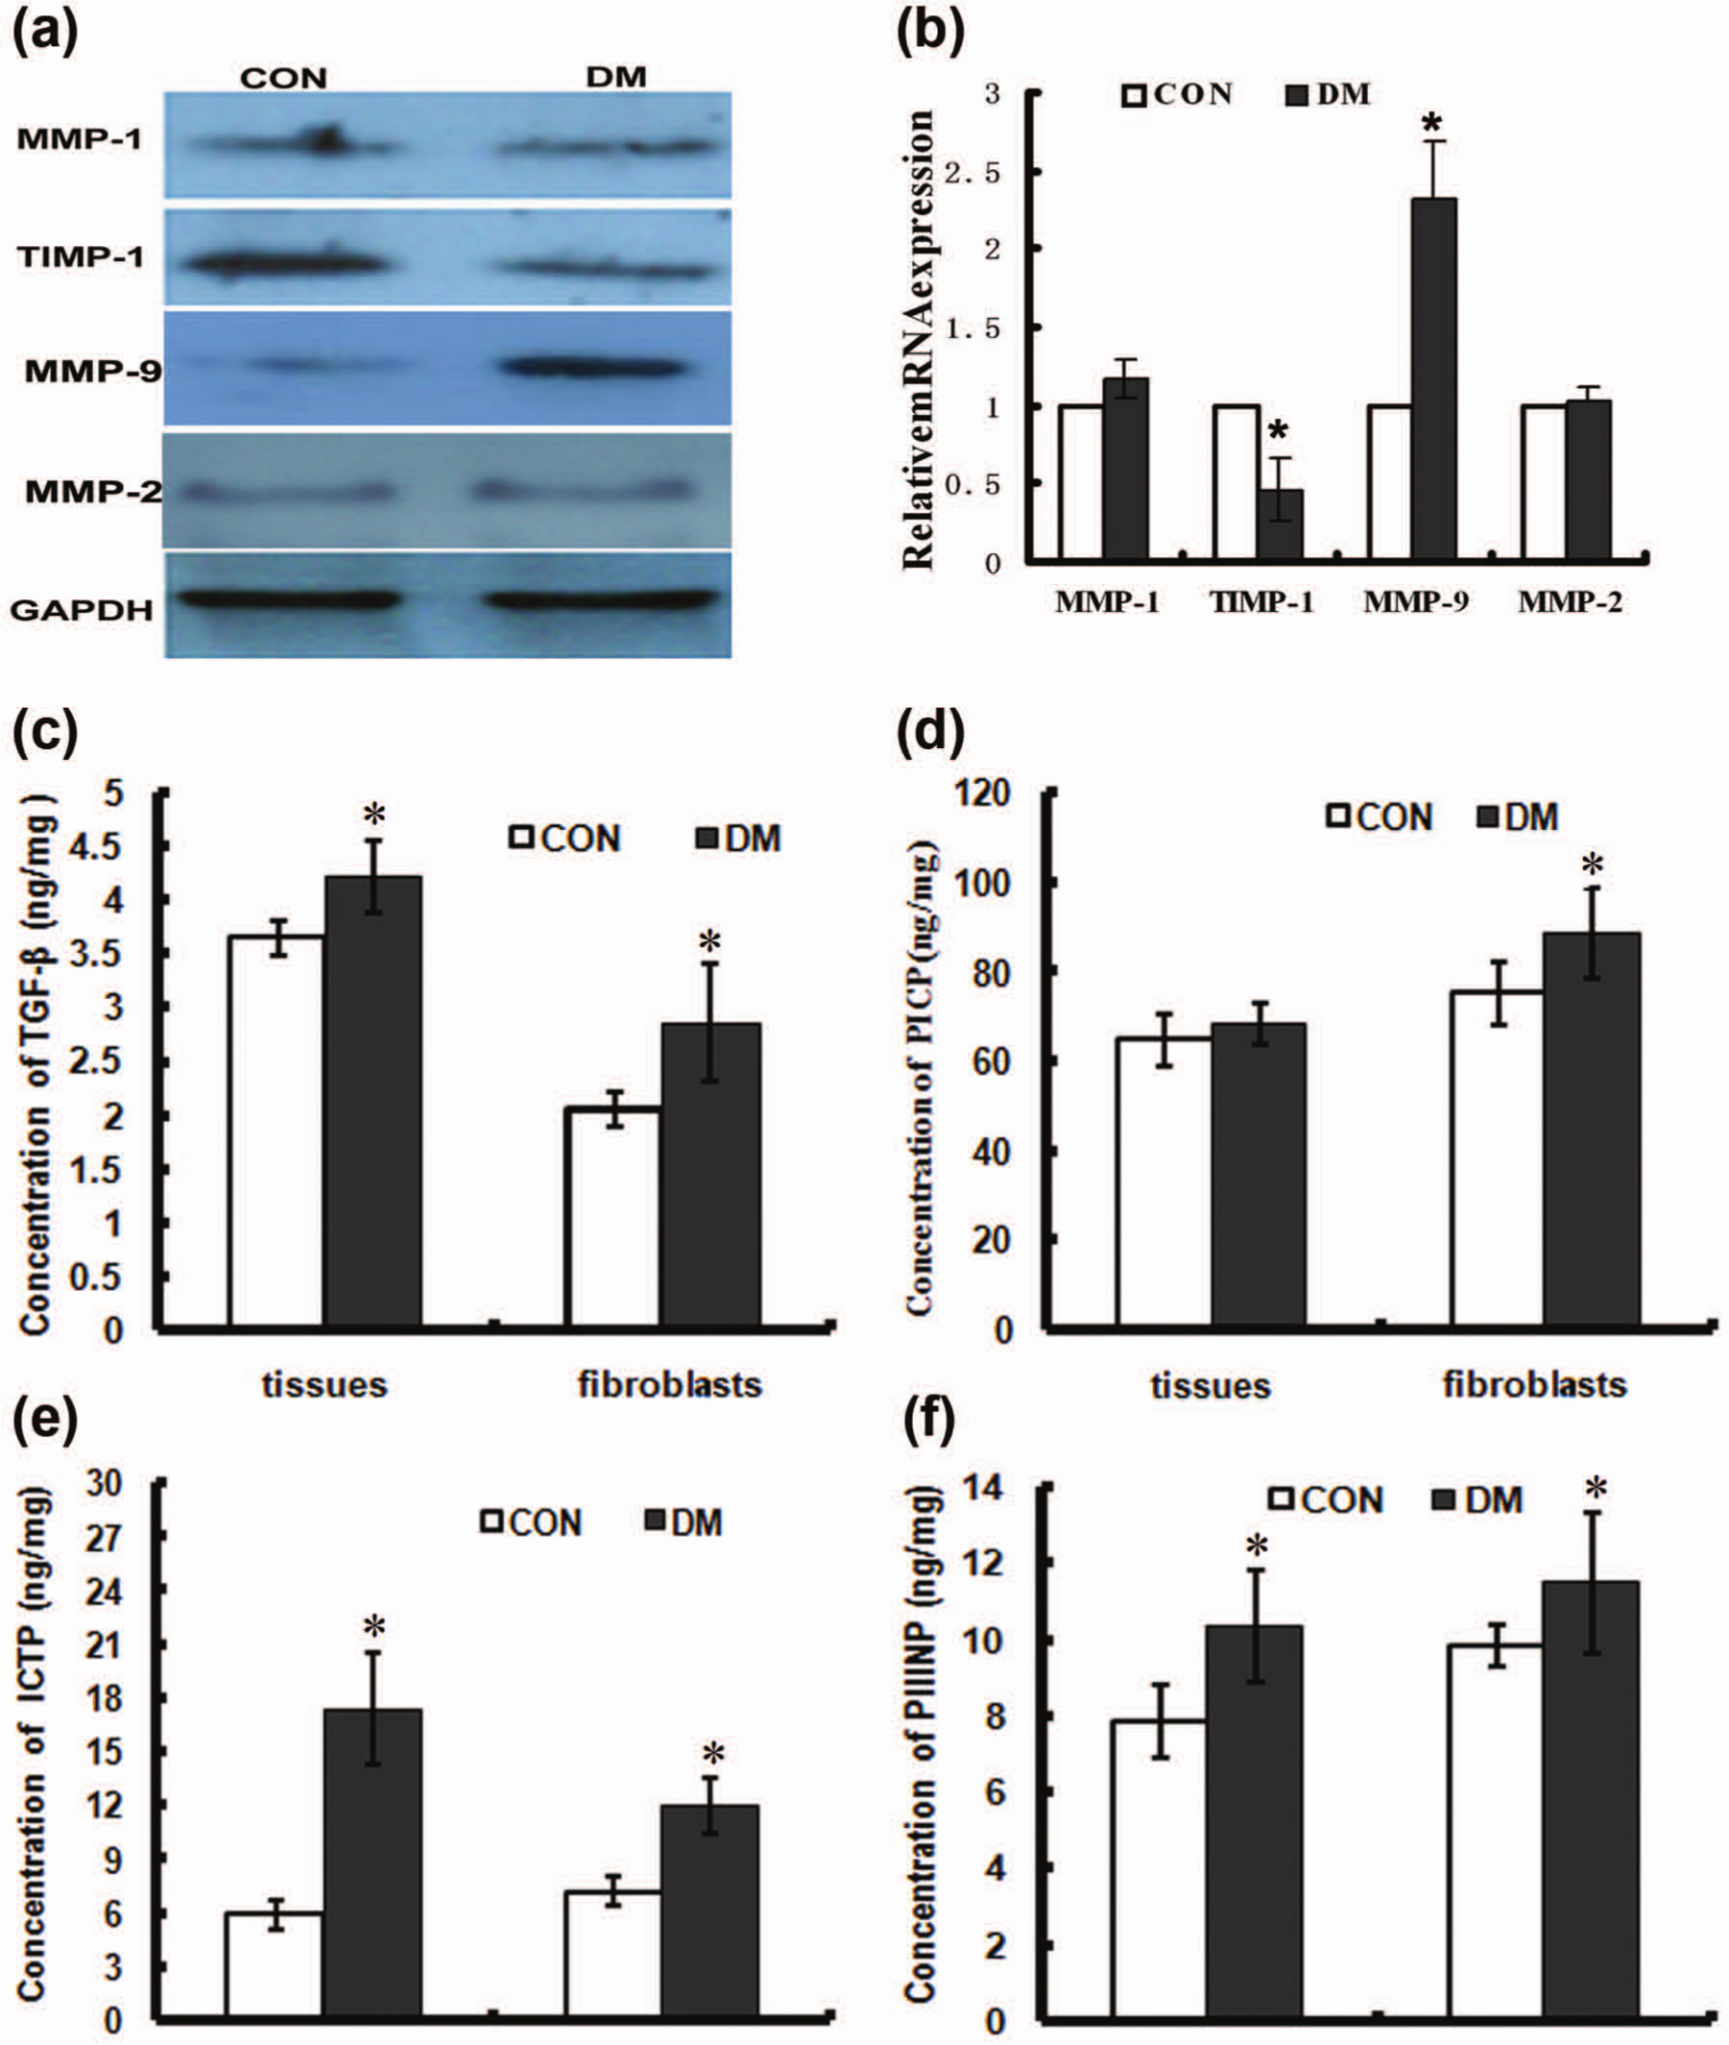
Protein levels of MMP-1, TIMP-1, MMP-9, MMP-2, TGF-β, PICP, ICTP and PIIINP in skin tissues and fibroblasts. (a) Protein expressions of MMP-1, TIMP-1, MMP-9 and MMP-2 were analysed in skin tissues by Western blot. GAPDH was used as an internal control to standardise the amount of protein used. (b) Histogram plots represented the densitometric analysis corresponding to the mean ± SD of three independent experiments. *p < 0.05 compared with control. Concentrations of (c) TGF-β, (d) PICP, (e) ICTP and (f) PIIINP in skin homogenate (tissues) and supernatant of fibroblasts from diabetic rats and control group were measured through ELISA. Histogram plots represented the mean ± SD of three independent experiments. *p < 0.05 compared with control.
Roles of Ang II receptors in regulating collagen metabolism in diabetic skin fibroblasts
We further examined the mRNA expressions of TGF-β, MMP-1, TIMP-1, Coll I and Coll III under the treatment of Ang II and its inhibitors (Figure 4). Results demonstrated that Ang II increased TGF-β, TIMP-1, Coll I and Coll III mRNA expressions, which was inhibited by an Ang II type 1 (AT1) receptor–specific blocker, losartan, but was not influenced by the AT2 receptor blocker, PD123319. Similar effects of Ang II on the levels of protein expression were also observed (Figure 5). Ang II increased the protein expression of TIMP-1 and enhanced the concentrations of TGF-β, PICP, ICTP and PIIINP (Table 2). This increase was also inhibited by losartan, whereas PD123319 did not show any inhibitory effect. Furthermore, the mRNA and protein expressions of MMP-1 were not significantly affected through the treatment of Ang II and its inhibitor.
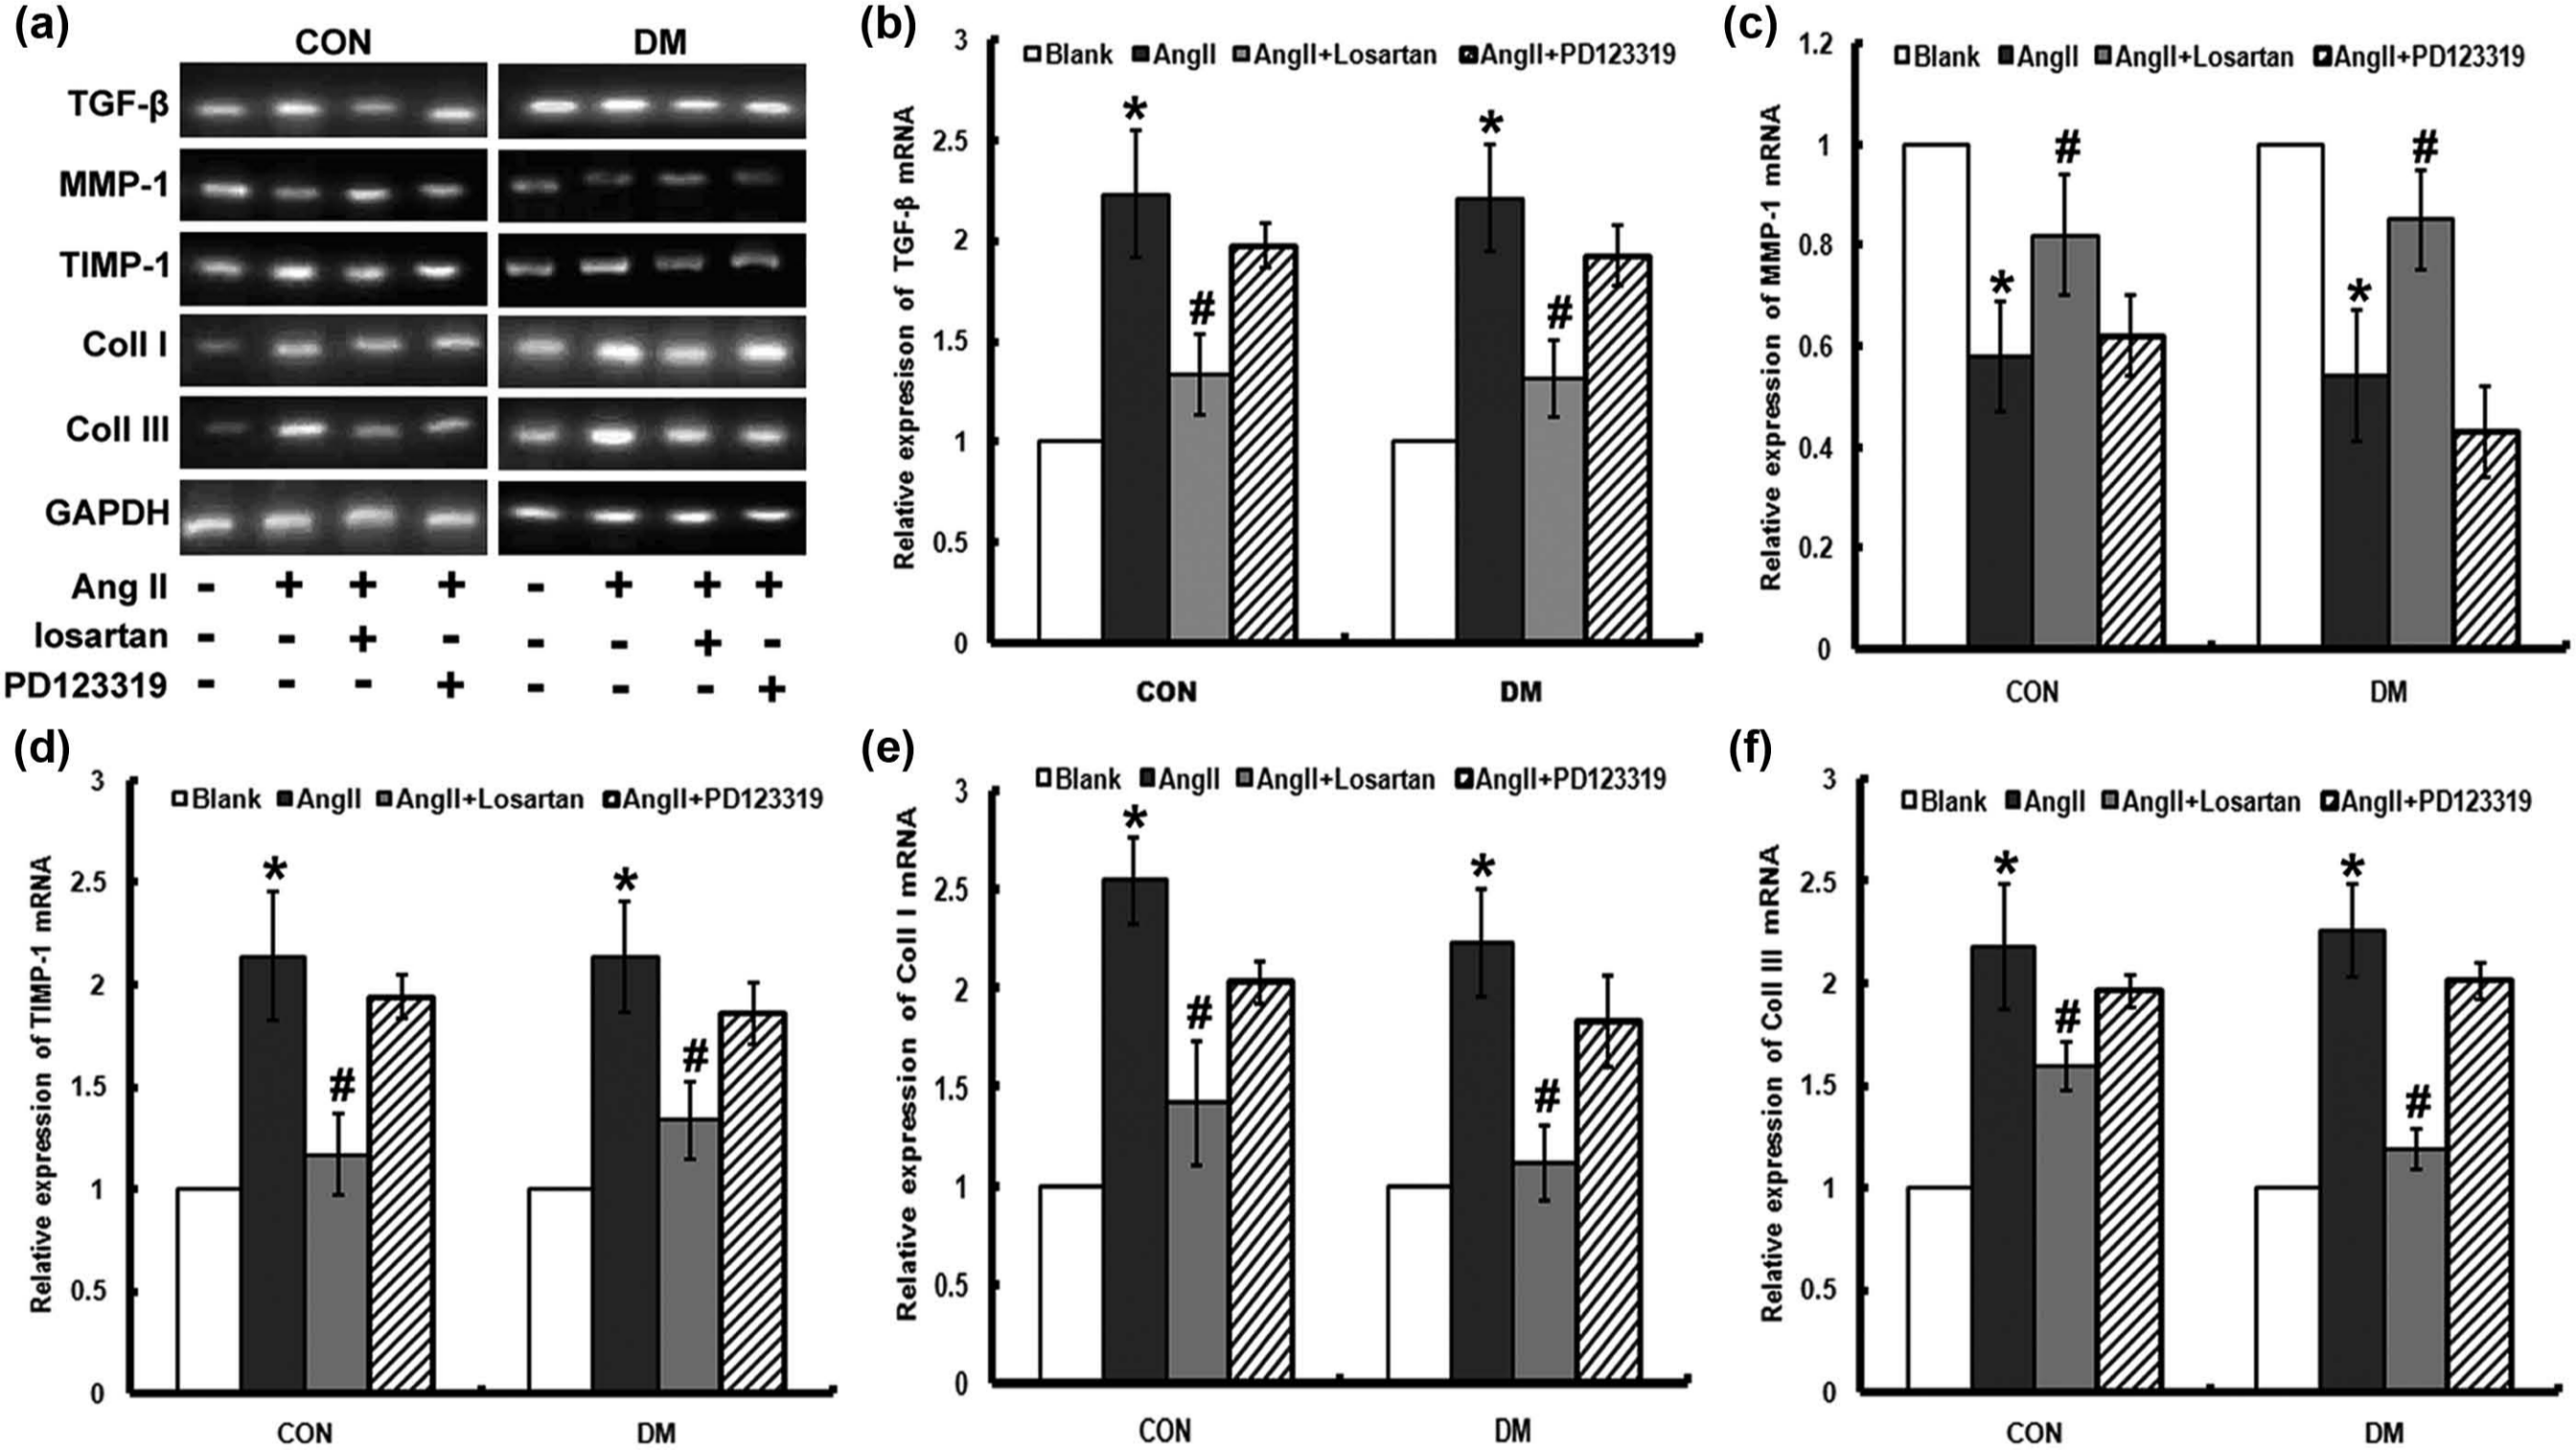
Effects of AT1 and AT2 receptors in regulating mRNA expression of TGF-β, MMP-1, TIMP-1, Coll I and Coll III. Fibroblasts from diabetic and normal rats were starved for 24 h. The AT1 receptor inhibitor losartan (10−5 mol/L) or the AT2 receptor inhibitor PD123319 (10−5 mol/L) was added 30 min before Ang II (10−7 mol/L) treatment. RT-PCR was performed to measure mRNA expressions of TGF-β, MMP-1, TIMP-1, Coll I and Coll III. GAPDH was used as an internal control to standardise the amount of total RNA used. (a) Representative blot. (b–f) Histogram plots represented the densitometric analysis corresponding to the mean ± SD of three independent experiments. *p < 0.05 compared with untreated group; #p < 0.05 compared with Ang II + losartan group.
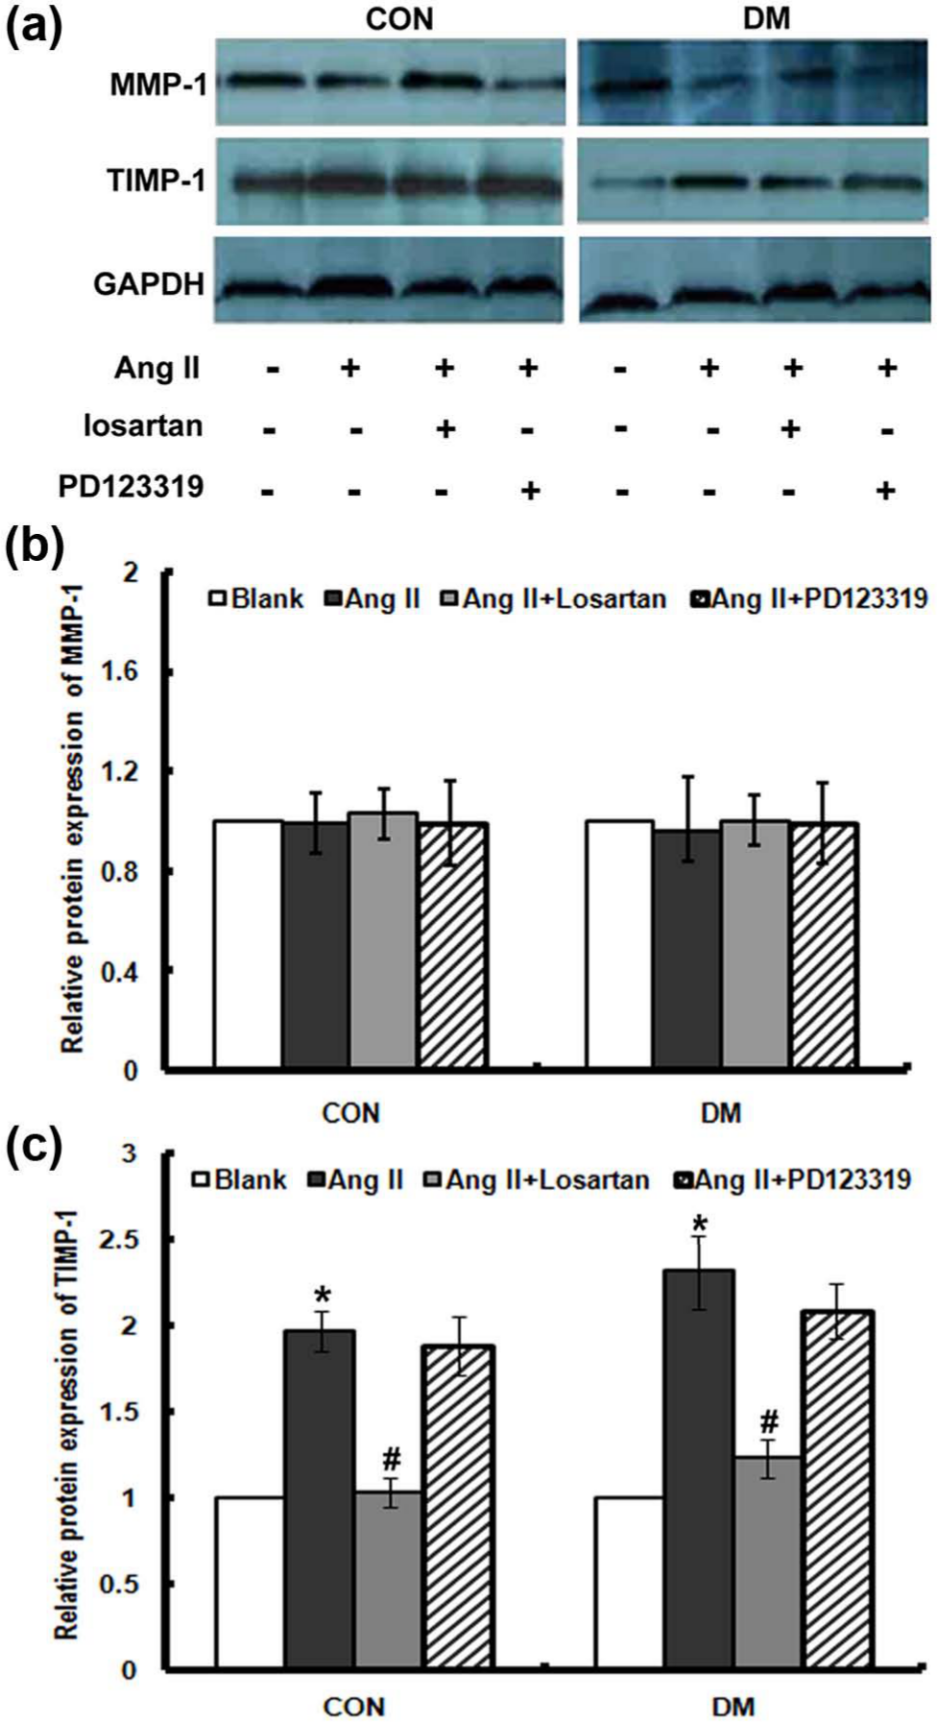
Effects of AT1 and AT2 receptors in protein expressions of MMP-1 and TIMP-1. Fibroblasts from diabetic and normal rats were starved for 24 h. The AT1 receptor inhibitor losartan (10−5 mol/L) or the AT2 receptor inhibitor PD123319 (10−5 mol/L) was added 30 min before Ang II (10−7 mol/L) treatment. (a) Western blotting was performed to measure protein levels of MMP-1 and TIMP-1. Equal amounts of protein were loaded to allow direct comparisons. GAPDH was the loading control. (b and c) Densitometric results from three experiments. *p < 0.05 compared with untreated group;#p < 0.05 versus Ang II + losartan group.
Concentrations of TGF-β, PICP, ICTP and PIIINP in normal and diabetic fibroblasts.
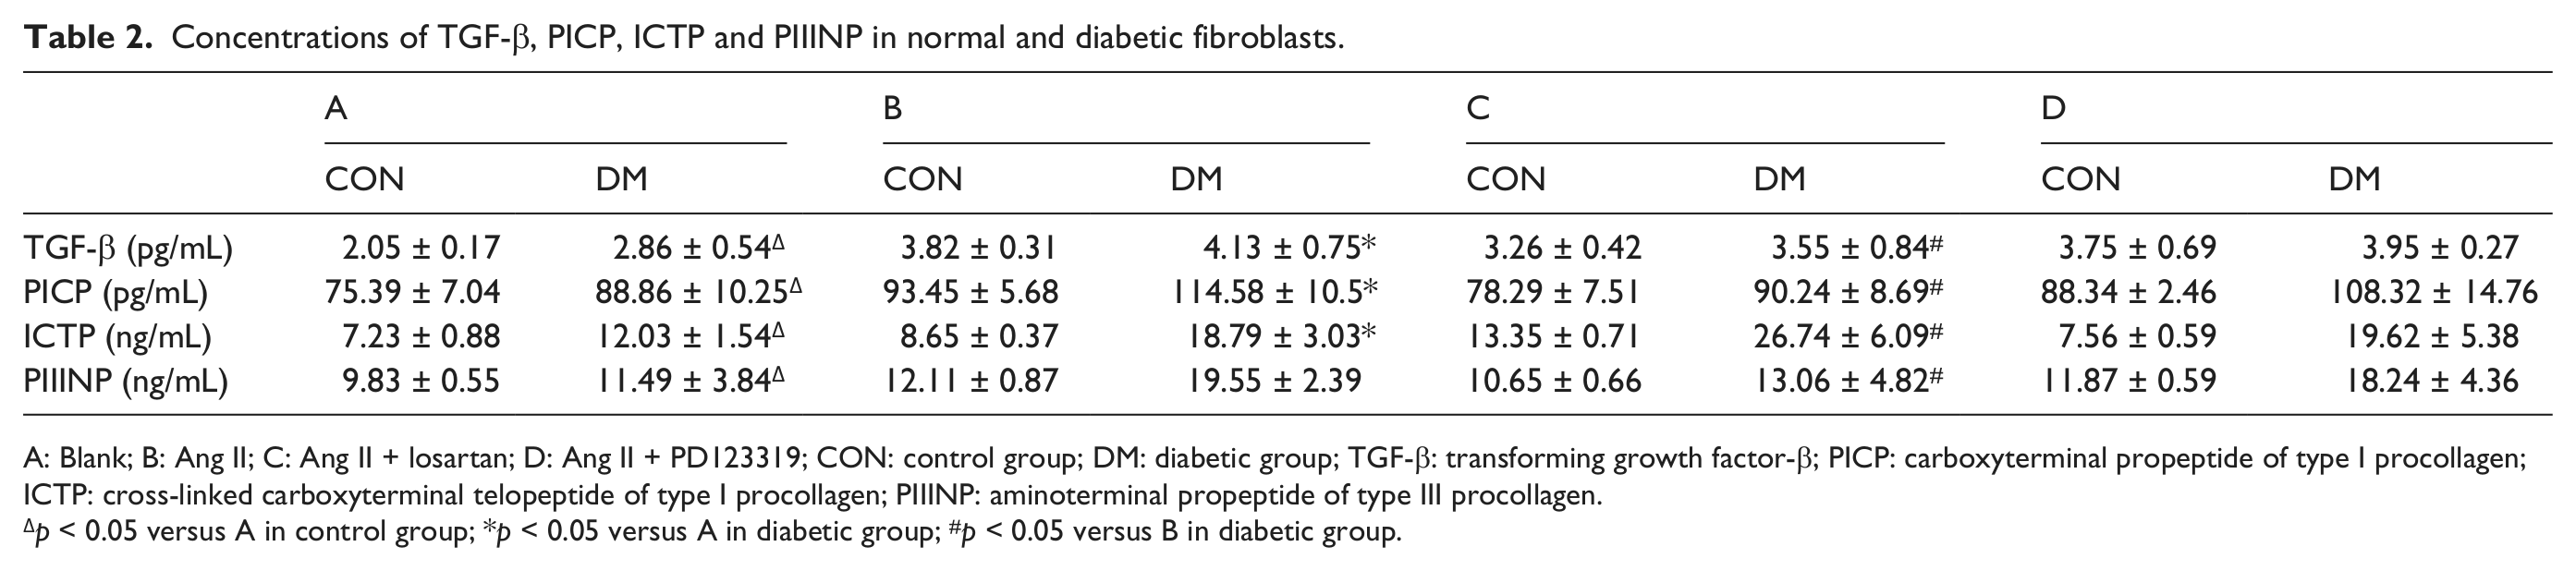
A: Blank; B: Ang II; C: Ang II + losartan; D: Ang II + PD123319; CON: control group; DM: diabetic group; TGF-β: transforming growth factor-β; PICP: carboxyterminal propeptide of type I procollagen; ICTP: cross-linked carboxyterminal telopeptide of type I procollagen; PIIINP: aminoterminal propeptide of type III procollagen.
p < 0.05 versus A in control group; *p < 0.05 versus A in diabetic group; #p < 0.05 versus B in diabetic group.
Discussion
The delicate dynamic balance of collagen synthesis and degradation participates in ECM metabolism of skin tissues. 1 Modification of the collagen I/III ratio might contribute to the weakness of dermal and is involved in the pathogenesis of abnormal skin microstructure in diabetes. In this study, decreased collagen I/III ratio was accompanied by increased expression of TGF-β, TIMP-1 and propeptides of types I and III procollagens in diabetic skin tissues. In primary cultured fibroblasts, Ang-II-mediated changes in the productions of MMP-1 and TIMP-1 occur via AT1 receptors and a TGF-β-dependent mechanism.
It is known that collagen degradation and synthesis are regulated by many inflammatory factors and cytokines in diabetic skin tissues. TGF-β is known to be the most potent growth factor involved in wound healing throughout the body. 20 The induction of TGF-β expression in diabetes plays an important role in stimulating ECM protein synthesis and inhibiting ECM degradation.21–23 Recent findings demonstrated that the binding of TGF-β with its receptors in fibroblasts regulated the balance between MMPs and TIMPs, which influenced wound healing.24–26 In this study, we focused on MMP-1 and TIMP-1 in these experiments because these are the main regulators of Coll I and Coll III metabolism in diabetic skin tissues. We demonstrated a marked elevation in TGF-β expression and secretion in diabetic skin tissues as well as in isolated dermal fibroblasts. Although the MMP-1 level remained unchanged no matter in skin tissues or fibroblasts, the TIMP-1 expression decreased significantly, thus the ratio of MMP-1 to TIMP-1 increased dramatically, which in part accounted for the imbalance of collagen metabolism.27–29
The imbalance of collagen metabolism may lead to the change of collagen quality and quantity. 30 Here, we demonstrated that no matter in normal or diabetic skin tissues, both Coll I and Coll III were the major collagen types. The ratio of Coll I to Coll III changed obviously in diabetic skin tissues compared to that in normal control. The collagen synthesis markers of Coll I and Coll III include PICP, aminoterminal propeptide of type I procollagen (PINP) and PIIINP, while ICTP is a marker of collagen degradation. Our data showed that the ratio of ICTP to PICP declined, indicating excessive degradation of collagen. Together with the results of MMP-1 and TIMP-1 expressions, we speculated that the increased ratio of MMP-1 to TIMP-1 led to the changes of collagen propeptide levels and participated in the pathological changes of diabetic skin collagen.
In diabetic skin, the local RAS system was activated, with elevated Ang II level and increased AT1 to AT2 receptor expression ratio. Our previous study showed that skin tissues synthesised Ang II itself locally, and local expression of Ang II was significantly increased in diabetic skin, which was closely associated with collagen metabolism and ECM production in diabetic skin tissues. 16 Recently, evidence has been presented that defined a role of Ang II in stimulation of collagen gene expression and protein turnover in cultured cardiac fibroblasts.31,32 Here, our results demonstrated TGF-β activation induced by Ang II, which was in line with other studies that demonstrated Ang II regulated synthesis of TGF-β.11,17 However, the effect of Ang II on MMPs and TIMPs in different studies remains controversial. In accordance with our observation, Chua et al. 33 have reported that Ang II induced TIMP-1 production in rat endothelial cells. While in human cardiocytes, Ang II had opposite and antagonistic effects on regulation of transcription of MMPs and TIMPs. These effects led to increased ratios of MMPs to TIMPs after Ang II stimulation. 34 In our study, MMP-1 expression did not change after Ang II stimulation, so the ratio of MMP-1 to TIMP-1 decreased when stimulated with Ang II. The controversial results might be related with different cell types or even opposite mechanisms involved.
Ang II plays its biological roles through two receptors, designated as AT1 and AT2 receptors. AT1 and AT2 receptors of Ang II are both expressed in skin, suggesting that skin is not only a source of Ang II but also a target organ. 35 Ang II is known to stimulate fibrous tissue formation and coronary matrix remodelling by promoting TGF-β synthesis via AT1 receptors. 36 AT2 receptor stimulation counteracts AT1 receptor activation, and the effect of Ang II is regulated by the interaction of AT1 and AT2 receptor–mediated signalling in various target tissues.37,38 Consequently, in skin tissues and fibroblasts expressing both AT1 and AT2 receptors, Ang II may establish its own regulatory system through these two receptor subtypes. This study demonstrated that losartan, an AT1 receptor inhibitor, decreased TGF-β, TIMP-1, PICP and PIIINP expressions in diabetic skin fibroblasts, while AT2 receptor did not show any effect in the process. These results suggest that Ang II regulates collagen metabolism in skin fibroblasts at least in part due to the inhibition of collagen degradation via the increase in TIMP-1 expression, and this effect is mediated through AT1 receptor stimulation, independent of AT2 receptor.
All taken together, abnormal collagen synthesis and degradation play important roles in ECM metabolism and structure changes of diabetic skin tissues. Ang II, as a kind of fibrogenic factor, influences TGF-β-mediating MMP-1/TIMP-1 balance in collagen metabolism mediated by AT1 receptor. An imbalance between the expressions of MMP-1 and TIMP-1, caused primarily by an increase in TIMP-1 activity, may contribute to the pathogenesis of diabetic skin tissues.
Footnotes
Acknowledgements
Meng Ren and Shaoyun Hao contributed equally to this work.
Conflict of interest
The authors declare that no conflicts of interest exist.
Funding
This work was supported by grants from the National Natural Science Foundation of China (81070660, 81000317, 81170766) and Research Fund for the Doctoral Program and for the New Teacher Program of Higher Education of China (20100171110069, 20100171120080).