
Abstract
Introduction
Beyond increased weight, abdominal obesity is a key feature in cardiovascular (CV) risk assessment. It is an essential component of the Metabolic Syndrome (MetS), which is a cluster of metabolic and clinical abnormalities associated with visceral fat hypertrophy and insulin resistance. 1 Lipid abnormalities associated with MetS typically include a high level of plasma triglycerides (TG) and a low high-density lipoprotein (HDL)-cholesterol plasma level. MetS has also been associated with HDL and low-density lipoprotein (LDL) subfraction distribution changes characterised by an increased content of small, dense LDL and HDL.2–4 Few studies have specifically analysed the relationship between abdominal obesity and the distribution of HDL and LDL subfractions.5–7
The aim of our study was to determine the influence of visceral fat hypertrophy, assessed by waist circumference (WC), on the distribution of HDL and LDL particles in overweight patients with abdominal obesity and no lipid-lowering treatment.
Methods
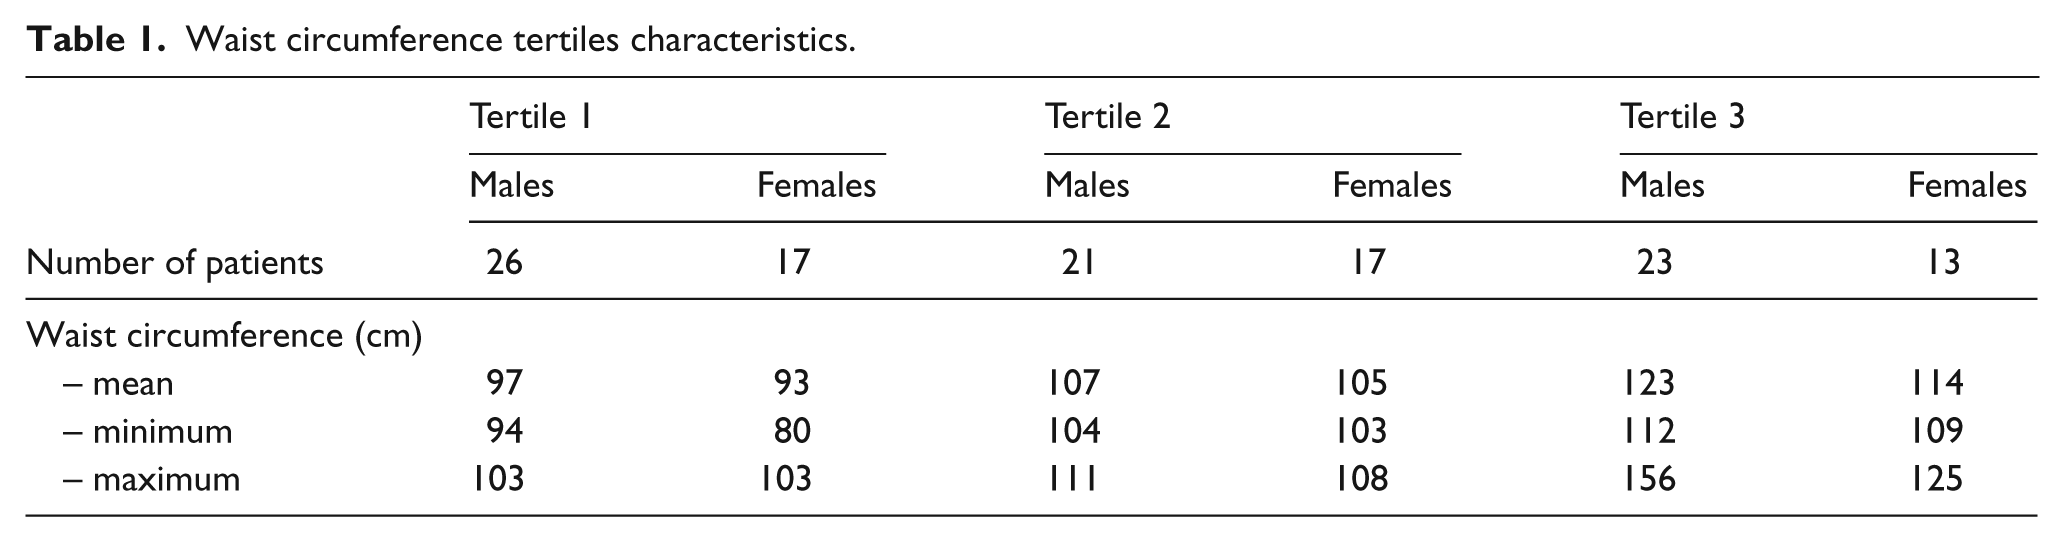
Patients were recruited at our CV prevention clinic (Hôpital de la Pitié-Salpêtrière, Paris, France). Patients were included if they combined overweight (i.e. with a body mass index (BMI) > 25 kg/m2), an increased WC (higher than 94 cm for males and higher than 80 cm for women) and one or more CV risk factors. Tertiles were chosen to divide our population into three groups according to their level of increased WC. Several tertiles characteristics are shown in Table 1. The other inclusion criteria consisted of having at least one CV risk factor from among the following: hypertension, dyslipidaemia, diabetes mellitus, current smoking, and age > 60 years for females or > 50 years for males. Arterial hypertension was considered present when measurement of arterial blood pressure exceeded 140 mm Hg (systolic) and/or 90 mm Hg (diastolic) on at least two different occasions, or if the patient was on antihypertensive medication. Dyslipidaemia was defined as a total serum cholesterol level of > 5 mmol/L, serum HDL-cholesterol level of < 1 mmol/L, or serum triglyceride level of > 2 mmol/L. Diabetes mellitus was defined by fasting blood sugar levels > 125 mg/dl or HbA1C > 6.5%. In addition, the presence of diabetes mellitus was assumed if the patient was taking any anti-diabetic treatment. Patients taking a lipid-lowering therapy (statins, fibrates, nicotinic acid or cholestyramine) were excluded from the analysis. All patients underwent evaluation of their CV risk with complete clinical examination and biological profile assessment. They all signed an informed consent. The presence or absence of MetS was defined according to NCEP ATP III guidelines. 1 Cigarette smoking was evaluated as a binary variable: current smoking or non-smoking.
Waist circumference tertiles characteristics.
Three groups of patients were distinguished with respect to their alcohol daily intake: abstention or low alcohol intake (< 10 g/day); moderate consumption (10–30 g/day) and elevated consumption (> 30 g/day). Information on cigarette smoking and alcohol consumption was obtained by physician-guided completion of a questionnaire. BMI was defined as weight (in kilograms) divided by the square of height (in metres). WC was measured at a level midway between the lower rib margin and the iliac crest with the subject standing and wearing only underwear. Overweight patients were defined by a calculated BMI strictly between 25 and 30 kg/m2, and obese patients were identified by a calculated BMI ≥ 30 kg/m2. All patients underwent blood pressure monitoring on their right or left arm at rest for 10 min.
Biochemical measurements
Fasting venous blood samples were drawn on tubes without any anticoagulant and on tubes containing EDTA (final concentration: 1 mg/ml) from the ante-cubital vein of each subject after a 12 h fast. All analyses were performed within 3 h of blood sampling following centrifugal isolation of plasma. Total cholesterol (TC) 8 and TG 9 concentrations were determined by an automated enzymatic method (Konelab, Thermoclinical Labsystems, Cergy Pontoise, France and Biomerieux, Marcy L’Etoile, France, respectively). HDL-cholesterol (HDL-C) was determined by a direct method (Konelab) as recommended by ARCOL. 10 LDL-cholesterol (LDL-C) was calculated using Friedewald’s equation if TG ≤ 340 mg/dl (3.9 mmol/L) or directly measured 11 when TG > 340 mg/dl (3.9 mmol/L) to 700 mg/dl (8 mmol/L) TG, using a Konelab kit. Blood samples were taken for analysis of complete blood count, potassium, uraemia, creatinine, uric acid, liver enzymes, fasting glucose and fasting insulin level and HbA1C. The Homeostasis Model Assessment index (HOMA) was calculated by dividing by 22.5 the product of fasting glucose (expressed as mmol/L) and fasting insulin (expressed as mIU/L).
The distribution of serum LDL 12 and HDL 13 subclasses was determined by gradient gel electrophoresis. Lipoproteins were isolated from 3 ml serum. After serum density adjustment to 1.019 g/ml with potassium bromide, (VLDL+IDL) lipoproteins were obtained by ultracentrifugation at 90,000 rpm (560,196 g) for 4 h at 10°C (NVT rotor Beckman XL 90). After removing the upper layer, the density of the lower layer was adjusted to 1.21 g/ml, followed by a second ultracentrifugation step at 90,000 rpm (560,196 g) for 4 h at 10°C. The upper layer (density < 1.21 g/ml) contained LDL+HDL lipoproteins. LDL and HDL size was then determined by electrophoresis (70 V for 1 h then 180 V for 24 h) in a non-denaturing polyacrylamide gradient gel (Spiragel 1.5–25%, Lara-Spiragel, Couternon, France) using Tris/boric acid/NaN3 buffer (pH 8.3). Markers of known molecular weight, i.e. thyroglobulin, ferritin, catalase, lacticodehydrogenase, albumin (High Molecular Weight Calibration Kit for native electrophoresis, Amersham Biosciences) were run simultaneously with lipoproteins isolated from the MetS patients and from a normolipidaemic healthy donor, in order to determine reproducibility. Gels were fixed and stained with Coomassie Brillant Blue G250/perchloric acid for 2 h, and destained with acetic acid-ethanol for at least 24 h, and finally scanned with an optical densitometer (Sebia-Hyris 2, Evry, France). The mean apparent diameters of the isolated lipoprotein subfractions were determined by comparison with calibration curves constructed with proteins of known Stokes diameters (High Molecular Weight Protein calibration kit; Pharmacia, Uppsala, Sweden). The calibration curve was constructed with albumin (7.1 nm), lactate dehydrogenase (8.16 nm), ferritin (12.2 nm) and thyroglobulin (17 nm).
To calculate the percentage distribution of LDL and HDL subclasses, areas under the scan curves were integrated within the size limits, on a HYRYS densitometer (Sebia) at 570 nm, and by relating them to the total area considered as 100% of LDL or HDL, respectively. The usual distribution of the LDL subclasses measured in 63 healthy subjects in our laboratory, were as follows: 10–16% LDL-1 (28.5–27.0 nm), 30–50% LDL-2 (27.0–25.5 nm), 30–50% LDL-3 (25.5–24.2 nm), 6–12% LDL-4 (24.2–22.0 nm) and major LDL peak (25–25.98 nm). In these subjects, the major LDL peak was 25.0–25.98 nm (coefficient of variation: 0.24%). Classically a major peak of LDL diameter < 25.5 nm identifies an atherogenic phenotype. 14 The normal ranges for HDL subfractions were: 18–30% HDL2b (12.9–9.71 nm), 18–32% HDL2a (9.71–8.77 nm), 20–42% HDL3a (8.77–8.17 nm), 7–15% HDL3b (8.17–7.76 nm) and 4–10% HDL3c (7.76–7.21 nm). The coefficients of variation for these determinations were between 6.8–11.0% for LDL subfractions and between 4.3–10.4% for HDL subfractions.
Statistical analysis
Results were expressed as mean and SD for continuous variables and as number and percentage (%) for qualitative variables. Distribution of triglycerides was non-normal and this variable was log transformed. Correlation coefficients were Pearson coefficients. We performed analysis of variance (ANOVA) in order to compare means between LDL and HDL subclasses. Statistical analyses were carried out with the use of Statistica software commercialised by Statsoft. For univariate analysis, logarithms of triglycerides and HOMA index were used.
Multiple regressions were used in order to determine the variables which remained related to dependent variables, i.e. HDL3c and LDL4. Only variables with p < 0.1 were included in the regression. Therefore, variables included into the multivariate analyses were WC, gender, fasting glucose level, triglycerides log, HOMA index log, HDL-c for LDL4, and WC, gender, fasting glucose level, triglycerides log and HOMA index log for HDL3c. Statistical differences were considered significant when p was < 0.05.
Results
Characteristics of the population
A total of 117 patients were included in the study. Clinical and biological characteristics are shown in Table 2. The mean age of this population was 51 years and 59% of patients were men. As indicated, our population was characterised by abdominal obesity. According to the NCEP ATP III criteria of MetS, 92 (78.6%) of our patients presented with MetS, and among these 57 (62%) were men and 35 (38%) were women. When compared with patients without MetS, those with MetS were characterised by significantly increased age, weight, WC, systolic and diastolic blood pressure. As for lipid parameters, there was no significant difference between the two groups, except for TG which were higher in patients with MetS. After adjustment for age and gender, weight (p = 0.002), BMI (p = 0.048), HbA1C (p = 0.004) and logarithm of HOMA index (p = 0.03) but not insulinaemia were still significantly different between MetS subject and non-MetS subjects. In the whole population, 40% of men and 50% of women presented with treated hypertension. Overall, 22% of men and 15% of women were treated for diabetes mellitus. When compared with females, male patients were characterised by a superior weight and waist circumference, increased blood pressure, higher total cholesterol and lower HDL-C.
Population characteristics.
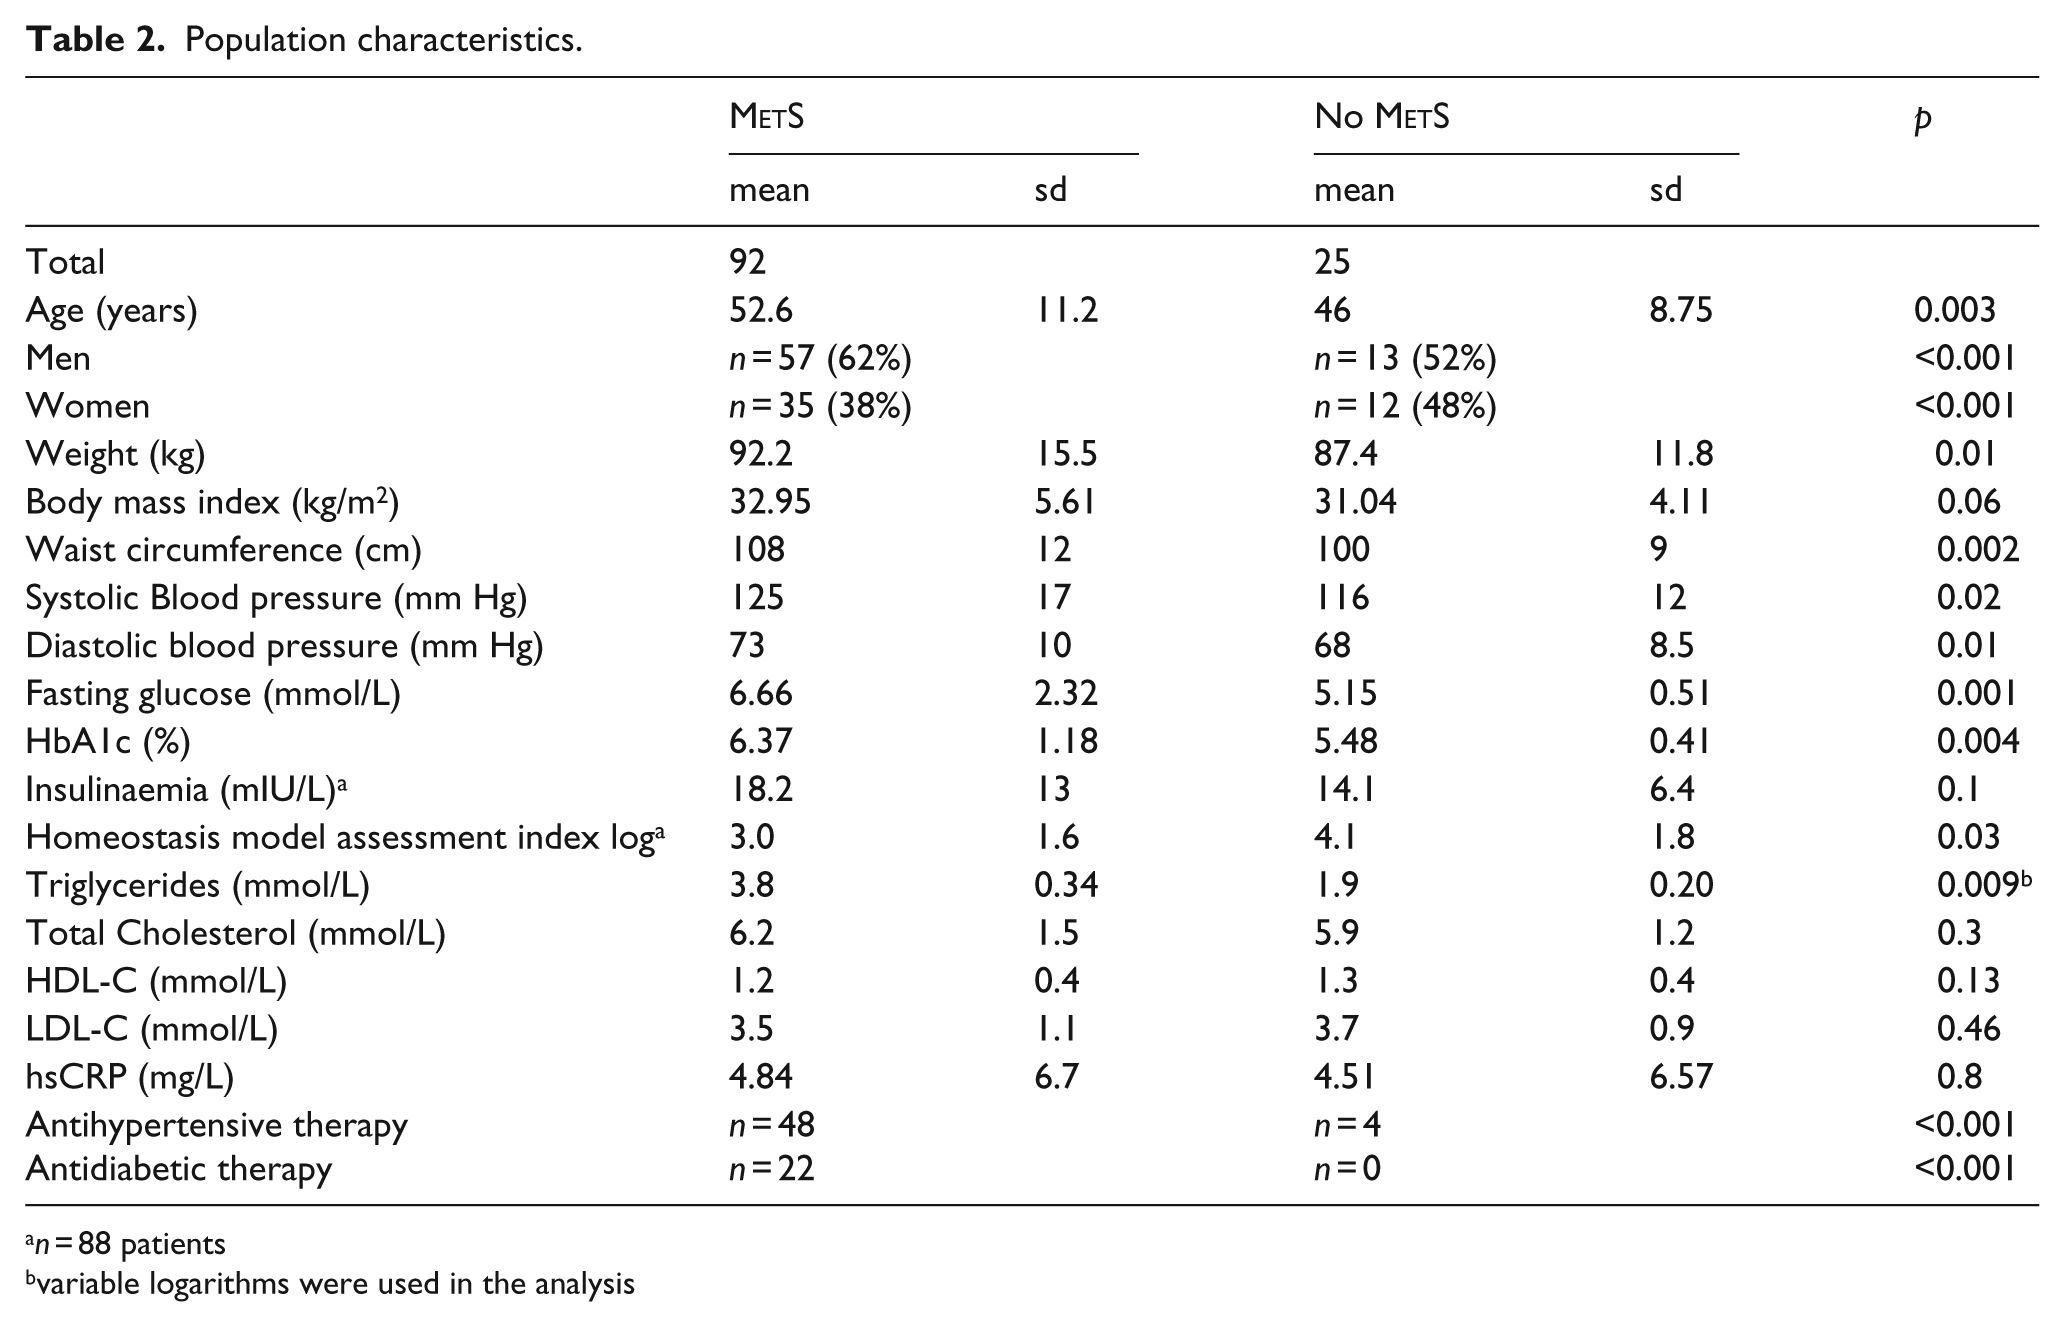
n = 88 patients
variable logarithms were used in the analysis
Seven patients were recorded as having high alcohol consumption. Their mean HDL-c was 1.4 ± 0.5 mmol/L. This was not significantly different from the two other groups (p = 0.58 by ANOVA testing). The global HDL subfractions repartition was not different between the three alcohol intake groups. Waist circumference did not differ between the three groups.
HDL subfractions and WC
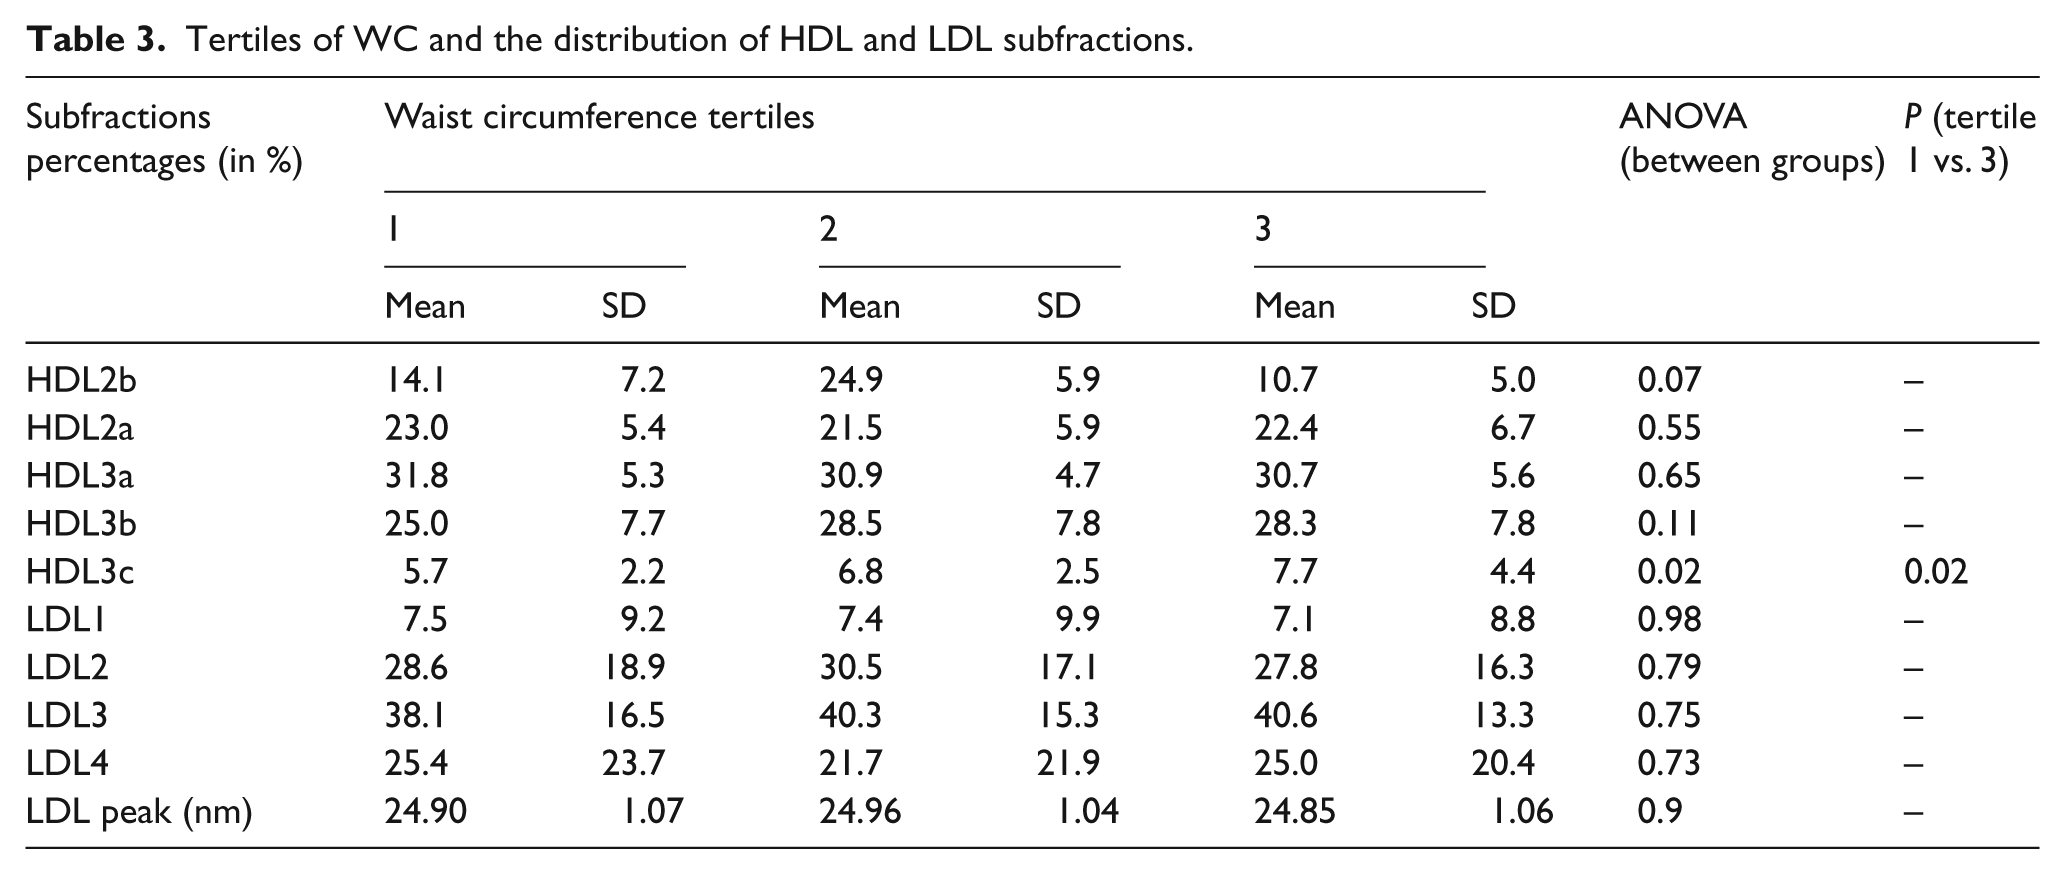
Our results revealed that the distribution in HDL subfractions substantially differed according to tertiles of WC (Table 3). The content of HDL3c increased and the content of HDL3b decreased with the increase in WC. Patients in the highest WC tertile had 7.7% of HDL3c against 5.7% (p = 0.02) in the lowest tertile and 6.8% in the intermediate one. HDL2b percentages in the lowest, intermediate and highest tertile, respectively, were 14.1%, 12.2% and 10.7% (p = 0.065).
Tertiles of WC and the distribution of HDL and LDL subfractions.
Univariate analysis of correlation factors associated with HDL3c and LDL4.
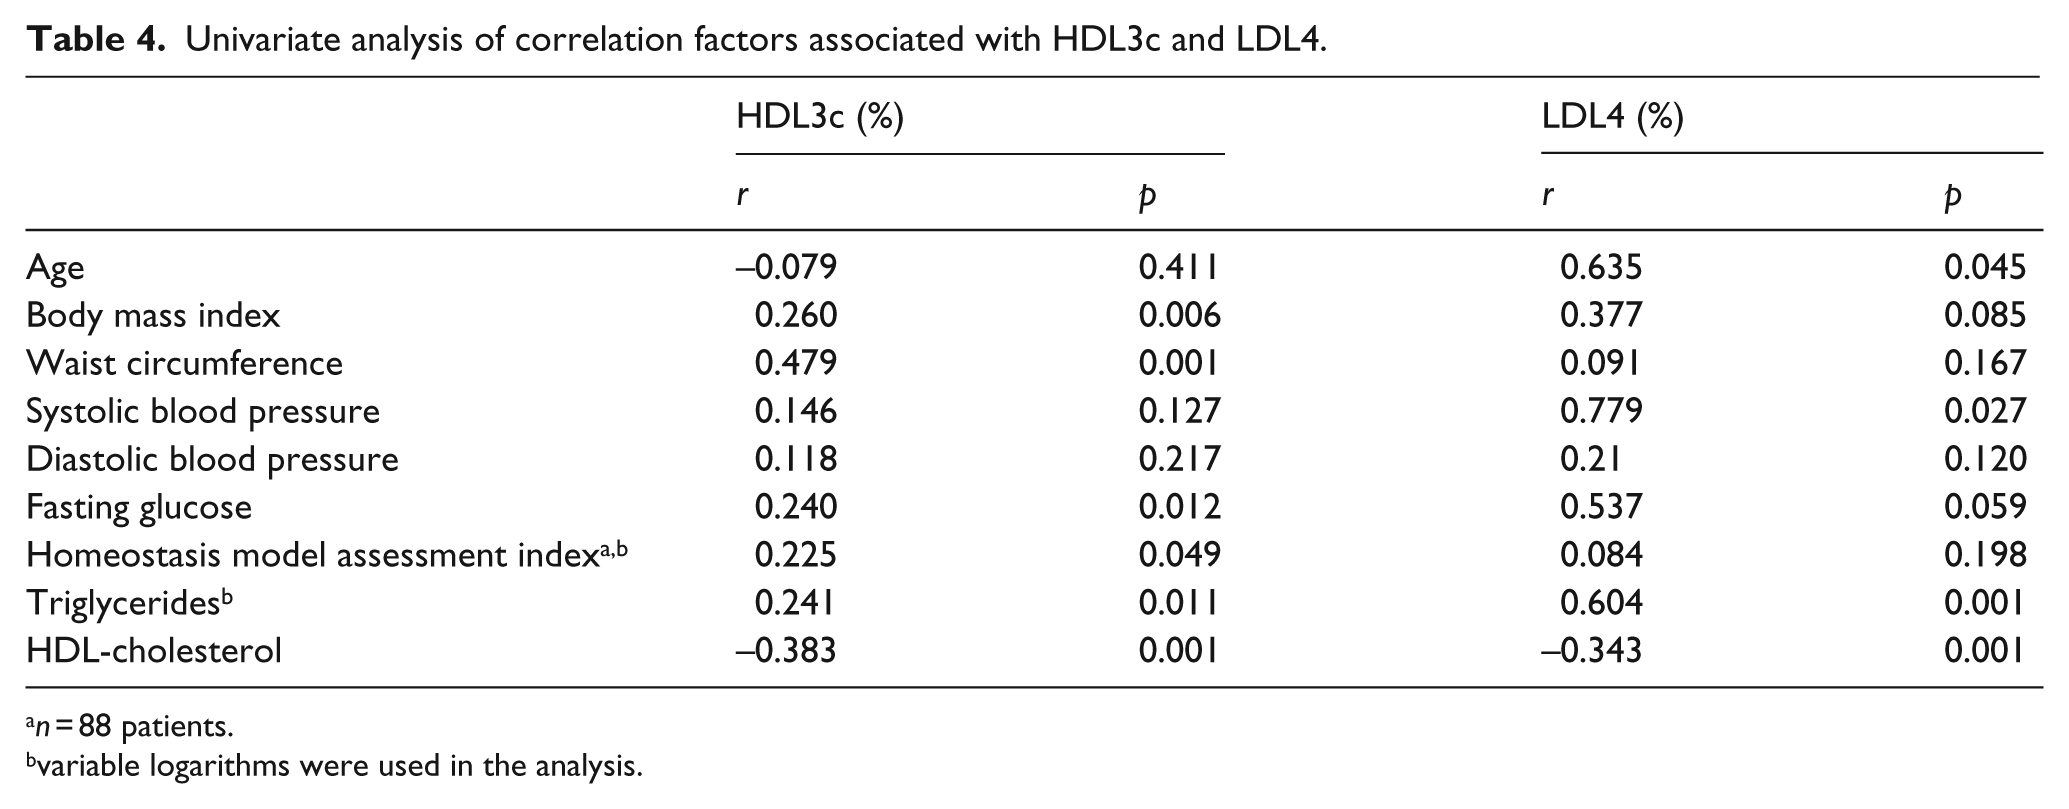
n = 88 patients.
variable logarithms were used in the analysis.
In univariate analysis (Table 4), HDL3c content was correlated to BMI (r = 0.260, p = 0.06), TG levels (r = 0.241, p = 0.011), HDL-C (r = −0.383, p < 0.001), HOMA, (r = 0.225, p = 0.049) and fasting blood glucose (r = 0.240, p = 0.012). However, the strongest correlation was found with WC (r = 0.479; p < 0.001). There was no influence of age or blood pressure on HDL3c content. In the multivariate analysis, only two factors remained independent predictors of the HDL3c percentages: plasma TG levels (beta = 0.33, p < 0.01) and WC (beta = 0.23, p = 0.04). We analysed the subgroup of female patients, where we found that HDL3c was not significantly associated with WC. However, in males, HDL3c was still significantly correlated with WC (r = 0.4, p < 0.01).
LDL subfractions and WC
The distribution of the four LDL subfractions did not significantly differ between the three tertiles of WC. Consistently, the diameter of the LDL peak did not reveal any significant difference between the three tertiles (Table 3). In univariate analysis, the content of the smallest LDL4 particles was strongly positively correlated to plasma TG levels (r = 0.604, p < 0.001) and negatively related to HDL-C (r = −0.343, p < 0.001). However, no relationship was established between the percentage of LDL4 and age, weight, WC, blood pressure, HOMA, or fasting glucose level (Table 4).
In multivariate analysis, only TG levels remained a significant determinant of the percentage of the LDL4 subfraction, with a beta = −0.1, p < 0.01 and r = 0.48. WC had no influence on the LDL4 levels expressed as percentage. Similar results were seen in the subgroup of male patients but not in females.
Influence of MetS
The distribution of HDL and LDL subfractions was then studied according to the presence of MetS as defined by NCEP ATP III. 1 In patients with MetS, a shift towards the smallest HDL and LDL particles was observed.
The peak of the LDL diameter was significantly lower in patients with MetS as compared with patients without MetS (24.7 vs. 25.5 nm, p = 0.01), and there was a significant decrease of LDL2 (39.2 vs. 26.2%, p < 0.001) and an increase in LDL4 (26.2 vs. 14.7%, p = 0.016). LDL1 and LDL3 were not significantly different depending on the presence of MetS.
We observed a significant increase of HDL3c (5% vs. 7.2%, p = 0.002). There was a trend towards a decrease content of HDL3a and an increased percentage of HDL3b (p = 0.06) but no difference for HDL2a or HDL2b.
Discussion
Our data established the direct influence of WC on the HDL3c content in a population of overweight patients with increased visceral fat without the possible interference of lipid-lowering treatment. We observed that WC is strong determinant of HDL3 levels in both univariate and multivariate analysis. In contrast, LDL4 levels were driven by TG levels only.
Affecting more than 300 million people worldwide, obesity is a growing epidemic, especially in Western society. In the INTERHEART study, 15 abdominal obesity has been shown to be an independent CV risk factor. In this study, the waist-to-hip ratio was a strong and independent factor associated with the risk of developing cardiovascular disease (CVD). Mechanisms underlying the increased CVD risk in patients with abdominal obesity are not clearly understood.
The aggregation of lipoprotein abnormalities that includes elevated serum TG, increased small LDL particles, and a reduced level of HDL-cholesterol has been linked to increased atherosclerosis. 2 This pattern has also been associated with reduced HDL particle size. 3 In addition to elevated HDL3b and decreased HDL2b, increased HDL3c levels have been associated with an increased CVD risk in two angiographic case-control studies.16,17 Furthermore, recent works have shown that HDL3c particles in patients with MetS (and therefore with an increased WC) were dysfunctional and had a reduced anti-oxidative activity. 18 Taken together, these results suggest a HDL subfraction-mediated relationship between WC and CVD.
A shift in the distribution of HDL subfractions has already been observed in some populations. For example, diabetic patients exhibited decreased concentrations of HDL-C with lower levels of large HDL particles (HDL2) and higher levels of small HDL particles (HDL3). Similar observations have been made in obese patients and in patients with MetS or with insulin-resistant state. 19 Our findings are consistent with previous work studying lipoparticle concentrations, as assessed by nuclear magnetic resonance technology, in correlation with insulin sensitivity. In this non-Caucasian population, the concentrations of HDL-C, HDL particles, and large HDL particles and HDL size decreased across categories of increasing glucose intolerance. 7 These pathological disorders are commonly associated with abdominal fat hypertrophy, and WC is the best clinical parameter routinely used to assess it. Furthermore, in Mexican adolescents, HDL subclass distribution was reported to be independently associated with WC. 5 In South Indian Asian women, small and dense subclasses of HDL were associated with higher levels of insulin resistance but not with WC. 6 Other explanations for variations in HDL levels have been proposed; for example, low HDL-C levels have been described in correlation with the K219 allele, a genetic variant of ABCA1 with a frequency which markedly differs between blacks and whites, and which modulates the association between age and HDL-cholesterol, as well as body fatness and triglycerides in a beneficial manner in whites versus young blacks. 20 Also, significant correlations between low HDL-C levels with Helicobacter pylori infection were found in Japanese males. 21 Also, studies have identified a link between HDL size and adiposity markers such as WC or visceral fat assessed by computed tomography. 22
Our results extend these previous findings in well-phenotyped, overweight, lipid-lowering treatment-free patients with abdominal obesity. In this specific population already characterised by an increased content of small and dense HDL particles, our data reinforce the direct relationship between WC and HDL size. Furthermore, when taken into account in multivariate analysis, insulin resistance parameters such as HOMA index maintained the independent relationship between WC and HDL3c.
Concerning LDL, our data showed that only TG remained independently associated with LDL4. This is consistent with several previous studies23–25 that have shown that WC is a predictor of an increased content of smaller and denser LDL particles (i.e. LDL3 and LDL4) but, as in our results, multivariate analysis showed no independent correlations between WC and LDL4.
The relationship between an elevated TG concentration and an increased percentage of small and dense lipoproteins may be partially explained by enzymatic mechanisms. The large amount of VLDL enhances the enzymatic activity of the cholesterol ester transfer protein (CETP). This favours the formation of TG-rich HDL and LDL, which are favourite substrates for hepatic lipase, an enzyme that hydrolyses these lipoproteins into small, dense and TG-poor HDL and LDL.26,27 Such mechanisms have already been described in obese patients. 28 However, in our study, the influence of WC on the HDL3c sub fraction was independent of TG concentration. The increased concentration of plasma free fatty acids due to visceral fat hypertrophy may also lead to reduced VLDL clearance and enhanced CETP activity and thus to the formation of small, dense HDL such as HDL3c. 19
Another possible explanation involves adipokines. Among them, adiponectin has been demonstrated to be inversely correlated to visceral fat hypertrophy and inflammatory markers,29,30 and decrease of adiponectin concentrations has been associated with both increased hepatic lipase activity and enhanced HDL3 concentrations. 31 Moreover, some studies on the distribution of HDL subfractions have shown an inverse relation between adiponectin and small and dense lipoprotein subclasses. 32
Our study has strengths and limitations. First of all, this is a cross-sectional study on a rather small but very well-characterised group of patients. Some insulin data were missing and therefore we were only to able calculate the HOMA index for 88 patients. This weakens the evaluation of the insulin-resistant state of our population. The lack of correlation observed in female patients may be explained by their relatively small number, the lack of data on menopausal status or other metabolic interactions involving oestrogens or different fat deposition phenotypes. We did not report physical activity, which is a key feature in HDL regulation, but our inclusion criteria had already selected a sedentary population with no regular physical activity.
The strength of the study is the inclusion of patients without lipid-lowering treatment and on a stable diet. Complementary works more accurately assessing the relationships between WC, weight loss, adipokines and HDL subfraction profile are needed to understand the physiology behind the changes of HDL-cholesterol distribution and the role of abdominal fat hypertrophy, as reflected by WC, on CVD risk.
Conclusion
In our population of obese patients, WC is a strong and independent determinant of a shift in the distribution of HDL toward denser particles. The mechanisms linking WC and HDL3c cannot be accounted for by insulin resistance status.
Footnotes
Funding
This research received no specific grant from any funding agency in the public, commercial or no-for-profit sector.
Conflict of interest statement
None declared.