
Abstract
Employment is essential for reducing recidivism. Accurately reporting employability post-release from prison figures is important for understanding real trends in data. This paper examines the impact of statistical reporting methods on the interpretation of employment data for individuals released from prison. By analysing the Ministry of Justice’s (MoJ) reporting practices, we highlight how the use of percentage-of-percentages can distort the true picture of employment outcomes. We argue that such methods exaggerate small changes and obscure real trends, leading to potential misallocation of resources and misguided policy decisions. We recommend a shift towards reporting raw values, percentage points and enhanced visualisation of the data to provide a clearer, more accurate representation of employment. This approach will enhance transparency and support more effective policymaking aimed at reducing recidivism through improved employment opportunities for people post-release.
The Problem of (Misleading) Percentages: How Misreporting Skews Insights
My Lords, I am pleased to say that the rate of prison leavers in employment six months after release almost doubled in the two years to March 2023, from 14% to over 30%.
Reducing recidivism is a core objective for practitioners within the criminal justice system (McGuire, 1999, 2013) and is key a priority for His Majesty’s Probation and Prison Service ‘HMPPS’ (MoJ, 2010, 2023c). One way to effectively reduce the likelihood of reoffending is to find employment opportunities (Brunton-Smith and Hopkins, 2013; May et al., 2008; Schnepel, 2018; Skardhamar and Telle, 2012). A longitudinal Surveying Prisoner Crime Reduction (SPCR) cohort study of 1435 newly sentenced (in 2005 and 2006) prisoners from England and Wales found that 68% of newly imprisoned individuals felt that employment would help them to stop reoffending (Hopkins, 2012).
As of April 2024, over twelve and a half million people living in United Kingdom ‘UK’ had a criminal record (Unlock, 2024). Employability for those with a criminal record is a timely issue in the UK, with more people than ever before being incarcerated (Porter and McCartan, 2024). Employment influences more than just the criminal justice system, with economic and workforce implications (Bumiller, 2015). Unsurprisingly, the Ministry of Justice ‘MoJ’ supports the assumption that employment is necessary for re-integration. This is because securing employment post-release significantly reduces the likelihood of reoffending. Prisoners who found stable jobs were less likely to reoffend within a year compared to those who remained unemployed (May et al., 2008).
The importance of regular working hours, vocational training and effective skills provision was highlighted in the Government green paper Breaking the cycle: effective punishment, rehabilitation and sentencing of offenders (MoJ, 2010), and the consultation paper Making prisons work: skills for rehabilitation (Department for Business, Innovation and Skills (BIS) and MoJ, 2011). These papers emphasised the importance of strategies designed to provide prisoners with the vocational and employability skills they need to help them find employment when released from prison. This included a commitment to improve the careers advice available to prisoners that reported needing help with employment and maintaining this support on release from prison. At the same time, breaking the cycle introduced working prisons, where prisoners would undertake a full working week, supported by education programmes aimed at providing work-based skills (MoJ, 2010). The move towards providing work while in prison appeared somewhat effective. Those individuals who were involved in work during their sentence were more likely to have secured employment since release (Brunton-Smith and Hopkins, 2014).
Employment has been viewed as more that a vehicle for reducing reoffending. The Transforming Rehabilitation strategy (MoJ, 2013) pointed to employment needs as one of offenders’ ‘life management’ issues that need to be tackled. The focus on work experience while in prison appears promising. More recently, the MoJ (2022) has focused on prison initiatives to support prisoners to learn more about navigating the job market, through learning more about CV writing, application forms, and where to seek employment support in the community. Employment Hubs were set up as the first, dedicated spaces in prisons where HMPPS staff, partners, and prisoners can focus solely on employment.
The New Futures Network has been created as a specialist part of HMPPS in England and Wales. Its primary mission is to facilitate partnerships between prisons and employers to help prison leavers secure employment upon release. Part of this involves creating support for employers seeking to hire those with a criminal record (New Futures Network, 2023).
Employment Reduces Reoffending
Employment plays a crucial role in reducing recidivism by providing routine, financial stability, and social integration, which help foster positive identity transformation and encourage long-term behavioural change. According to desistance literature, employment offers greater benefits than offending (Becker, 1968; Merton, 1938), builds stronger social ties (Sutherland and Cressey, 1978) and creates opportunities for change (Uggen and Staff, 2001), serving as a protective factor against reoffending (Willis et al., 2020). Despite the complex relationship between employment and desistance from crime, most researchers agree that employment significantly reduces the likelihood of reoffending (Blomberg et al., 2011; Denver et al., 2017; Willis et al., 2010). Even short-term contracts reduce reoffending after prison sentences (Uggen and Staff, 2001; van den Berg et al., 2014). Employment can serve as a turning point, particularly for adult offenders (Abeling-Judge, 2021; Copp et al., 2020), while those unable to secure employment, especially within a year post-conviction, are more likely to reoffend (Nally et al., 2014). However, barriers persist, as many potential employers are reluctant to hire individuals with criminal records (Porter et al., 2023, 2025).
As a result of employment being a likely factor in reducing recidivism, governmental bodies have tried to improve employment prospects. However, real change is difficult and should be measured appropriately. When asked at interview in the months after release, only 28% of individuals reported that they were either working or had been in paid work (excluding casual or cash-in-hand work) since leaving prison (Brunton-Smith and Hopkins, 2014). This was similar to the proportion of people who reported having a job to go to on release (29%). Later research suggested that this figure could be lower, with only 17% of prison leavers being employed within a year after release (House of Commons Education Committee, 2022).
Understanding employability is only achievable when the correct statistics and interpretations are applied. This paper will use the example of percentage-of-percentages to demonstrate why reporting statistics inappropriately can be problematic. In the example below, we explain why you should not convert already transformed data (i.e. percentages) into newly transformed data (i.e. percentages-of-percentages). We will demonstrate these interpretations are problematic using the 6 weeks and 6 months post-release reported employment statistics.
The MoJ Data
This section focuses on the MoJ (2023a) statistical release, and how the data are presented. To do this, we consider the language used and the framing of the data, which can lead to misleading metrics and inflated reporting. Namely, misleading metrics involves the use of inappropriate or overly complex metrics that may confuse or mislead readers about real-world significance. Inflated reporting refers to exaggerating results by reporting relative percentages instead of absolute or direct changes to make the findings seem more impactful.
The proportion of persons released from custody who were employed at 6 weeks from their release rose by 4.5 percentage points to 19.4% between April 2022 and March 2023. This is an increase of 30.2%.
The MoJ (2023a) reported that in April 2022, there were 487 individuals (14.9%) in employment 6 weeks from their release. This increased to 640 individuals (19.4%) in employment by March 2023, which is an additional 153 people who have gained employment. They claim that this is a 30.2% increase, presumably the increase that Lord Bellamy referred to. However, this change reflects only a +4.5 percentage points (pp.) increase in employability at the 6-week post-release mark. This is explained more in the 2-year example below.
Across a two-year period, from April 2021 to March 2023, the proportion of persons released from custody who were employed at 6 weeks from their release rose by 9.6 percentage points. This is an increase of 98.0%.
During the 2-year period, the same statistical inferences are made. The MoJ (2023a) reports a 98.0% increase, when in fact the more accurate figure is the much smaller +9.6 pp. increase. This is because the percentage of individuals employed in April 2021 (9.8%) and March 2023 (19.4%) includes data which is already transformed into percentages (for their specific cohorts). To assess this difference the way we have, you simply subtract the two percentage values. These findings could have been reported directly by stating the exact number of people employed, or by specifying exactly how many more people who were employed between these monthly comparisons.
6-Months Employment Figures
Within the 6 months post-release figures of the MoJ (2023a) statistical release and their later press report, we have found similar misleading reporting standards.
The proportion of persons released from custody who were employed at 6 months from their release rose by 7.2 percentage points to 30.4% between April 2022 and March 2023. This is an increase of 31.0%.
When we examine the 6 months release mark for April 2022 and March 2023 we find a +7.2 pp. increase in employability. This is because in April 2022, there were 573 individuals in employment (23.2%) 6 months from their release. This increased to 715 individuals in employment (30.4%) by March 2023, an additional 142 employees in work. These data were used to support a press release comparing April 2021 (which had 394 individuals employed, 14.1%) and March 2023 (which had 715 individuals employed, 30.4%) which they report as a 116% increase.
116% rise in ex-offenders finding jobs within 6 months
It would be more accurate to report this as a +16.3 pp. increase over a 2-year period. Below we will explain why the methods the MoJ (2023a) use in their reporting are misleading.
Across a two-year period, from April 2021 to March 2023, the proportion of persons released from custody who were employed at 6 months from their release rose by 16.3 percentage points. This has more than doubled (an increase of 115.6%).
Changes in Reporting Standards – 2024
In 2024, the MoJ changed its methods of reporting. Below we will use the extracts for the 6-weeks and 6-months post-release figures and compare them to the previously reported method to highlight why this might also be misleading for some readers.
In the year to March 2024, 19.3% of offenders were employed at 6 weeks post release from custody (excluding those who are unavailable for work, or those whose employment status is unknown).
This is an increase of 1.9 percentage points from 17.4% in the 2022/23 performance year.
In the 2023 statistics release, the MoJ 6-weeks post-release figure reported was for the end month (i.e. March 2023, 19.4%). With this old reporting method, in March 2024, the figure reported would have been 17.4%, indicating a drop in employment (−2.0 pp.).
In contrast, the latest statistics from Offender Employment Outcomes (MoJ, 2024) as seen above, were reported using the weighted average percentage 1 showing 17.4% during the period April 2022 to March 2023 and 19.3% during the period April 2023 to March 2024. In contrast to the pre-2024 approach, this new method instead shows employability has improved (+1.9 pp.). To clarify, in 2023 the MoJ report used the final month figure only and in 2024 the 12-month weighted percentage average was used, resulting in the discrepancy. Now let us examine the 6-months release reporting:
In the year to March 2024, 31.1% of offenders were employed at 6 months post-release from custody (excluding those who are unavailable for work, or those whose employment status is unknown). This is an increase of 5.2 percentage points from 25.9% in the 2022/23 performance year.
In the 2023 statistics release, the government statistics 6-month post-release figure reported was for the end month figure (i.e. March 2023, 30.4%). With this old reporting method, in March 2024 the figure reported would have been 29.4%, indicating again, a slight drop in employment (−1.0pp.). However, using the new method, the latest statistics from Offender Employment Outcomes (MoJ, 2024) as seen above, were reported using the weighted average percentages showing 25.9% employment during the period April 2022 to March 2023 and 31.1% during the period April 2023 to March 2024. This method instead makes it appear as if employability has improved (+5.2 pp.). In sum, using this new approach, the data appear to show a marked improvement in post-release employment, which contrasts the slight decline shown under the previous reporting approach (i.e. new = +5.2pp. vs old = −1.0 pp.).
While we view the MoJ’s (2023a) shift from reporting percentage-of-a-percentage changes to percentage point changes (MoJ, 2024) as a positive development, we find the additional change in reporting standards – moving from end-of-month employment percentage figures to a weighted average percentage across the period – problematic. Although these might appear as only slight changes in the style of presenting the statistics, this creates an inconsistency in how the figures are reported and understood. This shift can obscure short-term fluctuations and trends, making it harder to assess the immediate impact of policy changes or comparing figures to past reports on employment. In addition, it creates an inconsistency in how the figures are understood by readers, policymakers, and other stakeholders.
Statistical Appropriateness
The MoJ’s shift towards reporting only percentage points is a step in the right direction, nevertheless the continued use of percentages for employment figures remains problematic. We provide a detailed explanation of the issues and limitations of the reporting practices adopted by the MoJ, particularly highlighting why converting a difference in percentage points to a percentage-of-a-percentage difference is inappropriate and can lead to misinterpretation and confusion.
To explain why we contend that presenting the figures as has been done pre-2024, we overview the methods the MoJ used, and the problems associated with their reporting of change. The formula applied to the reports up until 2023 has been that of percentage change:
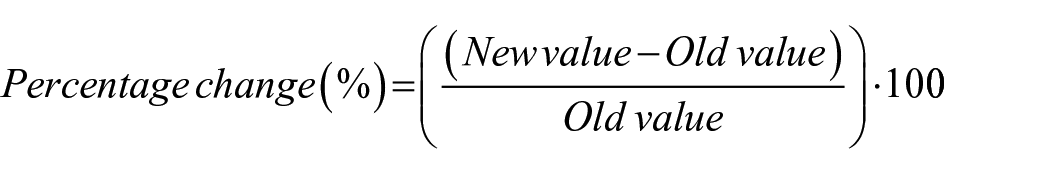
However, the MoJ does not use the raw values when computing change but instead rely on the percentage employed (%) for each period. This effectively turns the metric intro a percentage-of-a-percentage change.
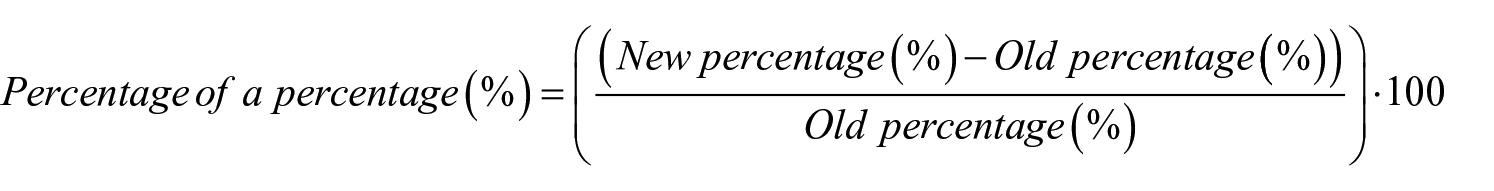
Using this second formula, the MoJ derives their figure of 30.2% improvement in employment for 6-weeks post-release between April 2022 and March 2023, ((19.4%-14.9%)/14.9%)*100 = 30.2%. Typically, this calculation is performed using the raw numbers (formula 1) not percentages (formula 2), as the latter add needless complexities and ambiguity to the interpretation. Specifically, as the underlying cohorts (i.e. number of individuals) will differ from period-to-period, the percentages will not be equitable between cohorts. We will consider some of these potential misinterpretations below.
Magnitude Distortion
Converting percentage points to percentages-of-percentages can exaggerate small changes, especially when dealing with low initial percentages. Regardless of the formula used, we contend that this metric is not useful if the goal is to easily compare the employment figures between time periods. Using such a calculation tends to make small differences appear much larger and can be woefully misleading if the base rate (i.e. the underlying values being compared) differ substantially. To illustrate this, take a simple example where in Year 1 the number of employed individuals is 1/100, while in Year 2, it is 2/100. If we convert these to percentages, we calculate Year 1 = 1% employed and Year 2 = 2% employed. But, when converting these to a percentage-of-a-percentage change, we obtain ((2%–1%)/1%)*100 = 100% increase in employment! Quite striking. Thus, while the real increase is just one more person employed, if reported using the formula by the MoJ, this would appear like a very substantial increase (akin to the 98% increase reported between April 2021 and March 2023 for the 6 week post-release figures).
Different Baselines
Percentage points and percentages-of-percentages use different baselines, which can lead to misunderstandings. Using the MoJ’s percentage change approach can obfuscate differences or create the impression of change where none occur. Relying on percentage change can produce a result that would indicate ‘no change’ (0%) between two time periods, while the real number of people employed could be going up or down. Take another simple example, in Year 1 we have 100/1000 employed, thus 10% of the cohort, but in Year 2 we have 10/100 employed, also 10% of that period’s cohort. The percentage change is 0%, but in reality, there were 90 fewer people employed in Year 2 compared to Year 1. Percentages obfuscate the real change in values.
Inconsistent Comparisons
This approach makes it difficult to compare changes across different periods consistently. It is possible for the percentage change to be positive (i.e. shows an increase) while the real number of employed people decreases. Staying with the above example, imagine if Year 2 had 20/100 employed. This would reflect 20% employment, which would be a percentage change increase of 100%, but in reality, it is still 80 fewer people employed compared to Year 1. For a concrete example, in the MoJ data for March 2024 the reported employed percentage is 29.4%, while the April 2023 percentage is 29.9%, suggesting better numbers in 2023 (+0.5pp.); however, in 2024, there were 665 employed, and in 2023, there were 650, thus 5 fewer people (see Figure 1 for details).
Loss of Context
The original values and their scale can be obscured when converting to a percentage-of-a-percentage. Percentages are often used in reports due to the belief they can provide simple and intuitive summaries of the underlying data. However, these are only valid assumptions if the type of data used permits such transformation. We assert that the MoJ’s employment figures are not such data. The variable nature of the cohorts does not permit the use of percentage change as a practical metric. For ease of comprehension and to avoid incorrect inferences, alternative reporting standards must be used.
Policy Implications
Employability data post-release is important for reducing recidivism and accessing the outcomes of various rehabilitative programmes.
Inaccurate Assessment of Success
Misreporting employment outcomes – such as using percentage-of-a-percentage changes – can give an inflated or deflated view of how well employment programmes are working. For example, a small increase in the number of individuals employed can be misrepresented as a large percentage increase, leading policymakers to overestimate the success of employment initiatives. This could result in continued or expanded programmes that may not be as effective as such inferences would suggest. Conversely, underreporting actual improvements might cause successful initiatives to be undervalued or deprioritised.
Misallocation of Resources
Flawed statistics can misguide decisions about resource allocation. If employment rates appear higher than they are due to distorted statistics, policymakers may believe that employment challenges for individuals recently released (6 weeks to 6 months) have been addressed. This may divert funding away from crucial employment support services like job training or transitional programmes, even when there is still a substantial need. On the contrary, overstating the effectiveness of specific programmes may lead to continued investment in less-efficient interventions at the expense of better-performing alternatives.
Skewed Public and Political Perceptions
Misleading statistics can affect public perception and the political narrative surrounding offender rehabilitation. If statistical reports inaccurately portray positive employment trends, politicians and the public may believe that existing policies are successfully tackling recidivism through employment, reducing pressure for further reform. This could delay the introduction of more comprehensive or innovative approaches needed to address underlying issues, such as employer discrimination against individuals with criminal records (Porter and McCartan, 2024; Porter et al., 2023).
Failure to Address Immediate Problems
When statistics smooth over short-term fluctuations or fail to capture seasonal or policy-driven changes (as with the shift to weighted averages), policymakers may miss urgent issues that need immediate attention. For instance, if a new employment initiative results in a temporary spike in employment for individuals that quickly diminishes, reporting based on averages might obscure this decline. Without accurate data, policymakers could fail to intervene in time, allowing potentially reversible issues to become more entrenched.
Reporting Recommendations
Our recommendation for reporting employment figures is simple: report the raw values alongside percentage point differences. If the argument made for reporting normalised percentages per cohort, and percentage-of-a-percentage change between cohorts/periods is for ease of interpretation, this rationale falls short. Such values are only useful if each cohort (year) is treated as a separate and unique population, where the percentage reflect how much of that specific cohort was successfully employed; but it does not allow for between cohort comparisons as presented by the MoJ.
Presenting the raw values allows a simple interpretation using a scale that is already very clear: number of people. There is no need for any conversion or transformation. An additional benefit of using the raw values is that they are commutative and provide a symmetric difference measure: if in Year 1 n = 200 and in Year 2 n = 230, this means in Year 2 there are 30 more people, while the converse is Year 1 has 30 fewer people than Year 2. With percentages, we would say Year 2 is 15% higher than Year 1 or Year 1 is 13% lower than Year 2; two different values based on the direction of comparison, which also obscure the underlying cohort sizes.
If an argument is made that reporting differences in employment figures must be simplified, then we recommend reporting ratios (Harrell, 2018). Focusing on the number of people employed (irrespective of the total population for that cohort), a more direct way to represent the change is as a factor increase (i.e. ratio). For example, taking the 6-week post-release figures, the increase from April 2022 to March 2023 in employment is a factor increase of 1.3× (640/485 ≈ 1.32). The benefit of this approach is that it makes the calculation for period-on-period change or across multiple periods easier, as ratios can be directly multiplied. In the next year (March 2024), the employed amount is 560, this is a factor change (here, decrease) of 560/640 ≈ 0.88, and if we want to further compare April 2022 to March 2024, it would be a 1.32 * 0.88 = 1.16 (i.e. 485 × 1.16 ≈ 563). 2
Such a simple operation is not possible with percentages, as they are neither additive nor multiplicative. Namely, a 30% increase followed by a 40% increase is not a 70% increase, but an 82% increase! This cannot be worked out directly and requires knowledge of the original ratios to obtain the correct value. The only acceptable use for reporting percentages we would endorse is for statements referring specifically to a single cohort, such as ‘in April 2022 there were 485/3,265 individuals employed, which represent 14.9% of the cohort’.
Considering improved data visualisation, we recommend stacked bar charts using the raw values (i.e. the number of individuals in each employment category) instead of a line graph with cohort-specific percentages that the MoJ currently uses for the 2024 online report. Using a contrast of colours for the various categories permits an easier inspection of the figures across a specific time period and reduces misinterpretation of what these figures represent. We further recommend having the data labels visible, as well as providing the total figure. We illustrate this using Figures 1 and 2, which can be easily constructed using the available data.
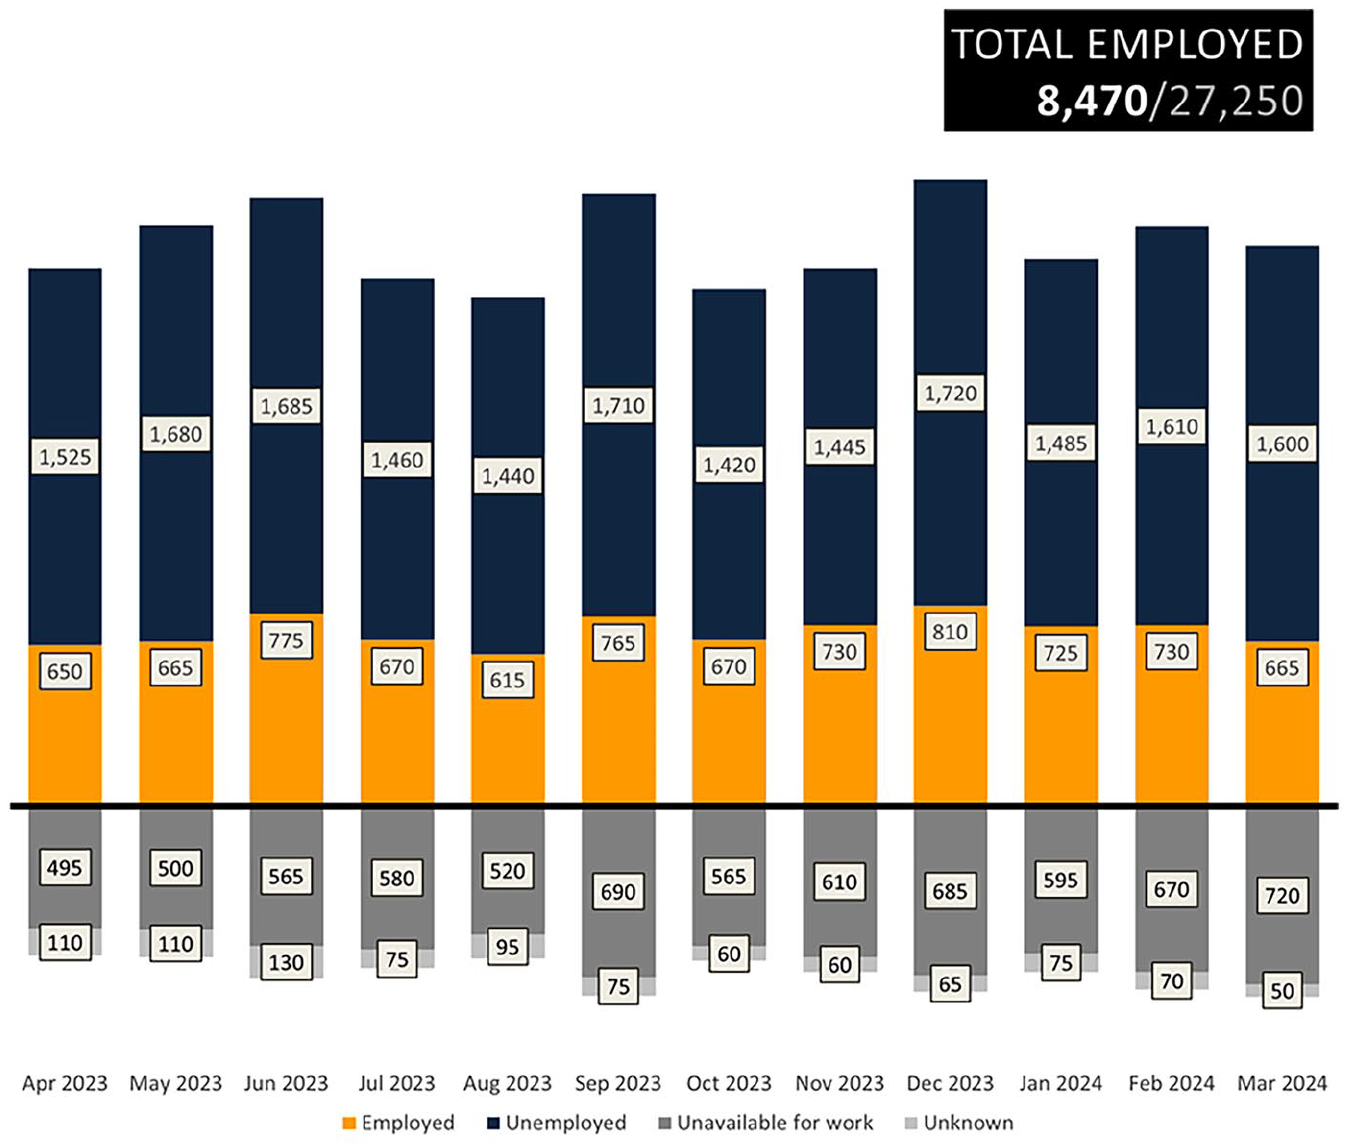
Stacked Bar Chart for the 6-Months Post-Release Employment Figures, During the Period of April 2023 – March 2024 (1 Year).
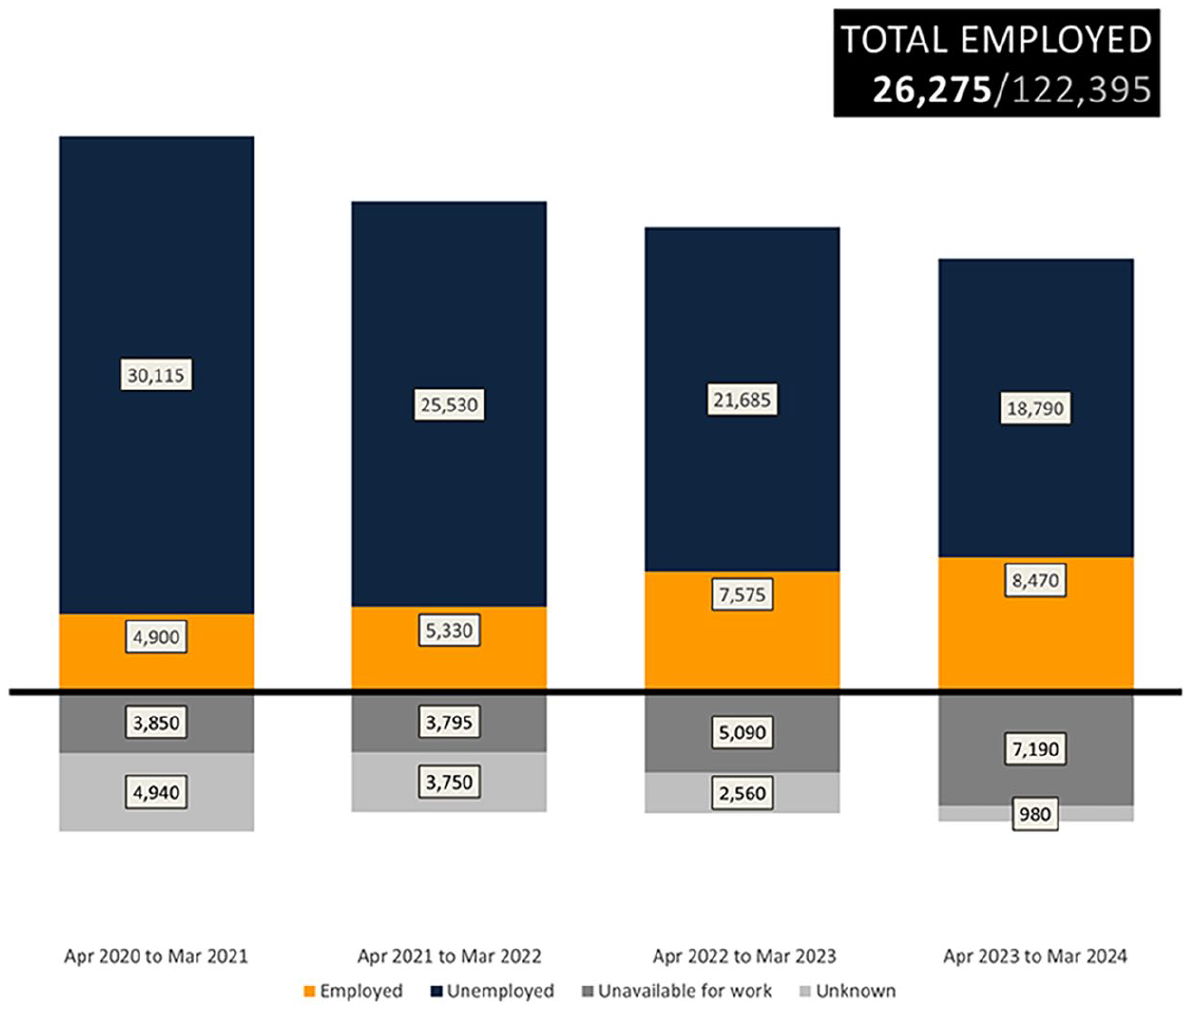
Stacked Bar Chart for the 6-Months Post-Release Employment Figures, Per Year From April 2020 to March 2024 (4-Year Period).
Figure 1 has the Employed values (number of individuals) as the focus (orange colour), permitting a quick scan of the trends in employment across the 12-month period. Having the Unemployed values stacked on top allows readers to visually see the total number of individuals considered by the MoJ within that specific cohort (Employed + Unemployed), allowing for trends and comparisons in the total numbers within each month. We believe plotting the two omitted categories from the report, ‘Unavailable for work’ and ‘Unknown’, is also important as it allows for better insight into the total population monitored and provides greater clarity and transparency on how the values or comparisons are computed.
A similar chart can be made for the per year (total) 6 months post-release employment figures (Figure 2).
We understand that one of the goals of the visualisation used by the MoJ is to present changes and trends over time. To achieve this, an additional graphical representation can be used, such as a line (area) graph (not stacked) with Employed and Unemployed data per cohort/period. See Figure 3 for an illustration.
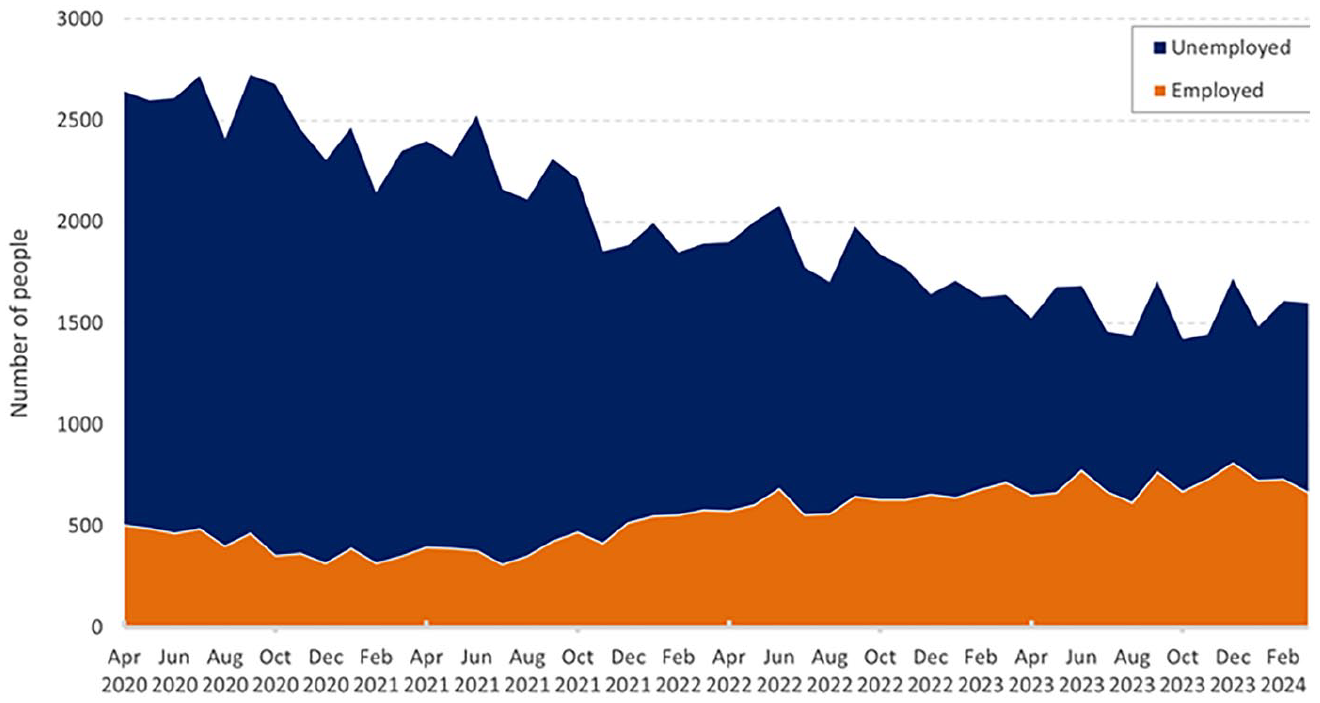
Area Chart (Non-Stacked) for the 6-Months Post-Release Employment Figures, From April 2020 to March 2024.
We caution readers against making strong inferences about trends from such a simplistic representation of the data, as these visualisations are not derived from a theory-based statistical model, nor do they account for exogenous factors not present in the database. At best, they can serve as companion plots on the MoJ’s online report, with values being added and updated on a monthly basis to track the figures in real-time.
Conclusion
The use of flawed statistics in reporting offender employment outcomes can distort the reality of rehabilitation programmes’ effectiveness, leading to poor policy decisions, misallocated resources, and diminished public trust. Our recommendations for reporting the raw values, alongside percentage points and introducing more transparent visualisations should aid interpretation of the changes in employment figures while avoiding the potential misinterpretation present in the current reporting by the MoJ. Policymakers need accurate and transparent data to evaluate and refine initiatives that aim to reduce recidivism through employment and support for individuals recently released from prison.
Footnotes
Declaration of conflicting interests
The author(s) declared no potential conflicts of interest with respect to the research, authorship and/or publication of this article.
Funding
The author(s) received no financial support for the research, authorship and/or publication of this article.