
Abstract
This article examines the use of social media during the 2021 Mexican legislative election. Political candidates were contacted through the email addresses they had listed and sent a questionnaire to fill out. Thus, the research is based on original data directly collected from political candidates. Political candidates commented on their use of social media during the election campaign. The research used closed questions. The assumption was that political candidates would use social media if they felt that the benefits outweighed the costs associated with managing social media accounts. The utility of social media can also lie in the opportunity to gain new votes. The results show that political candidates used social media more if they perceived that it was being used in their constituency. If few voters in a constituency use social media, then the potential utility of using social media declines. Furthermore, they used them more if they perceived that from an economic point of view, managing an account and sending a message were not that costly.
Introduction
Social media is regularly used in election campaigns by political parties and candidates. And it was no different in the case of the Mexican legislative election in 2021. This article examines the use of social media in these elections by political candidates. The conceptual framework of the article is based on a cost-benefit calculation inspired by rational choice theory (Downs, 1957; Riker, 1995), which has already been used in examining online political communication (Cardenal, 2013). The assumption is that the use of social media by candidates in elections will depend on the perception of usefulness on their part. While there are obviously costs in using them, in the form of time spent and paying a staff or PR agency, the benefits are uncertain. Political candidates cannot be sure how many votes they will gain by using social media, but each must conduct a cost-benefit analysis of whether social media is worth using at all.
This article focuses on Facebook, Twitter, and Instagram and examines their use by political candidates. The current literature is not in agreement about the role of costs in social media use. Although the costs of using social media in election campaigns are relatively low, some researchers report that they are essentially zero (Lassen and Brown, 2011; Obholzer and Daniel, 2016). Other research reports that politicians who use social media are the ones who have the most money to spend on election campaigns (Quinlan et al., 2018; Williams and Gulati, 2013).
The contribution of this article to current research on social media and politics is that it presents original data from a survey where candidates were contacted via email. There were closed questions in the survey prepared to get candidates’ perceptions on the costs and benefits of using social media. This article offers early results from that survey, which may yet be built upon. The article is divided into several parts. This introductory section is followed by the formulation of the research question and hypotheses, and the next section is methodological, where the source of the data and how the data were handled are explained. The next section contains the results and the last section of the article is the conclusion.
Research Questions and Hypotheses
The research question in this article is as follows: Why did political candidates use social media during the campaign in the 2021 Mexican election? Thus, the research is interested in their motivations and reasons for adopting social media and its subsequent use. The assumption is that political candidates only used social media if they reasoned that the benefit/payoff/utility/(u) would outweigh the costs (C). That is, that u > C.
Studies of political communication on the Internet and social media often include variables that provide information about the use of social media in a politician’s constituency or country. These variables can be the number of users on a given social networking site (Haman and Školník, 2021; Scherpereel et al., 2017); alternatively proxy variables such as Internet penetration (Obholzer and Daniel, 2016; Sudulich and Wall, 2009); and socioeconomic variables of a particular constituency, which may be, for example, the number of people with a college degree, the number of retirement-age residents, the degree of urbanization, and the wealth of the district (Carlson et al., 2013; Chi and Yang, 2010; Cook, 2017; Gulati et al., 2010; Gulati and Williams, 2007, 2013; Herrnson et al., 2007; Lappas et al., 2016; Lassen and Brown, 2011; Metag and Marcinkowski, 2012; Peterson, 2012; Southern, 2015; Southern and Lee, 2019; Strandberg, 2009, 2013). Sometimes these variables are used as independent variables, sometimes they have a primary control role. Either way, they are thought to possibly affect incentives for online communication by politicians. However, these studies primarily use aggregate data. Research based on survey data that examine both the perceived popularity of social media in electoral districts and the perceived costs to politicians is absent.
Politicians can see the utility of social media in various ways, for example, by offering voters a personalized image or the opportunity to interact with voters (Carlson et al., 2013; Enli and Skogerbø, 2013), or candidates simply do not want to fall behind their political competitors (me too effect) who are campaigning online (Sudulich and Wall, 2009). However, the usefulness of social media should be diminished for campaigning purposes if it is barely used in a candidate’s constituency. This reasoning leads to the first hypothesis:
H1: The more political candidates perceive the use of social media by voters in their constituency, the more political candidates will use social media.
Many studies test budget as a variable that could impact the propensity to campaign online. Candidates with higher budgets can spend more on online campaigning than their opponents who have to run austerity campaigns (Gulati et al., 2010; Gulati and Williams, 2013; Quinlan et al., 2018; Southern and Lee, 2019) and may perceive social media costs to be higher and more significant to them. Therefore, the perceived costs may not be the same for all political candidates. Some candidates may like to use social media in their spare time, while others may not be IT-savvy or have enough spare time and have to pay their staff or a PR agency to manage all their social media accounts. This assumption leads to the second hypothesis:
H2: The higher the perceived cost of using and managing social media by political candidates, the less they will have and use social media accounts.
Methodology
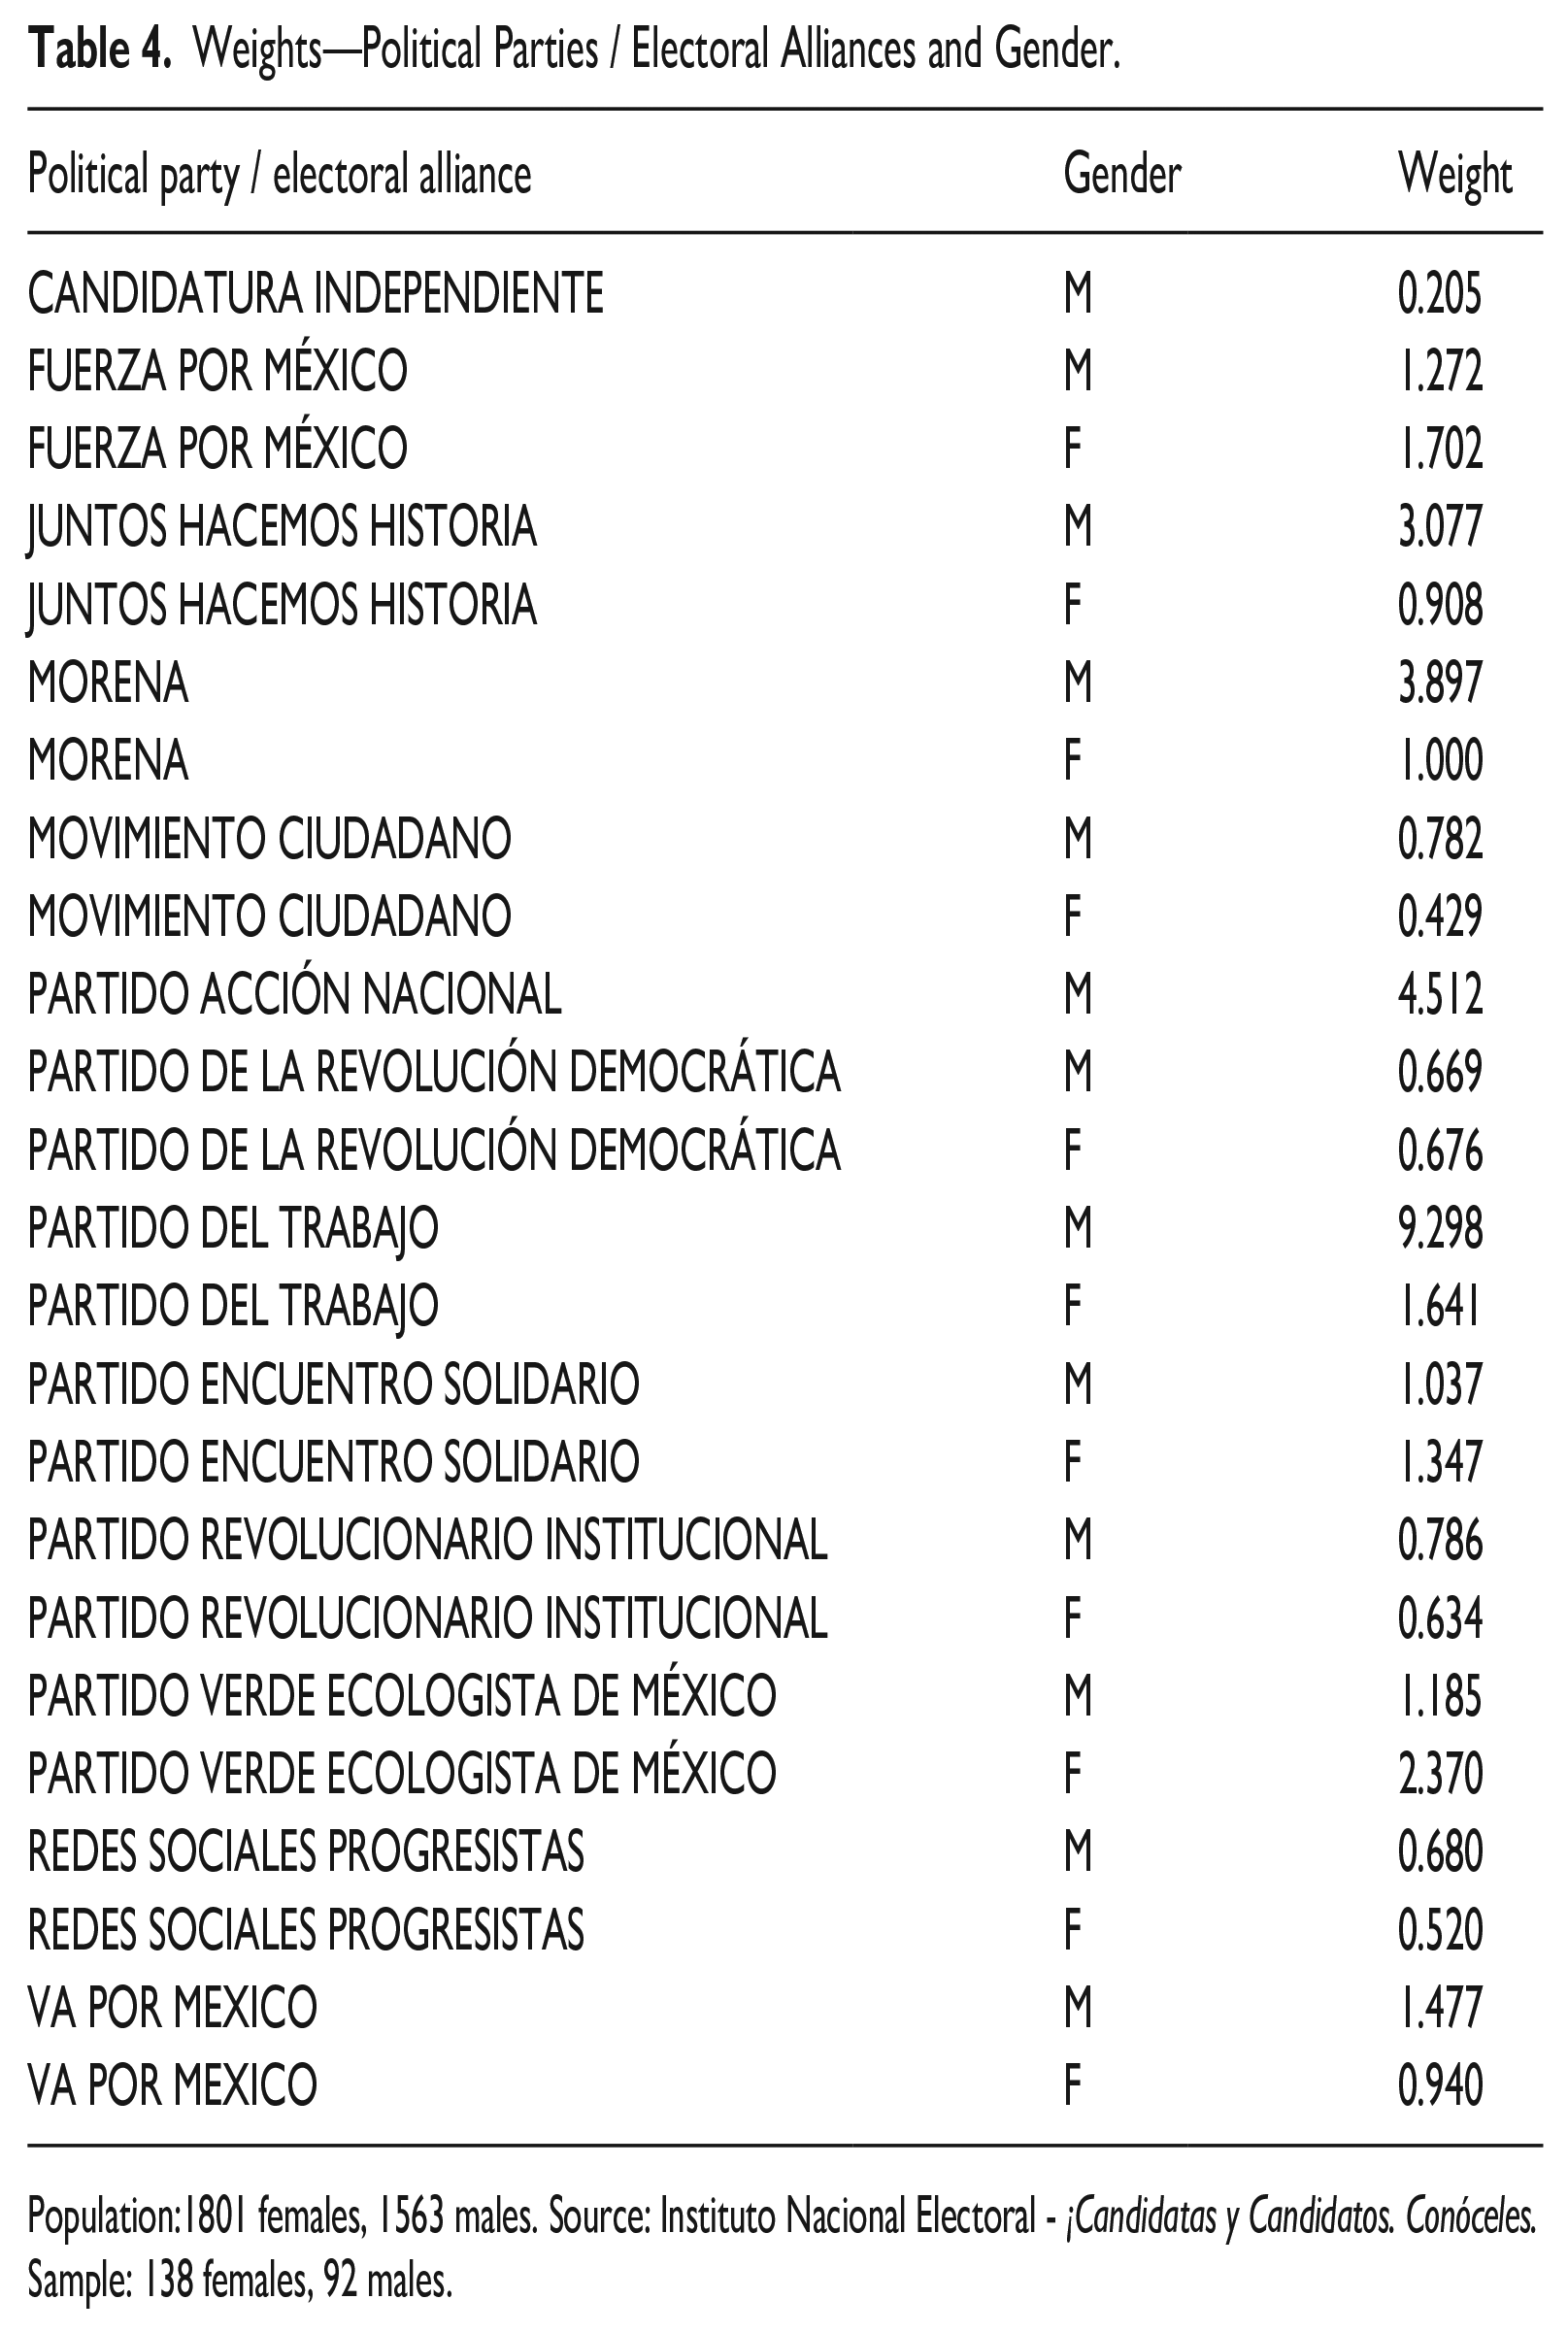
An online survey was used to collect data from the candidates. First, email addresses had to be obtained so that questionnaires could be sent out. The National Electoral Institute (Instituto Nacional Electoral, INE) offered voters the opportunity to learn about the candidates on its website. The website was called ¡Candidatas y Candidatos, Conóceles! (Instituto Nacional Electoral (INE), 2021). Each candidate had the opportunity to supply his or her information to INE, which would then publish that information before the election. In addition to the mandatory information such as name, surname, age, or gender, each candidate was able to display some optional information such as their social media accounts or email contact. Of course, not all candidates had an email address listed, as it was not a mandatory item. However, all the email addresses that were listed were downloaded. At the same time, all Facebook accounts listed were looked through to see if there was an email address listed for the Facebook account. If such an email address was listed, it was saved. A number of candidates listed their party’s email address, so it was necessary to filter the email addresses from duplicates while checking for inaccurate spellings in known domains such as gmail.com or hotmail.com. Emails were then saved to a data file, and candidates were contacted. Candidates received a link to an online questionnaire on the Typeform platform and were informed what the research was about. They were contacted with the first email on the first day after the campaign ended, 3 June 2021. In July 2021, after a month, those who did not respond to the questionnaire received another email. No further emails were sent. Overall, the first reply was sent on 3 June 2021 and the last on 27 August 2021. Thus, data collection took place during June and August 2021. Messages were sent to a total of 1975 email addresses. However, dozens of emails were returned as undelivered because candidates gave invalid email addresses. A total of 230 political candidates chose to participate in this research. The survey included the closed-ended questions that were prepared based on previous research (Karlsen and Enjolras, 2016; Marcinkowski and Metag, 2014) on social media. Before presenting the results, it should be stressed that the low response rate may have skewed some of the descriptive statistics presented. The representativeness of the sample is presented in Appendix 1. The weights were calculated based on political parties or electoral coalitions and gender from the total population. Table 2 with regression models presented in the following section includes both the weighted and unweighted estimates.
Results
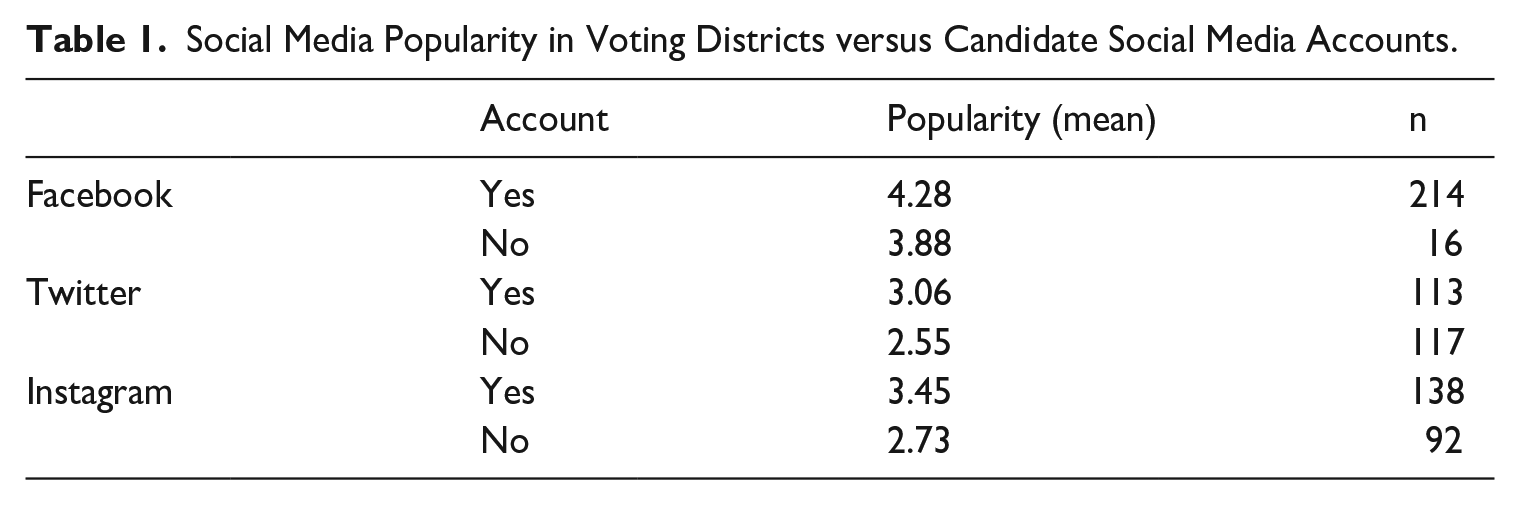
The key question for answering the first hypothesis is the question seen by the political candidates: In your constituency, estimate how many people use Facebook (question_1) and the answer was on a scale of 1 = “nobody” and 5 = “everyone.” They expressed themselves on every social network, namely, Facebook, Twitter, and Instagram. Table 1 shows in the form of descriptive statistics the differences between the responses of those political candidates who had accounts on a given social network and those who did not. For all three social networks, political candidates who had an account with a given social network responded on average that the social network was more used in their constituency compared to those who responded that they did not use the social network. While the mean for political candidates with a Facebook account is 4.28, the mean for candidates without a Facebook account is 3.88 (two-sample t-test, p-value = 0.060). In the case of Twitter, it is 3.06 versus 2.55 (two-sample t-test, p-value < 0.001), and Instagram 3.45 versus 2.73 (two-sample t-test, p-value < 0.001). So, these are substantial and noticeable differences in means. However, it should be noted that the group of respondents not using Facebook was rather small. The results are as expected by the first hypothesis.
Social Media Popularity in Voting Districts versus Candidate Social Media Accounts.
However, the use of the social network itself says nothing about its intensity. Political candidates may send one message per month, while others send several messages per day. Therefore, this question about their consideration of the use of a given social network in their constituency was combined with a question about how important the social network is to them. Political candidates in the survey saw the question as: How important are the following communication channels to you (5 = very important, 1 = not important at all)? In addition to Facebook, Twitter, and Instagram, channels such as television, radio, and newspapers were also mentioned as communication channels. This question and the results are further discussed in the Supplementary Information. These results in the form of means are then shown in Figure 1 for Facebook, Figure 2 for Twitter, and Figure 3 for Instagram. All the figures clearly show that on a given scale of 1 (no one uses a given social network in the constituency) to 5 (everyone uses a given social network), the mean regarding the importance in the election campaign for political candidates increases. Using Instagram as an example, 19 political candidates marked 1 on the scale, that is, no one in their constituency uses Instagram. These 19 political candidates then have a mean of 2.00 on a 5-point scale regarding the importance of Instagram in their election campaign. The 82 candidates who marked a 5 on the scale have a mean of 3.74. Based on these results, it appears that the first hypothesis has been confirmed; these data are included in the regression analysis below.
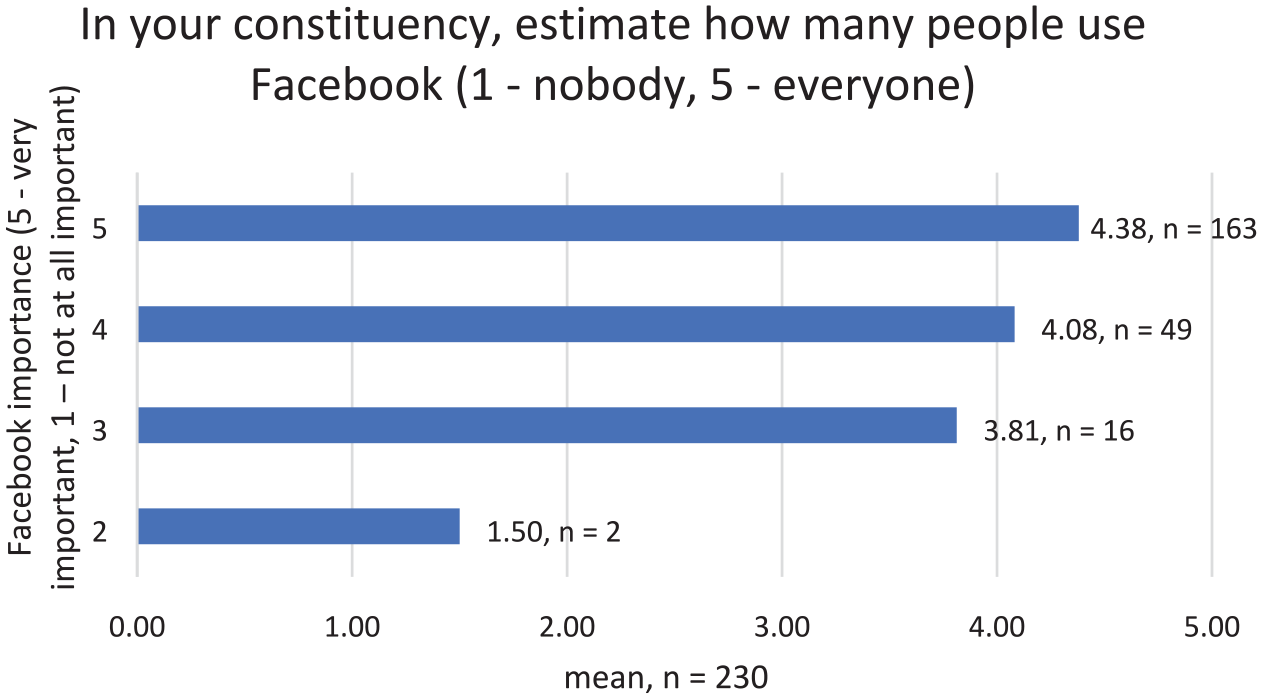
Facebook’s importance for political candidates in their campaigns versus perceived popularity in constituencies.
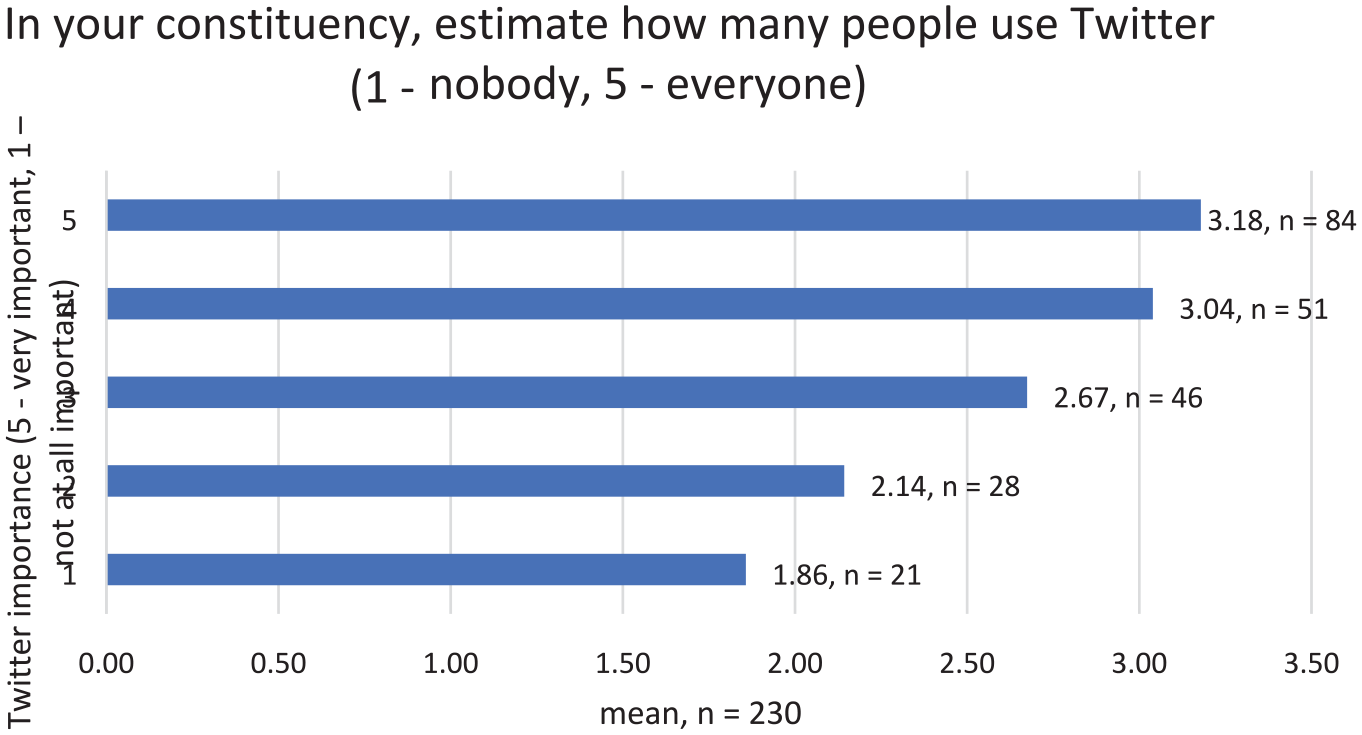
Twitter’s importance for political candidates in their campaigns versus perceived popularity in constituencies.
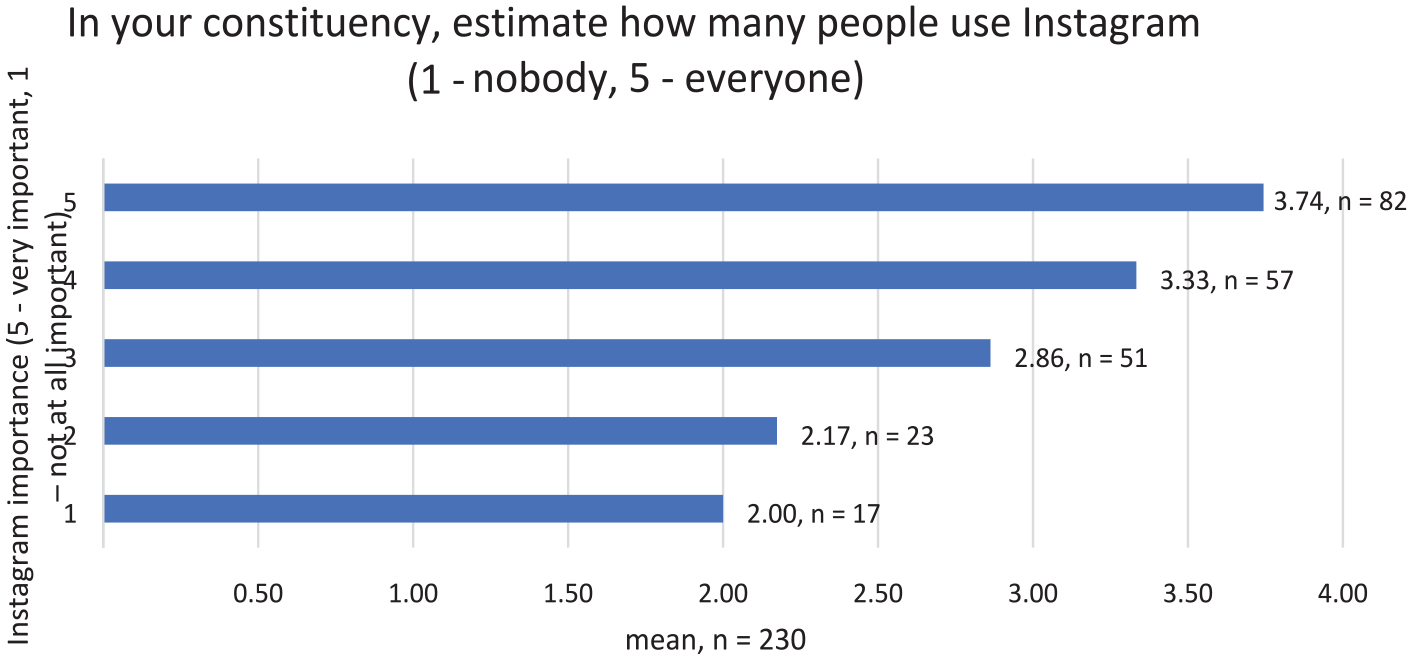
Instagram’s importance for political candidates in their campaigns versus perceived popularity in constituencies.
The second hypothesis is linked to two questions that express certain costs. The first cost is monetary and the second is time. The introductory statement for both questions was the same: To what extent do you agree with the following statements? On a scale of 1 to 5, where 1 indicates “I do not agree at all” and 5 indicates “I strongly agree.” At first, the political candidates saw: “The use of social networks (maintaining accounts and sending messages) is very time-consuming” (question_3) and then “The use of social networks (maintaining accounts and sending messages) is very demanding from an economic point of view” (question_4). It can be argued that some candidates manage their accounts, in which case, they see the costs mainly in terms of time. However, candidates who have assistants and advisors are not alone in managing the account; in that case, they have to pay them. In this case, of course, one might argue that it would be better to ask about the costs of specific social networks rather than treat them all together, but the problem is that, if one does not know the social network in question, it is difficult to comment on the question of how time-consuming or costly it might be to use an account on that social network. In this case, the variable sum_social_media was created that contained the number of social networks that political candidates used. The scale was therefore between 0 (no social network) and 3 (Facebook, Twitter, and Instagram). The relationship between the variable sum_social_media and cost in terms of time is in Figure 4, while the relationship between the variable sum_social_media and cost in terms of economics is in Figure 5. Figure 4 shows that although the mean (4.08) in the response to the cost of social networks in terms of time is higher than those who use social networks, the difference between those who use one, two, or three social networks is not as pronounced, and the values are similar. The result regarding perceived cost in terms of time may not have differed significantly between groups, as the political candidates generally perceive that social networks require a large amount of time and have a staff or a team to manage the accounts. Conversely, the average response to the cost of social networking in economic terms shows a gradual decrease depending on the number of social networks a given political candidate uses. Thus, this fact suggests that if political candidates perceive that the economic cost of using social networks is lower, they will adopt more social networks. This result confirms the second hypothesis, but it is still tested in the following regression analysis.
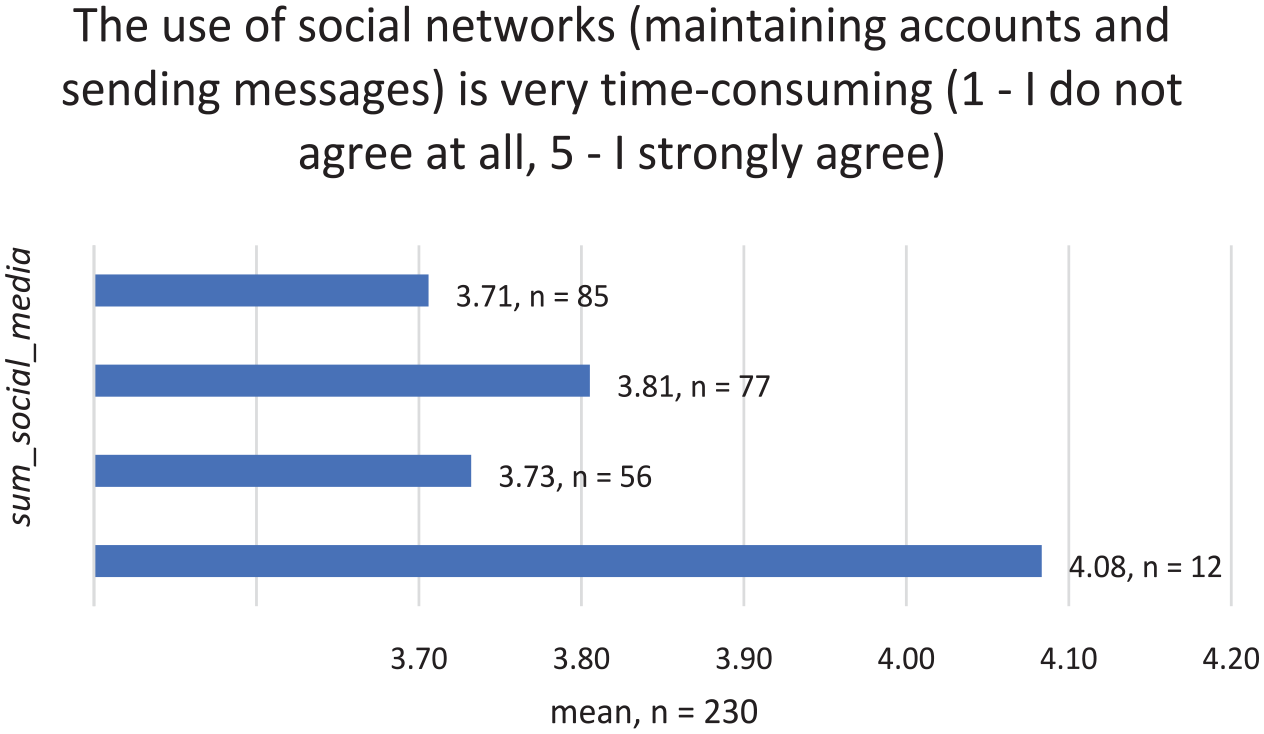
Perceived time costs by political candidates versus their use of social media.
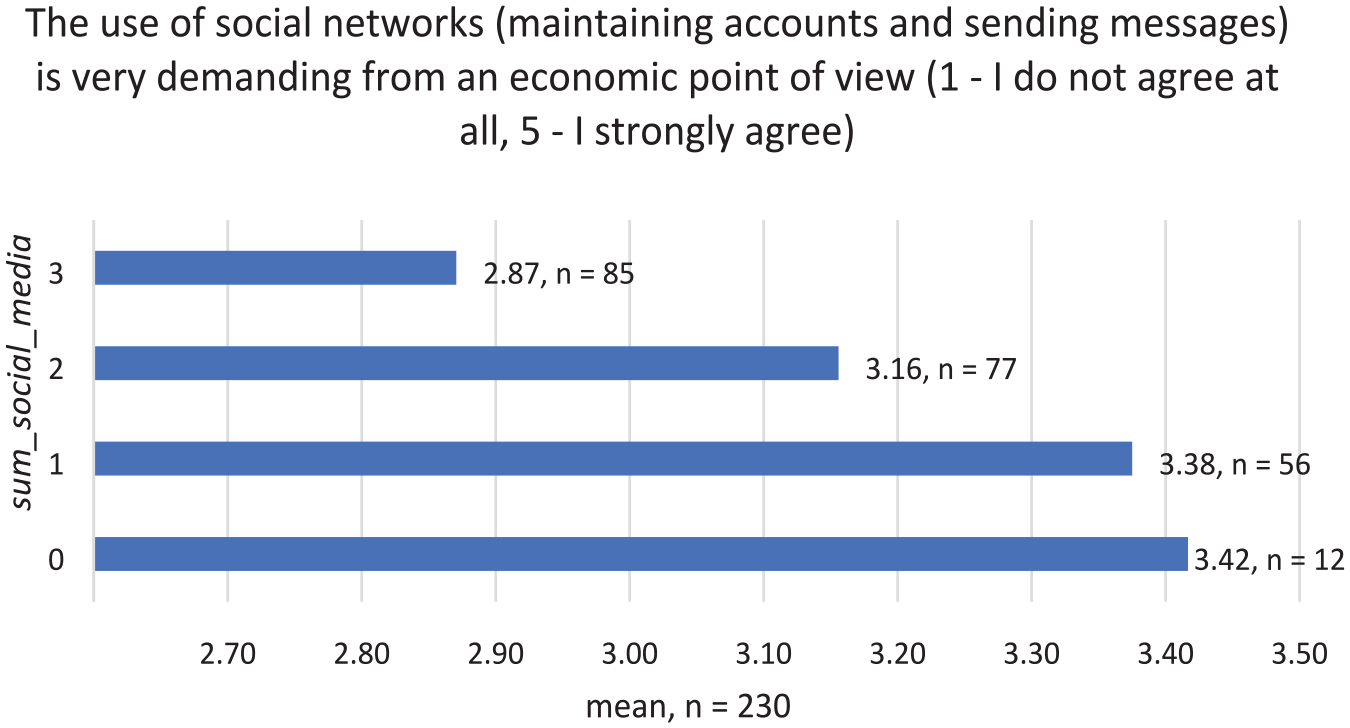
Perceived economic costs by political candidates versus their use of social media.
To test the first and second hypotheses, three linear regression models were created, which are shown in Table 2. The dependent variable is the sum_social_media already mentioned and the independent variable is sum_popularity_social_media, which was created as the sum of the values of the three questions already mentioned above, namely, the perception of how many people use Facebook, Twitter, and Instagram in the electoral district (question_1).
Linear Regression Models.
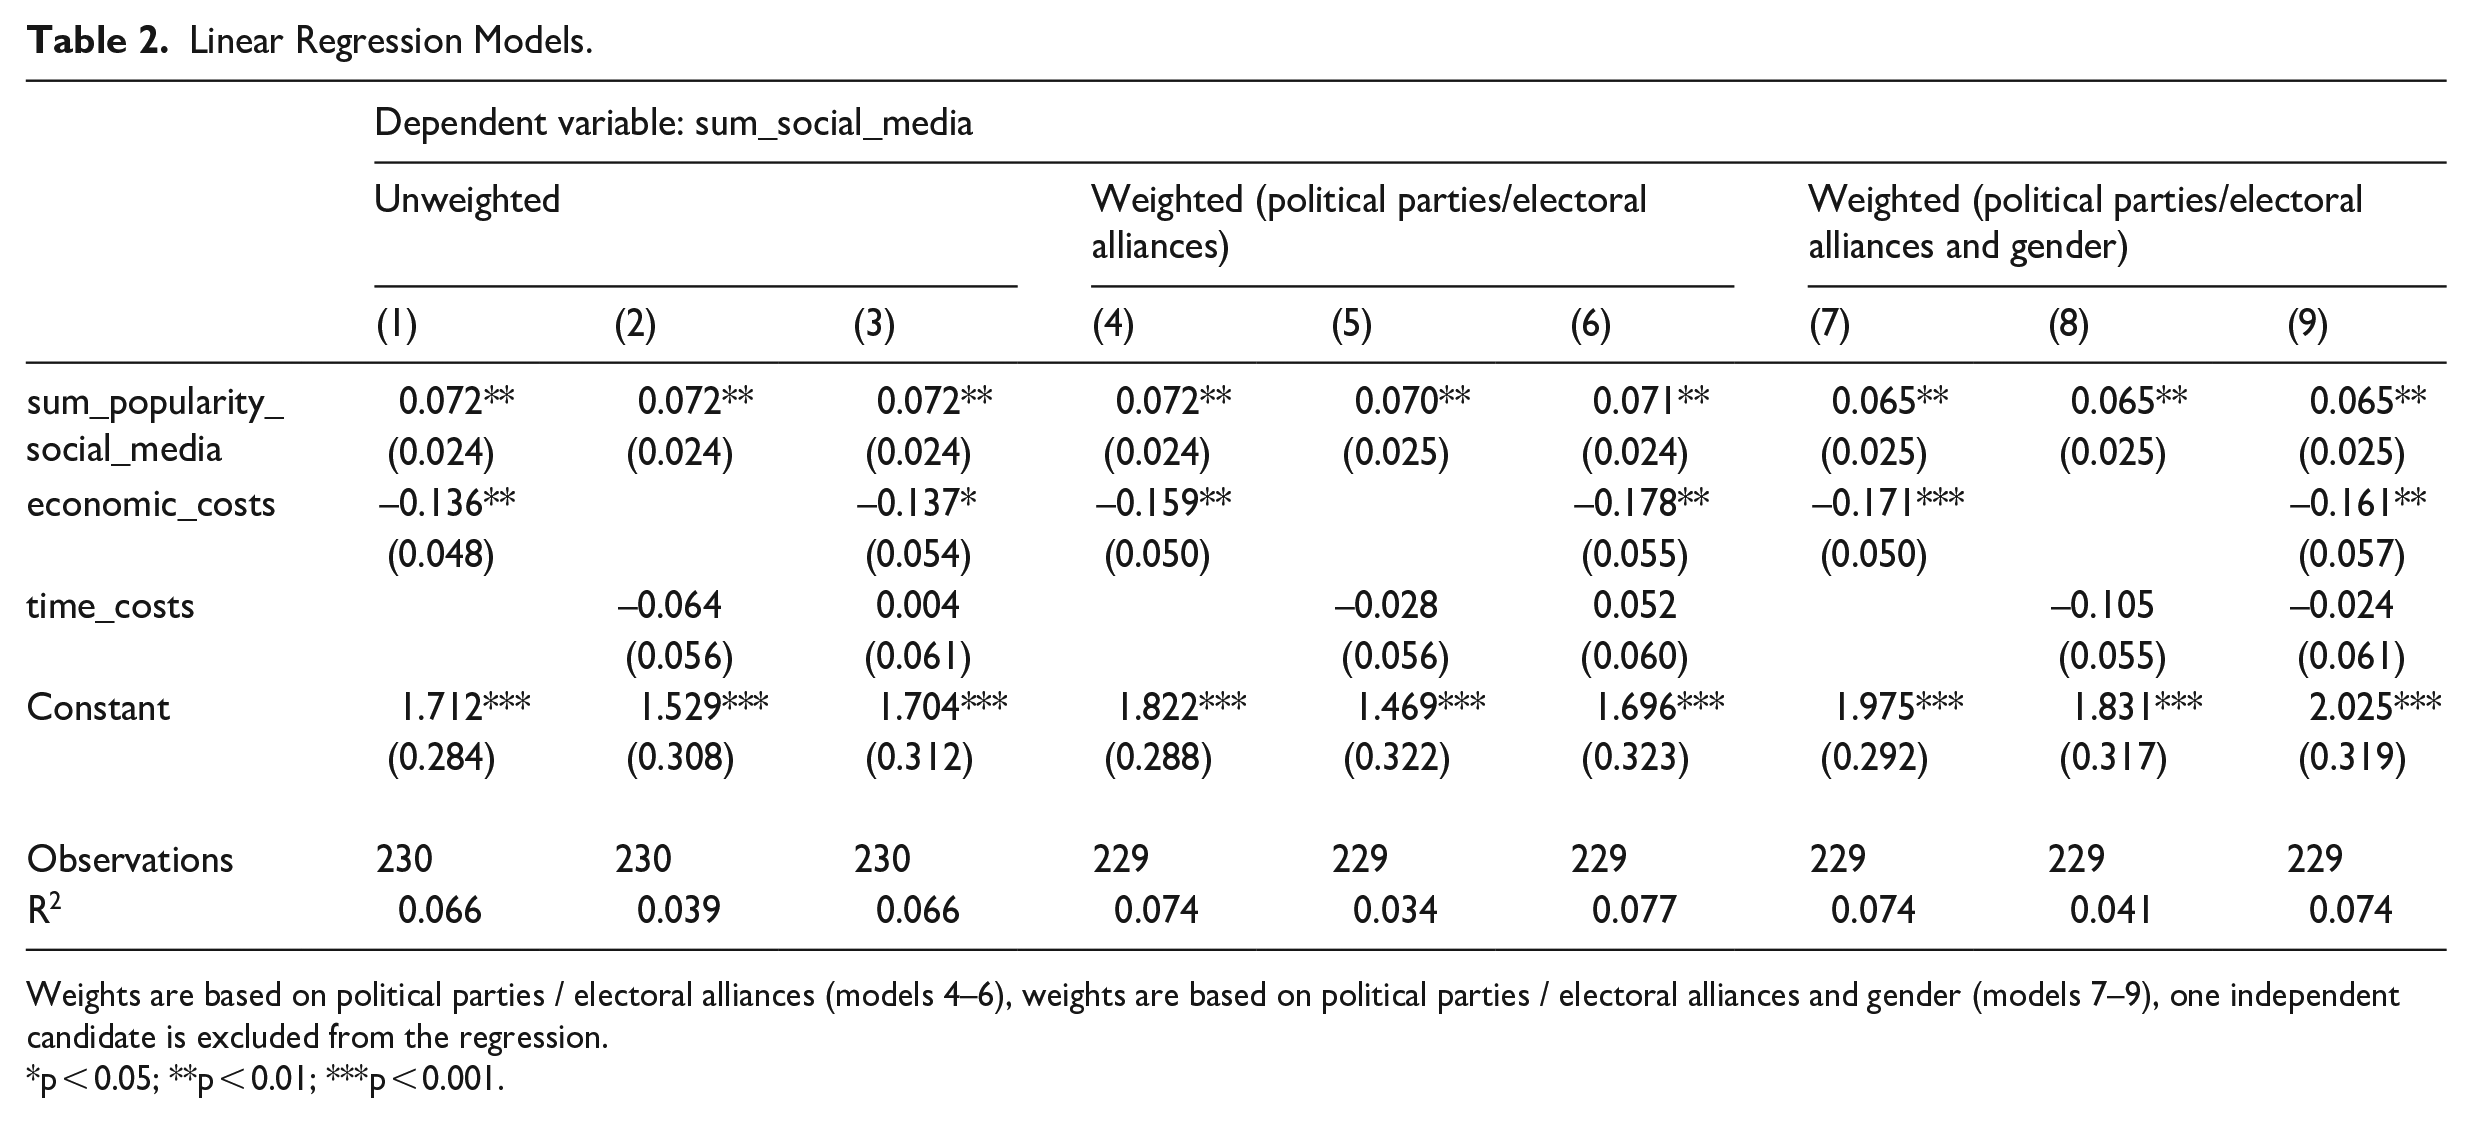
Weights are based on political parties / electoral alliances (models 4–6), weights are based on political parties / electoral alliances and gender (models 7–9), one independent candidate is excluded from the regression.
p < 0.05; **p < 0.01; ***p < 0.001.
Thus, the variable sum_popularity_social_media had possible values of 3 to 15. A value of 15 indicates that political candidates responded that everyone in the constituency uses Facebook, Twitter, and Instagram. The other two variables are the previously mentioned economic_costs (question_4) and time_costs (question_3). The variable economic_costs was in the first model, time_costs was in the second model, and economic_costs and time_costs were together in the third model. In the first two models, they are separated due to the relatively high correlation (0.43). The results of the regression analysis confirm the conclusions already suggested by the descriptive statistics. Thus, political candidates adopted and used social networks depending on their perception of how many people use social networks in their district and how costly a given social network use is. In addition, for robustness tests, the table presents six additional regression models where weights based on political party (or electoral alliances) and gender were used. The conclusions from these regression models are consistent with the first three models.
Conclusion
This article tested the perceived popularity and costs of social media in the Mexican election campaign in 2021. Candidates were contacted using a survey sent to their email addresses listed either in the official registry of INE or on their Facebook page. Each political candidate is considering the benefits that the use of social networks can bring to them in the elections, that is, in winning votes. Thus, when deciding on the use of social networking sites, they must decide on utility and cost. It can be argued that utility increases with the number of people using a given social network in a constituency. If no one uses a given social network, political candidates have less incentive to use that social network. Conversely, if almost every citizen uses a given social network, then the motivation is much higher. However, the costs of using social networks are also substantial. Even if every voter in a given constituency would use a social network, if managing an account and posting to social networks is very costly, then political candidates may not use networks either. Since political candidates were approached, the question was about their perceived use of social networking by voters in their constituency and their perceived costs. It is very difficult to impossible to obtain data on the use of a given network in each candidate’s constituency, as social networks protect such data and do not make it public. However, the perception of the politician is far more relevant to the actual decision to use the network, since political candidates decide themselves to use social networks.
The results indicate that political candidates used social networks more if they perceived that they were used in their constituency. They also used them more if they perceived that from an economic point of view, managing an account and sending a message was not that costly. This research had some limitations. The main limitation is that it only worked with a sample of candidates who were willing to participate in the survey. Thus, the survey involved candidates who have a warmer relationship with Internet use, public communication, and very likely with social media use. Thus, within this sample, it is likely that candidates used social networking sites more and placed more emphasis on them during the campaign. However, this does not mean that their motivations and perceptions of the benefits and costs of using social networking sites will be different from candidates who either did not engage or did not have an email address listed. In addition, for robustness tests, weights calculated on political parties, electoral coalitions, and gender were used in regression models. Further information is provided in Appendix 1.
Supplemental Material
sj-docx-1-psw-10.1177_14789299231152106 – Supplemental material for Why Do Political Candidates Use Social Media in Election Campaigning? An Explanation Offered by a Cost-Benefit Calculation Using Survey Data
Supplemental material, sj-docx-1-psw-10.1177_14789299231152106 for Why Do Political Candidates Use Social Media in Election Campaigning? An Explanation Offered by a Cost-Benefit Calculation Using Survey Data by Michael Haman in Political Studies Review
Footnotes
Appendix 1
Weights—Political Parties / Electoral Alliances and Gender.
| Political party / electoral alliance | Gender | Weight |
|---|---|---|
| CANDIDATURA INDEPENDIENTE | M | 0.205 |
| FUERZA POR MÉXICO | M | 1.272 |
| FUERZA POR MÉXICO | F | 1.702 |
| JUNTOS HACEMOS HISTORIA | M | 3.077 |
| JUNTOS HACEMOS HISTORIA | F | 0.908 |
| MORENA | M | 3.897 |
| MORENA | F | 1.000 |
| MOVIMIENTO CIUDADANO | M | 0.782 |
| MOVIMIENTO CIUDADANO | F | 0.429 |
| PARTIDO ACCIÓN NACIONAL | M | 4.512 |
| PARTIDO DE LA REVOLUCIÓN DEMOCRÁTICA | M | 0.669 |
| PARTIDO DE LA REVOLUCIÓN DEMOCRÁTICA | F | 0.676 |
| PARTIDO DEL TRABAJO | M | 9.298 |
| PARTIDO DEL TRABAJO | F | 1.641 |
| PARTIDO ENCUENTRO SOLIDARIO | M | 1.037 |
| PARTIDO ENCUENTRO SOLIDARIO | F | 1.347 |
| PARTIDO REVOLUCIONARIO INSTITUCIONAL | M | 0.786 |
| PARTIDO REVOLUCIONARIO INSTITUCIONAL | F | 0.634 |
| PARTIDO VERDE ECOLOGISTA DE MÉXICO | M | 1.185 |
| PARTIDO VERDE ECOLOGISTA DE MÉXICO | F | 2.370 |
| REDES SOCIALES PROGRESISTAS | M | 0.680 |
| REDES SOCIALES PROGRESISTAS | F | 0.520 |
| VA POR MEXICO | M | 1.477 |
| VA POR MEXICO | F | 0.940 |
Population:1801 females, 1563 males. Source: Instituto Nacional Electoral - ¡Candidatas y Candidatos. Conóceles.
Sample: 138 females, 92 males.
Declaration of conflicting interests
The author(s) declared no potential conflicts of interest with respect to the research, authorship, and/or publication of this article.
Funding
The author(s) disclosed receipt of the following financial support for the research, authorship, and/or publication of this article: This article is a result of the project of specific research “Using survey experiments in political science” supported by the Philosophical Faculty of the University of Hradec Králové in 2021.
Supplementary Information
Additional supplementary information may be found with the online version of this article.
Contents Questions in the original language (Spanish) Question_2 Figure A1. How Important Are the Following Communication Channels for You?
Author Biography
References
Supplementary Material
Please find the following supplemental material available below.
For Open Access articles published under a Creative Commons License, all supplemental material carries the same license as the article it is associated with.
For non-Open Access articles published, all supplemental material carries a non-exclusive license, and permission requests for re-use of supplemental material or any part of supplemental material shall be sent directly to the copyright owner as specified in the copyright notice associated with the article.