
Abstract
Situated against teacher demand problems worldwide, rising teacher turnover and declining teacher education enrollment have rendered the state of South Carolina a region commonly described as facing a “teacher shortage crisis.” This paper reports results from an evaluation of the Rural Recruitment Initiative (RRI), a state-level teacher staffing policy for SC’s hard-to-staff districts. Based on a decade of data analysis, we assess RRI’s causal effect using a Difference-in-Differences model with Arellano–Bond maximum likelihood design and find that RRI funding reduces teacher turnover rate by 1% for fund-receiving districts. We conclude by discussing how the initiative could be improved and what policymakers can learn from our results.
Government sponsored policies are increasingly enacted in response to growing concerns for teacher shortages across the globe (Dupriez et al., 2016; Ingersoll et al., 2018). In the United States, this concern is fueled by data demonstrated by state-by-state subject area vacancies, declining enrollment in teacher preparation programs, and a blossoming volume of testimonials concerning the unattractiveness of the teaching profession (Garcia and Weiss, 2019; Tran and Smith, 2019). For instance, undergraduate teacher preparation remains the traditional pathway into the teaching profession, yet enrollment has declined by more than one-third over the last decade in these programs while overall university enrollment has grown (Partelow, 2019).
This paper evaluates a state-level policy initiative in South Carolina focused on improving teacher staffing in hard-to-staff school districts. In South Carolina, over 6000 teachers did not return to their positions in 2020–2021, 5300 of which left public school teaching altogether in the state (CERRA, 2020). For first-year teachers, 16% did not return for a second year in 2020–2021, and 42% of departures had 5 or fewer years of service (CERRA, 2020). Utilizing district implementation data, we apply a difference-in-difference model with an Arellano-Bond maximum likelihood design to assess the causal effect of this policy on teacher employment in districts with the most severe staffing problems in the state.
The policy initiative examined in this paper is the Rural Recruitment Initiative (RRI), a legislatively funded South Carolina program that intends to incentivize the recruitment and retention of classroom teachers in rural and underserved districts that have faced prolonged, excessive teacher turnover. For over two decades, the state of South Carolina has documented a large exodus of teachers from their positions every year, which correlates to many teachers needing to be hired annually. The Graide Network (2019) ranked teacher turnover rate (TO)s by state and ranked South Carolina as 11th highest. In response to the state’s persistent teacher staffing challenges, the South Carolina General Assembly passed a general appropriations bill in 2015–2016 (H.3701) that included $1,500,000 in initial funding for creating a Rural RRI for FY16. Rural Recruitment Initiative aims to provide annual funding directly to rural and underserved school districts with a documented history of high teacher turnover to enhance teacher recruitment and retention. The initiative allows the district flexibility in determining how to use these funds in conjunction with the state-designated program administrator, the Center for Recruitment, Retention, and Advancement (CERRA), which districts submit annual itemized RRI funding requests to. While having “rural” in the initiative’s name, funding eligibility is open to all districts based on annual teacher TOs. Thus, a small number of urban districts also qualify and receive RRI funds. Likewise, while the policy initiative has recruitment in the name, eligible districts can use the funding to support self-identified recruitment and retention needs.
District eligibility for funding in FY20 is a 5-year average annual TO greater than 11%. The 15 wealthiest districts in the state (based on their index of taxpaying ability) are ineligible for funding. A formula considering a district’s annual turnover, the number of teachers in a district, and the available funds appropriated by the legislature is used to determine the level of funding available to each district. Districts have wide latitude in how to use funds as it relates to teacher recruitment and retention—particularly for the approved incentives of recruitment expenses, Web site upgrades, national employment system fees, international teacher fees, alternative certification fees, certification examination support, teacher cadet start-up costs, bridge program costs, mentoring/induction support, first-year teacher salary stipend, critical need salary stipends, graduate coursework, professional development, travel stipends for commuters, and housing purchase/renovation funds.
The teacher staffing problem
The Economic Policy Institute (2020) reported that in September 2020, public K-12 employment (e.g. teachers, counselors, teacher aides, special education) has declined by over 500,000 jobs to 7,456,700 compared to the September 2019 level of 8,027,000. They also project that current K-12 employment is 890,000 jobs below what is needed to keep up with growth in student enrollment since 2008, with half of that figure representing classroom teachers. The most recent wave of teacher shortages has especially impacted the recruitment of underrepresented teachers of color (Ingersoll et al., 2019), with teacher staffing challenges being much more acute in hard-to-staff schools that typically educate primarily marginalized students of color from low-income backgrounds (Tran and Smith, 2019b).
While national data points to growing issues in the teacher labor market, the issue is oversimplified when explained as a broad national crisis (McVey and Trinidad, 2019). It is important to recognize that the United States has a hyperlocal teacher labor market in which most teachers choose to teach within 15 miles of their hometowns (Reininger, 2012). This creates a labor market environment that leaves many less attractive school districts with shortages of qualified candidates and teachers that teach across multiple subject areas and levels, even though other school districts in the same state or region may face only a few or no subject areas shortages. Some applicant-attractive schools may even be in an oversaturated labor market for select subjects and levels. The critical challenge is not in the overall teacher supply but rather a challenge in aligning the supply of teachers with in-need certification areas and level endorsements with local demand. The lack of this labor market congruence of supply and demand at the local level leads to added challenges for “hard-to-staff” districts in getting highly qualified, effective teachers to the schools most in need and keeping them there.
Teacher recruitment and hiring into the profession is one side of the talent management coin. The other side is teacher turnover. Specifically, teacher turnover is related to teachers leaving the workforce (i.e. teacher attrition), transferring positions within a district, or taking a teaching position in a different district. It is well documented that high-poverty rural schools experience more severe teacher shortages from a recruitment perspective (Aragon, 2016; Hammer et al., 2005; Jimerson, 2003). Unsurprising, these same schools are more likely to have current teachers leave the classroom than teachers in urban and suburban schools (Ingersoll et al., 2019; Maranto and Shuls, 2012). The combination of teacher recruitment and retention issues has been described as the “rural school problem” (Biddle and Azano, 2016).
Goldhaber et al. (2018) examined longitudinal data in North Carolina and Washington and found that four labor market processes (attrition from the workforce, within district transfer, between district transfer, and hiring to open positions) contribute to teacher quality gaps. Their longitudinal evidence suggests that systematic sorting in teacher hiring explains these gaps and reinforces the locality of the teacher labor market. One way systematic sorting plays out is in teacher education programs because those that produce graduates with the lowest licensure test scores tend to disproportionately have their graduates hired by economically disadvantaged districts. The small labor market supply for disadvantaged districts also consistently places them in a position of hiring lower-quality teachers (across numerous metrics of quality) and having their quality teachers poached by more advantaged districts in what Goldhaber et al. (2018) describe as a “dance of the lemons” (p. 23).
The unfortunate reality is that teacher turnover disproportionately impacts high-poverty districts that serve primarily underrepresented students of color and has a negative impact on student achievement (Ronfeldt et al., 2013), and it is costly (Watlington et al., 2010). The cost of turnover is exacerbated for many rural and urban high-poverty school districts that cannot impose additional property tax levies to better support school operations (Goldhaber et al., 2015, 2019; Tran, 2018). High-poverty context is a known deterrent factor in teacher employment decision-making (Monk, 2007). These areas typically also have high concentrations of underrepresented and marginalized students, creating opportunity gaps.
Schools with more resources, fewer academically struggling students, and more geographic amenities experience fewer challenges with educator recruitment (Bacolod, 2007; Boyd et al., 2005; Podgursky et al., 2004). Community-level employment deterrent factors include remote location, lack of amenities, and a thinner work-life separation in smaller (typically rural) communities ( Miller, 2012; Tran and Smith, 2020). These same schools are also those that often have the fewest quantity of applicants of any quality for available teaching positions. Yet district and school leaders often focus effort on reducing local teacher shortages via recruitment strategies instead of comprehensive approaches to teacher employment that address recruitment and retention, despite empirical research documenting the numerous school-related deterrents that impact both recruitment and retention. These include deterrents related to fewer professional development opportunities (Player, 2015), fewer pedagogical/technological resources (Hammer et al., 2005), and having to teach more out-of-subject classes (Biddle and Azano, 2016) in hard-to-staff contexts.
State level teacher staffing policies
Many state policies remain focused on increasing enrollment in traditional teacher preparation programs to remedy teacher labor shortages, in response to the declining undergraduate teacher preparation enrollment (Partelow, 2019). As of this writing, 22 states have state policies that provide a pathway and/or incentives to recruit high school students into the teaching profession, and 23 states have policies to recruit paraprofessionals (Evans et al., 2019). Other common state policy efforts include financial incentive programs to recruit teachers of color to the profession (11 states), induction and mentoring support for new teachers (31 states), reduced teaching loads for new teachers and/or mentor teachers (22 states), and designated teacher work time for planning (11 states) (Evans et al., 2019). Another approach to state policy to support teacher recruitment and retention centers around district innovation. That is, providing flexible financial support for districts to determine their targeted strategies locally rather than forcing one-size-fits-all strategies on districts (Aragon, 2018). The focus of this study will be on this latter type of state policy.
State and federal governments have funded incentive systems to recruit and retain high-quality teachers in high-poverty schools, yet the staffing needs of rural environments may differ from those of urban contexts (Loeb and Miller, 2006). For example, Miller’s (2012) comparative analysis of 20 years of rural, urban and suburban teacher labor market data in New York suggests that rural schools are more likely to hire less experienced beginning teachers with lower educational attainment and/or from less competitive colleges than their nonrural counterparts and that the rural teachers are less likely to stay.
Consequently, policymakers increasingly recognize that blanket “one-size-fits-all” policies ignore the unique challenges experienced by schools in each respective geographic locale (Miller, 2012) and that teacher staffing strategies likely need to be differentiated based on the varying degrees of the attractiveness of different spaces (Fowles et al., 2014). Specifically, policy recommendations have focused on efforts to improve the attraction of higher-quality teachers to disadvantaged districts, often through “combat pay” style financial incentives (e.g. hiring bonus, retention bonus, loan forgiveness) to accept these teaching positions (Cowan and Goldhaber, 2018; Feng and Sass, 2018; Goldhaber et al., 2018).
Beyond financial incentives, the literature also suggests that working conditions significantly impact teacher employment decisions (Ladd, 2011). Policy efforts to address working conditions are more complicated to directly influence through policy. For example, student teachers are more likely to perform student teaching in an advantaged school setting, allowing for the advantaged school to have a head start in the hiring process and for the candidate to seek employment opportunities more similar to their student teaching experience as opposed to the disadvantaged school contexts (Krieg et al., 2020).
While there are not many robust evaluations of state-level teacher staffing initiatives, what has been conducted suggests promise for their potential efficacy. Case in point, Florida’s Critical Teacher Shortage Program provided loan forgiveness of up to $10,000 to eligible teachers and one-time retention bonuses of up to $1200 in high-need subject areas. Feng and Sass (2018) examined the impact of (Tran and Smith, 2020) these incentives on recruitment and retention in hard-to-staff subjects. Using a difference-in-difference approach, they found that loan forgiveness reduced attrition by 10.4% for middle school math and science teachers, 8.9% for high school math and science teachers, and 12.3% for special education teachers when funded fully. Feng and Sass (2018) triple-difference estimate found retention bonuses to reduce the short-term (1 year) likelihood of teacher departure by as much as 32%.
Other studies have also found loan forgiveness and service scholarships attract new teachers to hard-to-staff schools, retain them longer, and improve their effectiveness (Liou et al., 2010; Steele et al., 2010). Teacher turnover increases when the financial benefits end; however, putting into question the sustainability of such initiatives (Feng and Sass, 2018) without prolonged financial investment from a tax-wary populace. Moreover, research indicates that implementing these incentives significantly affects their utility and that financial benefits must be sizable to be effective. For example, Maranto and Shuls (2012) and Bull et al. (1994) demonstrate that forgiveness programs of $3000 per year or less are often too low to offset the higher salaries offered by other regional schools.
Springer et al. (2016) evaluated a state policy to provide a one-time $5000 retention bonus to effective teachers in designated priority schools in Tennessee. Schools that were identified were low-performing schools that experienced high rates of teacher turnover. Using a fuzzy regression discontinuity design, they found mixed effectiveness. While the overall effect of the retention bonus on state-identified effective teachers was not significant, there was a significant increase in teacher retention in tested subjects. Tested-subject teachers were 20% more likely to remain teaching in a priority school.
Similarly, Fulbeck (2014) examined Denver’s merit pay program, Professional Compensation for Teachers, which intended to recognize and reward good teachers by providing various financial incentives for performance, educational advancement, and/or $2000 for working in high-poverty schools. The average teacher received $4409 in incentives. Utilizing a hazard model to examine longitudinal teacher data, Fulbeck found a 30% decrease in a teacher’s odds of departing a non-high-poverty school and a 7% decrease of departing a high-poverty school.
The theories undergirding the teacher staffing strategies and policies are numerous. For instance, Springer et al. (2016) explained that retention bonuses are rooted in the theory that even small economic awards can mitigate problematic teacher-exit patterns in high-need and low-performing schools. Others, such as Bacolod (2007) and Loeb and Page (2000), refer to the theory of compensating wage differential to explain the need for additional compensation to recruit and retain quality teachers to high-need schools when compared to the compensation offered by more desirable schools or non-teaching careers. In support of the theory, Marvel et al. (2007) found that 15% of teachers left teaching positions to accept another teaching position in a school paying more. Overall, while economic incentive policies (e.g. salary schedule modifications, salary enhancements, limited duration incentives, education and training incentives, in-kind incentives, retirement incentives) are used widely to address teacher staffing issues based on various theories linking financial incentives to employment-interest (Kolbe and Strunk, 2012), there is mixed evidence that school districts are effectively aligning these economic incentives with high-need staffing needs (Strunk and Zeehandelaar, 2015).
While some studies have found suggestive evidence for the potential impact of state-level teacher staffing policies, few state policy efforts are empirically evaluated for their causal effects. Furthermore, many state policy efforts are singularly focused on one incentive type (e.g. loan reimbursement) to improve teacher staffing. Rarely do these efforts provide school districts with flexibility in how to tailor the use of earmarked funding to improve teacher staffing to match local needs, even though research has suggested better teacher employment outcomes when educators at the ground level have more influence on their teacher staffing policies (Jackson, 2012). One such state policy initiative that does this is South Carolina’s Rural Teacher Recruitment Incentive, the focal policy of our study.
Rural recruitment initiative funding
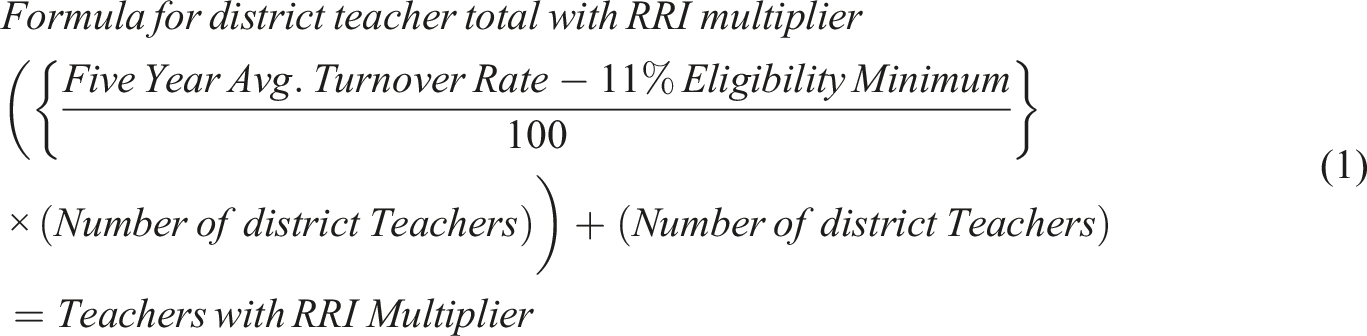
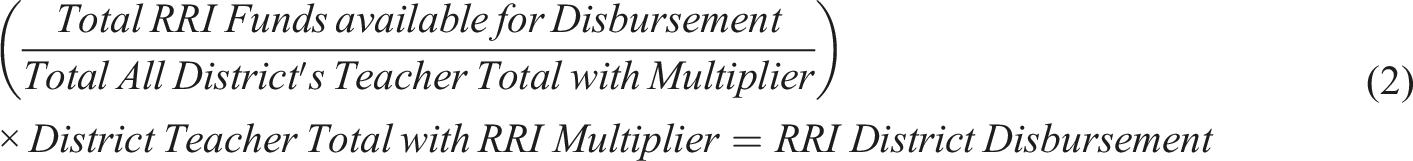
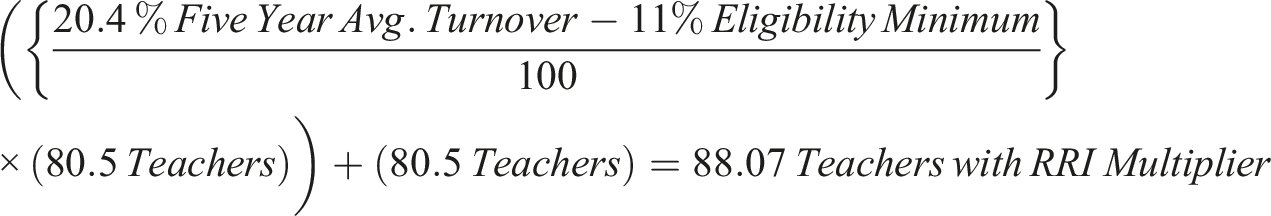
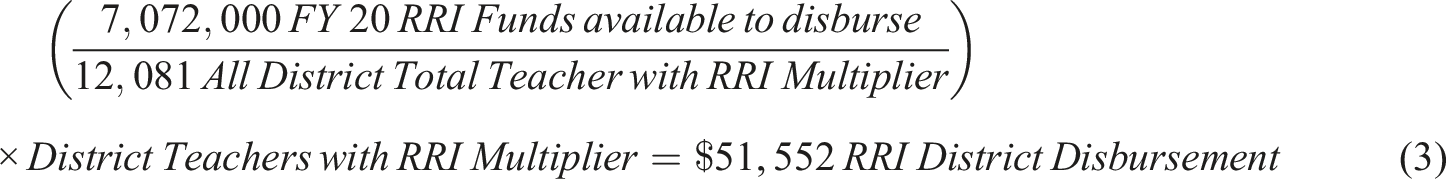
Eligibility for RRI funding receipt was based on districts’ average teacher turnover percentage over the prior 5 years. Initial eligibility in FY16 was set at 12%. In FY17, the eligibility cutoff was lowered to 11%, where it has remained. In FY20, the state’s wealthiest 15 districts (by the index of taxpaying ability) were made ineligible for RRI funding. The number of RRI-funded districts has risen from 20 in FY16 (12% cutoff) to 28 in FY17 (11% cutoff began), 30 in FY18, 36 districts in FY19, and 35 in FY20. For reference, South Carolina has 81 public school districts as of FY20. Funding was expanded from the initially $1,500,000 in FY16 to $9,748,392 for FY17, FY18, and FY19. Funding was reduced to $7,598,392 for FY20. The actual amount allocated to districts is determined considering district enrollment. In sum, funding allocated to RRI has been assisting a growing number of districts over the years of its implementation, resulting in fewer funds for each eligible district. A formula calculates the amount of funding each eligible RRI district receives. This formula takes the difference of the district’s 5-year average TO from the 11% eligibility cutoff divided by 100 to create a multiplier. The resulting number is multiplied by the number of teachers in a district (minus guidance, speech, and media) to create a teacher total with an RRI multiplier for each eligible district (1)
Despite districts receiving state funds to address chronic teacher staffing, the potential effectiveness of this policy initiative has not been assessed. This study aimed to fill this knowledge gap by evaluating the effect of this policy on the teacher TO.
Research questions
This study adds to the literature in several important ways. First, there is a paucity of research examining how policies help improve teacher staffing outcomes when districts have multiple options for utilizing additional resources (Fowles et al., 2014). Most existing research is either descriptive of teacher staffing policy initiatives or is narrowly tailored to focus on the effectiveness of single incentives (e.g. loan forgiveness, critical need stipends). Our work aims to evaluate the causal effect of a comprehensive teacher staffing policy that allows districts flexibility in utilizing funding. Specifically, our research questions were:
We focus on turnover because it is the district eligibility criteria for RRI fund receipt, is the source of teacher shortages (Ingersoll, 2001), and is more reliable and valid than the inconsistent vacancy data. We estimate the impact of state policy on teacher staffing using a difference-in-difference model with an Arellano-Bond maximum likelihood design to mitigate against spurious estimation results. More details are provided in the method section. The districts’ eligibility in the RRI policy is decided based on the districts’ previous TO. So, the dependent variable (DV) is not independent of its lagged values because the prior TOs determine the disbursement by the RRI funds at the end of the school year, influencing the TO of the following years. This study addresses this dynamic relationship and endogeneity issues using an Arellano-Bond dynamic panel design. That is, the lags of the teacher TO would instrument for the unobserved factors in a first difference model, causing endogeneity. Overall, our results suggest a small but significant effect of RRI on teacher turnover.
Identification strategy and data
Data
To determine the effectiveness of South Carolina’s RRI, we examine changes to a teacher staffing outcome: teacher turnovers at the intervention districts since the initiation of RRI. Data were collected from multiple data sets available for school districts in the state of South Carolina through the following sources: “South Carolina Department of Education” using “South Carolina District and School Report Cards” and “Historical Financial” data sets; “National Center for Education Statistics (NCES)” using the Common Core Data (CCD), and “The United States Census Bureau” using “Small Area Income and Poverty Estimates (SAIPE) Program.” Finally, the district eligibility information is collected from the reports produced by “The Center for Educator Recruitment, Retention, and Advancement (CERRA).” The data predate the 2015/2016 school year, the start of the RRI.
The data can be separated into the outcome variables, district-level demographic, and financial/economic control variables. Data for the variables reflect the period from the 2008/2009 school year through the 2018/2019 school year, except for the district expenses (including salaries and benefits expenses), which are available only until 2017/2018. The data encompass all 81 school districts in South Carolina. During the period under study, some districts merged with others, causing a difference in the total number of districts across time. Specifically, Dillon 1 and Dillon 2 merged into Dillon 4 in 2011, Marion 1, Marion 2, and Marion 7 merged into Marion in 2012, and Sumter 2 and Sumter 17 were consolidated to Sumter in 2011. See CERRA (2020) for the latest full list of eligible districts. The estimations are done with and without the consolidated districts.
Outcome and treatment variable
To calculate each district’s TO, we use the following formula: 1 minus the percentage of teachers returning from the previous school year. Figure 1 shows the average teachers’ TO for RRI-eligible and ineligible districts from 2008 through 2018 (the start of the school years). The average TO is higher for eligible districts than ineligible ones in the aforementioned period, and their changes are parallel before and after the policy implementation. After the first implementation of the governmental incentive (RRI funding) in 2015, the average TO did not significantly change. That said, it can be observed that after implementing the second eligibility cutoff (11% turnover) in 2016, the TO also declined. This seems to suggest a positive effect of RRI, at least descriptively. Average Turnover Rate (TO) for eligible and ineligible districts over time.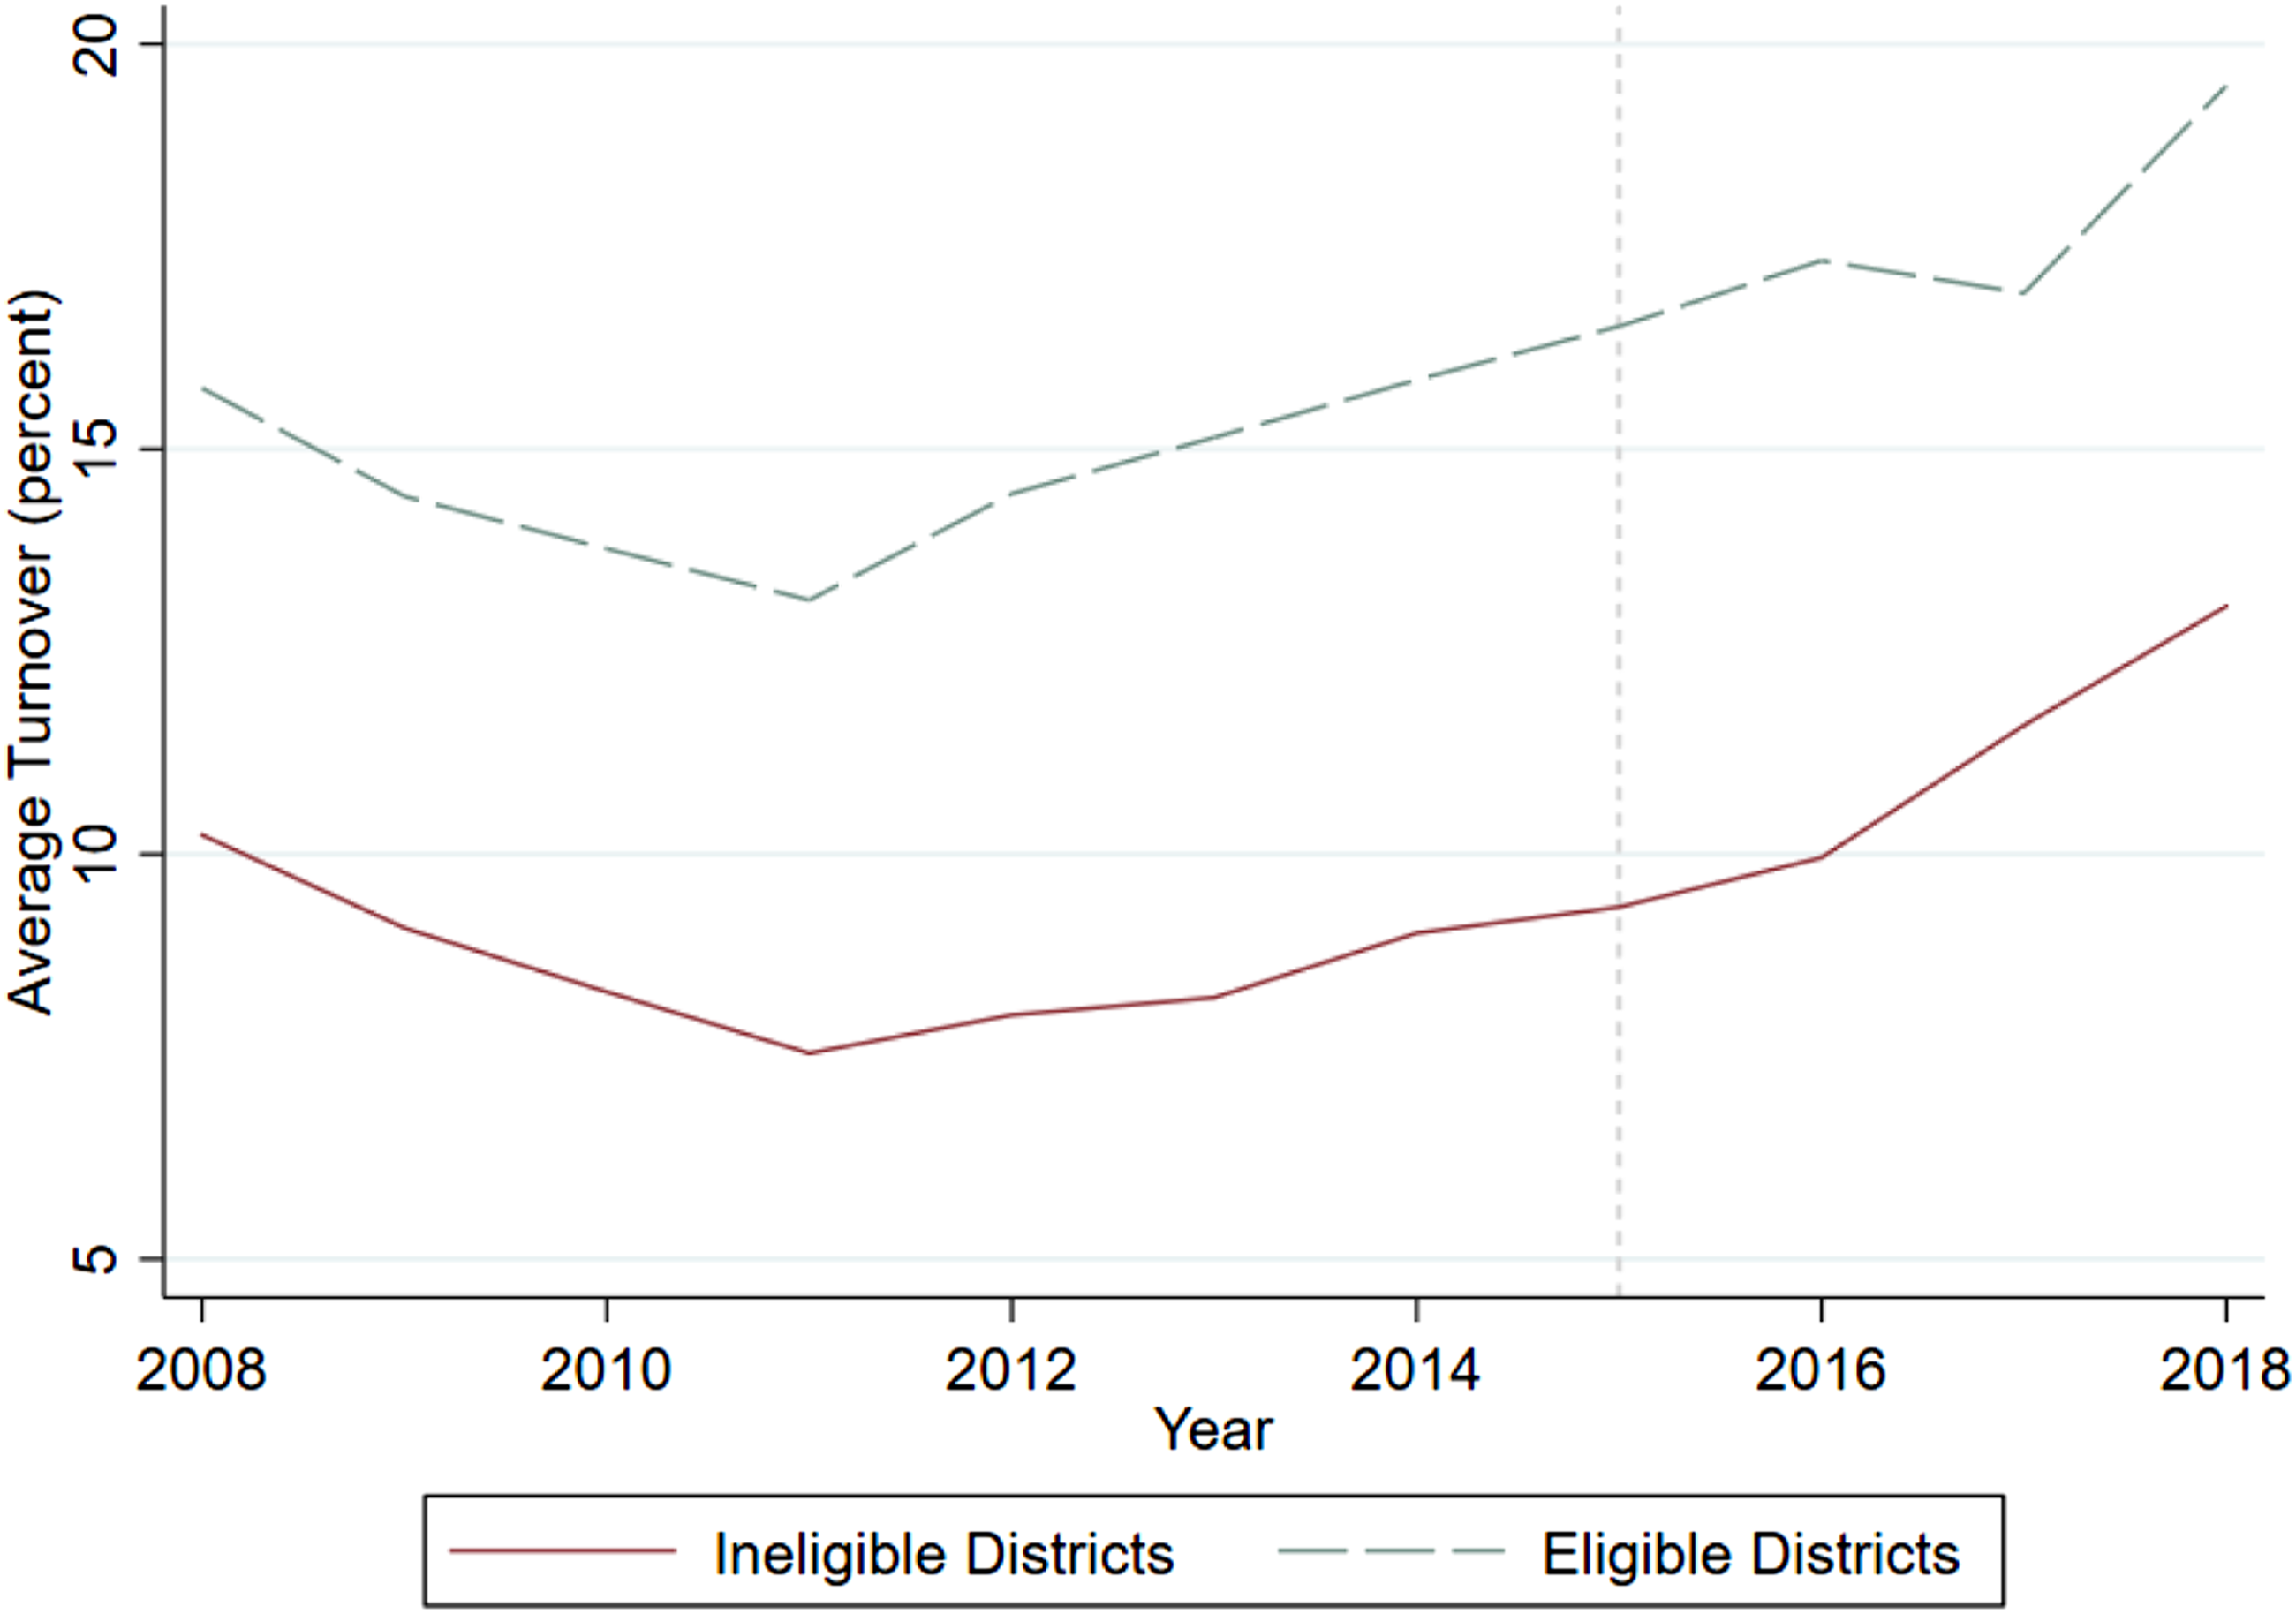
The TO has continued to escalate over time, even after the implementation of RRI. Furthermore, the number of RRI-eligible districts has steadily increased from 28 in 2016 to 30 and 36 districts in 2017 and 2018, respectively. Therefore, it is worthwhile to assess the causal effect of RRI on the target variables of teacher turnovers after controlling for other influential variables.
In this study, the researchers define the treatment based on the current eligibility of districts in each year as a dummy variable equal to one if the district is eligible to receive RRI disbursement for that school year. It is worth noting that the value of the financial incentive received by each district is different and is calculated by CERRA using a formula as described in the earlier section. The dollar amounts are used in the analyses as a robustness check, while the data for the school year 2015–2016 is not available. Therefore, we remove the 2015 observations for the robustness check estimations.
Control variables
We control for the district-level variables that the literature has suggested as influential for teacher turnover to rule out the effects of confounders. Conley and You (2017) identified poor socio-economic/human conditions and student disengagement as significant negative influences on teacher retention. They also found administrative support to strongly affect lower intention to leave. Scafidi, Sjoquist, and Stinebrickner (2007) found that “teachers are more likely to leave schools with lower test scores, lower income, or higher proportions of minorities” (p. 145). It is also well-established that urban and rural schools face higher turnover than suburban schools (Holme et al., 2018). Loeb et al., (2005) found that large class sizes and lack of physical resources and supplies are strong and significant factors in predicting high TOs, with an underlying element being inadequate school funding. Similarly, while not the sole factor, teacher compensation continues to be a significant factor for teacher retention (Springer and Taylor, 2021).
Based on the literature and for the sake of parsimony, we include the main and available measurements for districts’ socio-economic and demographic characteristics as follows: dummies for rural, suburban, town, and city areas representing the district locale (with town as the omitted variable); the ratio of the number of students to the number of teachers (student–teacher ratio), graduation rate of students, student poverty rate, percentage of non-white students, and the interaction term between poverty and graduation percentages. In addition, we add districts’ per-pupil revenue, per teacher expenditure, and beginning salary of the teachers as the financial and economic control variables. For the poverty percentage, we utilize the ratio of the estimated population of children at 5–17 in poverty to the total estimated population of children at 5–17. The districts' expenses are considered in aggregate in the analyses rather than in its factors due to the lack of availability of detailed data for the period under study for the specified level (e.g. benefits, salaries).
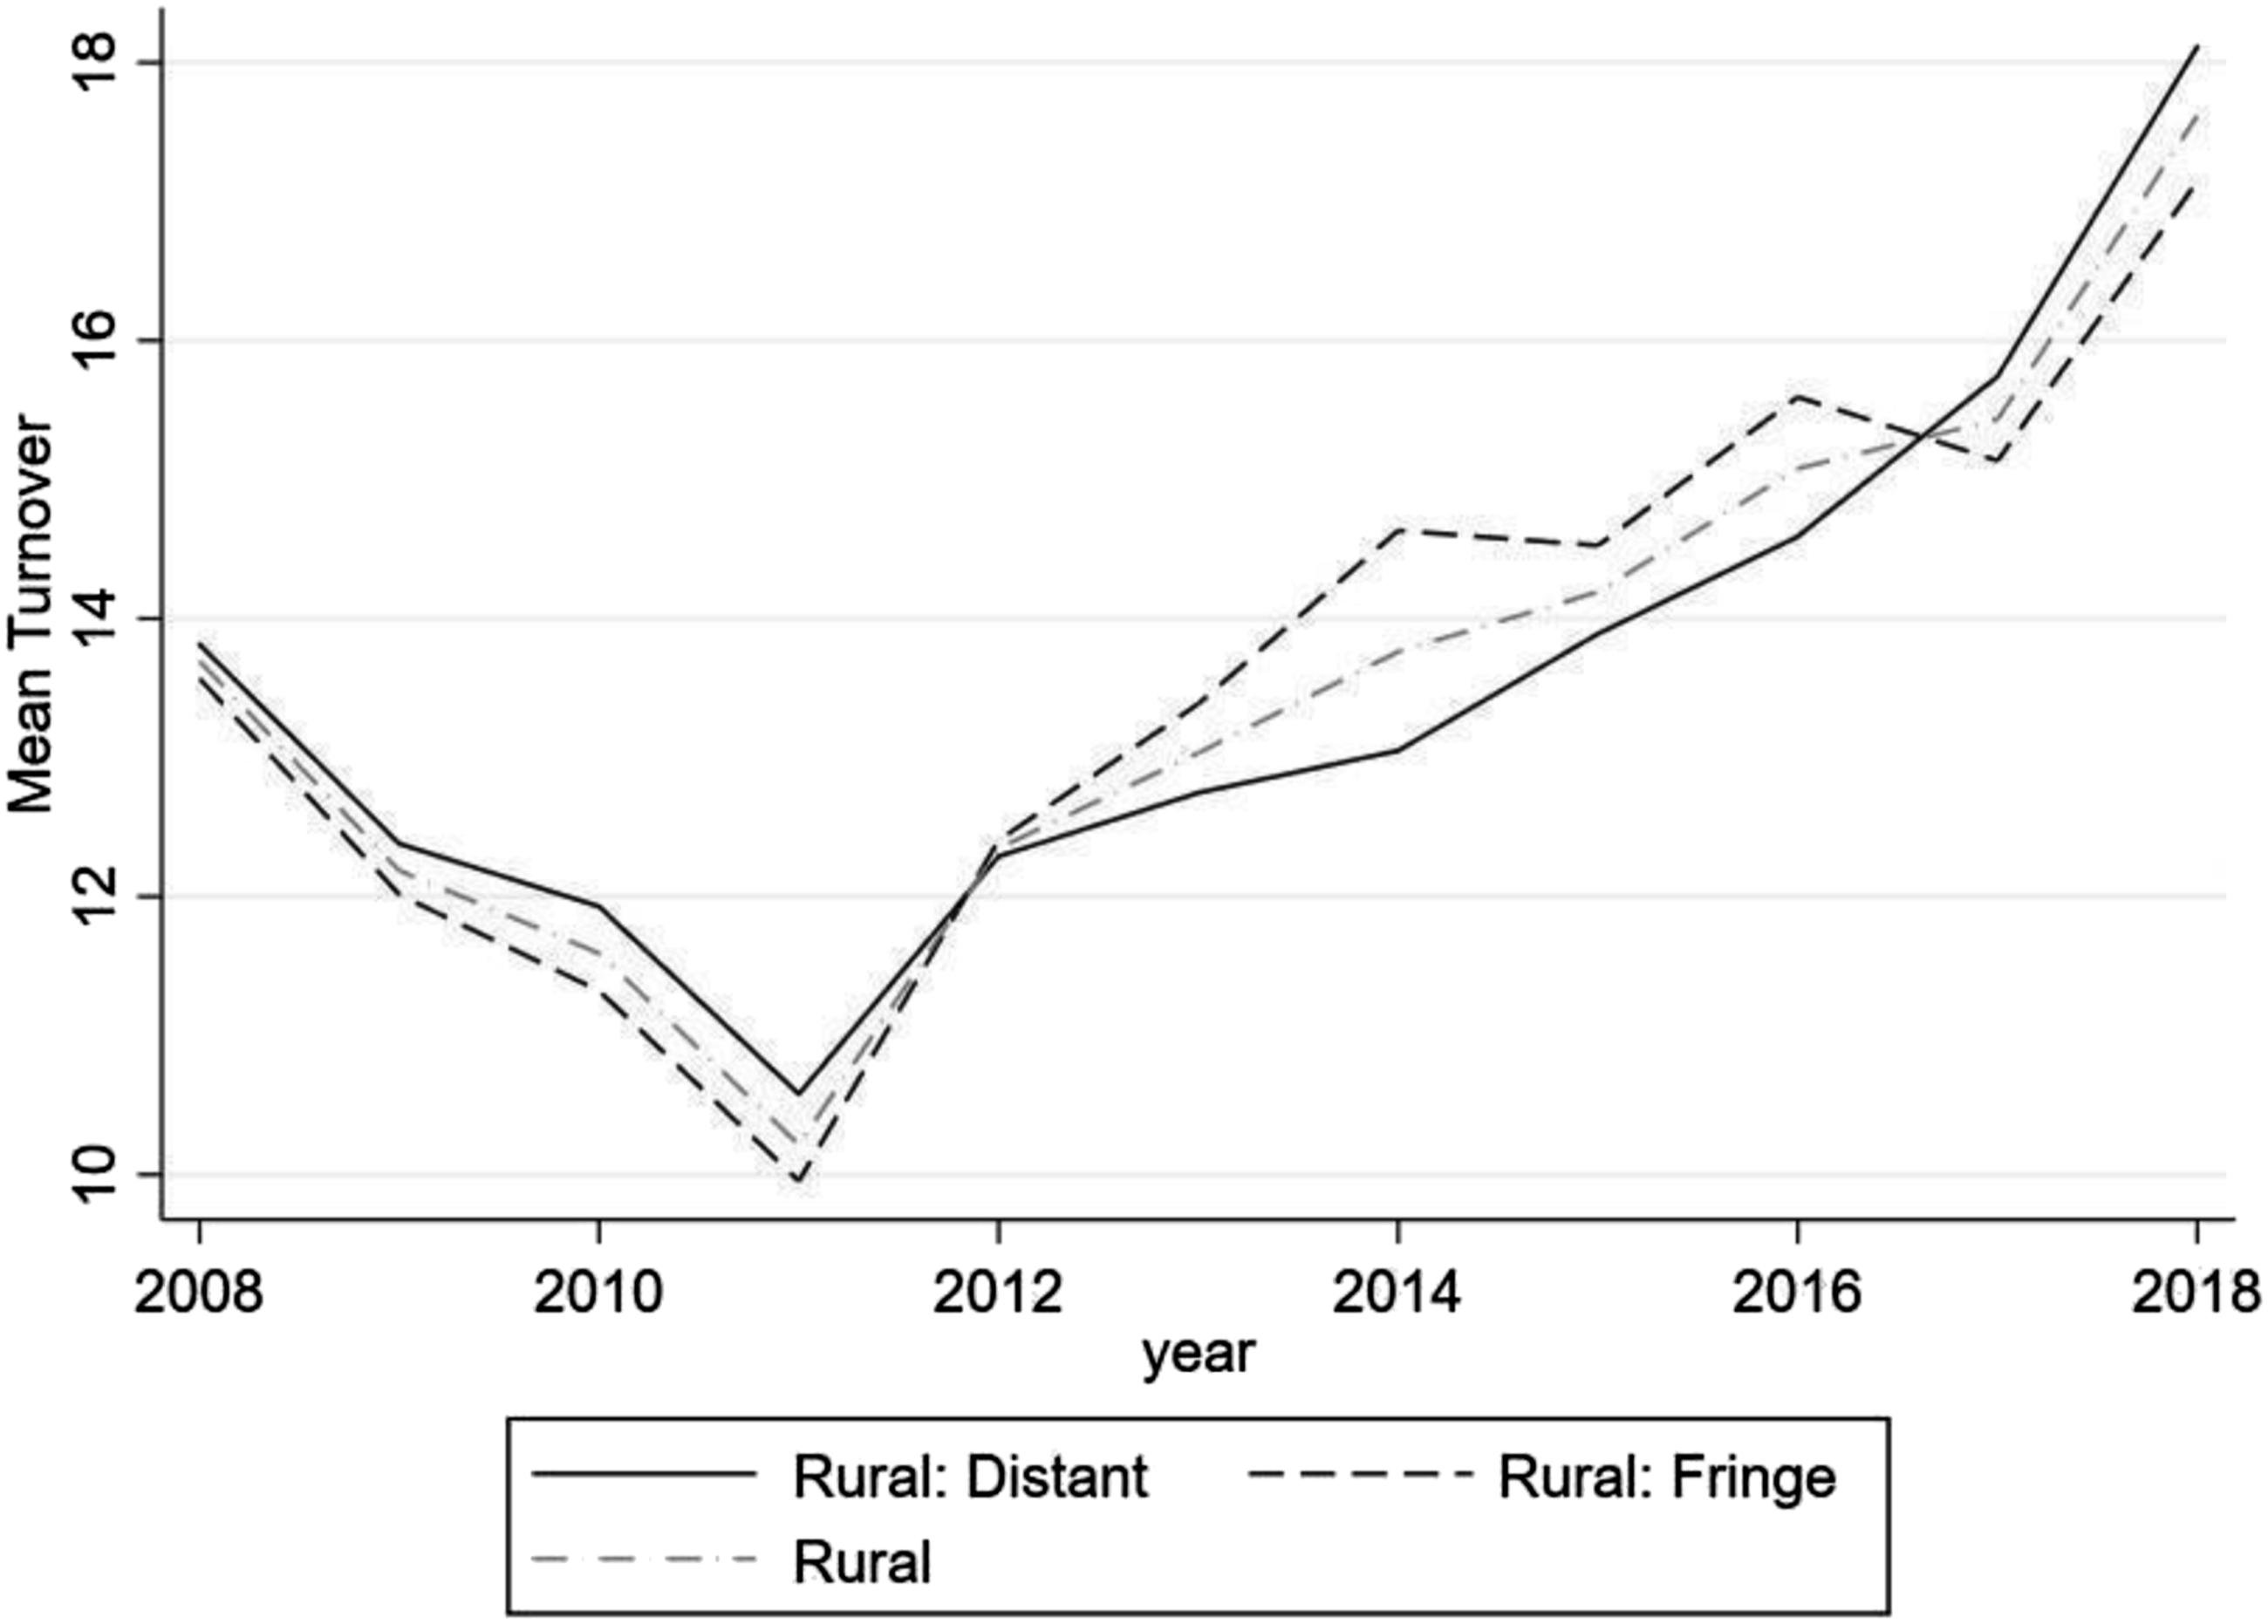
The correlation assessment among the variables shows that the percent of non-white students, poverty percent, and federal revenues of the districts are highly correlated with the outcomes; their correlation with TOs are 69, 51, and 63%, respectively. Inclusively, the partial R2 also confirms the importance of control variables in this analysis: percent non-white with a partial correlation of 45% and rural locale with a partial correlation of 20% can be considered important confounders that should be controlled (Cinelli and Hazlett, 2020). Additionally, the literature shows that the districts in different locales experience different challenges to their staffing outcomes. Figure 2 presents the average TO for cities, towns, suburbs, and rural districts. While the average trends for TOs are similar in different regions, both are higher in rural than nonrural regions during the period under study. The average TO by distant and fringe rural districts are reported in Figure 3. Average turnover rate based on locale. Average turnover rate for different rural districts.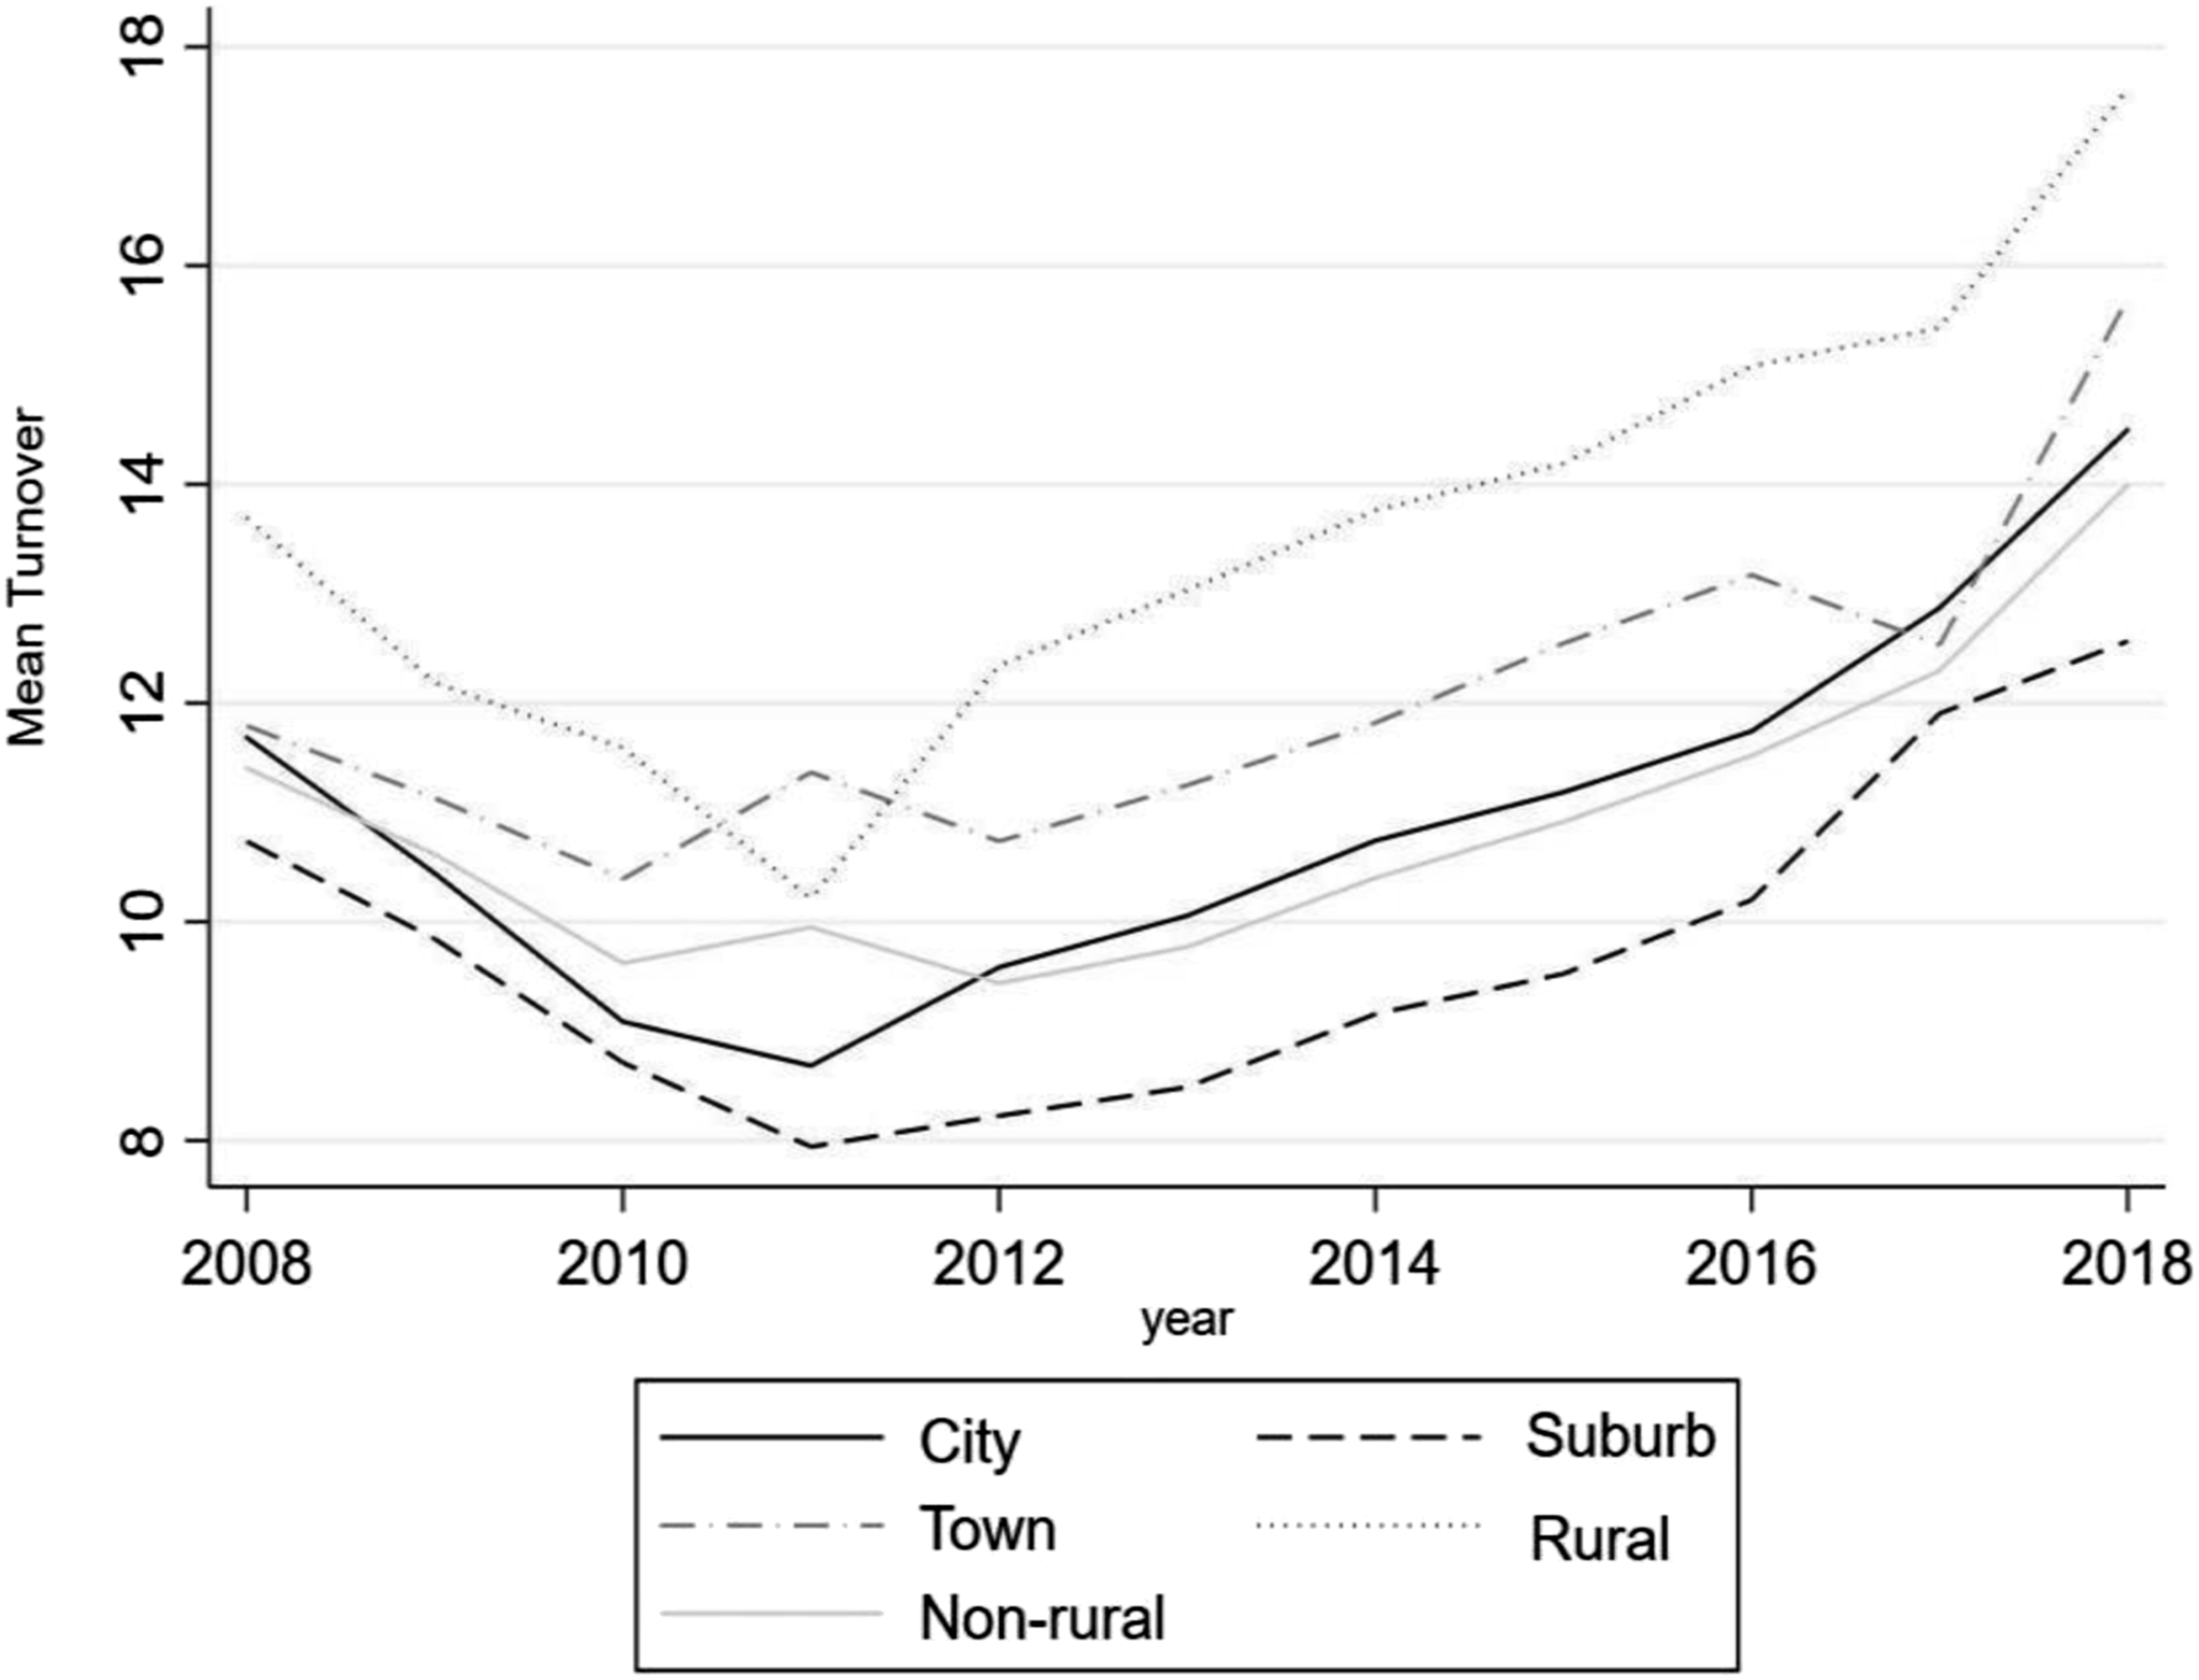
Descriptive statistics
Descriptive summary statistics.
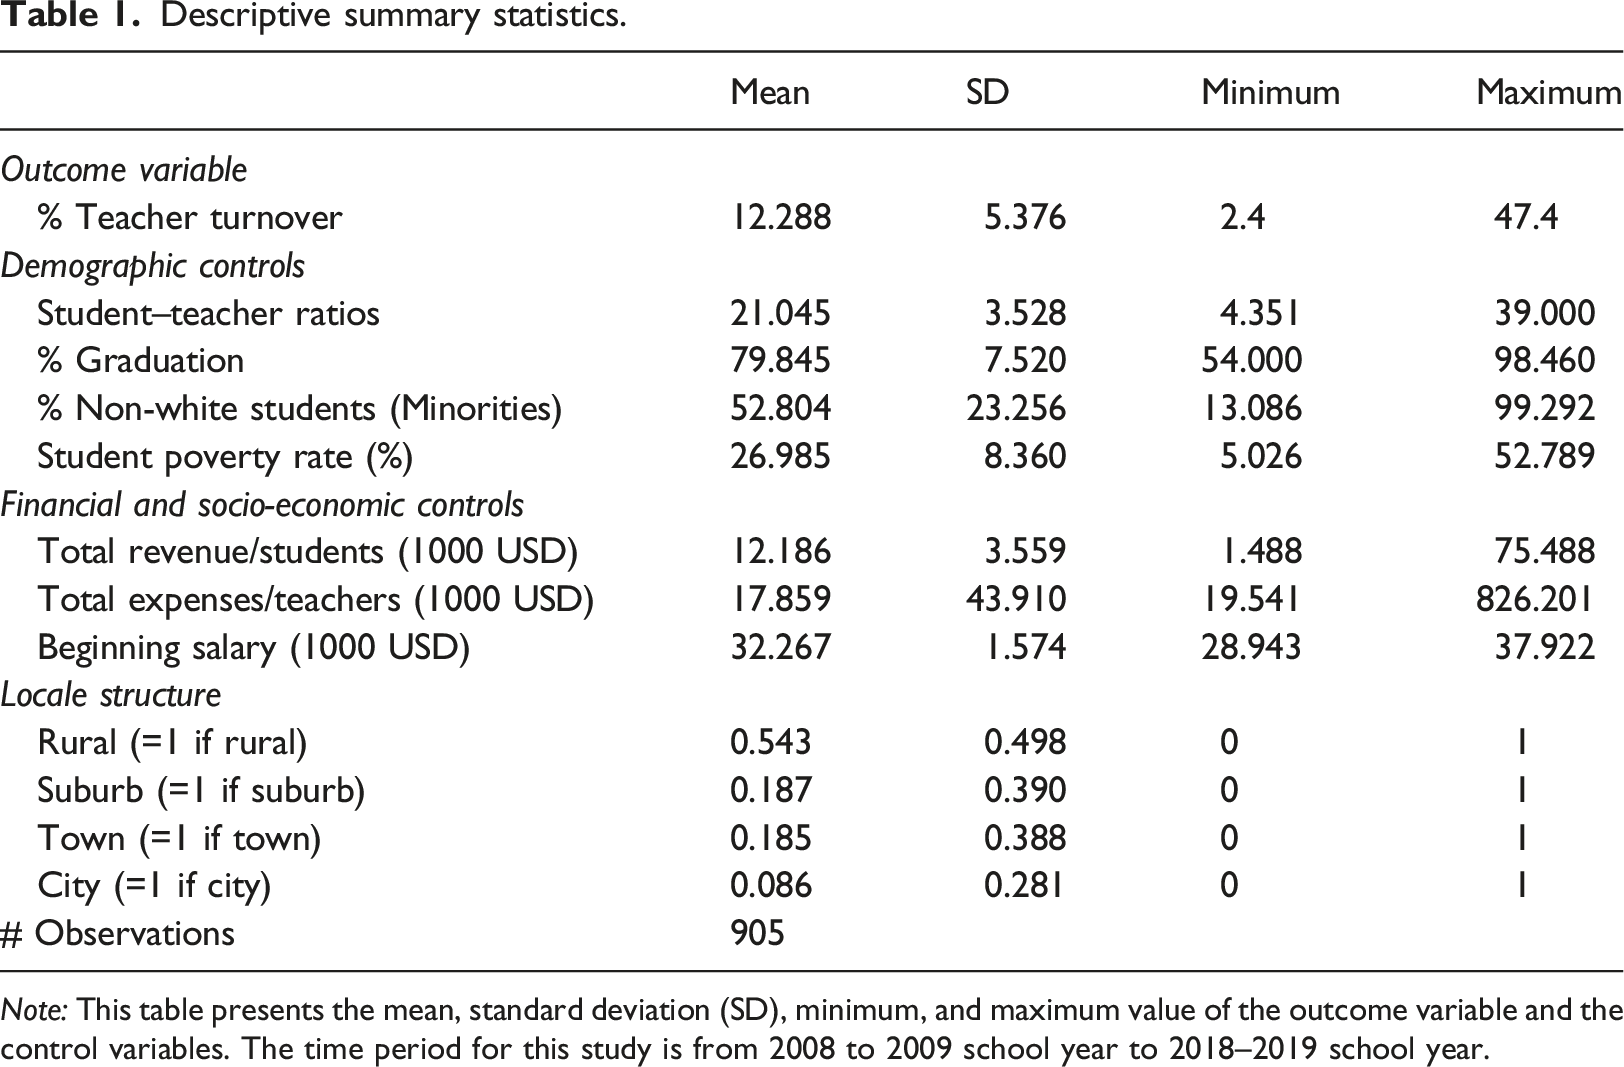
Note: This table presents the mean, standard deviation (SD), minimum, and maximum value of the outcome variable and the control variables. The time period for this study is from 2008 to 2009 school year to 2018–2019 school year.
Descriptively, the outcome variables are exacerbated over time, both before and after the implementation of the policy (table 1). That is, an increasing teacher TO trend exists after the 2010/2011 school year. Hence, it is important to include the control variables to close any possible backdoor effect on the outcome variables, account for any factor affecting teacher turnover, and ascertain the exact effect of policy on the outcomes.
Empirical methodology
This study examines changes in teacher staffing rates in RRI-eligible districts in South Carolina to identify the impact of districts’ receipt of RRI funds. RRI was designed to alleviate teacher staffing issues in districts facing the most severe teacher turnover in South Carolina. The appropriated bill for 2015/2016 differed from the following years, with the eligibility cutoff of districts being lowered from 12% teacher turnover in 2015/2016 to 11% in 2016/2017, which has remained constant through the years of our analysis.
The arbitrary cutoff for the districts’ eligibility in the RRI program provides a suitable setup to study the impact of financial incentives on the number of teachers leaving schools, mitigating selection bias issues. Although the data in this study includes all districts in South Carolina, which can be considered a population study rather than a sample experiment, we treat the data as a sample in time, and the applied methodology is designed to respond to issues of endogeneity and selection biases so that the results can be generalized to other similar contexts across the nation.
In this study, we implement a design of an Arellano–Bond dynamic panel with a difference-in-differences model, as seen in the baseline model in equation (4)
This identification follows a difference-in-differences framework. We use a before and after design in this identification. The district fixed effect is estimated in the equation with
We include control variables in the estimations to rule out any backdoor effect of confounders and obtain a more precise estimated treatment effect. This is especially important because the literature and partial correlation assessment results confirm the importance of certain control variables that could influence the sensitivity of results if they are not accounted for (Cinelli and Hazlett, 2020). In the above equation,
As the district’s eligibility to receive funding depends on their prior 5-year retention, the DV, TO, is not independent of its previous values. Additionally, the TO is increasing over time, so we test for a potential autocorrelation in the TO. The results indicate that the TO is serially correlated. The past history of a district influences the teacher turnover in a year. For instance, teachers deciding to leave their job is affected by their coworkers and the other teachers leaving the school in previous years. Therefore, lags in TO in the estimations account for the other factors and the autocorrelation problem. But when the regressors include the lagged DVs, the estimators of a standard panel data model (ordinary least square–OLS) will be upwardly biased and inconsistent due to the serial correlation between the lagged DV and error term (Cameron and Trivedi, 2005).
To address the issues with a dynamic model, we employ an instrumental variable (IV) variant that can lead to consistent estimates; that is, the lags of variables can play the role of instruments for the unobserved factors in a first difference model. However, these complications preclude the use of a regression discontinuity design. Rather, an Arellano–Bond dynamic panel estimator with a Generalized Method of Moments (GMM) and a more efficient Maximum Likelihood Estimation method (MLE) with better finite-sample performance is exploited in this study to show the variation effects in the TO of teachers in districts. In the equation,
Ordinary least square estimation of dynamic models with short T yields biased coefficients. The predominant estimation technique in empirical research is the GMM. An alternative, more efficient method is the limited-information quasi-maximum likelihood (QML) (Hsiao et al., 2002). In this study, we report the estimation results from estimating an OLS difference-in-difference estimation and a dynamic panel using both GMM and MLE methods.
Phillips–Perron unit-root test results (with and without trends).
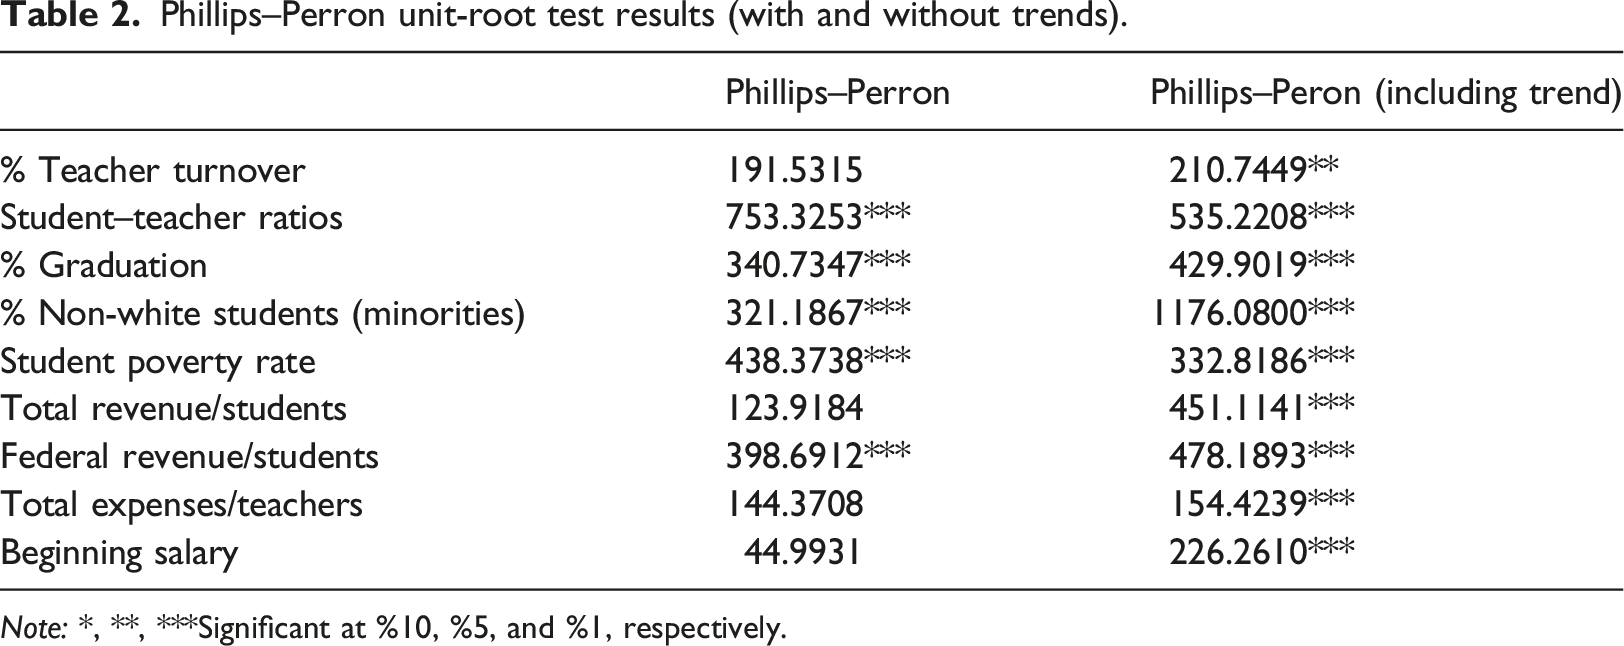
Note: *, **, ***Significant at %10, %5, and %1, respectively.
Results
Estimation results for the effect of RRI program on teacher turnover.
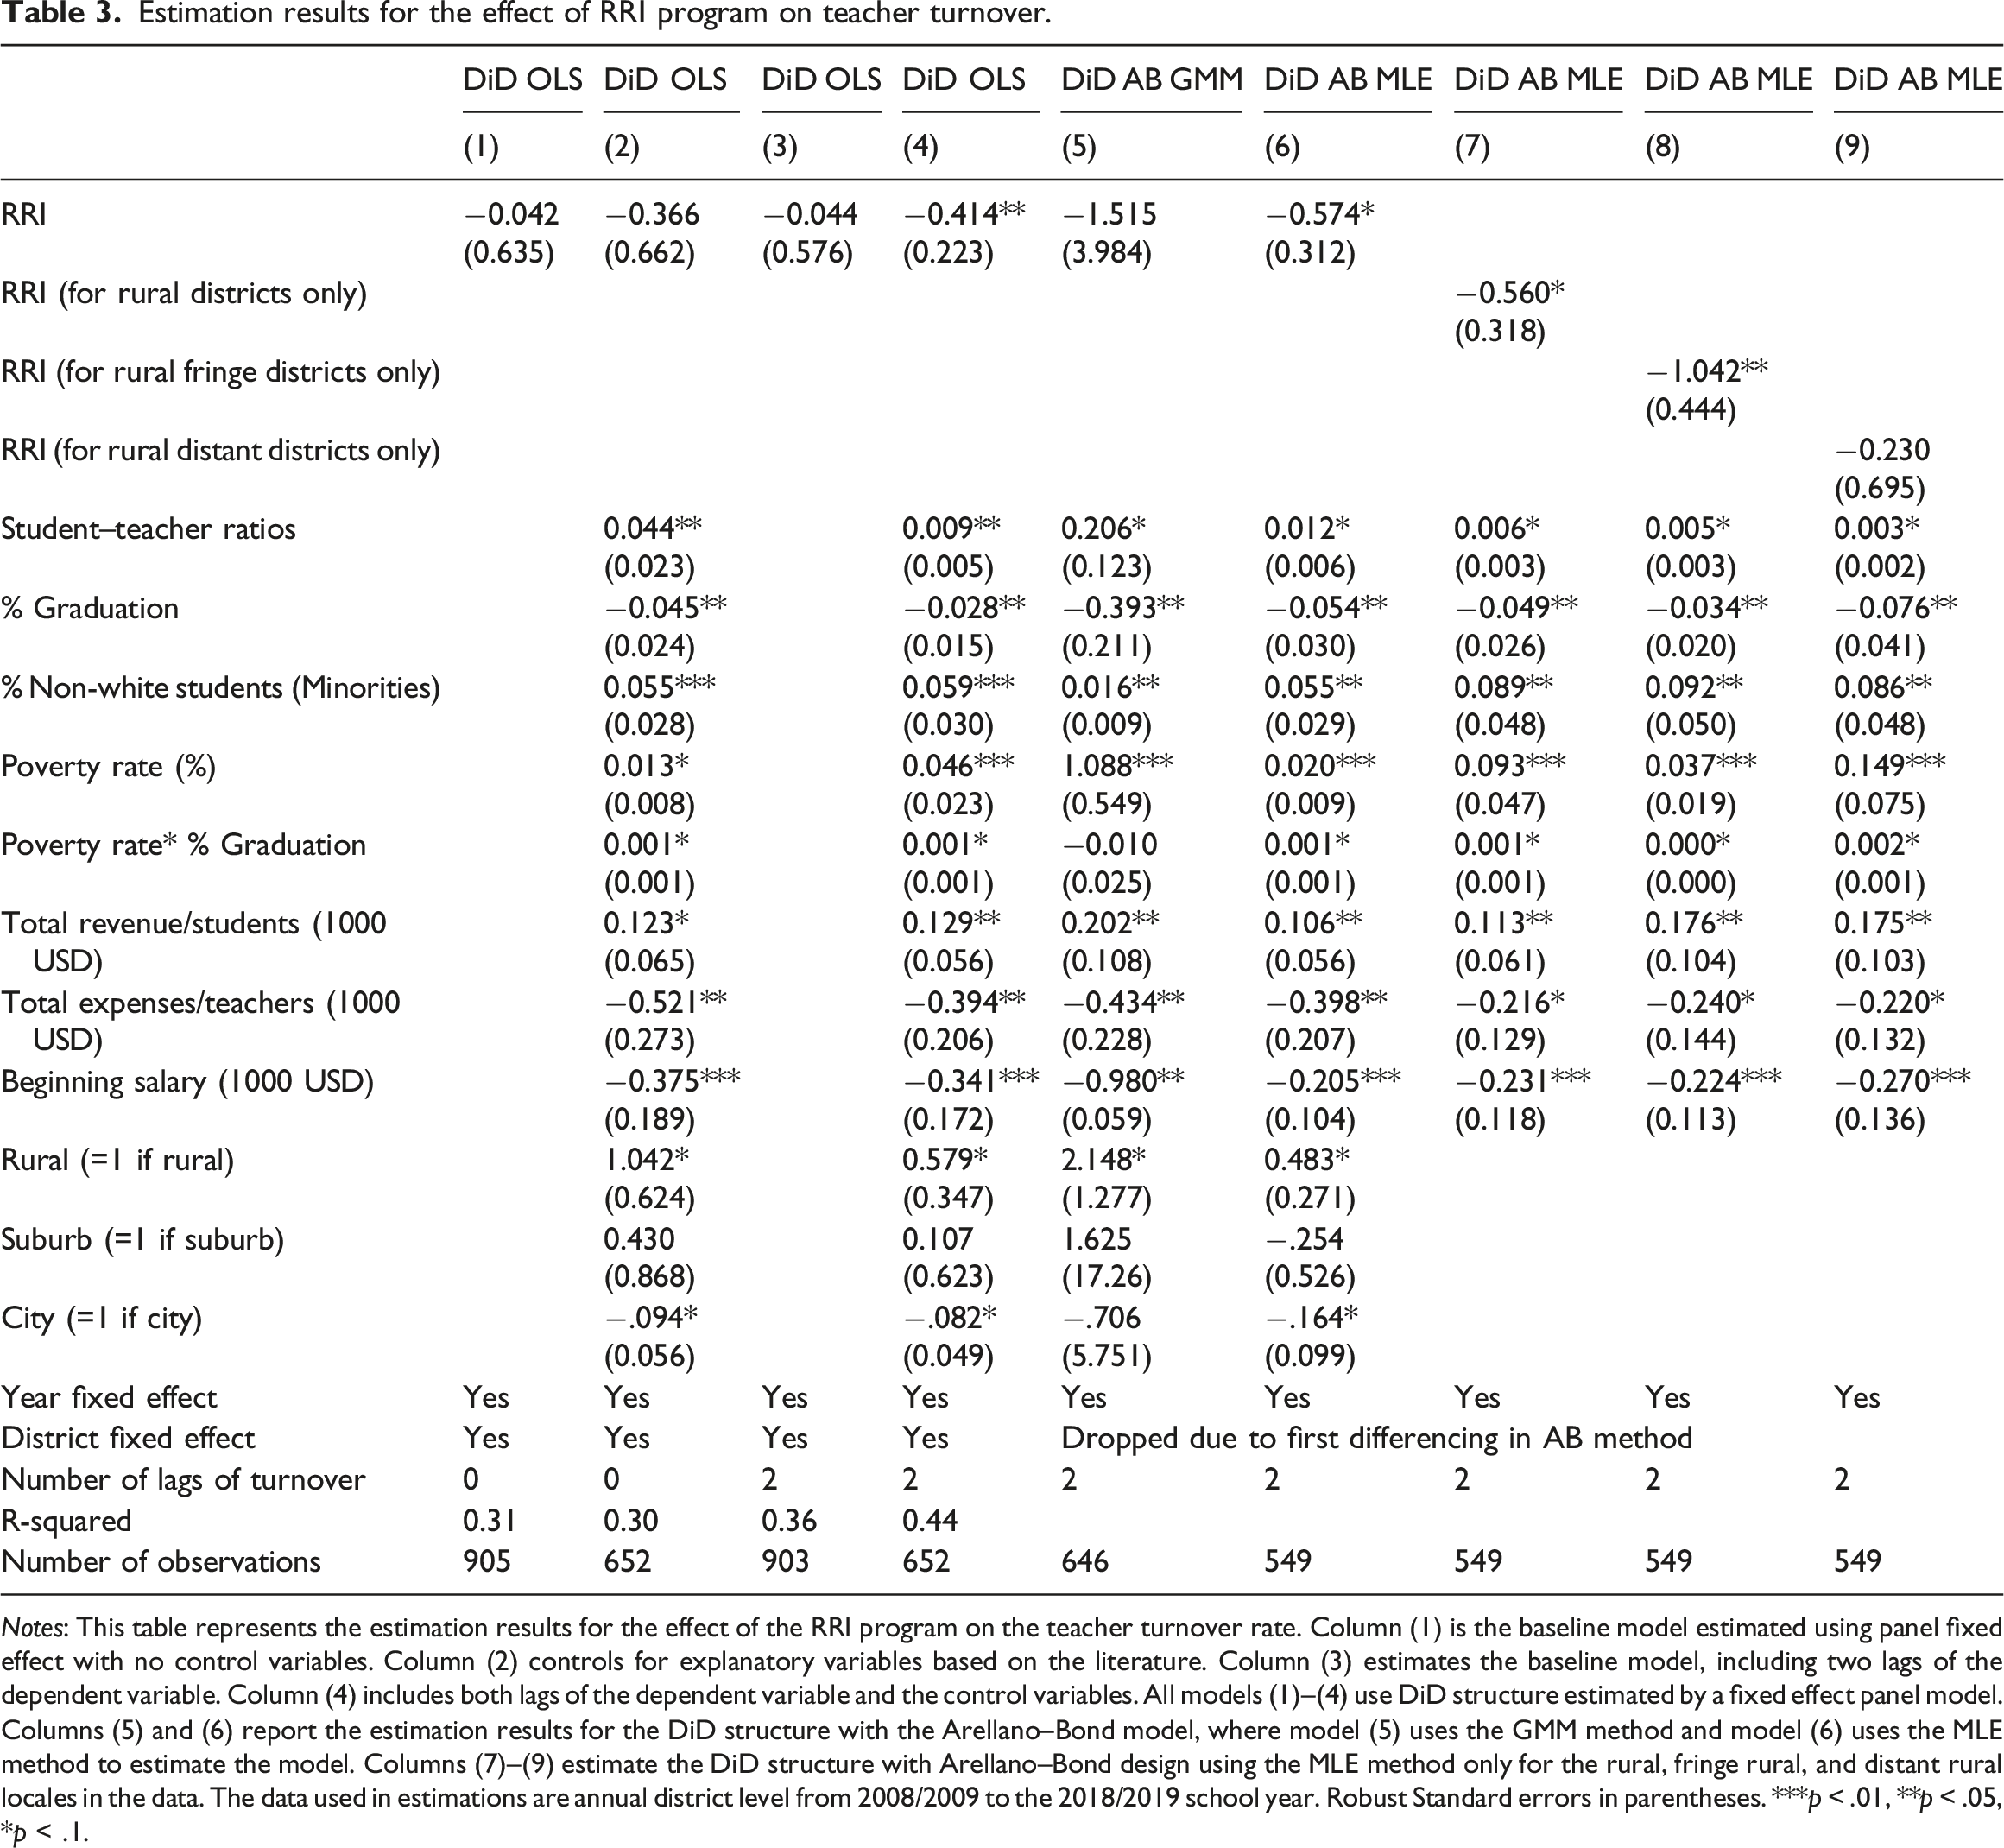
Notes: This table represents the estimation results for the effect of the RRI program on the teacher turnover rate. Column (1) is the baseline model estimated using panel fixed effect with no control variables. Column (2) controls for explanatory variables based on the literature. Column (3) estimates the baseline model, including two lags of the dependent variable. Column (4) includes both lags of the dependent variable and the control variables. All models (1)–(4) use DiD structure estimated by a fixed effect panel model. Columns (5) and (6) report the estimation results for the DiD structure with the Arellano–Bond model, where model (5) uses the GMM method and model (6) uses the MLE method to estimate the model. Columns (7)–(9) estimate the DiD structure with Arellano–Bond design using the MLE method only for the rural, fringe rural, and distant rural locales in the data. The data used in estimations are annual district level from 2008/2009 to the 2018/2019 school year. Robust Standard errors in parentheses. ***p < .01, **p < .05, *p < .1.
In all models, we control for year fixed effects and district fixed effects, and the standard errors are clustered at the district level. The data is at the annual district level for all variables, including DVs, control variables, and the treatment also occurs annually at the district level. Models (2) and (4) control for district locale (rural, suburb, city, and town), student–teacher ratio, graduation percent of students, percent of non-white students, poverty percent, an interaction term between poverty rate and graduation percent, district revenue per pupil, district expenses per teacher and beginning salary of the teachers. The consistency of the sign of the control variables and their significance indicates that the control variables are important to close the backdoor effects of other factors on the teacher TO.
Model (5) is the DiD structure estimated using the Arellano–Bond dynamic panel by the GMM method. Model (6) estimates the DiD structure with the Arellano–Bond design using a maximum likelihood method.
Due to the consistency of MLE methods, we use the Arellano-Bond design estimated using the MLE method for the models (7)–(9). Models (7)–(9) estimate the effect of the RRI program on teacher turnover for the rural areas only. The program was designed to specifically target districts with staffing shortages, most of which are located in the state’s high-poverty rural areas (as evident by the labeling of “Rural” in the policy’s name: RRI). Therefore, we separately estimate the DiD model for rural, fringe rural, and distant rural areas, reported in columns (7)–(9) Table 3.
The estimated treatment effects vary across different specifications, suggesting the importance of confounders in the analysis. Model (6), which encompasses all the control variables based on the literature and is estimated using an asymptotically consistent Maximum Likelihood estimator method for a dynamic panel with a difference-in-difference structure, is our preferred model.
Based on model (6) results, the teacher TO is reduced by 0.57% in each district, significantly at a 90% confidence interval under the condition of ceteris paribus and, on average, following the implementation of the RRI policy.
Furthermore, targeting the effects in rural areas, the teacher TO declined significantly at a 90% confidence interval by 0.56% on average in each district after implementing the funding policy. In addition, consistent with the literature, fringe and distant rural districts are affected differently by the treatment. The results in models (8) and (9) indicate that the teacher TO in rural fringe districts is significantly reduced by 1.04 percentage points, on average, following the policy implementation, but we cannot reject the null hypothesis that the treatment effect in distant rural districts is different from zero.
Model (6) in Table 3 shows that the teacher TO is reduced by 0.57% on average, significantly at a 90% confidence interval. This number is statistically significant but economically is very small. In an average district with 600 teachers and an average retention rate of 87% (the average value for the whole sample), being disbursed in the RRI program is associated with a 0.57% reduction in the teacher TO on average. Further, 0.57% of the total number of teachers is about 3.42 teachers. The effect in the rural districts is the same: teacher turnover is reduced by 0.56% after the district receives the RRI program disbursement. But this coefficient is higher for rural fringe districts.
Robustness checks
Robustness checks.
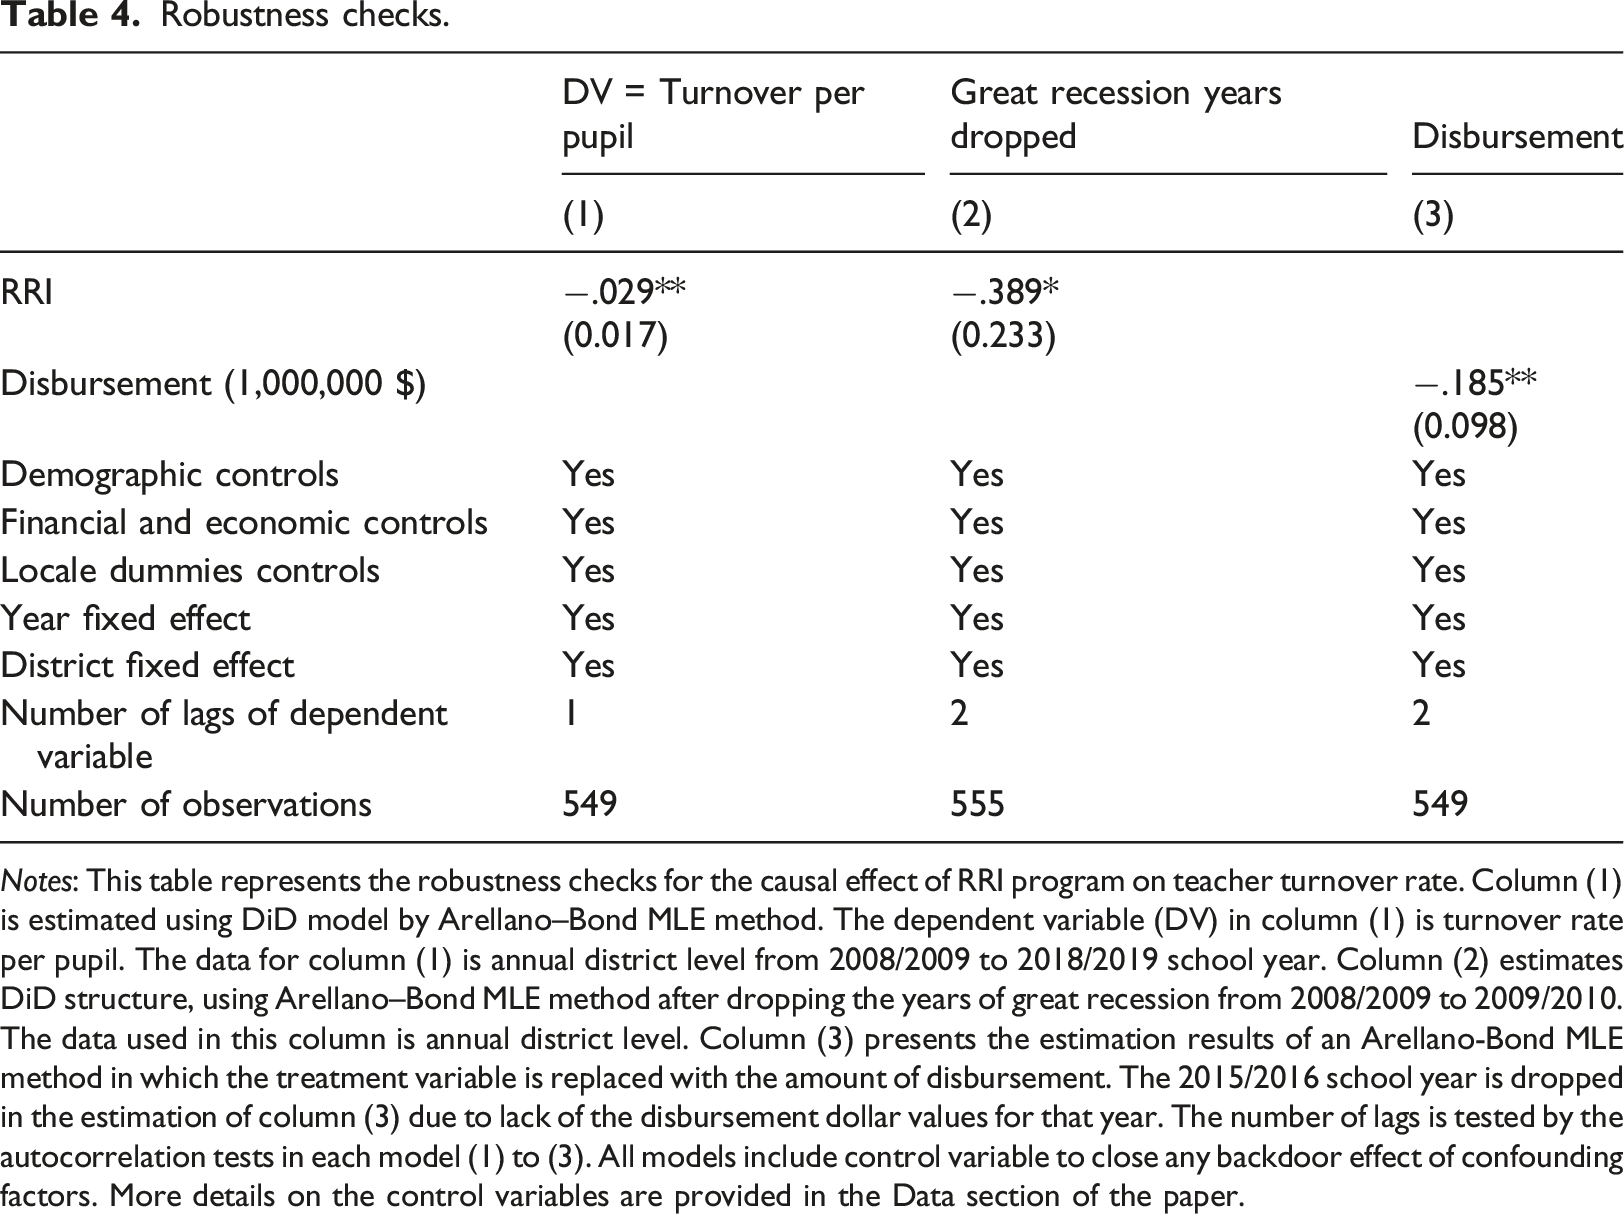
Notes: This table represents the robustness checks for the causal effect of RRI program on teacher turnover rate. Column (1) is estimated using DiD model by Arellano–Bond MLE method. The dependent variable (DV) in column (1) is turnover rate per pupil. The data for column (1) is annual district level from 2008/2009 to 2018/2019 school year. Column (2) estimates DiD structure, using Arellano–Bond MLE method after dropping the years of great recession from 2008/2009 to 2009/2010. The data used in this column is annual district level. Column (3) presents the estimation results of an Arellano-Bond MLE method in which the treatment variable is replaced with the amount of disbursement. The 2015/2016 school year is dropped in the estimation of column (3) due to lack of the disbursement dollar values for that year. The number of lags is tested by the autocorrelation tests in each model (1) to (3). All models include control variable to close any backdoor effect of confounding factors. More details on the control variables are provided in the Data section of the paper.
Model (2) estimates DiD structure using the Arellano-Bond MLE method after dropping the great recession years from 2008/2009 to 2009/2010. The data used in this column are annual at the district level. The sign of the coefficient is robust to the sample change. The RRI program reduces the teacher TO by 0.39% on average and significantly at a 90% confidence interval.
Model (3) presents the estimation results of an Arellano-Bond MLE method in which the treatment variable is replaced with the amount of disbursement. The 2015/2016 school year is dropped in column (3) estimation due to the lack of the disbursement dollar values for that year. The results are robust to the new dataset and change of the definition of the treatment variable. Using the disbursement dollar amount as the alternative treatment variable, the TO declined significantly by 0.18% on average and at a 95% confidence interval.
The autocorrelation tests test the number of lags in each model (1) to (3). All models include control variables to close any backdoor effect of confounding factors. More details on the control variables are provided in the Data section of the paper. It is important to note here that a caveat for this study is the small number of observations for the MLE method.
Discussion
In response to teacher shortages, government entities worldwide have invested in teacher staffing policies to recruit and retain teachers in their hard-to-staff schools (Feng and Sass, 2018; Mirhosseini et al., 2021; Springer et al., 2016). In this study, we assessed the causal effect of one type of state-level teacher staffing initiative for hard-to-staff school districts that provides state-identified districts with high staffing needs funds and autonomy of its usage to support teacher staffing. Our results prove that the policy initiative increased teacher retention in the period RRI was assessed. Specifically, our results suggest that RRI is associated with a reduced teacher turnover by less than 1% (0.57%) in South Carolina. Findings such as these are important because they highlighted the potential and missed opportunities associated with state funding intervention efforts to improve teacher shortages in school districts facing teacher staffing challenges.
The small effect of RRI on teacher turnover might have been due to the overwhelming impact of other deterrent factors, such as poor economic conditions and employment unattractiveness in the target school districts, that the financial program in this research was unable to more substantively mitigate. This could be the case given the limitations to the RRI budget amount, which was spread among an escalating number of funding eligible districts. Specifically, while funding was expanded from the initially $1,500,000 in FY16 to the stagnant $9,748,392 for FY17, FY18, and FY19, the number of RRI-funded districts has risen from 20 in FY16 (12% cutoff) to 28 in FY17 (11% cutoff began), 30 in FY18, and 36 districts in FY19. Funding was reduced to $7,598,392 for FY20 for the 81 school districts in South Carolina.
In a separate study (Tran and Smith, 2021), we surveyed RRI-funded districts about barriers they faced with optimizing the use of RRI funds. While district administrators were often grateful to be receiving any additional funding, many noted the inadequacy of the funds to resolve their teacher staffing dilemmas. For example, without a larger amount of funding or at least a guarantee of continued funding every year, one administrator from an RRI-funded district noted that he could not risk funding longer-term strategies like a grow-your-own initiative for teacher staffing, even though research suggests that teachers prefer to be employed close to home (Reininger, 2012). The inadequacy and lack of annual reliability of funding results in practical limitations concerning what teacher staffing policies and strategies districts can implement. This leads to districts utilizing funds for teacher staffing related to items that may be helpful but potentially not the most optimal use of funds. Collectively, our work suggests for future researchers the importance of understanding program effectiveness and why results are the way they are.
Conclusion
South Carolina’s RRI policy is uncommon in that it does not direct a specific use of the funding towards improving teacher recruitment and retention. Rather, it provides additional funding to eligible districts for use at their discretion towards improving teacher staffing outcomes. Because teacher labor markets are hyperlocal (Reininger, 2012) and teacher staffing issues vary by local conditions (McVey and Trinidad, 2019), this would be an ideal policy model with adequate and dependable funding. But the reality of funding limitations creates a situation in which districts make trade-off decisions based on the funds available at the given time. States could improve districts’ use of funds by (a) assuring dependable, consistent funding, (b) providing adequate funding (the amount of which should be assessed by future research), and (c) providing districts evidence-based information to help guide them on selecting the highest potential strategies for their funds.
Our study results indicate a minor effect for RRI on teacher turnover with its current funding level, which might suggest a larger impact on teacher recruitment and retention if more funding was available. The optimal amount of required budget to improve the recruitment status needs should be assessed in future studies. Furthermore, analysis is required to calculate the effect of a variation in the funding value and amount to the eligible districts on teacher employment outcomes. Finally, while this study assessed 4 years of RRI implementation (from 2015/2016 to 2018/2019), a longer duration of the policy’s implementation would provide a more accurate picture of its long-term effectiveness. This is especially the case because many teacher employment initiatives (such as grow-your-own programs) require more time to cultivate their effects and because year one of the RRI implementation was exploratory in nature, with program coordinators and districts still learning to navigate the initiative. Ultimately, the RRI program has shown promise but may need more time and funding to reach its potential.
While many states face severe teacher staffing challenges, those problems are expected to worsen in the foreseeable future. EdWeek Research Center conducted a national survey of 826 K-12 educators across the United States in August 2020 to understand the impact of the COVID-19 pandemic on the teacher workforce. They found that 32% of teachers reported they were likely to leave their jobs this year, even though they were unlikely to leave pre-pandemic (Kurtz, 2020). They also found that teacher morale and preschool enrollment have declined, and more than 80% of educators reported that students are making less academic progress than before the pandemic. Similarly, the American Federation of Teachers’ 2020 survey of 816 public school teachers across the United States reported that 1 in 3 teachers are more likely to retire from teaching earlier than planned (Hart Research Associates, 2020). These findings provide insight into the future direction of teacher staffing challenges in the United States and worldwide, and the conditions will surely be worse for historically hard-to-staff schools. All of this points to teacher supply issues being worse off for those schools recovering from the COVID-19 pandemic than before. Policymakers should be proactive in their support of school districts. Research evidence, such as the ones provided in this study, can help policymakers in helping school districts with their staffing dilemmas.
Footnotes
Author’s Note
This submission has not been published elsewhere, is not presently under review elsewhere, and will not be submitted elsewhere while under review.
Declaration of Conflicting Interests
The author(s) declared no potential conflicts of interest with respect to the research, authorship, and/or publication of this article.
Funding
The author(s) disclosed receipt of the following financial support for the research, authorship, and/or publication of this article: The research was partially funded by the South Carolina Education Oversight Committee.