
Abstract
As districts across the United States move to implement comprehensive computer science education (CSed) initiatives, there is increasing interest in utilizing data-informed strategies such as continuous improvement to address systemic inequities. However, the specifics of how education institutions move from collecting and monitoring data into processes of systems improvement are not straightforward. This study explores the critical intermediary step of diagnostic problem framing which connects the collection of data to the identification of root causes of inequities so that adequate action can be taken to change an instructional system. Without taking the step of diagnostic problem framing, district leaders run the risk of using data to change systems in ways that simply reproduce or worsen existing inequities. Through four cases from three school districts implementing comprehensive (e.g. K12, at scale) CSed initiatives, we explore the dynamics of diagnostic problem framing around each of the four phenomena related to equitable CSed as specified in the CAPE framework: system and teacher
Keywords
Introduction
This study explores how district leaders use data to identify underlying root causes of inequities in the context of district-wide K12 computer science education (CSed) initiatives, highlighting exemplars of data use practices, along with contextual dynamics that supported and mediated the possibilities of using data to understand causes of inequities.
As efforts to transform K12 school systems to include equitable CSed have spread in the United States, there is increasing interest in utilizing data-driven strategies such as continuous improvement (DeLyser et al., 2020). Acknowledging that simply making CS learning opportunities available to students is insufficient, Fletcher and Warner (2020) provided a model encouraging education institutions to monitor data on four equity-oriented phenomena in order to advance equity-related goals: system and teacher
In this study, we focus on the critical intermediary step of diagnostic problem framing in which a problem is interpreted in ways that determine its parameters and responsible stakeholders (Coburn et al., 2009; Snow and Benford, 1992). Within decision-making processes, diagnostic problem framing sits between monitoring data and taking action to change an element of an instructional system. We explored the work district leaders perform to investigate the root causes of inequities within the context of comprehensive CSed initiatives. Our results highlighted how data on their own did not offer clear-cut implications for where and how to intervene in an instructional system to reduce inequities. We addressed the following questions: 1. How do district actors utilize data infrastructures and routines in order to understand possible root causes of inequity within comprehensive CSed initiatives? 2. What factors support or mediate such processes of diagnostic problem framing?
This study draws on data from four retrospective case studies from three school districts of varying size, region, and demographics. Each has implemented CSed initiatives for at least 2 years, providing a robust opportunity to examine variations in data use practices as they enacted multi-year reforms. Through interviews and district provided documentation, we collected data on how districts both conceptualized and addressed issues of equity in terms of who had access to CS, how CS was taught, and what computer science was taught (Santo et al., 2019). We selected cases related to one of each of the four phenomena outlined by Fletcher and Warner (2020) in the CAPE framework—system and teacher capacity, student access, participation, and experience. Next, we analyzed each case in terms of the institutional dynamics at play—organizational relationships, routines, roles, interpretation, learning, and decision-making—within the process of diagnostic problem framing and identification of causes of inequities that district actors observed in their data.
Our findings highlight five specific factors that mediated processes of diagnostic problem framing: (1) conceptualization of equity as a multifaceted phenomenon, (2) problem attribution to systems, not students, (3) ability to analyze data for indicators of inequities, (4) knowledge of local instructional systems, and (5) embeddedness in instructional networks. Problem attribution to systems, not students, is of particular importance in the context of Computer Science education reform efforts given the persistence of identity stereotypes about which students Computer Science is for, and which it is not (Lewis et al., 2016). The need for an orientation toward diagnostic problem framing is reinforced by prior research, as detailed in the background section below, that shows how school leaders can use data in ways that reproduce, rather than counteract, inequitable narratives, practices, and systems that negatively impact students (Datnow and Park, 2018; Dodman et al., 2021; Safir and Dugan, 2021).
Our results affirm the importance of developing robust data systems in CSed initiatives, but also show how attention to broader institutional factors and root causes can improve the capacity of these systems to address inequities.
Background
Within the field of computer science education, emerging scholarship as well as practitioner approaches have attended to whole district change as a critical site of intervention (e.g. Fanscali et al., 2018; Goode and Margolis, 2011; Proctor et al., 2019; Reed et al., 2015; Santo et al., 2020). Often, these efforts actively draw from frameworks around institutional learning and reform that have been established in other areas such as data-driven decision-making (DeLyser and Wright, 2019; DeLyser et al., 2020; Santo et al., 2019). Although data-driven approaches to reforming educational institutions vary in their size, scope, and strategy, policy discourse and data use guides tend to portray data-driven decision-making as an iterative cycle of the following steps: collecting and monitoring data to evidence problems such as disparate educational outcomes for students; characterizing the problem and solution space to identify root causes and responsible stakeholders; and taking action within the system to respond effectively to the problem (Coburn et al., 2009; Dodman et al., 2021).
The focus on district-level change in this study is set within a broader context of the Computer Science Education (CSed) field, which has actively been oriented toward issues of historical inequities within computing (Margolis et al., 2017; Master et al., 2016). Within CSed, there has been a need for frameworks that address the question of what forms of data might be collected related to equitable implementation at scale within school systems. One prominent framework, CAPE, which was developed in the context of the Expanding Computing Education Pathways Alliance (Ericson et al., 2016; Leftwich et al., 2020), offers four areas of focus for equity-centered systems change data: system and teacher capacity, student access to learning, participation in learning by subgroups, and quality of student experience in learning (Fletcher and Warner, 2020). Within this framework, these four areas are referred to as capacity, access, participation, and experience (CAPE) respectively.
Using the CAPE framework, then, can guide district leaders in their efforts to create whole district change that addresses inequities at multiple levels in their CSed work. The scholarship on data-driven approaches to institutional change offers wide-ranging practical guidance for how to collect and monitor data that could be applied to measuring capacity, access, participation, and experience. Scholars have shared guidance, for example, on how to build data infrastructures (Datnow et al., 2007), have leadership that promotes data use (Copland, 2003; Halverson et al., 2007), and establish organizational routines of data use and interpretation (Boudett et al., 2020; Spillane, 2012). Likewise, the scholarship on data use provides practical advice for how to enact change at a systemic level. Scholars have shared guidance, for example, on how to create dedicated spaces within institutions to continually design, implement, and track the effectiveness of new institutional practices (Sannino et al., 2016), and how to equitably partner with students (Phelps and Santo, 2021), families (Ishimaru, 2019), and communities (Bang et al., 2016), to create change together as well as to build capacity for future change. Within the context of CSed, scholars have also shared guiding principles of transformative justice and specific examples of how to enact these principles within institutional change efforts (Erete et al., 2021).
Yet, there is little research with clear guidance for district leaders on the intermediary step of diagnostic problem framing that exists between data collection and systems change. Whereas data collection and monitoring points to the existence, prevalence, and magnitude of a system-level inequity, diagnostic problem framing surfaces the underlying root causes of the inequity and locates the causes within the interplay of various elements of an educational institution. Scholars argue that uncovering the root causes of an inequity is slow and messy work, partly because educational institutions are riddled with uncertainties and complexities that obscure the root causes of inequities (Yurkofsky, 2022). Additionally, inequities have historically settled into the dominant narratives, practices, and systems of an educational institution such that they can continuously hide in plain sight (Safir and Dugan, 2021). Further still, educational institutions are populated with stakeholders that have competing agendas and conflicting interpretations of what an underlying root cause might be such that it can be difficult to reach agreement and consensus (Coburn et al., 2009).
Scholars have shown that district leaders who primarily couple their data use with accountability policies (such as the No Child Left Behind Act and the Every Child Succeeds Act in the United States) to measure school success on norm-referenced tests tend to skip over the slow and messy work entailed by diagnostic problem framing, and instead focus exclusively on developing instructional management solutions to remediate students rather than identify and respond to root causes of inequities (Dodman et al., 2021; Horn, 2018). Drawing on a number of cautionary tales from the research literature, we will show below how district leaders’ data-driven decision-making, within a high stakes accountability context, can reproduce inequitable narratives, practices, and systems within their educational institutions when diagnostic problem framing is done poorly and root causes of inequities remain intact.
Inequitable narratives can be reproduced, for example, when school leaders use student benchmark data to generate problem and solution frames around “closing the achievement gap.” The narrative and rhetoric surrounding the “achievement gap” has been shown to problematically position low-income and minoritized students as deficient and in need of remediation while maintaining measures of success that privilege middle-class White students (Gutiérrez, 2008; Ladson-Billings, 2006; Nasir, 2011). In their study of 52 educators across seven school districts, Lasater et al. (2020) found that data use that positioned assessment data as the sole measure of students’ academic capability “prompted” teachers to engage in deficit narratives (p. 5; italics in the original). Similarly in their study of school leaders at six middle schools, Bertrand and Marsh (2015) revealed that teachers’ sense-making around assessment data reinforced existing deficit narratives and low expectations for students designated as ELL and in special education.
Additionally, inequitable practices can be reproduced during the data use process. Within the context of accountability pressures, scholars have shown how school leaders use data to take up inequitable practices such as solely teaching to the test (Diamond and Cooper, 2007; Garner et al., 2017), performing educational triage only on students right below the benchmark cusp (Booher-Jennings, 2005; Horn, 2018), or reshaping the test pool by referring students last minute to special education services (Ehren and Swanborn, 2012; Jacob, 2005). When school leaders use data to inform these practices, it is not to reform inequitable educational institutions, but rather to engage in ceremonial, and sometimes harmful, compliance to accountability policies (Spillane, 2012).
Further still, inequitable systems can be reproduced through data-driven approaches. Horn and colleagues who closely followed the data use practices of teacher workgroups (Garner et al., 2017; Horn, 2018) argue that the narrow focus on instructional management solutions such as student triage and student remediation, marked a missed opportunity for workgroups to create more equitable solutions by transforming aspects of the instructional system. According to Horn (2018) equitable transformations of systems might include improving instruction to provide more robust and rigorous learning opportunities that leveraged students’ assets, or investing in professional development to better support teachers in improving instruction.
Taken together, these and related studies reveal how the predominant coupling of student achievement data with policy contexts leads to data-driven decision-making meetings that fail to engage in diagnostic problem-framing work (Garner et al., 2017; Horn, 2018), fail to evidence equity issues as part of the problem-framing working (Gannon-Slater et al., 2017; Schildkamp et al., 2012), or that explain equity issues in a way that attributes blame to the students themselves (Bertrand and Marsh, 2015; Booher-Jennings, 2005; Evans et al., 2019; Oláh et al., 2010).
On the flip side, when diagnostic problem framing is done in a thoughtful and responsible way, school leaders can identify and respond to root causes that reproduce harmful inequities in students’ day-to-day schooling experiences. For example, in the context of CSed, Sheena Erete and colleagues (Erete et al., 2021) worked with school leaders to better understand the root causes within a school district—stemming from historical injustices, ongoing state violence, and negative stereotypes—that were shaping the opportunities and willingness for Black and Latinx female students to participate in CSed learning programs. The root causes explored in this study disproportionately narrowed the entry points into CS learning opportunities for Black and Latinx female students as well as produced negative experiences within AP CS classrooms for Black and Latinx students who felt isolated due to experiencing a lack of representation of teachers, mentors, and peers that they could identify with.
By more intentionally exploring these root causes, the researchers and school leaders were informed to take action to remediate many components of the school system including the design of CSed learning opportunities, recruitment efforts, mentor hiring, and professional development. This study reveals the crucial role that diagnostic problem framing, when paired with a transformative justice approach to explicitly counter structural racism and oppression, plays in bridging the steps of data use and transformative change to provide more just outcomes for students in CSed.
The study we present builds on these findings by providing an in-depth analysis of the specific work school leaders performed to conduct diagnostic problem framing in a way that successfully surfaced and responded to the root causes of inequities in their CSed contexts. Given the lack of guidance on diagnostic problem framing within policy discourse, data use handbooks, and the research literature, and given the crucial role diagnostic problem framing plays for identifying and responding to inequitable narratives, practices, and systems, it is critically important to develop guidance and exemplar cases of how district leaders can use diagnostic problem framing to support their equitable systems change work in CSed.
Methods
Our study was guided by two research questions: (1) How do district actors utilize data infrastructures and routines in order to understand possible root causes of inequity within comprehensive CSed initiatives? (2) What factors support or mediate such processes of diagnostic problem framing? We address these questions through analysis of four case studies of district data use related to addressing equity issues in CSed initiatives, detailed below.
Context and data
To analyze the work entailed in district actors’ data practices for understanding barriers to equity in their CSed initiatives, this study utilizes data from a broader study of eight school districts conducted by the authors. While these districts were geographically and demographically diverse, all shared a commonality of implementing comprehensive CSed initiatives for at least 2 years. This provided ample opportunity to examine the two research questions. We define “Comprehensive CSed initiatives” as ones in which districts are actively working to implement coherent, district-wide computer science learning opportunities across their K12 grade bands, with an intention to achieve equitable access and participation within these learning opportunities. This stands in contrast to districts where there might simply be “pockets” of CS learning opportunities (for instance, only at the high school level, or only in particular schools) and no larger or coherent district effort to broaden these opportunities across schools and grade bands within the district.
We conducted 44 1-hour interviews with district actors including administrators, coaches, teachers, and research partners. These interviews were conducted using a theoretically guided protocol that focused on surfacing historical actions and issues related to promoting equitable CSed in terms of who CSed is for, how CS was taught, and what CS was taught (Santo et al., 2019). Interview data was triangulated with 130 internal and external district planning and implementation documents as well as with video recordings of six 90-min virtual professional learning community meetings. In these meetings, conducted by the research team, representatives from each district met to present their equitable CSed work and share common challenges and emerging best practices. Through our case development process, we identified a more targeted set of cases and associated data from within this corpus that served as the basis for this analysis (see further details in section Analysis). With the exception of Chicago Public Schools, which, in consultation with the district, we decided to identify due to the already public nature of some of the work we analyzed, all districts and individuals are pseudonymized.
Analysis
In developing our findings, we employed the methodological approach of “telling cases” (Mitchell, 1984). Telling cases entails “the detailed presentation of ethnographic data related to some sequence of events from which the analyst seeks to make some theoretical inference” (p. 238). In seeking to make theoretical inferences related to the process of district actors’ process of identifying root causes of inequities in K12 CS education through usage of data, our unit of analysis was instances in which district actors attempted to engage in practices of diagnostic problem framing. Our analytic process took place across three phases: (1) case identification and selection, (2) case development, and (3) cross-case analysis.
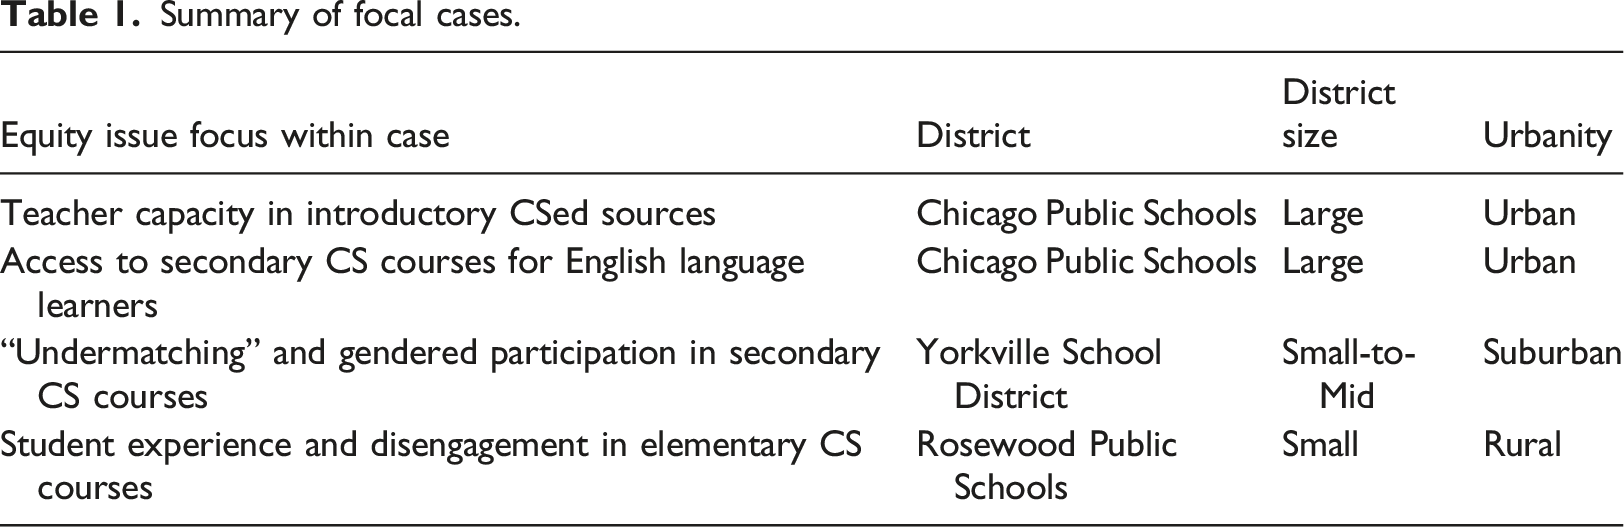
To select cases for deeper analysis, we first identified 17 illuminative cases from our broader data corpus that involved district actors building and leveraging data infrastructures, as well as the routines they engaged in to identify root causes of barriers to equity within their CS instructional systems. These cases spanned six of the eight districts involved in our broader study. Related data included 19 semi-structured hour-long interviews across 18 participants. From this sample, we selected four representative cases based on alignment with the CAPE framework (Fletcher and Warner, 2020). Our rationale for focusing on these specific cases was based on the criteria that each case spoke to one of the four different elements of the Fletcher and Warner framework. We selected one case for capacity, one for access, one for participation, and one for experience issues. The intent in doing so was to highlight how diagnostic problem framing plays out across a range of phenomena related to CSed equity. These four cases are from 3 districts, and are based on a total of 7 interviews across six participants, as well as on related district documentation including published papers, internal reports, and presentations.
To develop the cases further and answer our first research question, we created thick descriptions of each case (Denzin, 1989; Denzin and Lincoln, 2005). This involved writing analytic memos centered on the various dynamics at play in district actors’ data infrastructures and routines as well as the different types of work involved in using data to investigate and understand the root causes of inequities within each case. The writing of these thick descriptions was guided by a sociocultural view of institutional change (March and Olson, 2006; Meyer and Rowan, 2012). This view centers on exploring how intertwined dynamics of institutional relationships, norms, routines, interpretation, learning, and decision-making unfold in relation to valued actions and outcomes within organizational contexts. For each case, we utilized a combination of member checking as well as triangulation across multiple interviews and district documents in order to ensure the accuracy of case details.
To answer our second research question concerning underlying factors that mediated diagnostic problem framing (i.e. which factors hindered or supported the process of district leaders to identify root causes of educational inequities), we engaged in the constant comparative method (Glaser, 1965) to conduct a cross-case analysis. This analysis was conducted simultaneously “bottom up” from the data while also being guided by our review of the broader literature on data-informed improvement in schools outlined in the background established above. For example, Mandinach and Gummer (2016) established the importance of data literacy generally within educational systems change work. As such, we sought evidence of whether this capacity actively mediated diagnostic problem framing specifically. Within this analysis, we sought to identify common factors present across each of the cases that we saw as supportive mediators of the process of identifying root causes of inequities highlighted by data.
District descriptions
Chicago Public Schools is the third largest school district in the United States, serving close to 400,000 students across almost 650 schools. CPS' computer science education efforts, while in existence since 2008, were formalized into a comprehensive initiative in 2013. Of particular relevance to this analysis was the existence of (1) a CS graduation requirement established in 2016 and (2) a long-term research-practice partnership, CAFÉCS, which served to support the district’s CSed efforts through development of a robust data and research infrastructure.
Yorkville School District is a small-to-mid size district located on the East Coast. Their computer science offerings began with AP Computer Science A in 2012 and have since grown into a robust pathway of computer science courses at the time of writing. In recent years they have focused on increasing student enrollment, teacher capacity, and the number of entry points into the CS course pathways for students with minimal CS experience.
Summary of focal cases.
Findings
Our findings consist of two analyses. The first analysis is organized around the four elements of the CAPE framework (Fletcher and Warner, 2020). This analysis focused on how data and associated diagnostic problem framing around inequities played out within issues of teacher
Diagnosing root causes of CSed inequities in capacity, access, participation, and experience
Capacity: surfacing teacher capacity factors in introductory CS courses
Chicago Public Schools is one of the largest school districts in the United States, and has been engaged in a comprehensive, district-wide CSed initiative since 2013. Notable among the work the district has done to advance CSed was the establishment of a CS graduation requirement for high school students in 2016 (Dettori et al., 2018). The policy change was a substantial step toward reducing inequities in CSed. This policy created a mandate for not only offering, but promoting full participation in, CSed experiences. However, the policy also contained risks around potentially reproducing broader inequities: if CSed implementation was not well-supported, it could result in students not graduating from high school.
In the second year of the graduation policy’s implementation, the team involved in both implementation and research began to broadly hear district stakeholder concerns related to these risks. Specifically, there was a sense that the introductory course (Exploring Computer Science: Goode et al., 2014) that was in widespread implementation in CPS high schools was too difficult and that there was a high course failure rate. If this concern was well-founded, it would present a substantial risk for both students experiencing course failure as well as for the sustainability of the broader CPS CSed initiative itself.
In response, the CPS Office of Computer Science (OCS) collaborated with CAFÉCS, a longstanding research-practice partnership supporting the CPS CSed initiative (Henrick et al., 2019) to understand failure rates within their ECS courses. To support the analysis, leaders in OCS and CAFÉCS took advantage of existing data that had been collected since the introduction of the ECS course, as well as collaborative structures they had in place to engage in discussions of data in relation to the initiative’s strategic goals. Steven McGee, a leader of the CAFÉCS partnership, described the process this way: “These meetings are two to three dozen people that get together. [...] The idea there is we want to create an atmosphere where we are doing this shared visioning, shared interpretation of data, getting the whole community input so that we’re guided by everyone’s voice. So it was at one of these monthly meetings that we then said, hey, there’s this issue and we brainstormed. Everyone had an opportunity to say ‘well, I think these are the factors that I think affect the failure rate.’ GPA, attendance, the quality of the teaching, there was some hypotheses about, well, maybe it’s higher in the second semester because that’s where there’s more collaborative work, that’s where attendance really would become an issue for people, well there are school level factors, teacher level factors on content knowledge.”
This described process of hypothesis generation around possible factors affecting failure rates was significant—in response to the larger concern that was raised about failure rates, the group simply could have gone to their historical data to answer the question of whether or not there was, in fact, a problem with failure rates. Doing so would mean using available data to simply monitor the degree to which an equity issue around course failure was present. Instead, they engaged in a process of both answering the initial question of the degree of course failure but also used additional data they had available to them diagnostically—asking what might be “underneath” cases where course failure did occur in terms of potential root causes (e.g. “GPA,” “attendance,” “quality of teaching,” noted in the excerpt above). Essentially, engaging in a process of diagnostic problem framing vis-a-vis course failure rates.
The analysis proved to have important impacts when it came to how the initiative approached questions of systems change, in particular when it came to issues of teacher capacity (e.g. teacher content knowledge). McGee shared that the results, first and foremost, showed that the initial concern around failure rates did not exist to the degree that those who raised them may have imagined. “The failure rate was about 11%, which as near as we could tell, was not any different than any other course [in the district]… And in fact the consortium [University of Chicago Consortium on School Research], who actually has access to all subject areas, found that the grades in computer science were actually higher on average than grades on other courses.”
But just because the degree of course failure in reality did not match the stakeholder concerns did not mean there was no room for improvement. The deeper exploration of factors that correlated with course failure offered important insights around potential root causes of the problem. Outlined in a technical report by McGee et al. (2018), the results pointed to two critical factors that could be focused on to reduce failure rates: (1) Whether teachers had participated in ECS professional development and (2) the number of times a teacher had taught the course. Each was found to be statistically significant factors correlated with students passing the course.
These results, in turn, were then able to be mobilized to encourage administrators to make evidence-based decisions on both supporting teacher participation in professional development as well as in assigning teachers to the course. As Andy Rasmussen, an administrator within Chicago’s OCS, shared: “We were able to see from the research that the failure rate for students in classes taught by somebody who had actually been through the professional development was nearly half that of teachers who had not been through that. So that’s been validating in one sense, but it also gives us a really good talking point when speaking to principals and others about the importance of starting and completing the professional development sequence and taking advantage of what we have to offer.”
McGee shared a similar view on how the team was able to mobilize findings around teacher experience in teaching ECS: “That was then data that the [OCS] implementation specialists or integration specialists could take back to the principals to say, ‘Hey, if you’re worried about failure rate, please make sure you assign the same teacher, don’t keep changing teachers every year.’”
If the group had simply monitored course failure data, rather than taking a stance of diagnostic problem framing around what factors might be behind instances of course failure, they may have missed an important opportunity to reduce inequities. The group did report that in the year after the report’s results were shared with administrators, they saw increased attendance in ECS professional development, a result suggesting that the findings prompted evidence-based decision-making on the part of principals with regard to engaging with teacher professional development opportunities.
Access: reaching into district systems to understand access issues for English Language Learners in secondary CS
A second case shared by the Chicago CS team concerned lack of access to secondary CS courses by students who were English Language Learners (ELLs). As Andy Rasmussen of the CPS Office of Computer Science (OCS) shared: “I’d been looking at intersectional slices of who has not had access to a Computer Science course by the time that they’re in their senior year. So there were a small, small percentage of students that hadn’t been offered a class, and we’re trying to figure out why. And looking at every slice, so like gender and race, or diverse learner status and race, looking at all these sorts of demographics. One thing that really stuck out is that if you’re an English Language Learner you had a much higher chance of not having been offered the course. And this isn’t something that had popped out to us before.”
The group had surfaced an equity issue around access for this particular subgroup, but did not have a clear sense of what was causing the problem. As in the previous case, the graduation requirement that CPS had put in place around secondary CS meant that all students should have, in theory, been offered the opportunity to take a CS course in order to fulfill the requirement.
In contrast to the case involving course failure rates, the group did not have a clear set of hypotheses around what might explain this discrepancy. To better understand the problem, the group reached out to a representative from CPS’s Office of Language and Cultural Education (OLCE), which focused on English Language Learners within the district. This representative was invited to one of OCS’s aforementioned “consultancy” meetings where stakeholders regularly explored data and how it might be used to improve goals. As another OCS administrator shared: “Her presence was invaluable, because she was able to articulate why schools have problems scheduling English language learner students into computer science. I didn’t realize that there were these tiers of English Language Learners, and depending on what tier they fell in, that determined their English proficiency. And some students are never elevated to the level of proficiency where they’re able to [participate]... They have to continue... I think it’s if you’re level one or level two, then you have to continue to take all of these English classes until you get to a level of proficiency where you can partake in other things.”
In consultation with the representative from OLCE, the computer science office came to understand a set of district policies they had, up to that point, been unaware of: ELL students had particular proficiency requirements that resulted in certain courses not being available to them. They determined that this policy likely explained the under-enrollment trend in ELL students that they had found in their secondary CS course data. Andy Rasmussen, an OCS administrator, described the importance of gathering information and diagnostic problem framing around this issue: “She was just this fount of information about all that schools and students have to think about when they are a foreign transfer student, or any other thing where their English level is low, and so they’re treated very differently by the school. So we just hadn’t had that insight very much. We kind of knew from conversation, but hadn’t had the insight there.”
At the time of writing, OCS was considering how to respond, exploring the possibility of putting in place a waiver for certain students when it comes to the CS graduation requirement.
In reflecting on this case and others like it, Rasmussen noted that “there’s a fair amount of data work that’s sort of gumshoe work.”, pointing to the reality of needing to track down both forms of data or people with knowledge of the inner workings of particular aspects of the instructional system that might be impacting data: “There’s so many things we didn’t know to ask the question. [...] It’s often one person in the district that manages that thing. And you have to be able to know that the person exists, know the right questions to ask and how things relate. So, there’s a fair amount of the data work that’s sort of gumshoe work, and figuring out what are the things we need to be thinking about, who are the students that are hidden? What are the experiences that they have that are hidden? And learning to track some of that down.”
In contrast to the first case shared around CPS’s data work, this one did not involve either direct generation of hypotheses to explain trends they were seeing in their broader monitoring data, or formal processes of “asking questions of the data.” Instead, the diagnostic problem-framing process took the form of consultations with other district actors who understood elements of the system that they were unaware of. As stated by Rasmussen, this “gumshoe work” allowed them to figure out how to address inequities they were observing in the data.
Participation: Explaining trends in “undermatching” within secondary CS courses
In Yorkville school district, two stakeholders monitored and analyzed the enrollment data of AP Computer Science A over multiple years across student subgroups: a high school CS teacher, Rosalyn, and the math department supervisor who managed the district’s secondary CS work, Nicole. When examining the percentage of female enrollment in AP CS-A, they noticed the highest it ever reached was a one-to-two ratio: for every female enrolled in AP CS-A there were two males enrolled. To make salient how problematic these enrollment numbers were for CS specifically, they compared them to the district’s female enrollment in AP Calculus which held a one-to-one ratio. Rosalyn explained her use of AP Calculus rather than AP Physics as a comparison point: “Calc we’re fifty-fifty, that’s not the problem, but that’s why it’s a really good standard. It doesn’t make sense to compare it with physics. In other words, the people missing in AP Physics are pretty much the same people missing in AP CS-A. It’s females and minorities.”
Rosalyn’s point here echoes Barbara Ericson’s (2020) research that shows AP CS-A has the second lowest female enrollment rates among all AP courses, second only to AP Physics. Instead, AP Calculus has a relatively balanced percentage at approximately 50% female.
Keeping track of this data was not straightforward, however, especially as more teachers were added and involved. As Rosalyn describes, “I like to keep track of the percent of minority and then the percent of female, and then the percent of free and reduced lunch across all courses. And again, it was easier when I was the only teacher. Now that there’s so many other teachers involved, it needs to be done through a Google Form, all teachers need to administer that form. It’s grown.”
Procuring a comprehensive picture of their enrollment numbers across all classes helped them identify the occurrence, magnitude, and trends in disparities over time. However, this process did not, in of itself, help Rosalyn or Nicole to sort out the underlying variables that might be acting as root causes for the disparity in the first place. This needed to be accomplished through diagnostic problem framing.
Rosalyn began to identify a possible root cause, in her opinion, as she witnessed another phenomenon happening in her AP Computer Science Principles class. There were more female students who she felt were “undermatched,” and should have been enrolled in AP CS-A based on Rosalyn’s perception of their proficiency. Rosalyn had a hunch that guidance counselor recommendations might explain the undermatching participation trends she was seeing, and thus the low enrollment numbers for AP CS-A. She described that this hunch may have emerged from a combination of factors. First, Rosalyn had numerous experiences with faculty in her district who voiced stereotypical views about the kind of students computer science was well-suited for (i.e. male technology enthusiasts). Second, she attended national training sessions that articulated the worldwide pervasiveness of these stereotypes and how they worked to keep women out of Computer Science. During one such training she reflected on her own high school experiences as a student talking with guidance counselors, and realized that “I am one of those statistics.”
Acting on this hunch, Rosalyn spoke with the “misplaced” female students who were not in AP CS-A to figure out who their guidance counselors were, which led her to notice a pattern as to which counselors were undermatching female students. She then spoke with those specific guidance counselors to both advocate for female students as well as to figure out if there were other female students who might be undermatched. As Rosalyn described this informal data practice: “Some of that data is word of mouth. So I’ll have a student that’s in my class, Abby, she was in CS Principles, and she should have been in [AP CS] A based on her abilities, and I’ll ask her who was her counselor, and she’ll tell me. And then two periods later, it’s September, we’re still trying to work out the kinks. And again, I’ve got Sally, who’s in the class, and she should have been in CS-A as well and it’s the same counselor, so now that’s data. And now I’m gonna go talk to that counselor and explain, like I said, adult to adult, ‘This is what I’m seeing. Are you aware of this and what happened here?’ So that it doesn’t happen in the future. ‘And do you think it might have happened to anybody else? Anybody that wasn’t in my class?’ So that’s an example of data that’s sort of informal.”
Rosalyn’s diagnostic problem framing was informed by the combination of various sources of data: annual formal comparisons of enrollment numbers between AP Calculus and AP CS-A, Rosalyn’s own formative understandings of students’ abilities and whether they are misplaced or not, and beginning-of-the-year informal word-of-mouth data from students and their counselors. Rosalyn attributed the issue of low female enrollment in AP CS-A not to the students themselves (as if females were reluctant to push themselves), but to the recommendations of guidance counselors. She suspected that the problem may be related to counselors being unfamiliar with or even afraid of computer science as well as unconscious stereotypical views they may have held about who CS is for. This diagnostic problem framing set her up to enact solutions that focused on inviting counselors to see themselves as part of the solution to increasing female enrollment in computer science. To do this, Rosalyn had a series of conversations with counselors to familiarize them with Computer Science, debunk the myths of who Computer Science is for, and to back up her claims about the severity of the problem by directly sharing the low enrollment data for females in Computer Science.
Experience: unpacking student disengagement in CS across grades 3–6
Beverly served as Rosewood Public Schools’ data, assessment and technology facilitator since 2018. In this role, she collected student data across a variety of content areas and presented these back to the administration to inform improvement efforts. In other subject areas, she had well-established methods of tracking growth over time. However, in CS, she lacked any formalized benchmarks such as state-based, standards aligned tests. In lieu of these, Beverly decided to focus on student engagement in CS. To measure engagement, she went directly into CS classrooms with a stopwatch and a notebook and collected what she described as “[Beverly’s] mucky data.” While she considered these data to be “informal” and “anecdotal,” she was in fact fairly systematic in her approach, both iterating on how she considered accounting for disengagement and collecting data longitudinally and across grade levels.
Her approach to “mucky data” evolved over time. First, she recorded “tallies of how many times did I see kids not engage.” Then, she used her phone’s stopwatch feature to document, “here’s the longest that everybody was engaged. And then I restart the timer. Okay, here’s the next longest, here’s the next longest.” As her classroom observations progressed over the school year, Beverly noticed, for example at the sixth grade level, that when the school year started students were “scared to death of the teacher. So they were quiet…but then as time went on, and they built rapport and they got to know her…they loosened up a bit.” As engagement seemed to increase at the aggregate level, she modified her approach to her mucky data again, this time attending to individual students.
“It made more sense to go back to looking at, okay, here’s a kid that’s not engaged. How long is that not happening? And seriously, there were such high levels of engagement that I could just count like I used to coach. So I would just count one thousand one, one thousand two, one thousand three, just to see how long they were not engaged.”
When this method revealed to her that some individual students were not engaging for extended periods of time (e.g. 2–3 min) she would talk with the students’ teacher about how they might more effectively engage them. However, these conversations about individual students were not always fruitful as teachers tended to attribute the problem of disengagement back to the students themselves. Beverly would try to gather additional data about students’ engagement: “How do you know that students are grasping this? And then I’d name a specific student. So then saying, depending on whatever the answer was, which was usually, ‘I don't know.’ ... Or ‘That student just isn’t getting it.’ To then being able to say, ‘Okay. What are some ways that this instruction can change so that they do get it or they are able to engage more and they’re not sitting back and just staring at their computer?'”
Our data suggest that Beverly had a hunch about one factor affecting student engagement: the lack of immediate assistance when a student became stuck during a CS activity. Beverly guessed that this was specifically true during whole group instruction, which has tendencies to lose student engagement when struggling students were “stuck” and needed to wait for teacher assistance. Due to her work as data, assessment, and technology facilitator across multiple content areas, she had a unique vantage point that made her familiar with what she saw as the shortcomings of whole group instruction: “So in the past, we did everything whole group. We’re getting away from that more because we have kids that are at all different levels and if we do solely and just whole-group instruction and then set them loose, we know that our strugglers are not learning. And so that’s true whether it’s computer science, or whether it’s math, or whether it’s reading.”
She also appreciated that placing students in smaller groups was not enough. For example, if “the strugglers” were all placed together, students did not have the opportunity for “more differentiated” groups that could influence their growth. This assumption was reflected in the solutions to student disengagement that she devised with the computer science teachers. At the third-fifth grade level she worked to create differentiated small groups. At the sixth grade level, the teacher wanted to continue with whole group instruction, but was willing to bring in a teacher aide student from her upper-level programming class. These moves suggest that Beverly suspected that student disengagement was caused not by student disinterest in computer science, but by a specific feature of whole group instruction—students becoming stuck and having to wait at their computer until a teacher was free to come over and help them move forward again.
Based on her measurements around time on task as a proxy for engagement, Beverly’s actions suggest that she saw prolonged periods of disengagement as resulting from lack of individualized support within whole group instruction, which then drove her actions to bring in more individualized supports for students by reconfiguring the third-to-fifth grade classrooms into small differentiated groups where peers could support each other, and by bringing in a student teacher aide in the sixth grade classroom. Beverly described the resultant change in engagement for the sixth grade classroom this way: “She has been able to strategically pick a teacher aide student who is also in her upper level programming class to be able to be a teacher aide for her, say, an eighth grader who can work with a sixth grader and be able to... The two of them, after she gives a short 10-minute lesson on whatever the skill is for the day, and they can go around the room and work individually with students, or work with pairs and the students. And that’s been interesting to watch, because the level of engagement has amazed me in that room. Because kids, they don’t sit wondering what they should be doing, they have a pretty clear picture on what they should be doing and if they have a question, it gets answered pretty quickly. So they can move on.”
Yet, midway through the year Beverly discovered that whole group instruction was not the only problem interfering with student engagement. As part of her work, Beverly also offered computer science professional development to science teachers in her district. After 5 days of training, these science teachers were able to offer computer science in their science rooms. At the fifth grade level, students had computer science opportunities both in their science classroom and in a 30-min specialist class with a CS instructional specialist. Unbeknownst to Beverly, however, was that the science teachers felt like they had to teach the same lessons that the CS instructional specialist was teaching, and unbeknownst to both Beverly and the science teachers was that a handful of students were attending the CS specialist course right before attending the science classroom for a CS lesson—the rest of the students were going to other specialist courses such as P.E. or the library. The result of this was that some but not all fifth graders were immediately repeating the same CS lessons. As Beverly describes it, “so the kids that already got it felt like they were being punished.” In response to this situation, Beverly started gathering a new form of data—fifth graders’ schedules—and shared these with the science teachers. Together, they devised solutions to increase the engagement of students receiving double doses of CS by providing them with additional pathways for engagement such as helping other students or creating their own CS projects, instead of simply repeating a CS lesson.
Underlying factors that mediate diagnostic problem framing
The first analysis presented four individual cases of the work entailed in district leaders’ diagnostic problem-framing processes as they addressed equity issues with regard to capacity, access, participation, and engagement, respectively. The second analysis, below, builds on the first by using a cross-case comparison approach to tease out and identify a set of recurring factors that appeared to consequentially mediate district leaders’ problem-framing processes.
Conceptualization of equity as a multifaceted phenomenon
Within each of our cases, we see how ideas about what counts as “equitable” informed and shaped district leaders’ practices of diagnostic problem framing. In the first case concerning capacity, after learning that ECS failure rates were not, in fact, higher than average compared to other subject areas, district staff could have set the issue aside. However, they did not. They maintained a more expansive equity goal of reducing failure rates, a goal which then drove further inquiry into root causes. In the second case regarding access, an underlying conceptualization of equity through the lens of reducing subgroup inequities in access led district actors to seek out explanations for the disparities they identified in their data. In Yorkville’s participation case, a conceptualization of not simply enrollment, but enrollment in courses that were appropriately matched to female student competencies, drove Rosalyn to seek out causes for undermatching. Finally, in Rosewood, Beverly conceptualized equity within the context of student experiences within courses, leading her to explore why disengagement might be occurring. In each, a normative stance concerning what might be considered equitable, or not, undergirded the process of then diagnosing underlying causes. Indeed, it’s possible to imagine that different conceptualizations of equity, especially ones that are perhaps more narrow, would constrain which activities, if any, district leaders might have engaged in around problem diagnosis.
Problem attribution to systems, not students
Rather than explaining disparities in system outcomes or opportunities as the fault of students themselves, district leaders used diagnostic problem framing to show that the system itself consisted of shortcomings, contradictions, and redundancies, and/or was steeped in processes that reproduced historical inequities. In Chicago, district leaders countered the claim that the course failure rate was evidence that computer science was simply too difficult for students, by showing, instead, that when teachers had adequate professional development and previous experience teaching the course, students were successfully learning computer science.
In Yorkville, district leaders encountered a stereotype-laden view amongst counselors that female students were not well-suited for participating in CS courses. Instead of blaming female students themselves for not choosing more advanced courses, district leaders attributed the problem to the presence of historically inaccurate stereotypes that were being reproduced in everyday interactional dynamics between students and their teachers as well as in counselors’ course selection advice.
Lastly, in Rosewood, Beverly confronted a deficit problem framing from certain teachers when they explained students’ disengagement as “that student just isn’t getting it.” She worked to counter this framing, by redirecting the nature of the problem of engagement to the system itself: “Okay. What are some ways that this instruction can change so that they do get it or they are able to engage more and they’re not sitting back and just staring at their computer.”
Ability to analyze data for indicators of inequities
District leaders made one or more intentional data analysis moves to search for potential inequities. These included disaggregating data sets into student groups, comparing data sets across instructional systems, and closely analyzing cases of specific students. District leaders in Chicago and in Yorkville worked to disaggregate student data into various student groups to glean the presence of disparities in student access or student participation in computer science courses, respectively. District leaders in both Chicago and Yorkville also compared computer science data sets such as course failure rates and enrollment rates (of males and females) to other subject areas that served as appropriate points of reference (such as AP Calculus rather than AP Physics in Yorkville), to grasp the severity of a given inequity. Last, district leaders in both Yorkville and Rosewood worked to build relationships with specific students and gather individual data points on them to notice irregularities that suggested an underlying equity issue such as students being undermatched in Yorkville and students not receiving timely support in Rosewood. This problem-framing work entailed more than monitoring and collecting data, but rather strategically triangulating data across multiple sources to infer and surface underlying inequities.
Knowledge of local instructional systems
As part of their problem-framing work, district leaders drew on their pre-existing knowledge of local instructional systems to locate the root causes of the inequities they surfaced. In Yorkville, Rosalyn connected ideas between her knowledge of under-enrollment of female students in AP CS-A courses, her formative knowledge of capabilities around CS displayed by female students in the AP CS-P course she taught, and her familiarity with counselors’ stereotype-laden views about who CS is for. This led to her diagnostic problem framing to form a “hunch” about the cause of under-enrollment being related to guidance counselor brokerage and recommendation practices.
In Rosewood, Beverly was familiar with how issues of whole group instruction were inadequately serving struggling students across her district’s different subject areas. This familiarity allowed her to extrapolate the issue into the context of computer science courses as a potential explanation for student disengagement. She eventually located an additional root cause as she became familiar with additional aspects of the local instructional system. This root cause was a teaching practice in which science teachers provided the same computer science lessons as the CS specialist, and a scheduling quirk that allowed certain students to get a double dose of these lessons back-to-back.
This points to the importance of district leaders working not just to connect the dots between their pre-existing knowledge of local instructional systems, but to expand their purview of other potentially relevant aspects of instructional systems. In Chicago, for example, district leaders worked to learn about the division of English Language Learners into tiers and the scheduling and resultant access issues that emerged from that. Likewise, in the experience case, Beverly’s intuition about whole group instruction being a root cause of disengagement was only a part of the explanation.
Embeddedness in instructional networks
The cases also highlight the reality that diagnostic problem framing does not occur in a social vacuum. District leaders were able to advance their problem framing through actively embedding themselves in larger organizational systems and building personal relationships. In Chicago, district leaders were able to engage in processes of hypothesis generation through a standing consultancy meeting that involved a large number of district administrators and research partners, which led to formal analysis of large datasets on the part of the CAFÉCS research partners in order to identify factors correlated with course failure. Additionally, in their problem-framing work around access, district leaders in Chicago leveraged their social networks with the district to broker a meeting with a representative from the district office responsible for policies surrounding ELL students. Their notion encompassed not about what an explanation might be, but who might possess it. By gathering additional background knowledge from the ELL administrator, the team was able to receive knowledge of ELL instructional policy that was highly plausible as the root cause of the access issues at play.
In Yorkville, Rosalyn utilized her positionality as a teacher of AP-CSP who had direct relationships with students, her role collaborating with Nicole on monitoring enrollment data, and her experiences at national equity-focused trainings in order to develop her hunch around “undermatching” and its relationship to guidance counselor practices. In Rosewood, Beverly’s positionality as both the actor responsible for data monitoring as well as professional development around CSed positioned her to be exposed to the underlying “double-dosing” issue that explained why some students were disengaged in CS lessons.
In all of these examples of diagnostic problem framing, district leaders unpacked and made sense of the data they collected and monitored by partnering with researchers, leveraging brokers, attending equity-focused trainings, and building relationships with students impacted by a specific equity issue.
Discussion
The examples shared above highlight how data were utilized within the context of “debugging” inequities within CS instructional systems, spanning phenomena of capacity, access, participation and experiences of CSed. Although districts varied by size, geographic region, and student demographics, they each had in place data infrastructures (Datnow et al., 2007), leadership (Copland, 2003; Halverson et al., 2007), and organizational routines of interpretation (Boudett et al., 2020; Spillane, 2012) that supported their data monitoring work. Further still, although districts varied in the types of inequities they identified, as well as in their processes of surfacing the root causes to those inequities, their diagnostic problem-framing work was directly mediated by five factors that took them above and beyond data monitoring: (1) conceptualization of equity as a multifaceted phenomena, (2) problem attribution to systems, not students, (3) ability to analyze data for indicators of inequities, (4) knowledge of local instructional systems, and (5) embeddedness in instructional networks.
We argue that these five factors are not unique to the four cases presented above, nor only pertinent to the work of implementing equitable computer science education. Rather, we believe these factors are constitutive of data-informed diagnostic problem-framing practices, more generally, that aim to transform inequities at various points within instructional systems. That is, their presence or absence directly mediates the kind of problem-framing work that is possible for district actors.
Evidence to support this claim can be found in previous studies wherein scholars have taken up each of these factors and their interrelations within the context of data-informed diagnostic problem-framing work. First, the importance of these factors when it comes to supporting diagnostic problem framing is affirmed by previous research in which scholars take up each factor individually as their focal phenomenon of interest. This includes scholarship that focuses on conceptualization of equity as a multifaceted phenomena (Fletcher and Warner, 2020; Gutiérrez, 2012; Santo et al., 2019), problem attribution to systems, not students (Ladson-Billings, 2006; Valencia, 2012), ability to analyze data for indicators of inequities (Blake et al., 2016; Johnson and La Salle, 2010), knowledge of local instructional systems (Schildkamp and Kuiper, 2010), and embeddedness in instructional networks (Daly, 2012; Hubers et al., 2018; Marsh et al., 2015; Park, 2018).
Second, the interrelatedness of these five factors—not simply presence of them, but interaction among them—within processes of diagnostic problem framing have also been taken up by scholars. For example, research on equity-mindedness in districts’ data use practices, (Bensimon and Harris, 2007; Bensimon et al., 2016; Dowd and Bensimon, 2015; Galloway and Ishimaru, 2019; Irby and Clark, 2018) shows the importance of conceptualizing equity issues as historical and systemic phenomenon in which disparities are accumulated over time, of not blaming students for those accumulated disparities, and of disaggregating data by student groups to evidence the presence and severity of an inequity.
Likewise, research on data literacy (Mandinach and Gummer, 2016) in districts’ work to “identify problems and frame questions” (p. 369, italics in the original) also conceptualizes the importance of examining multiple aspects of a system including “a student, group of students, a topical area, the curriculum, or an aspect of instruction” (p. 370) as well as understanding the local context at both the student and school level. Additionally, they conceptualize the work of identifying problems to “involve other participants or stakeholders, including students” (p. 370).
Last, the co-presence of all five factors can be found in an extended case of successful diagnostic problem framing for equity in the research literature, even though the factors were not explicitly theorized as such. Specifically, Park et al. (2013) presented a case in which Hispanic students at the high school level were not being encouraged to take college preparatory courses. The diagnostic problem-framing work in this case entailed district leaders to (a) shift their conceptualization of inequity from achievement gaps to opportunity gaps, to (b) acknowledge how a culture of low academic rigor and expectations for Hispanic students was a pervasive part of their instructional system, to (c) disaggregate data sets by student population to discover that Hispanic students were half as likely as Asian students to be enrolled in College preparatory courses, to (d) be familiar with district practices, policies, and course offerings, and to (e) work collaboratively so that administrators and teachers were learning from each other to generate a fuller picture of the problem (Park et al., 2013).
These disparate threads of pre-existing research showcase other similar representations of diagnostic problem framing found in this study, affirming the potential generalizability of this study’s findings At the same time, it showcases the need for additional research that shows the co-presence and interrelations of these aspects of problem-framing work in the context of data use practices that ultimately support equitable systems change. The inclusion of more exemplar cases in the research literature that provide detailed and full accounts of what is entailed in diagnostic problem-framing work will greatly support district leaders in enacting these processes in ways that go beyond mere compliance to accountability policies or that act on narrow conceptions of equity which aim to remediate students, rather than systems.
Conclusion
Working within the context of both historical inequities in computing along with complex institutional arrangements, district leaders, scholars, and advocates see promise in utilizing data-informed change processes to advance their goals around establishing comprehensive, equitable computer science education initiatives. In this paper, we affirmed the importance of gathering and monitoring data as a starting point, but highlighted that it is just that—a critical first step. We showed how processes of utilizing these data to identify the source of inequities is necessary in order to understand where and how to intervene, processes that offer their own complexities and contextual contingencies. For district leaders, our findings also offer direction on how to more effectively identify the underlying causes of inequity—the mediating factors we identified point to areas of activity to cultivate and guiding principles to follow as they develop equity-focused data initiatives. For scholars, we hope that our findings provide a useful theoretical roadmap for both studying processes of district change and engaging in successful research-practice partnerships with district leaders, as many of the processes outlined here are applicable to such arrangements. Broadly, this study highlights the importance of uncovering the facets of the real work involved in utilizing data to advance equity, something that while not necessarily straightforward, can indeed be viable if the conditions are right.
Footnotes
Acknowledgments
The authors would like to thank our district partners who generously and openly shared about their work to bring computer science education to their students. This research was made possible through support from Google’s Computer Science Education Research (CS-ER) award.
Declaration of conflicting interests
The author(s) declared no potential conflicts of interest with respect to the research, authorship, and/or publication of this article.
Funding
The author(s) disclosed receipt of the following financial support for the research, authorship, and/or publication of this article: This work was supported by the Google (CS-ER Program).