
Abstract
The purpose of this article is to describe a multidisciplinary approach implemented in teaching public policy analysis at university level. The approach fuses (a) contextual policy analysis with (b) bivariate and multivariate analysis techniques and (c) data analytics skills to improve the learners’ competence to conduct “decisional” policy analysis. The teaching subject matter was based on European Union policies and Eurostat data and delivered over a period of 3 years in a semester course and summer school formats. The multidisciplinary fusion generated strong interest among learners and participants from various backgrounds and skill levels. At the end of the course, even those with little or no previous exposure in at least one of the teaching topics were able to quickly grasp the “big picture” and explore their newly acquired knowledge with their own analyses. As a whole, this is an educational design where the multidisciplinary fusion is instrumented in the scope of a single course, not as the combination of different courses in a curriculum. The outcome is a viable and contemporary way to sidestep the quantitative–qualitative analysis divide (where applicable) and help learners gain valuable insight into how seemingly different subjects eventually fuse into applicable knowledge. The multidisciplinary synergy that instigated the course design was mirrored in research effort by the authors leading to publishable work, suggesting that the approach can be adopted and adapted to foster or enhance multidisciplinary research efforts. Similar educational designs can be used in existing curricula to bridge seemingly “distant” subjects and improve the comprehension of how seemingly “distant” subjects relate to each other. As in the case described, in curricula where such subjects already exist, the “raw” expertise is already present and can be readily utilized.
Introduction and background
“European studies” has evolved as an academic discipline on its own right. As a subject, it is traced back to the 1960s, but its evolution to an academic discipline was accelerated, more or less, because of the European Union’s establishment in the 1990s and subsequent enlargements (Keeler, 2005). The term “European Union (or EU) studies” is preferably used to narrow the emphasis to educational programs focusing on issues pertaining specifically to the European Union as opposed to the European continent overall (Baroncelli et al., 2014). A quick internet search shows that EU studies’ curricula tend to focus mostly on the function of the EU and its history, politics, and regulatory system, although some programs may offer specializations on EU governance, EU international relations, etc. (e.g., first cycle degrees/Bachelor programs: The Hague University of Applied Sciences, 2019; University of Amsterdam, 2019; and University of Nicosia, 2019; second cycle degrees/Master’s programs: King’s College London, 2019; Leiden University, 2019; and Maastricht University, 2019).
The presence of EU-specific curricula signifies EU expertise as a “job specialization” and, therefore, the professionalization of this expertise (Gijselaers et al., 2014; Manners and Rosamond, 2018). Of course, the mentioned EU expertise is, by necessity if not by definition, multidisciplinary or even interdisciplinary (Gijselaers et al., 2014). Simply put, the EU, integrated as it may be, is still the collective polity of its member states, each with its own “twist” of politics, governance, economics, justice, regulatory system, culture, history, industry, etc. Thus, a “true” EU expert would need to demonstrate considerable knowledge and proficiency horizontally about the EU (e.g., EU institutions, EU functions, regulations, policies, etc.), as well as vertically, that is, with respect to its member states, industry sectors, policy areas, etc. This is a challenging feat, to say the least.
Turned on its head, however, this widely acknowledged multiplicity of the EU may function as a learning medium instead of a learning outcome. Rather than trying to learn specifically [or only] about the EU, the EU can be used to learn about something that is not necessarily EU-specific but is, unavoidably, EU-relevant.
Taking into consideration the above, the authors collaborated on designing and delivering a multidisciplinary course that fuses different disciplines by using the EU both as a backdrop and medium. The course was aptly named “European-focused Policy Analytics–EuroPolA” combining policy analysis, as typically taught in a Political Science context, with quantitative analytical methods as typically taught in a Data Analysis context, but in a workshop-style, skills building approach. This way, we put forward three learning objectives: First, a student completing the course successfully should be able to autonomously execute end-to-end small-scale policy analysis using both contextual and quantitative (aka decisional) analysis and participate in a larger, policy analysis/policy design team. Second, to perform the multidisciplinary effort effectively, it might be preferable to focus directly on a “use case” instead of teaching abstract theory with textbook-grade examples. Third, political institutions, like the EU, might be used successfully as a teaching “workbench” even if they are not per se the subject matter of study.
The rest of this article is organized in the following way. In “Mending” the gap: Politics and analytics, we outline the goal(s) of our multidisciplinary approach. In Methodology and approach, we present our epistemological approach and educational methodology. In Main outcomes and evaluation, we evaluate the outcomes of our endeavor. In Lessons learned–concluding remarks, we take stock of what we learned to conclude this article.
“Mending” the gap: Politics and analytics
The authors, along with many of our colleagues, observed that a large proportion of our students tend to compartmentalize their learning. One compartmentalization seemed to center on the curriculum versus the real world while another drawing on the quantitative–qualitative divide. In hindsight, we know that such compartmentalization may prove rather [career-] limiting in the long run.
To counteract this trend, we sought a “platform” to showcase some of the “natural” synergies between different subjects. Given our different academic specializations, we focused mostly on counteracting the quantitative–qualitative divide and we identified policy analysis, a multidisciplinary field, as the binding platform.
In addition, policy analysis exercised at EU level did serve as a high-level paradigm that our students found it easier to relate to, indirectly addressing the curriculum versus the real-world compartmentalization conundrum as well. Finally, to make the course appealing, we put the emphasis on “analytics,” given its popularity and a term that is more appealing—to students like ours—than “statistics,” or “quantitative methods.” So, we proceeded to develop a new course that would clearly but subtly respond to the qualitative–quantitative divide and the compartmentalization trend.
Methodology and approach
The course we developed combines the following parts: 1. Policy (discourse) analysis: Given a policy declaration or document, students are expected to identify the following policy constructs: a. Goals, priorities, and metrics; b. Agents, actors, and stakeholders; c. Structures, mechanisms, and implementation activities; and d. Policy reference material. 2. Skills in using analytics software and data retrieval: Students are instructed on how to assimilate data regarding policy, based on the policy constructs identified in the previous step. a. Finding data in Eurostat and other statistical databases; b. Data retrieval techniques; c. Using integrated analytics software(s); d. Preparing data for analysis; and e. Structured reporting–dashboards. 3. Data analysis techniques–Use cases for public policy analysis: Again, based on the identified policy constructs, students are instructed to inquire into the policy outputs and outcomes using one or more of the following: a. Correlation analysis; b. Regression analysis; c. Classification analysis; and d. Cluster analysis.
This outline shows that while the EU serves as an educational medium, it is not the object of study—that remains multidisciplinary. The EU “theme” aids in achieving instructional coherence that would otherwise be difficult, given the diversity of learning objects.
At the same time, to cover all these topics, the teaching context tends to focus on core elements in each of the topics involved, as illustrated in Figure 1. We call this the EuroPolA approach in tandem with the course’s title. The EuroPolA approach.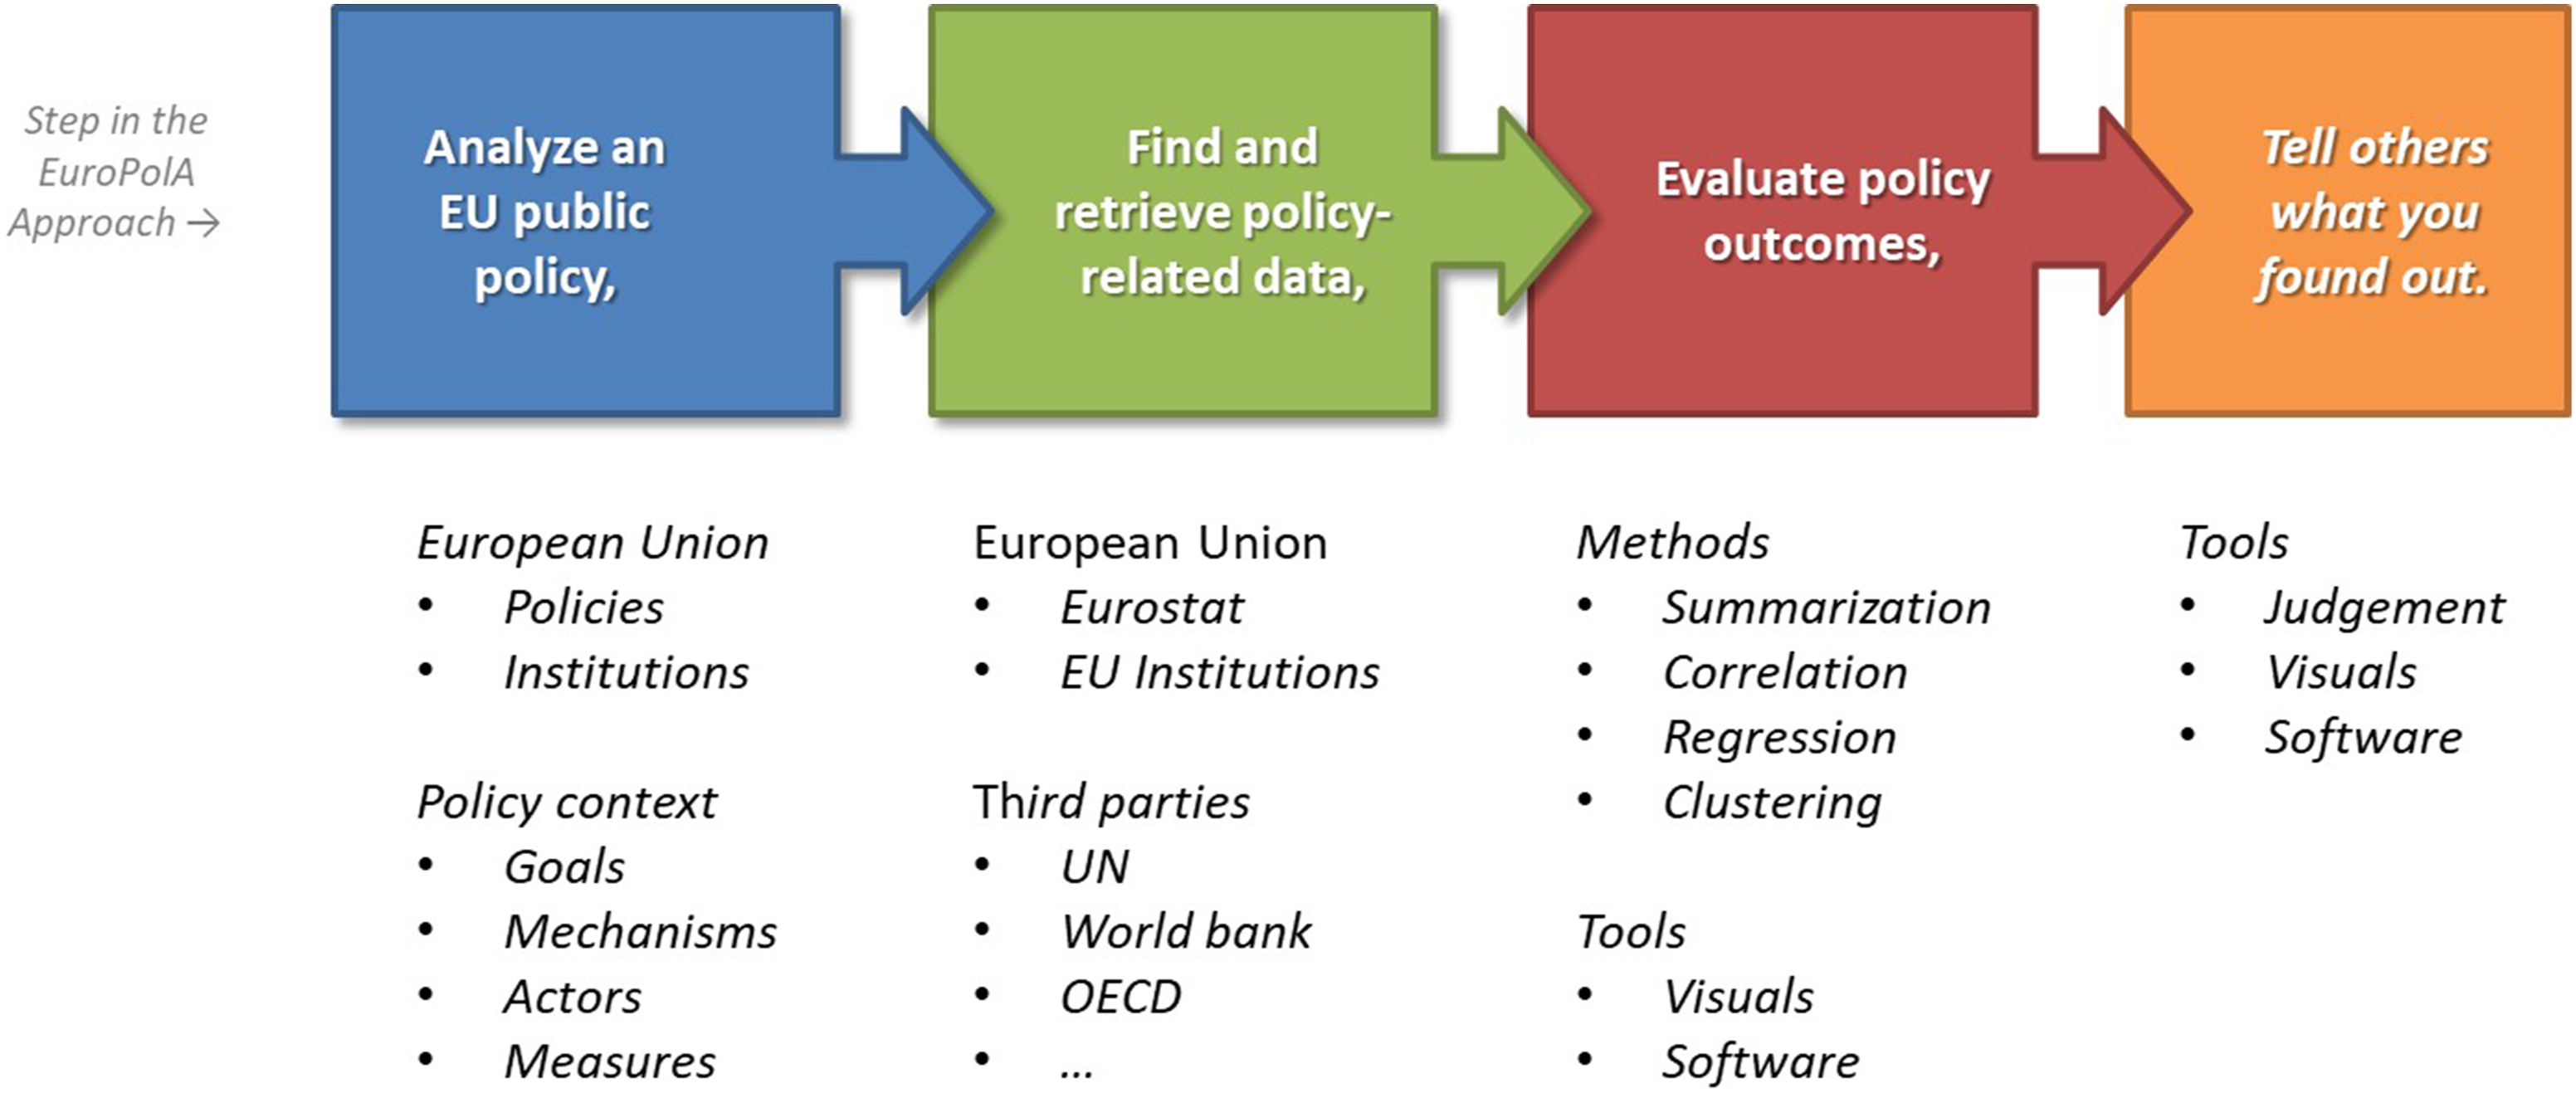
In the first step, students are taught about public policies with an emphasis on EU policies, policy instruments, and actors. They also learn to recognize additional policy-specific elements like goals and objectives, implementation mechanisms, and measures (or indicators) of policy achievement. In the second step, students get to hone their research skills, albeit with an emphasis on finding and collecting data that will be used in subsequent steps. They get to learn about different data formats (e.g., csv, tsv, spreadsheet formats, etc.) and exercise basic file management and data manipulation techniques. In the third and fourth steps, students get to work mostly with analytics software. In the third step they get to prepare their data and do the analysis using one or more of the analytical techniques taught. Thus, unavoidably they get to manipulate their collected data (e.g., pivoting, slicing, aggregating, etc.) and learn how to work with different data types, both from a computing perspective (e.g., string, double precision, and integer) and a statistical perspective (e.g., numeric, text, nominal, and ordinal). Finally, in the fourth step, they use data and analytical outputs to prepare structured reports that summarize and visualize analytical outcomes, typically in the form of 1-page summaries or policy analysis briefs.
Thus, students successfully completing the course get to develop skills in (a) policy [discourse] analysis; (b) researching, acquiring, and manipulating data from disparate sources using information technology, (c) using analytics software; and (d) applying a handful of data analysis methods.
Creating similarly multidisciplinary courses need not be complicated, given that public policies are multidisciplinary by nature and abundant in the real world. Indeed, we can think of no academic discipline that cannot be mapped to a public policy in one way or another. So, if we were to transfer this “paradigm” to other domains, we would start by identifying a policy institution and use their policies as the object of study upon which we would “fuse” the different disciplines. For fusing subjects between science disciplines, like in our case, we would focus on high-level policy analyses. For fusing subjects within specific science disciplines, we would focus on specific policies or specific parts of a policy. The key idea being that given a policy or a specific policy part is a real-world example of how two or more subjects may blend. So, to give a simplified example, given a construction regulations policy, policy analysis at how or why an engineering oversight (natural and applied sciences) may lead to health (health sciences), legal (law), psychological (humanities), or social (social sciences) consequences. Of course, we are not suggesting combining all these subjects in a single course. We are just trying to point out how disparate subjects can be paired under the policy “umbrella.”
Main outcomes and evaluation
In this section, we consider the main outcomes of this project and the way forward.
General aspects
From a digital-platform perspective, the course revolves mostly around three components. First, EU policy areas as analyzed and described in EU website (2019); second, the Eurostat website (European Commission, 2019); and third, the analytics software platform, in our case The Konstanz Information Miner a.k.a. KNIME (Berthold et al., 2008).
With respect to EU policies, their organization changes over time which would cause some inconvenience over the longer term with respect to the related instructional material. Policies that were main policy areas in 2016, when the module started, would eventually become sub-policy areas and our instructional links need to be updated more often than expected. Occasionally, this change also represents a shift in the policy priority (or importance) in the grander scheme of [EU] things.
Using Eurostat was, overall, a smoother experience. This was mainly due to Eurostat information remaining consistently organized for the most part. In the module, we used mostly the (a) the thematic organization (a.k.a. “Statistics by theme”) and (b) the A-Z data index, often contrasting them to (c) the complete “Database” tree and (d) the Eurostat “search” facility. While various Eurostat themes get reorganized as time goes by, the top-tier themes are consistent which makes things easier for visitors, in the long run. We also note that there is a lot of variation in the data maintained within Eurostat. Some tables stop being maintained and some tables are quite sparse. So, while an analyst may think that he has identified the right dataset for analysis, when working with the dataset, it may be that the data are too sparse to carry out the analysis, or that the country or the period of interest, or both are simply not available within the dataset. In turn, this prompts or stimulates the analyst to either identify an alternative dataset or plot an alternate analysis path.
The analytics software of choice got a mixed reaction from the target audience. Like most similar analytics software (e.g., Orange (Demsar et al., 2013), RapidMiner (Mierswa and Klinkenberg, 2019), etc.) the chosen software allows an analyst to build complex analytics workflows by sequencing together purpose-built analytic nodes. For example, use a node to read the data file and use another to filter the data before resorting to a third node to carry out a descriptive statistics analysis on all available data variables. Of course, it is up to the analyst to identify and choose appropriate nodes for the task at hand, as well as to piece together the workflow to carry out the analysis. This approach, coupled with the availability intricacies of the Eurostat data, often makes the trainee and less experienced analysts prone to Type I (false positives) and Type II errors (false negatives), depending on the context of the analysis of the course.
Given the mostly qualitative background for most of our students and the multidisciplinary context of the course, many found it challenging to get a good grasp of all instructional material. In most cases, we noticed that the real obstacle was a lack of generic computing skills that would hinder their ability to follow through the practical sessions and less so the cognition of the analytic method(s). On the other hand, just as many of the students were intrigued by the piece-wise approach to quantitative analyses and eagerly pursued routing nodes and forming complex workflows, which was rather encouraging for us to carry on our approach.
Semester course
The course is available as an elective for all the University of the Peloponnese students. In the host department, it did not replace existing courses on any of the subjects involved (i.e., policy analysis, quantitative methods, or information technology). As it is the norm in our university, the course duration is 13 teaching weeks which is ample time to go through all the material.
Given that the university’s departments are scattered in different cities, the only students that took the course were the students in the same city as the department, despite our expectation to the contrary. This narrows it down to two departments in the School of Social and Political Sciences, that is, the host department of Political Science & International Relations and the neighboring department of Social & Educational Policy. Students from other departments in other cities like Economics, Informatics, or Sports Management that would most likely find the course relevant to their studies did not take the course. In numeric terms, out of the 70 students who enrolled in the course, 66 were from the department of Political Science & International relations and four were from the department of Social and Educational Policy. Not counted are another two students who registered only in the course’s e-learning page without any further interaction in the context of the course.
We think the numbers are reasonable, given that multidisciplinary, university-wide courses are not as common in Greece; normally each department offers its own, self-contained curriculum. So, the reluctance of students elsewhere from the university was expected. This reluctance was probably augmented by the fact that the [other department’s] instructors are “unknown” to students [from other departments].
Profiling further the students taking the semester course, we note that all the students were from the School of Social and Political Sciences, that is, the two departments mentioned above. All were third or fourth year students, a constraint imposed by the curricula of the departments mentioned above. In essence, this implies that the students have but minimal number of courses in quantitative methods and their strengths lie, for the most part, in qualitative methods and approaches to policy analysis.
Summer school
The summer school was organized in the second and third academic years only, that is, 2017/2018 and 2018/2019, as an intensive 5-day workshop-style program. The 2019/2020 summer school was canceled due to the pandemic. Participation in the summer school was puzzling to say the least. For the 2017/2018 school, we had 13 successful applications but only 11 finally attended the school. For the 2018/2019 school, we had 21 successful applications but, surprisingly, only five finally attended the school. We are unable to interpret why this was the case.
Profiling the summer school participants yields a different picture than the semester course. The school participants came from various background, incl. computer science, engineering, economics, and humanities; most were either master students or recent graduates except for a couple of final year undergraduate students. Further, all the participants were motivated to join the school mostly to expand their knowledge toward the “new” domains covered by the course, and less to build on their existing one. So those from the “science” were keener to work on the policy analysis aspects, whereas those from humanities and social sciences were keener to work on their analytics. More importantly, despite the variability in educational backgrounds, the students completing the summer school seem to perform on par with each other, without substantial differences regarding comprehension and understanding. Granted, this needs further and more thorough investigation, but the initial indications are positive and promising.
The school duration was five “full” days (9am to 5pm) with a few small breaks between sessions. The first 3 days are dedicated to instruction, the fourth day students work on their capstone projects, and on the fifth day, students finalize their projects and present their work to the instructors and their peers. While this makes the school rather intensive, it also allows the students to go away with a tangible skillset and output.
Illustrative [student] achievements
In this section, we present, succinctly, a selection of policy analysis briefs produced by participants of all the module instances (i.e., semester course and summer school). For data privacy reasons, student names, when visible, were blurred/removed from the illustrations.
Where student material is in Greek, it is from the semester course, whereas material in English is from the summer school. In both cases, the students asked to perform a policy analysis and carry out the following as part of their “project”: a. Identify a policy area of interest. Within that, identify and analyze key aspects of the policy area at EU level, such as goals or objectives, stakeholders and actors, policy actions, and performance or achievement indicators. b. Consider the implications of the policy and question the policy effectiveness by applying one or more of the data analysis techniques learned during the class. c. Design and create a policy analysis brief summarizing the policy and analytical findings.
Students were encouraged to use analytics software used during teaching for their analysis to perform (b) and (c) above. In the examples below, the visual result often varies from one student to the next; given that none of the students had used a report designer before, we consider the outcomes at least promising if not highly successful. Each section represents work of one student and is titled according to the policy analysis topic processed by the student.
“Educational and vocational training”
In this example, the student focused on the educational policy discussing some of its objectives and trends (Figure 2, A 4-page policy brief; it reads left-to-right and top-to-bottom). The policy brief is from a student with a political science background but without any prior training in this type of analysis. Illustrative student work–A 4-page policy brief with discussion, charts and tables (Clockwise from top left corner).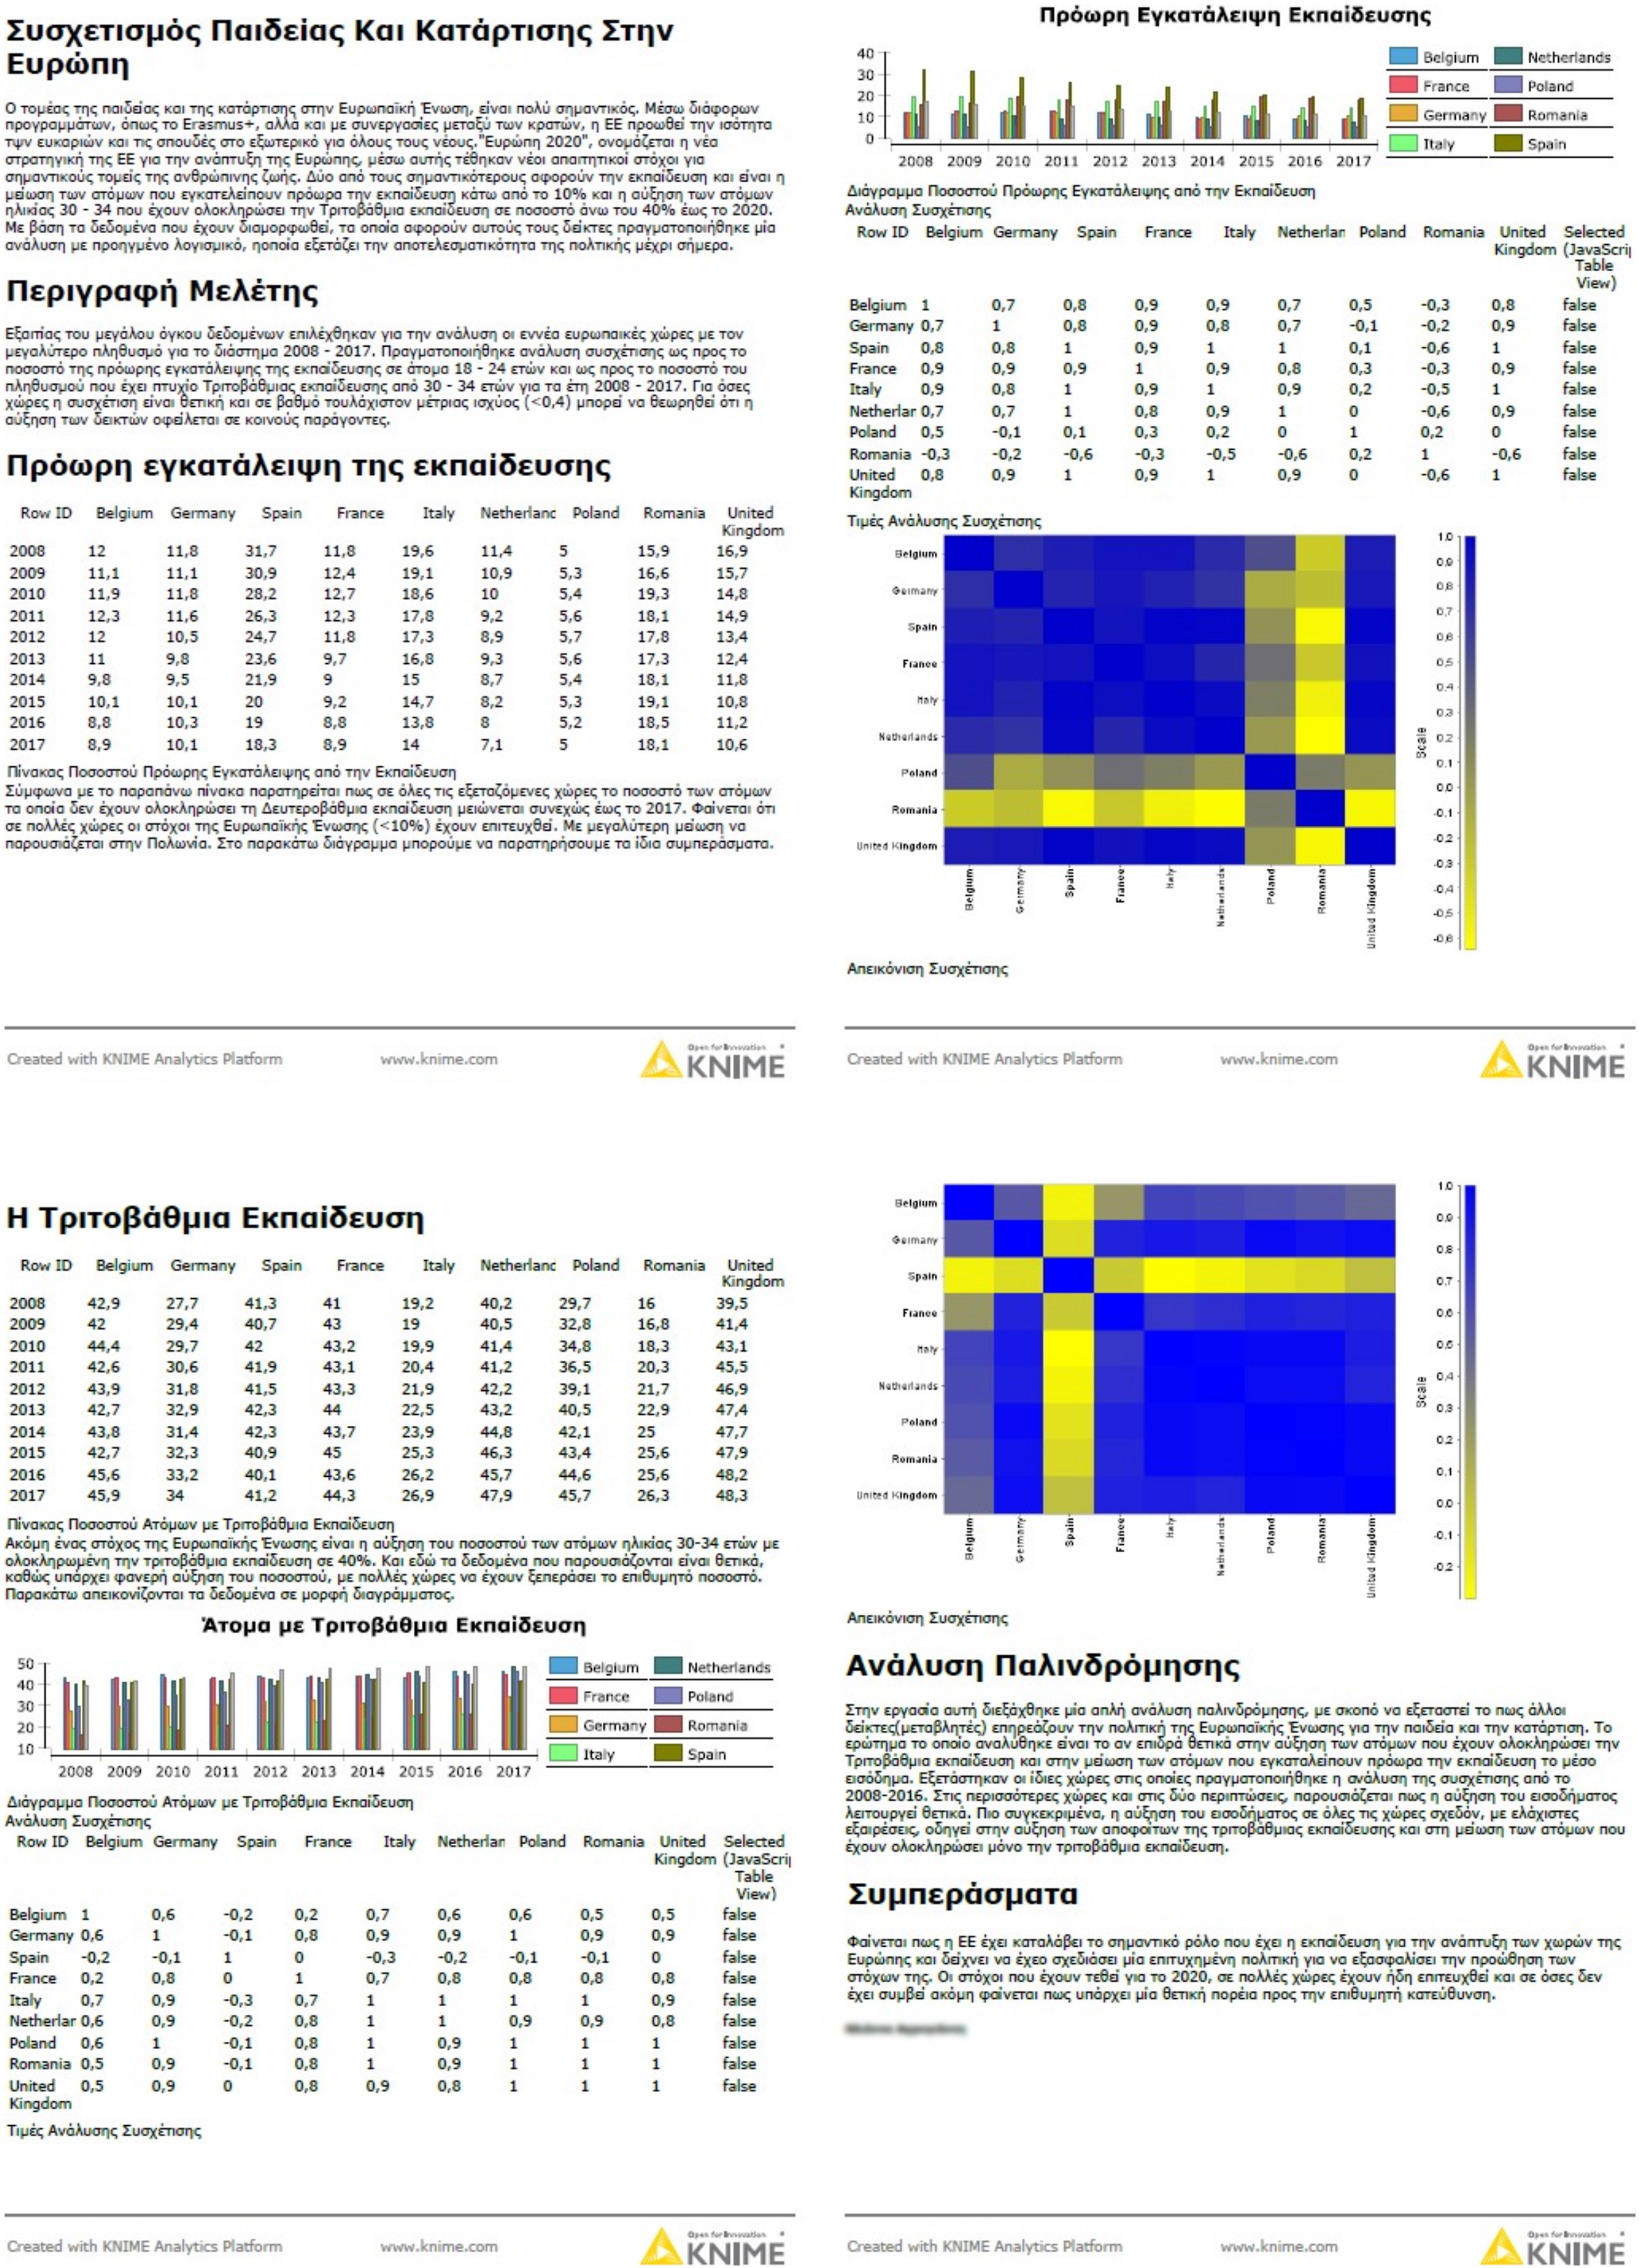
In addition, the student performed correlation analysis (a) the number of early school leavers, and (b) on higher education attainment between different EU countries. The correlation matrices are shown in the policy brief. A regression analysis was mentioned but is not illustrated in the policy analysis brief. The student used correlation analysis to study the correspondence in the selected education statistics among the countries in relation to the yardstick goal of which is acceptable, given that correlation is not causation. The analysis does not add much information in comparison to the data table, but due to correlations, one can argue in favor of a “European-wide” trend that needs further investigation.
“Agricultural policy”
In this policy analysis brief, the student focused on the agricultural policy. In particular, the student sought to examine the effectiveness of the policy to reduce phosphorus consumption because of green taxes using Denmark data (Figure 3; left-to-right and top-to-bottom). The policy brief is by a student with good IT skills and a qualitative background. Illustrative student work–A 4-page brief with discussion, charts, correlation matrices and a regression table. (Clockwise from top left corner).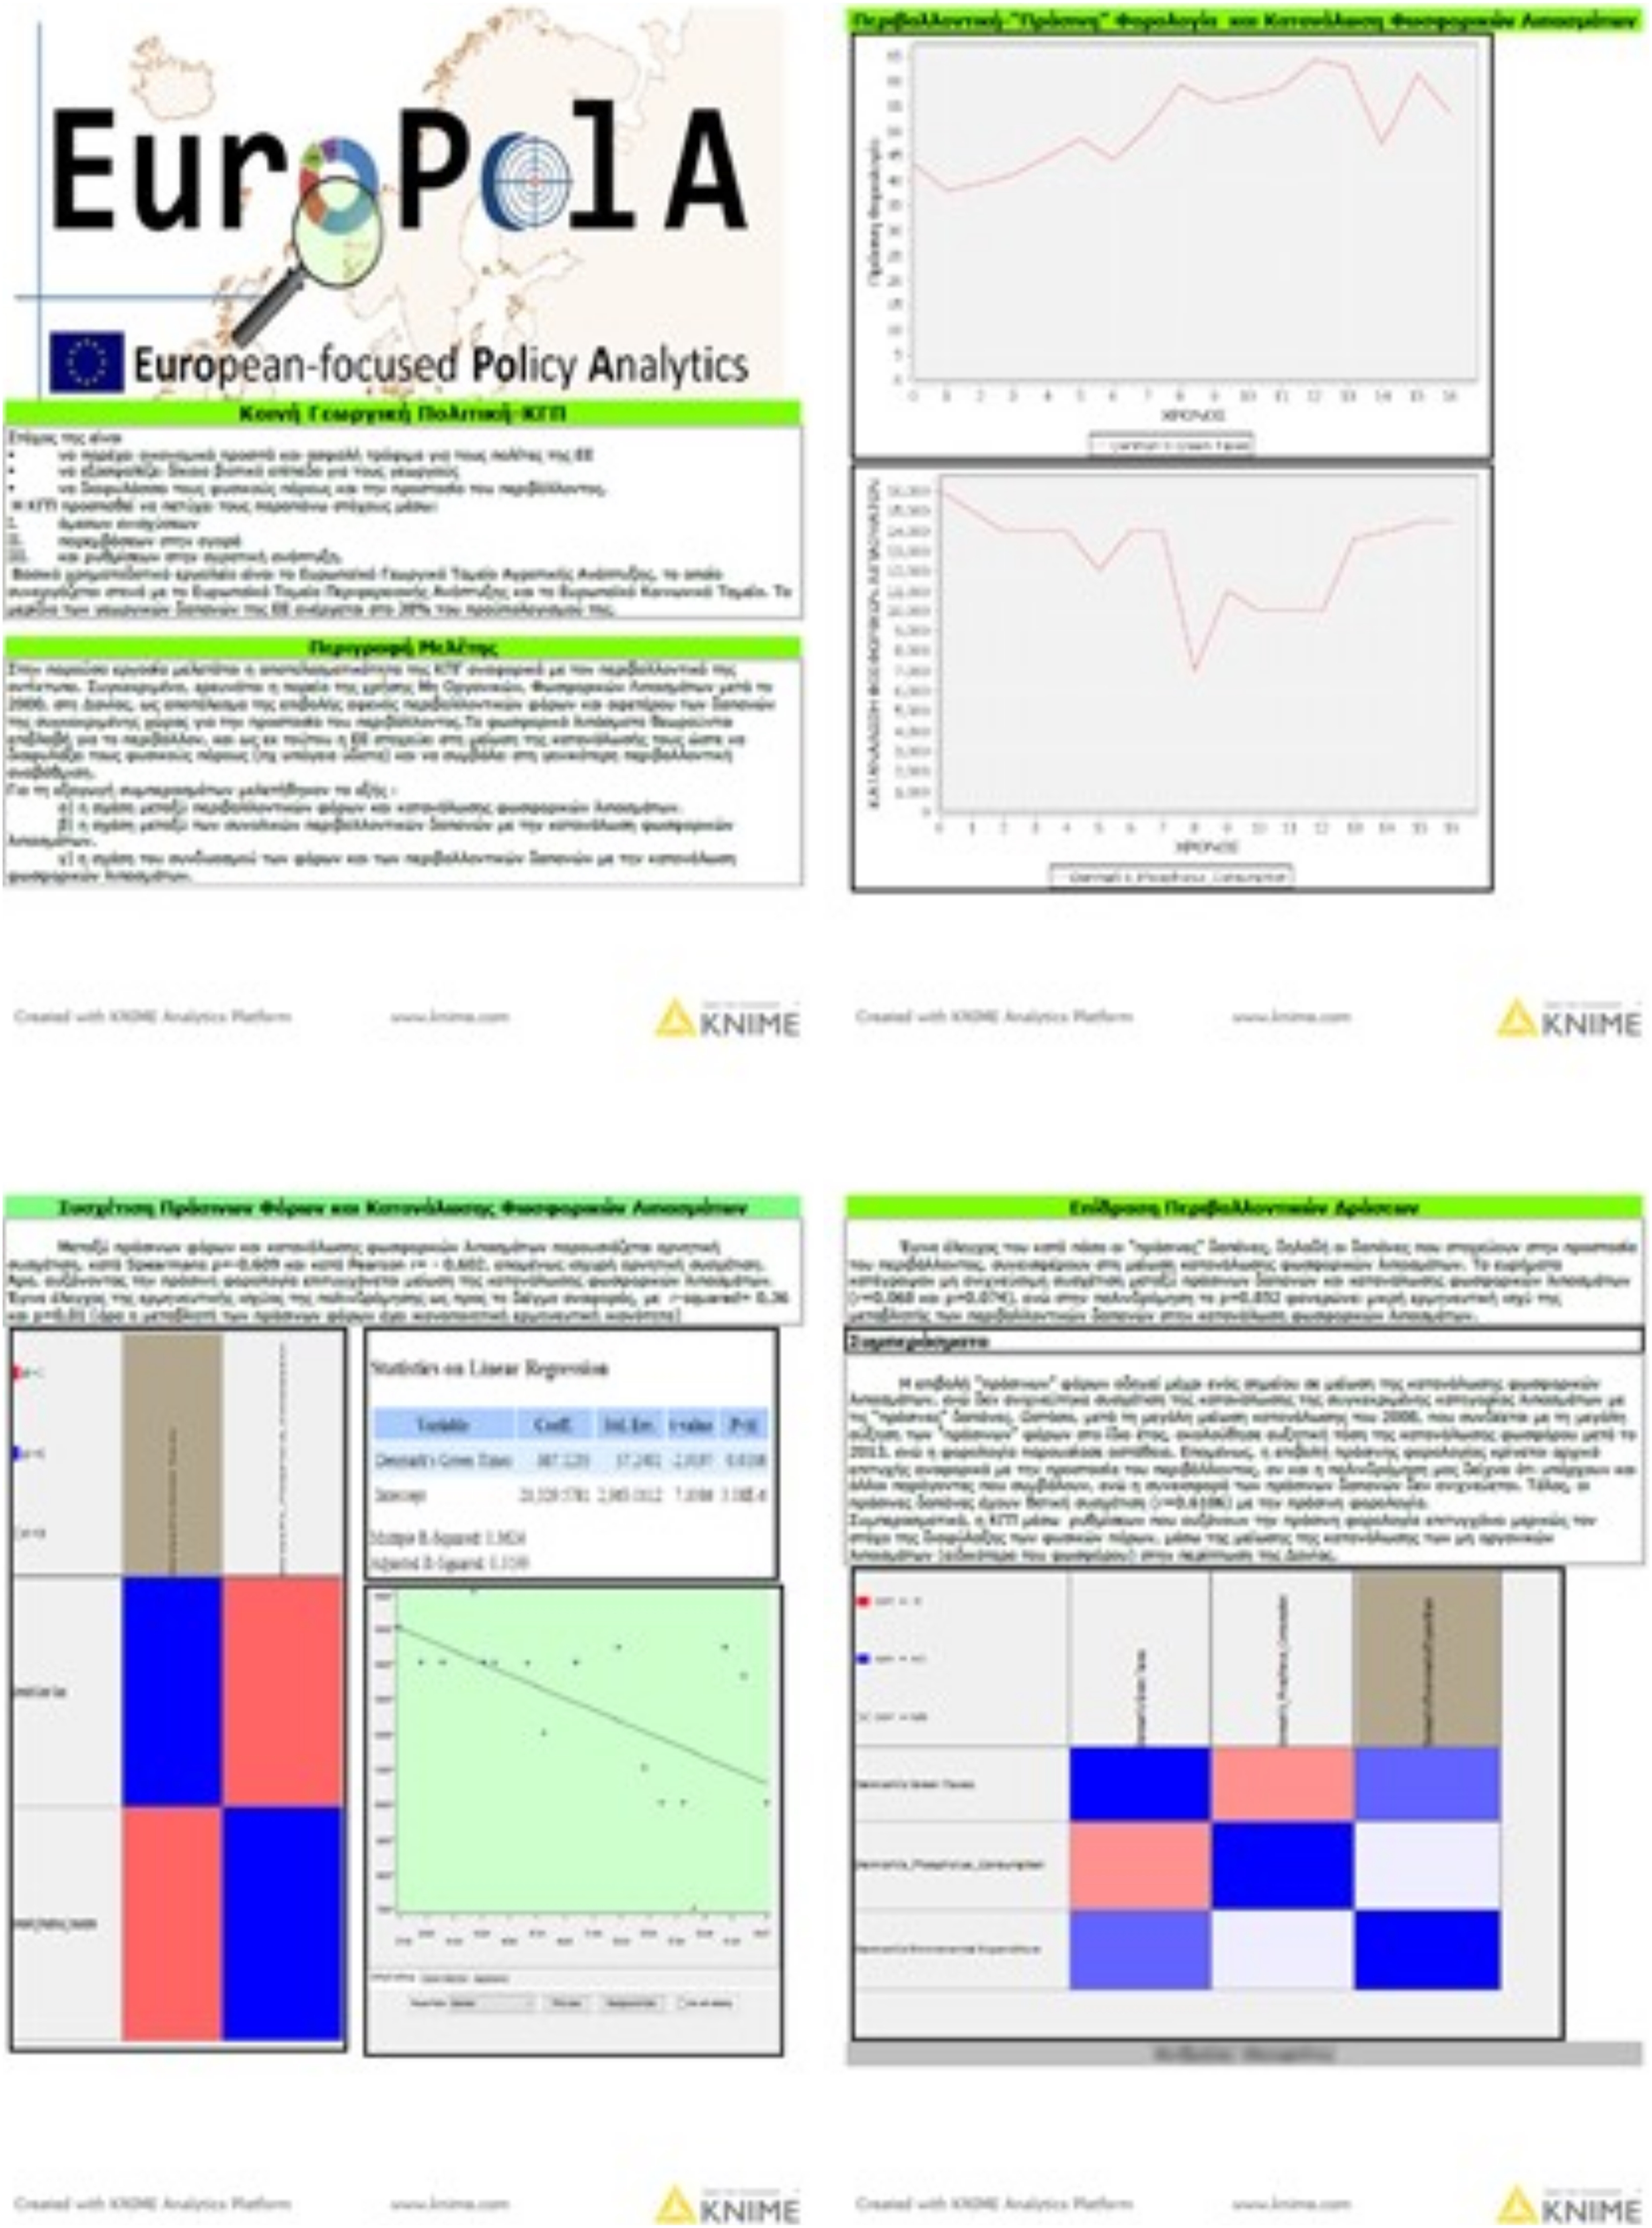
The student’s analysis shows that green taxes initially reduced phosphorus reduction but eventually phosphorus consumption picked up again. Also, green spending seems to be strongly correlated to green taxes (r = 0.61).
“Research and development”
This policy analysis brief was developed at the first summer school by a student with qualitative-only background. It looks at the effect of R&D expenditure on the number of researchers and the number of patents in the EU (Figure 4). Illustrative student work–A 4-page brief with discussion, charts, correlation matrices, regression table and a cluster analysis visualized on a map. (Clockwise from top left corner).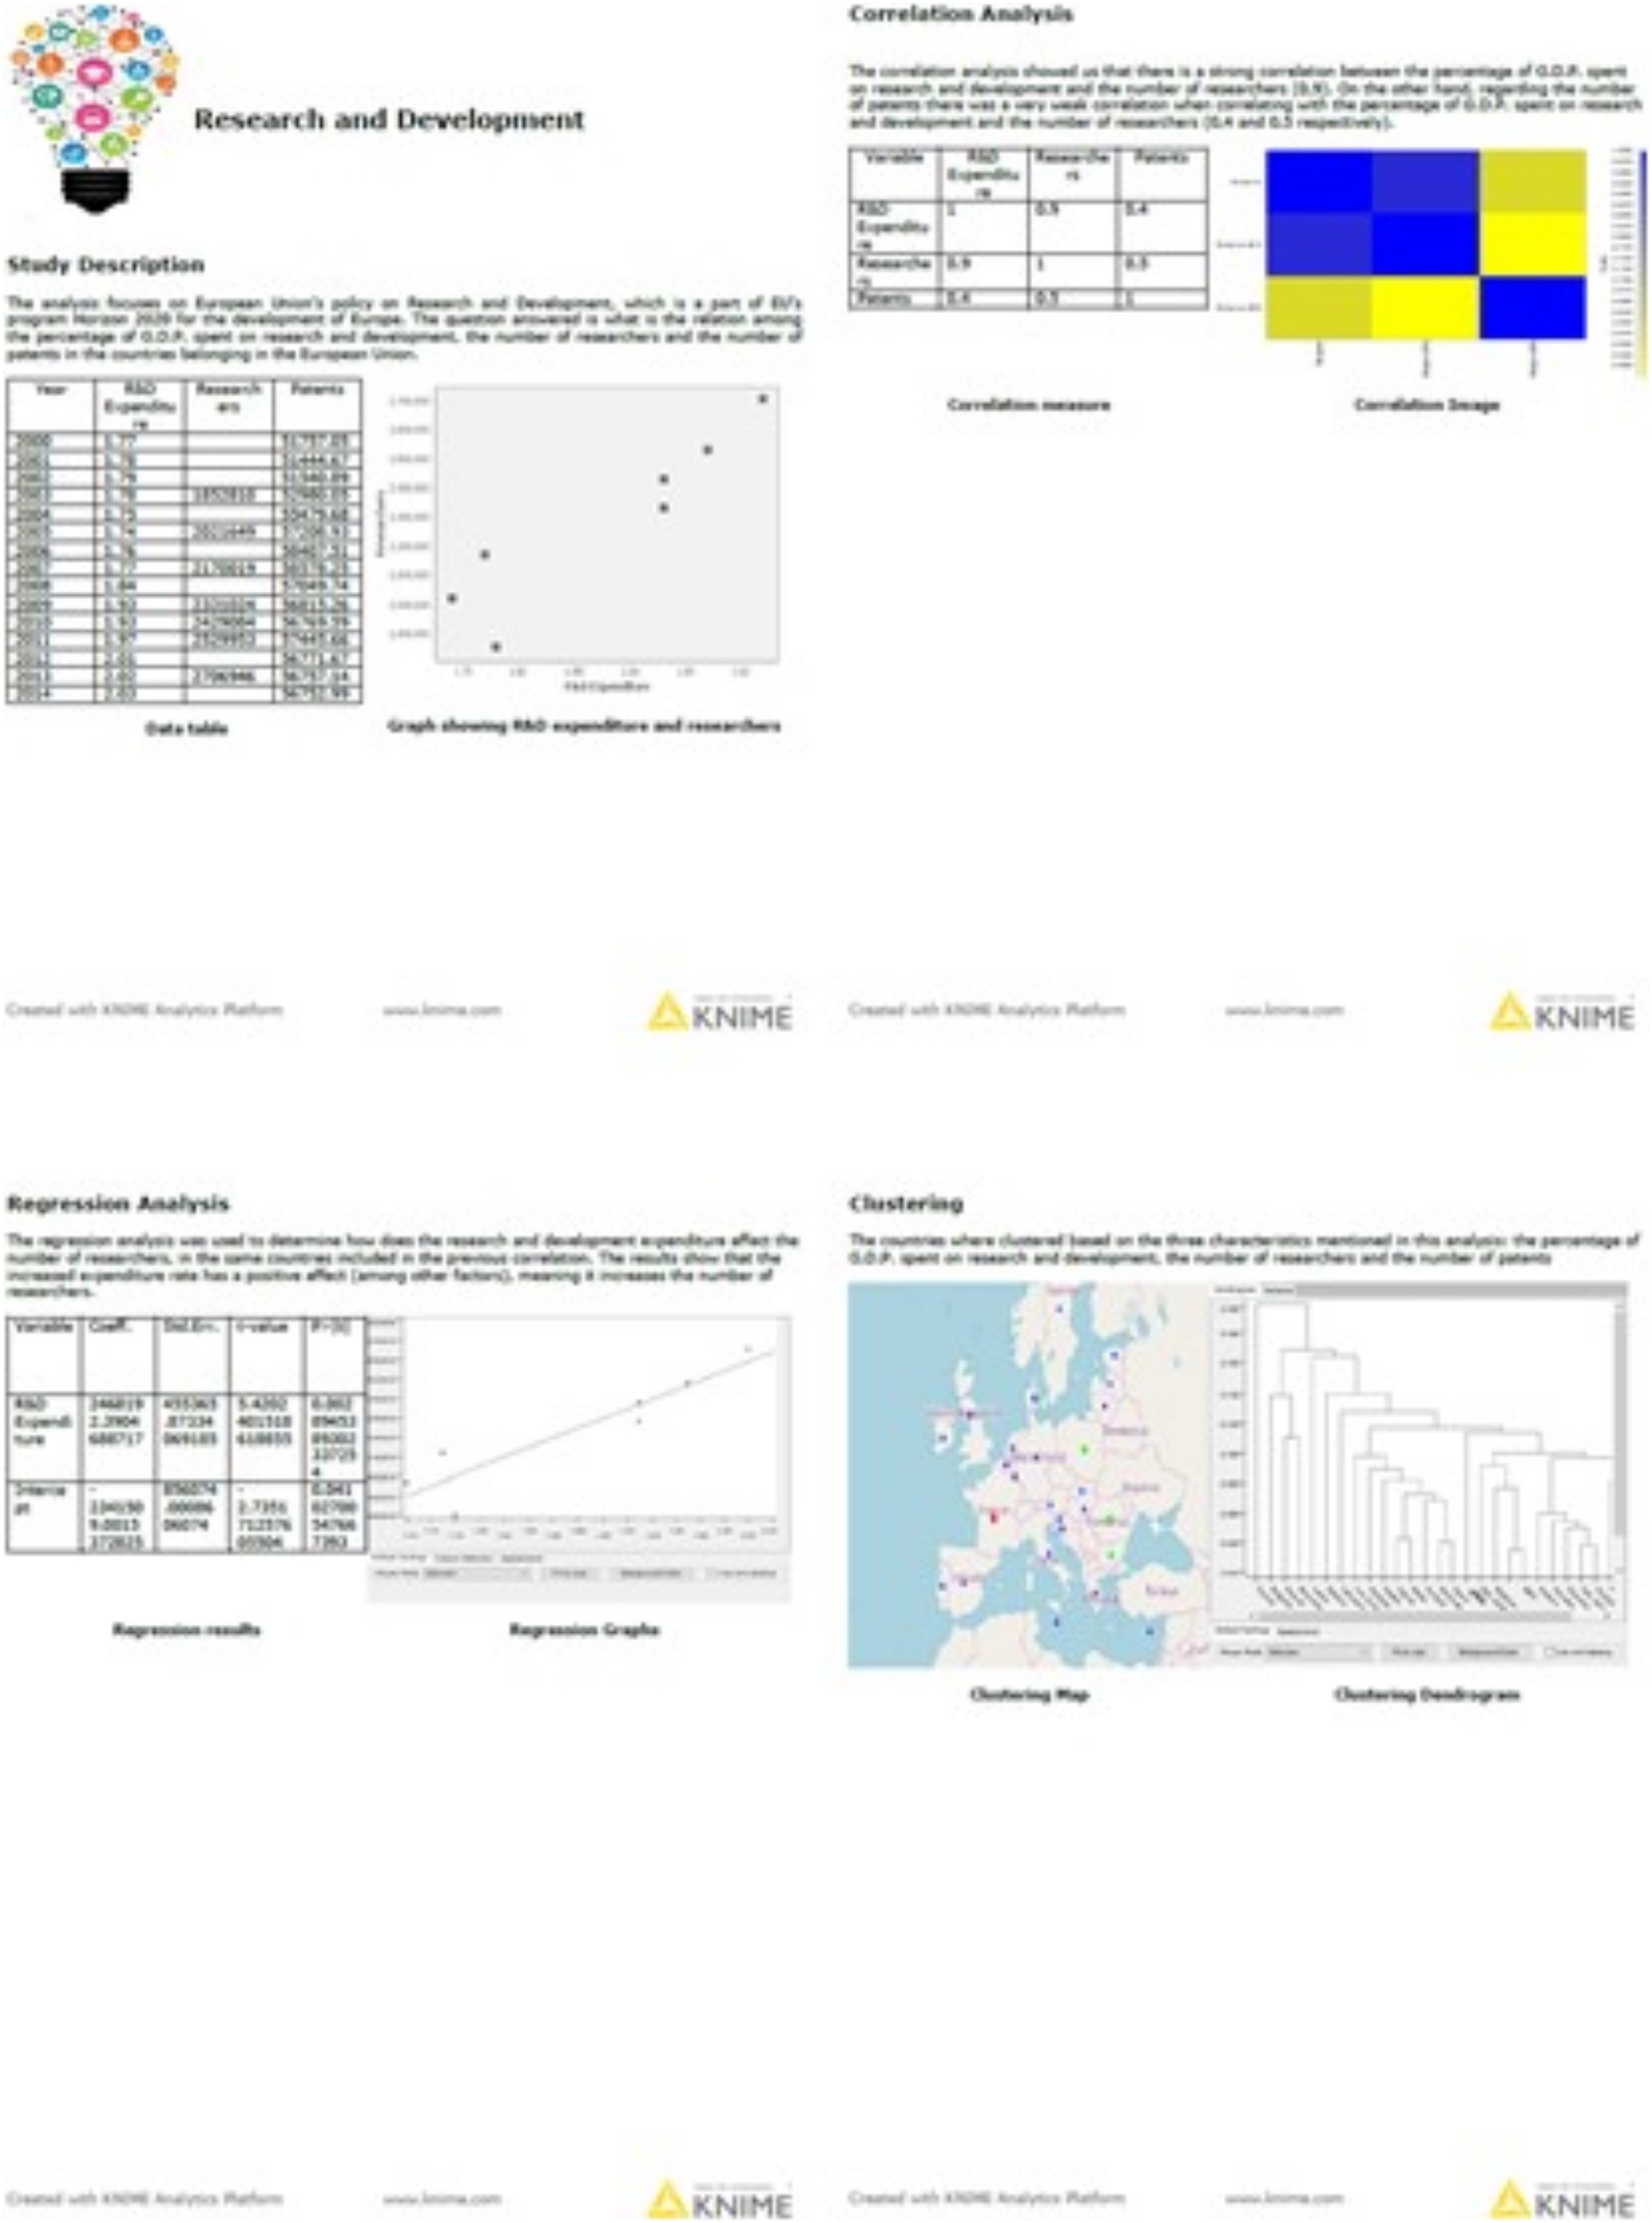
In addition to correlation and regression analysis the student carried out hierarchical clustering analysis to identify the most “similar” member states in terms of three analysis variables. The clusters were also visualized on a map.
“Policy actions on climate change”
In this brief, the student investigated climate actions at EU level. The student applied clustering and regression analysis. As a result, the student identified three EU country clusters that exhibit similarities in their climate actions and investigated whether energy efficiency is affected by factors like environmental taxes, the use of renewables and waste, and the budget commitment to [reverse] climate change (Figure 5). Illustrative student work–A 1-page brief with discussion a cluster chart and a regression table.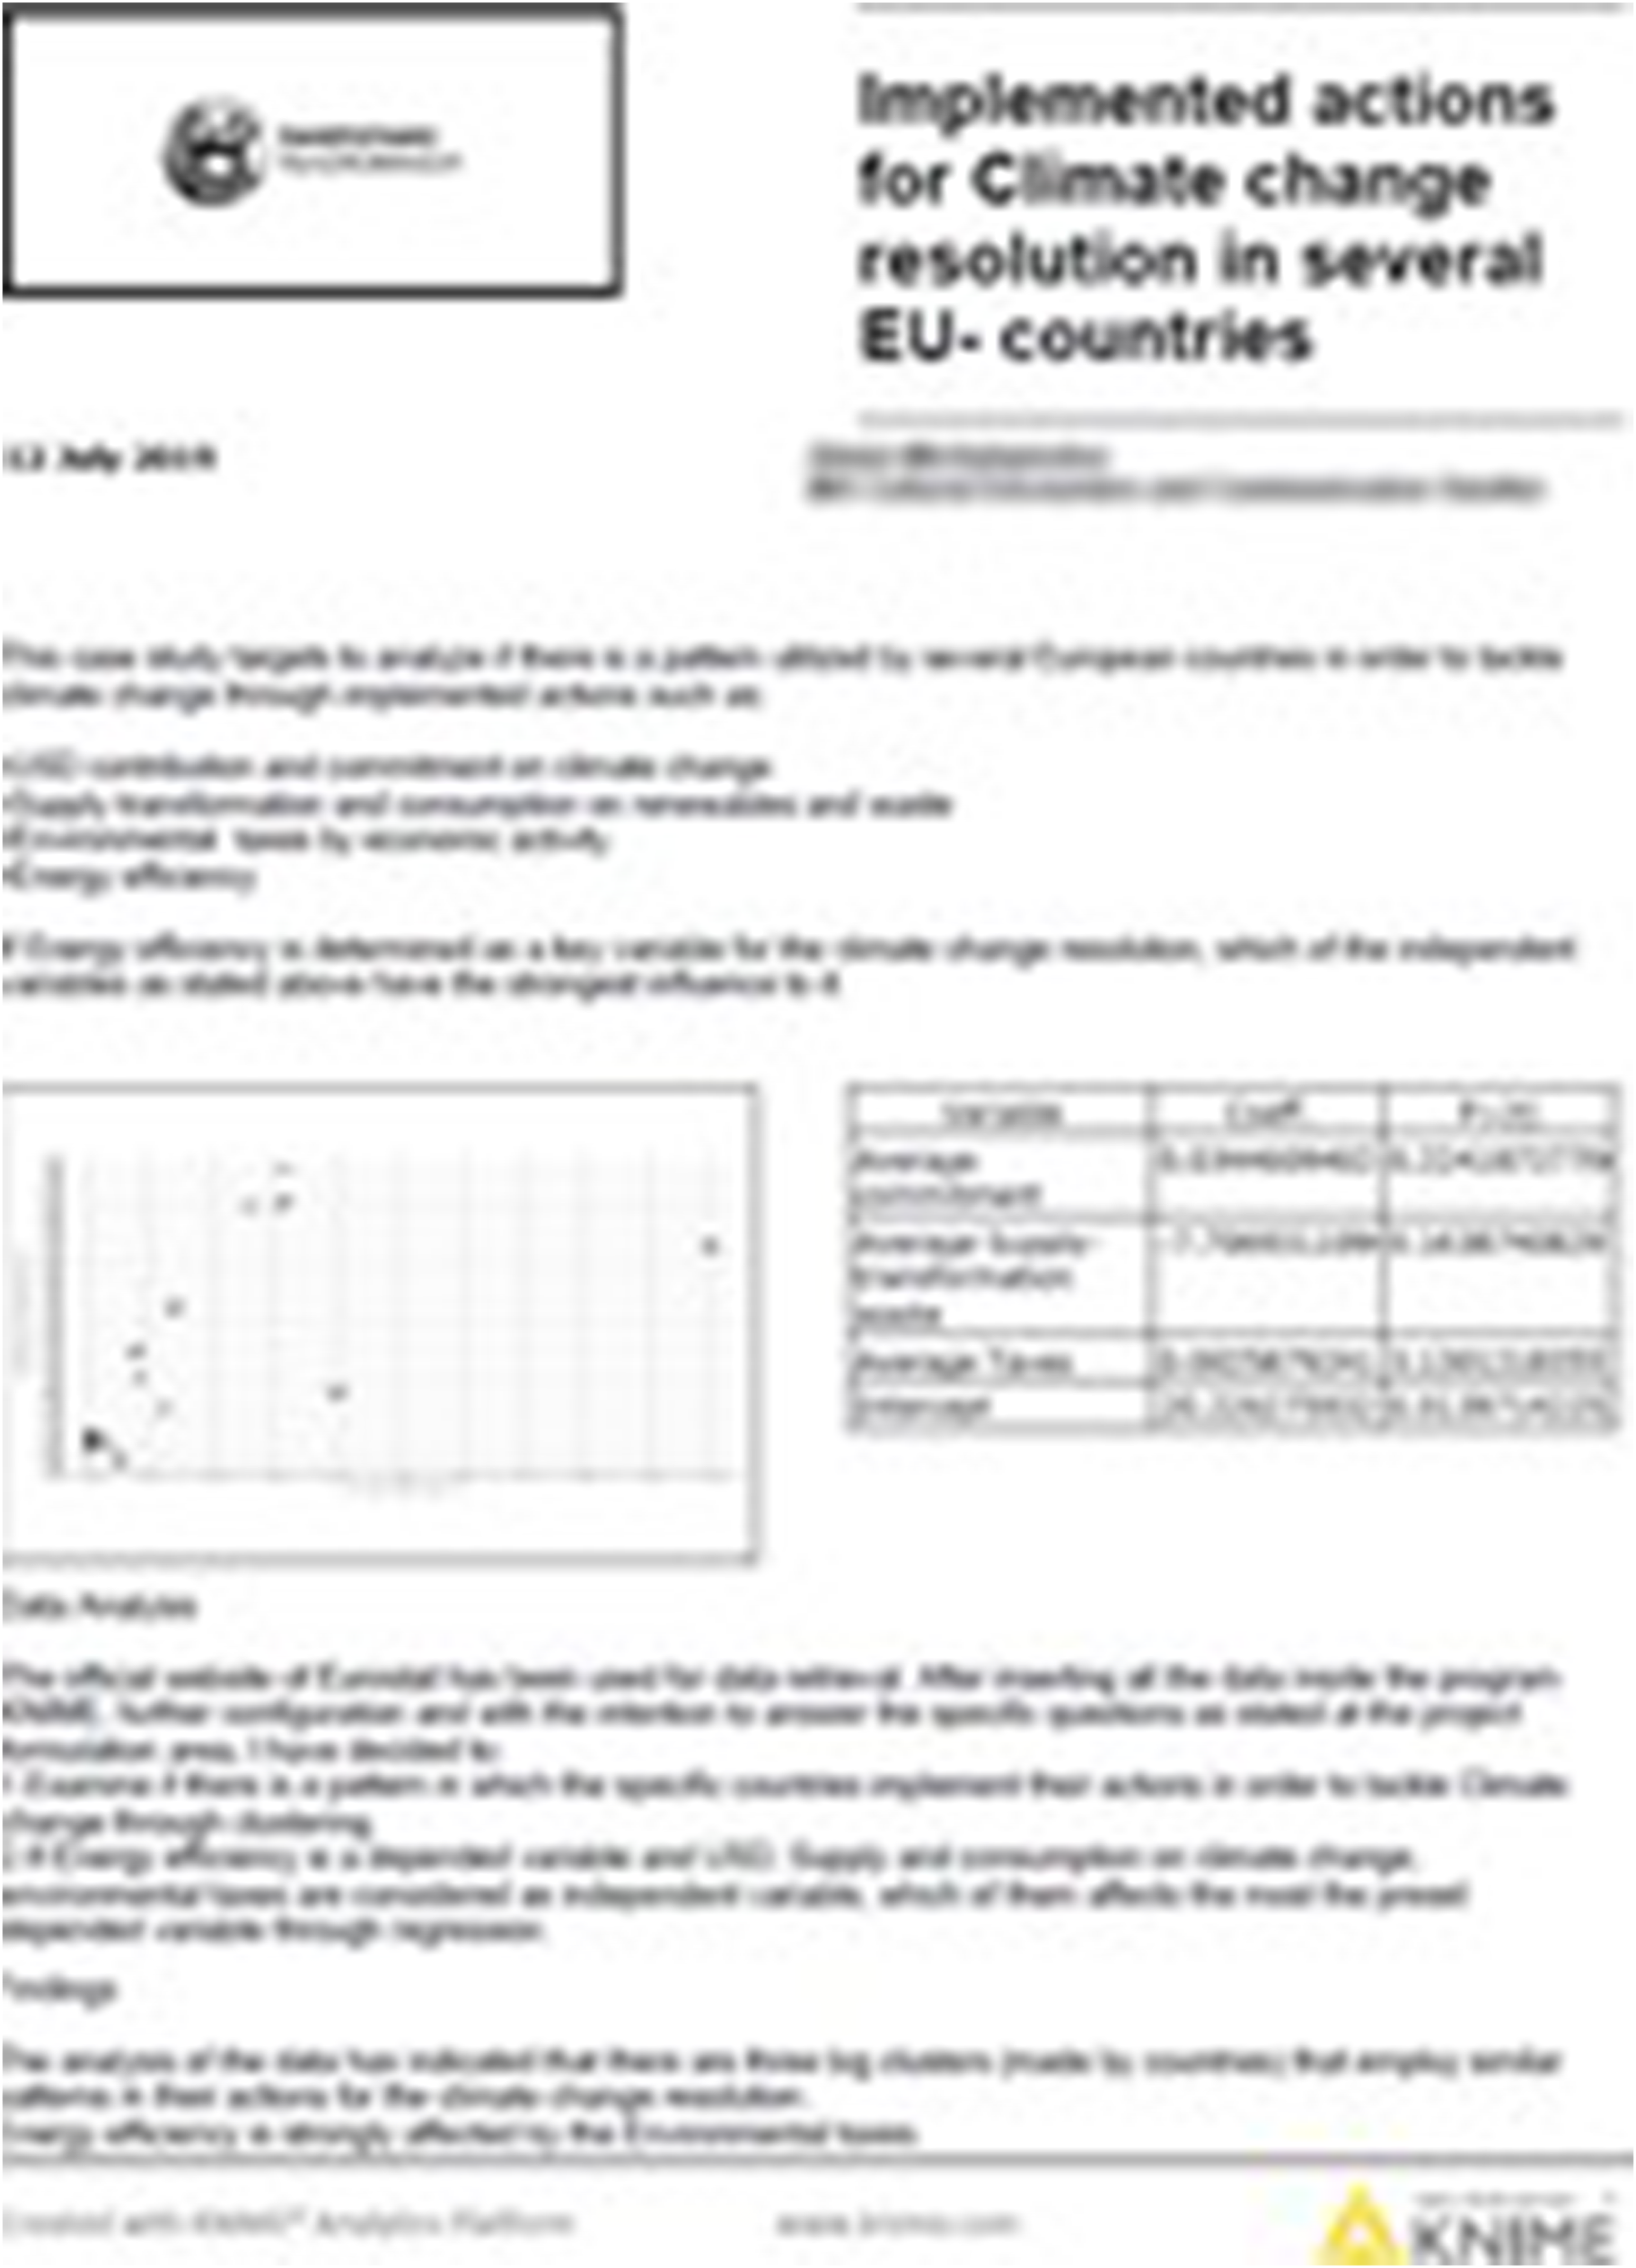
The student based its brief on data with respect to energy efficiency (the regression’s dependent variable), USD contribution and commitment on climate change, supply transformation and consumption on renewables and waste, and environmental taxes by economic activity.
“Unemployment by gender”
In this example, the student investigated unemployment by gender, contrasting Greece to the EU. The student implemented correlation and simple regression analysis to examine the relationship in unemployment rates among genders and between the EU and Greece (Figure 6). Illustrative student work–A 1-page brief with discussion, a scatter plot, correlation matrix and regression tables.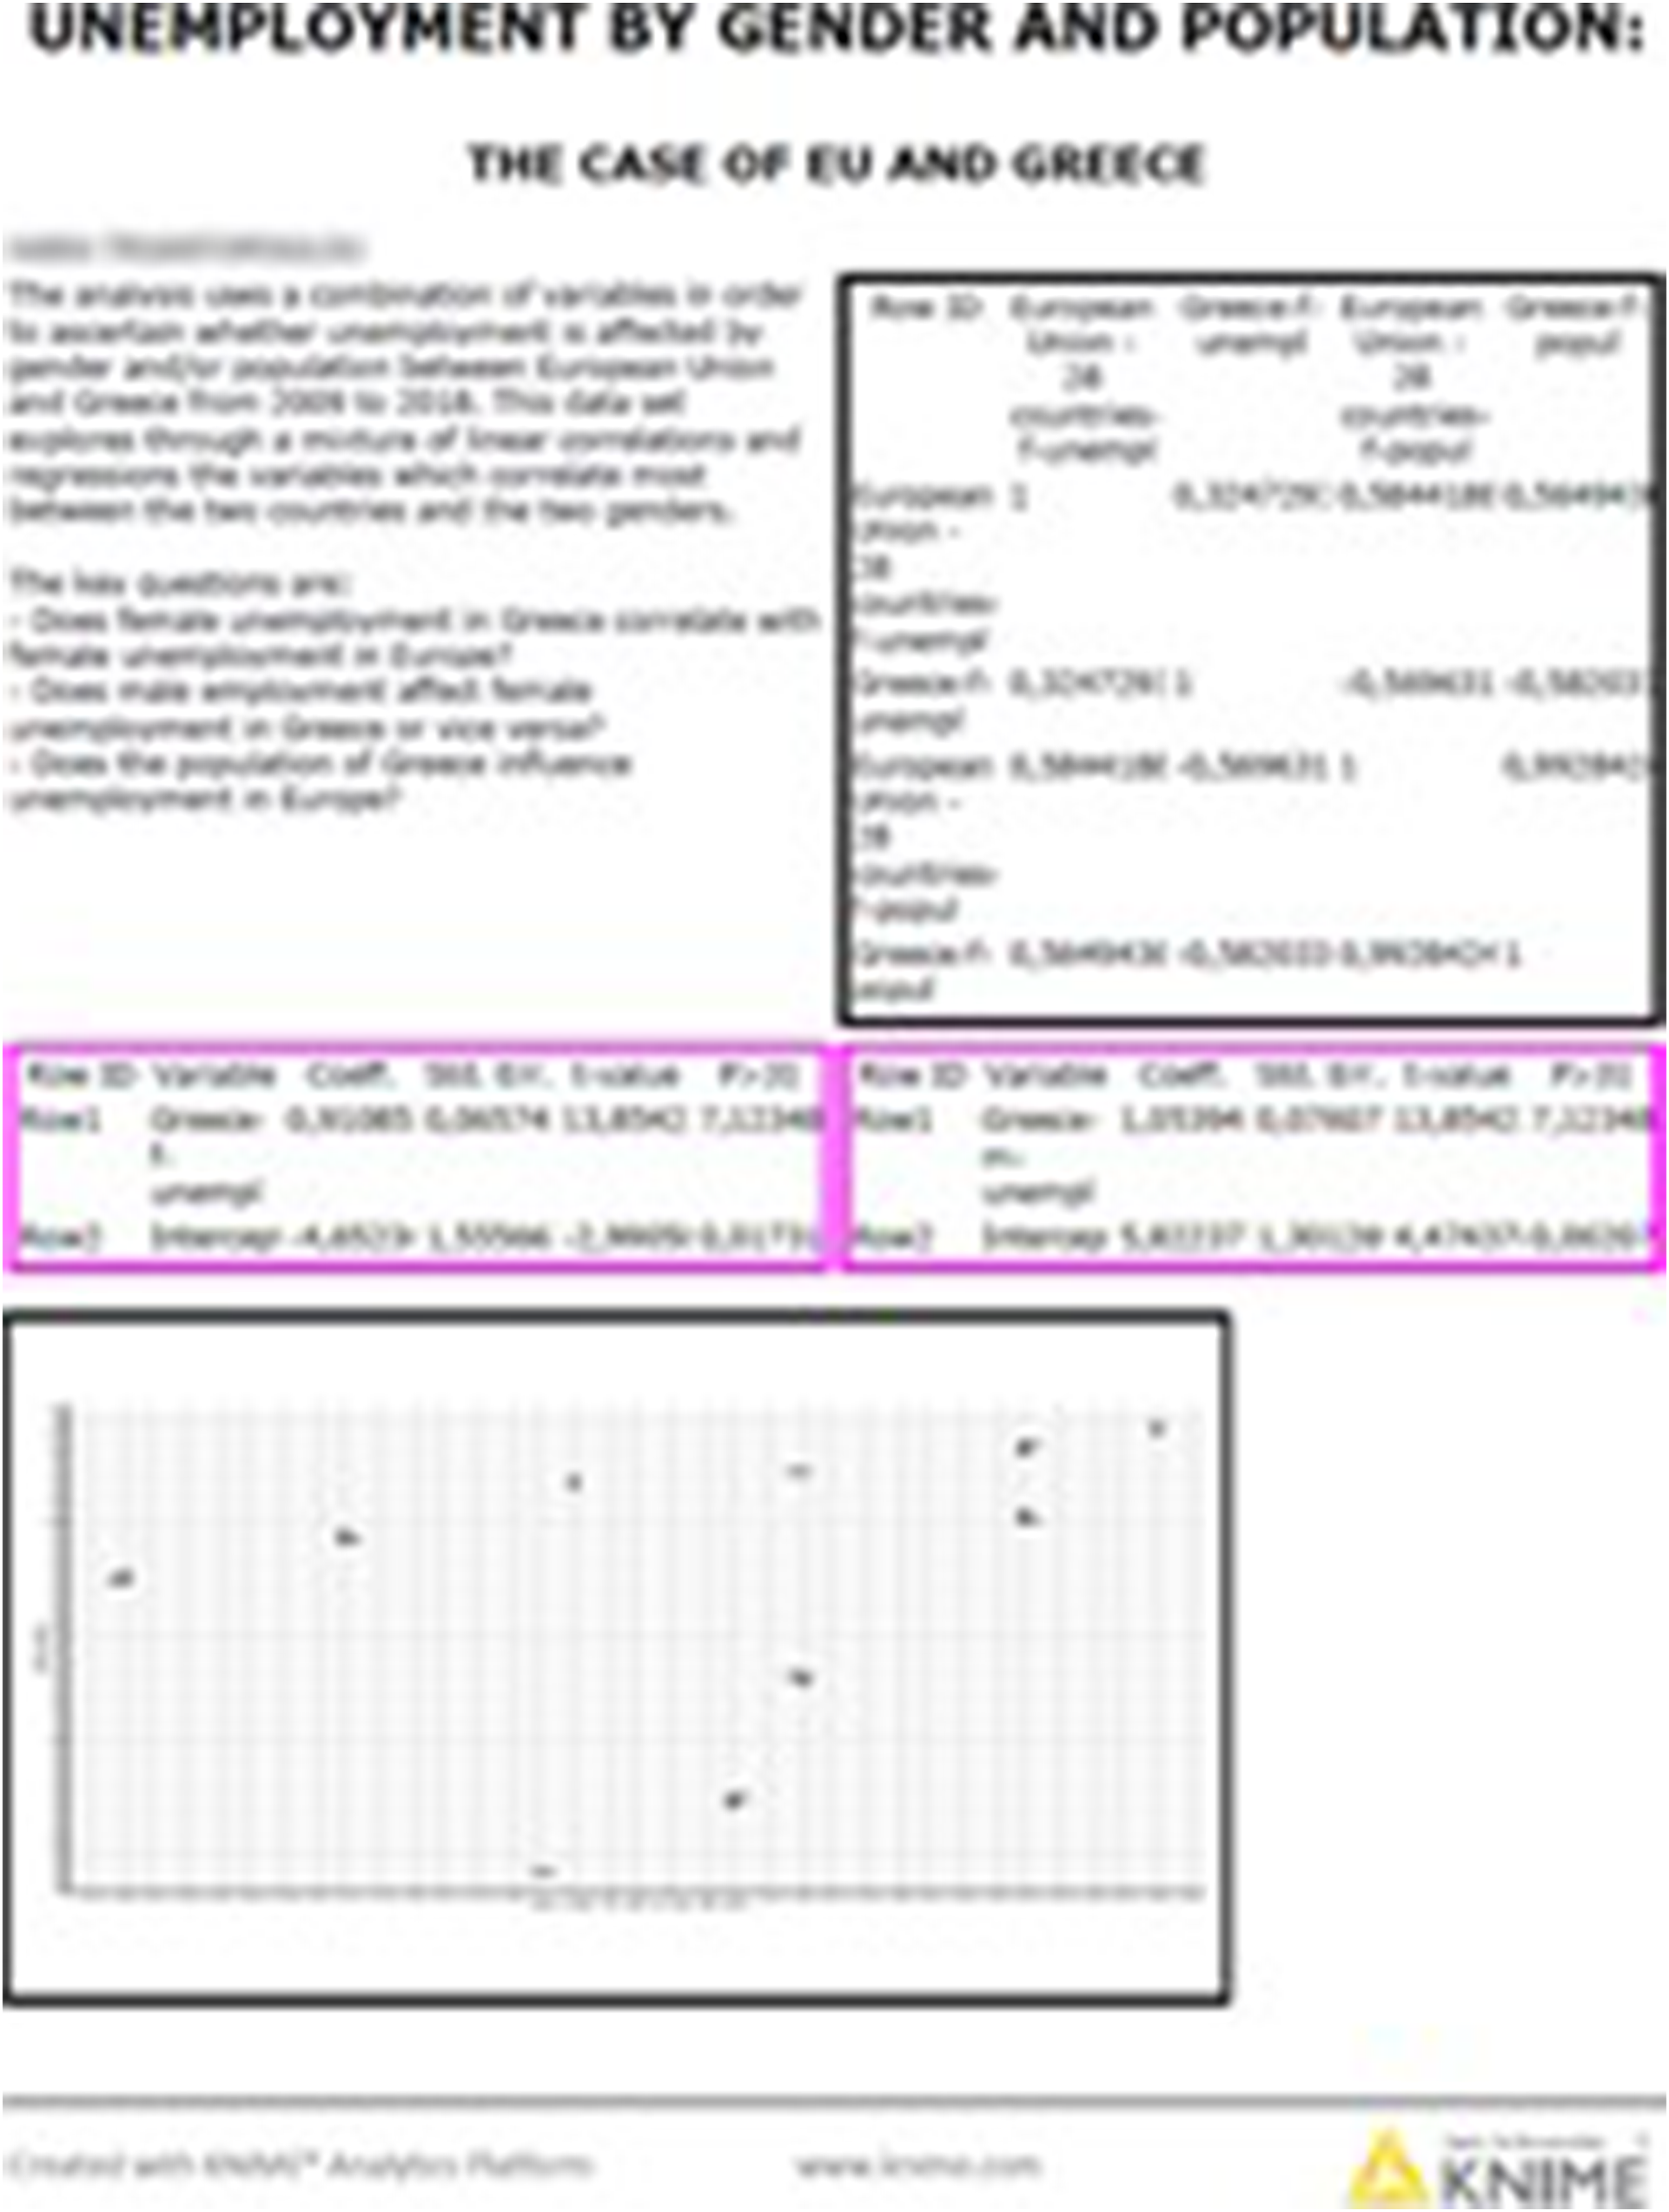
Lessons learned–concluding remarks
Our experience with the EuroPolA Jean Monnet module is most definitely a positive one and encourages us to continue along the same epistemological and methodological directions. Along the way, however, we also form several reservations that we are considering as we move forward.
First, we noticed that EuroPolA, being context specific, is less for a skills-seeking audience and more suitable to an audience who have a genuine interest in some form of public policy analysis. Thus, to elaborate this point, a person seeking to learn analytics or policy analysis, in general, is likely to benefit less from the EuroPolA approach than a person who understands or is interested in public policy looking for policy analysis skills. Second, we are somewhat confused by the pedagogical approach. The intensity of the summer school appears to be slightly more effective in “forging” an analyst’s skills across the board than the semester course. That is, almost all summer school attendees were able to design and implement the full analytic cycle of selecting a policy, finding data, analyzing it, and finally constructing a policy brief. Not all semester students were able to do so at first instance despite the longer training and content absorption period. Therefore, we need to re-evaluate our target audience and, perhaps, refocus the multidisciplinary material so that education outcomes can be improved across the board.
Beyond these reservations, however, the multidisciplinary content seems to be appealing to a relatively large number of people (or aspiring analysts), especially those with a social sciences or humanities background. We are now more confident that quantitative methods can be used successfully by aspiring analysts with little or no prior experience in such techniques or [software] technology, when these are fused with issues related to public interest—like public policies. If we could extrapolate a single motivation driver for our students and summer school attendees, it would most likely be their genuine aspiration to be able to (a) “phrase” their own questions for issues pertaining to public policy and (b) use “real” data to get some answers to these questions.
Τhe use of the EU as a workbench over which the students are being taught about policy analysis and analytics seems to serve rather well the scope of the course. Especially in the summer school sessions, the students appeared to be more motivated by the learning process, perhaps due to the real-life denotations related to working exclusively with the EU case study. This suggests that a multidisciplinary course, like the one described, benefits the most from building on a real-life [multidisciplinary] narrative, like the EU. In our case at least, the “bet” to use the EU as an “educational podium” seems to have served its purpose well and as expected.
Thus, we feel compelled to carry on this multidisciplinary effort, reinforcing its strengths while addressing its weaknesses. We are fully confident that our endeavor is a valuable contribution in multidisciplinary education.