
Abstract
Instead of asking whether money matters, this paper questions whose money matters in public education. Previous literature on education funding uses an aggregate expenditure per pupil to measure the relationship between education funding and academic performance. Federalism creates mainly three levels of funding sources: federal, state, and local governments. Examining New York State school districts, most equitably funded across school districts among the 50 states, this paper shows that neither federal nor state funds are positively correlated with graduation rates. Only local revenues for school districts indicate a strong positive impact. Parents’ money matters. This finding contributes to a contentious discourse on education funding policy in the governments, courts, and academia with respect to education funding and inequality in American public schools.
Keywords
Introduction
This paper revisits an old but unremittingly salient and contentious discourse in education policy: education funding in public schools. Previous literature has researched whether money matters or how money matters. These studies mainly inquired into the effective disbursement of education funding, connecting financial input with academic achievement. Instead of asking whether or how, this paper asks whose money matters in public education, thereby shedding new light on the subject. Explaining whose money effectively helps students achieve their academic goals in public schools offers significant policy implications for education funding policies. American federalism renders local governments the principal funding source and major authority in public education, thereby creating a great deal of variance in both funding and performance in publicly funded mandatory kindergarten to 12th grade (K-12) education; not only across states but also across school districts within a state. This paper suggests that only local funding matters, not state or federal sources.
Disparities in education funding are believed to be the major culprit of the academic achievement gap. To explain the difference between outstanding public schools with higher test scores and graduation rates, and failing ones with lower scores and dismal graduation rates, education funding research invariably focuses on how much money is spent on each student as a proxy for the government’s financial effort in public education. They examine expenditure per pupil in relation to student academic performance in order to verify the link between resource input and achievement output. Education spending is, however, an aggregate measure of the total amount of funds from multiple sources, namely federal, state, and local governments. Expenditure per pupil does not describe who pays for public schools, but only gauges how much of the collective fund is invested in each student. This paper suggests that who pays for public education matters, but in fact it should not matter on the grounds that public education ought not to be a private good in the market where who pays more receives better services.
This paper presents public education as a “public” good that is inherently different from private goods and services. 1 State constitutions acknowledge quality education as a right to which every child is entitled. Funding for the provision of public education is collectively contributed by means of taxes. The receipt of such provision is somewhat non-excludable regardless of individual contributions as long as they reside in the school district. For this public good rationale and more equitable education funding, state, and federal governments intervene to subsidize local governments. On average across 50 states in 2017, local governments contributed about 8% of the funding while states and local governments split the rest almost in half, 47% and 45% respectively. 2
According to a Census report, 3 New York State (NYS) spends the most on public elementary and secondary education among the 50 states. During the fiscal year of 2017, the total spending per pupil in NYS was US$23,091, almost twice the average of all states in the US (US$12,201). Spending on instruction, excluding administration costs, was also the highest in NYS amounting to US$16,113 per pupil, which was over double the US average of US$4712. Due to the state government’s progressive initiatives toward public education, 4 New York is the most equitable state by the standard of public education funding, meaning that the disparity between the top and bottom on the range of spending per pupil is minimal compared to other states. 5
Despite this relatively equitable funding policy, New York school districts show a great variance in academic achievement. Two nearby school districts in the Rochester metropolitan area spent approximately the same amount of money on each student, but their graduation rates lie in stark contrast. According to the NYS Education Department, the Pittsford Central School District spent US$22,394 per pupil during the 2017–2018 academic year and produced a 96% graduation rate and 1% dropout rate in the same year. The Rochester City School District spent US$23,289 per pupil during the same period and reported graduation and dropout rates of 52% and 22%, respectively. By general education instructional expenditures, excluding special education instructional expenditures, both school districts spent approximately US$11,640 per pupil. 6 Two school districts are the same in terms of expenditure per pupil, but different as to the share of funding from the three levels of government. Pittsford Central School District heavily depends on revenue from its suburban local community while Rochester City School District does less so.
This paper examines education funding by revenues from different sources, not by school district expenditure, to explain the causality between education funding and school performance. Specifically, this paper explains the relationship between revenues per pupil in 2017 and graduation rates for New York school districts in 2018. Based on the evidence from the NYS school districts, this paper explains whose money matters in student achievement. Regression analysis shows that the federal and state governments’ financial aid does not seem to positively affect graduation rates. In fact, the size of state aid to school districts is negatively correlated with graduation rates. Local revenues, primarily from property taxes, turn out to have a significantly positive impact on graduation rates. Therefore, money matters, but only money from local communities creates substantive changes in student achievement.
The public policy implications of these findings are substantial, provided that most education policies to alleviate inequality in education funding impose the tasks onto state and federal governments by requesting a funding increase. Education finance reforms started when court rulings ordered states to provide supplemental aid to make up the local revenue deficient in school districts. Extra support from state and federal governments seems essential and necessary for quality public education, especially for less resourceful school districts. But by itself this outside assistance is hardly a sufficient condition to achieve quality education. This paper’s regression analysis confirms that spending matters for student achievement, and expenditure per pupil does have a positive impact on student achievement. However, it is only local funding as one element of that expenditure that supports that positive relationship. Therefore, increasing the overall expenditure by providing additional state or federal funding might not necessarily result in meaningful progress for students.
How this paper contributes to the research on education funding is briefly summarized as follows. First, different from the previous studies, this paper examines revenues, not expenditures spent on students. Focusing on the revenue sources, this paper answers the question of why money matters in public education by proposing that it is only local money that matters. Second, this paper draws upon multidisciplinary literature to view the controversial issues regarding education funding. Centering on education policy, this paper connects to diverse fields including political science, economics, psychology, and sociology in the literature review. Third, this paper suggests how parents purchase good public education for their children similarly to how they buy ordinary private goods and services. Fourth, this paper indicates a policy direction regarding the decades-old education funding policy controversy.
The remainder of this paper comprises of three main sections: literature review on education funding studies, empirical analysis on the relationship between education funding and graduation rates in New York school districts, and discussion on regression analysis findings, followed by the conclusion.
Literature review
The prevalent question in academia, politics, and the courts
The causal relationship between education funding and academic achievement has been intensely debated not only among scholars and politicians, but also in court. In academia, for the past few decades scholars have continued the debate on the effectiveness of school resources on student outcomes (Hyman, 2017; Baker, 2016; Ferguson, 1991; Greenwald et al., 1996; Hanushek, 1989, 1994). Since the Coleman (1966) report, non-pecuniary factors for quality public education have surfaced as one of the main research considerations. Hanushek(1989, 1994, 1997) claimed that school management is more important than physical and financial resources, emphasizing teacher quality and school management more than financial input to schools. After exchanged disputes between Hedges et al. (1994a, 1994b) and Hanushek (1994), 7 Hedges et al. (1994b) reconfirmed their position in “Money does matter somewhere: A reply to Hanushek.” Baker (2016) concurred with Hedges et al., positing that “on average, aggregate measures of per pupil spending are positively associated with improved or higher student outcomes” (iv).
Politicians express pessimistic views questioning the effectiveness of education spending. After the Great Recession, most states contracted education spending. State K-12 funding in 2014 was below the level of 2008 in most states. Governors questioned the causal relationship between state aid and academic output in public schools. Florida Governor Rick Scott, New York Governor Andrew Cuomo, and New Jersey Governor Chris Christie mentioned the negligible impact of states’ financial effort for education in relation to meaningful outcomes (Baker, 2016: 1). Governor Christie proposed a reform in 2016 to ensure “equal funding for every child” to equalize per-pupil education funding at the level of US$6599 regardless of other differences across districts including poverty rates. 8
In the case of Maisto v State of New York (2017), the causal relationship between education funding and academic performance was at the heart of the issue. The Maisto case, also known as the “small cities” case, was brought by parents of small city school districts across NYS, who asked the court to order the state to appropriate additional funding for those school districts to comply with the New York Constitution that guarantees a “sound basic education” for all children (Education Law Center, 2014-2015a; Education Law Center, 2014-2015b; Education Law Center, 2014-2015c). The trial generated more than 5000 pages of transcribed testimony and 365 exhibits totaling more than 50,000 pages to judge “whether the evidence of inputs, outputs and causation establish that defendant [State of New York] has failed to provide constitutionally sufficient funding.” 9
From whether money matters to which resources matter
The education funding discourse has extended beyond a seemingly simplified question of whether money matters. It is unequivocal that money is necessary for quality public education to achieve the constitutional obligation of governments at the federal, state, and local levels. Explaining the causal relationship between money input and academic performance output, Baker (2012: 7) focused on whether “things that cost money” matter, such as teacher salaries and class sizes. Cohen et al. (2003) shifted the research question from whether money (or resources that money buys) matters to “what resources matter, how and under what circumstances” (134). Resources can either facilitate or inhibit teaching and learning, which then leads to academic performance; however, it is only instruction by teachers that truly causes learning. Not relying on the conventional definitions of school finance such as revenues and expenditures, Grubb (2009) suggested broader conceptions of resources and thereby emphasizes the effects of such resources on schooling outcomes. He summarized that “dollar bills do not educate children. Teachers with particular instructional approaches, principals capable of instructional leadership, schools with supportive climates, and many other resources do” (Grubb, 2010: 52).
Teacher quality, class size, and district size
Scholars agree that teacher quality is the most important factor in improving education quality. It is not certain, however, that higher teacher salaries are undoubtedly correlated with students’ academic achievement (Hanushek, 2016). Measuring the impact of pecuniary inputs into schools on academic achievement, scholars compare class size reduction with teacher effectiveness. A group of economists based at the University of Texas at Dallas (UTD) Texas Schools Project concluded that an incremental increase of teacher quality is equivalent to the class size reduction by 10 students, which is significantly more costly (Rivkin et al., 2005).
If a strong sense of community is the most coveted public education environment, a large school district could lessen the community impact on public education. It could be more challenging for parents to make an influential and united voice in school district budget forums and district Parent Teacher Student Association (PTSA) meetings if they are dispersed living in different neighborhoods and are heterogeneous in socioeconomic standards. Characteristics of large public school districts tend to correlate with other factors that predict low academic performance as well. In the 100 largest public school districts, the majority student body are minority students. They also have a higher to median pupil/teacher ratio and a higher share of students eligible for free or reduced-price lunch (Sable et al., 2010).
Family factor
Parents’ income, education, and involvement in children’s education are contributing factors to children’s academic success. While economists focus on household income, sociologists and psychologists delve into parental involvement and parental aspiration or expectation for their children’s educational achievement.
Family income correlates with students’ mathematics and reading achievement. Dahl and Lochner (2012) estimated an increase of mathematics and reading test scores by 6% of a standard deviation for an additional US$1000 household income. Based on the combined data from welfare and anti-poverty experiments in the 1990s, Duncan et al. (2011) presented a similar estimate: young children’s achievement increased by 5–6% of a standard deviation per US$1000 income increase.
The relationship between parents’ socioeconomic status and children’s academic achievement was confirmed by Sirin (2005) in his meta-analysis on published studies between 1990 and 2000. Shea (2000) questioned this causal relationship showing that parents’ income has a negligible impact on children’s earnings and years of schooling. Only among children with less-educated fathers (i.e., fewer than 12 years), parents’ income turns out to have a positive impact on their children’s future. Most parents’ income, including low-income families, did not exhibit a positive intergenerational benefit on their children’s future socioeconomic measures (Shea, 2000: 180).
The relationship between parental involvement and academic achievement has long been studied. Scholars’ present findings highlight several critical factors that seem to encourage students’ academic achievement. Those factors are parents’ expectations and aspirations for their children’s school achievements; parental supervision regarding homework and reading at home; and parents’ involvement in communications with schools (Boonk et al., 2018; Castro et al., 2015; Fan and Chen, 2001; Park and Holloway, 2017; Sui-Chu and Willms, 1996) Assuming the positive impact of parents, researchers ask what causes parental involvement. Cox and Witko (2008) examined whether a policy change can increase parental involvement in school-related activities by assessing changes in parents’ activities before and after their adoption of school choice programs, finding a negligible impact.
Social capital as education resources and neighborhood effect
Scholars examine both types of education resources, social and financial capital. examined the effects of both social and financial capital on student learning achievement in Michigan’s elementary schools, concluding that social capital has a significantly larger impact compared to financial capital. In addition to social capital, physical capital matters. Spending on school infrastructure proved to be influential on academic performance (Crampton, 2009). Besides school on-site factors, neighborhood advantage influences students’ academic performance (Carlson and Cowen, 2014; Owens, 2010).
Building upon Owen’s (2010) neighborhood advantage concept, Carlson and Cowen (2015) examined the effect of neighborhood characteristics on academic performance in Milwaukee, Wisconsin. They suggested that the schools that students attend make a more meaningful impact on academic achievement than the neighborhoods they live in. Wodtke et al. (2011) examined the impact of long-term exposure to disadvantaged neighborhoods on high school graduations, finding that students who grew up in the most disadvantaged neighborhoods are likely to reduce the probability of graduation up to approximately 95%, compared to the least disadvantaged group. Sociologists’ reports based on New York City (NYC) public schools found that community violence reduces school performance, disproportionately so for African American students .
Parents purchasing homes and public education
Economists use the concept of “willingness to pay” to determine the price of any goods and services on the market. Parents’ willingness to pay for their children’s quality education determines where they live. Parents choose to move into a community knowing the information about local taxes, housing prices, and public education quality. They agree to pay higher property taxes and high housing prices by moving into the community, expecting good-quality public education in return. Neighborhoods that contain good public schools tend to have higher housing prices and higher property taxes. Parents buy good K-12 public free education in this way. Public education has become less public but more private (Labaree, 2018).
Good public schools are known to be associated with higher property values within a given school district. Provided that public education is a public good, it is free of charge and open to everyone who resides in the designated school district. The price of quality public education, therefore, can be estimated by the property values within the school district. Buying a house or renting a place, residents also purchase quality public education since their children are eligible to benefit from decent public schools. This idea of capitalization of public education into property values has been examined by economists in the fields of public education and public finance.
Examining Boston suburban elementary schools, Black (1999) showed that test scores were commensurate to house market prices. Reback (2005) found that open enrollment programs affect home prices depending on the size of transfer student populations and the direction of transfers, like whether a district received more students or lost more students to neighboring districts. Figlio and Lucas (2004) found a strong correlation between good schools and house prices. Florida’s state school evaluating system starting in 1999 assigned a letter grade ranging from A to F. Schools receiving grades of A or having improved their grades over a year were eligible for financial rewards up to US$100 per pupil. Their finding showed that a difference between grades A and B was equivalent to an increment of 19.5% in terms of house market values. A decade-long data collection of Connecticut public schools provided inconclusive findings on the relationship between test scores and housing prices, but proved that an increase in minority students resulted negatively on housing prices (Clapp et al., 2008).
Moving into a community where home values are higher with correspondingly substantial property taxes is therefore viewed as a rational decision, a quid pro quo in exchange for quality local public services and goods. Among such benefits, residents acquire quality public education by purchasing houses within the district. Given that most middle-class households’ primary asset is their houses, they actively protect the value of their assets by participating in political decisions in local governments. Fischel (2005) named such politically active and rational voters as “homevoters.” Parents of a given school district are therefore homevoters. In fact, regardless of whether they have children in public schools, homevoters are attentive to school district budgets, property taxes, and high school rankings, namely the costs and benefits of public education in the district, because such factors influence their home values. Fischel’s theory explains how politics, economics (finances) and education are closely intertwined at a local level.
Federalism and inequality
Federalism dictates local governments as the legitimate jurisdiction of elementary and secondary public education. State constitutions stipulate how free public education is achieved by local educational agencies within each state. School districts form school boards to make decisions to affect the members of communities. Free public education funding sources are three-fold. All three levels of government—local, state, and federal—contribute to school district budgets, which range widely across school districts and states. Fiscal federalism through inter-government transfers enables state governments and the federal government to subsidize local education.
Due to federalism, both educational achievement and educational expenditure vary significantly, not only across states but also within a state across school districts. Facing such disparities across school districts, some states executed education finance reform by allowing states to intervene in struggling school districts while other states retained the local control, minimizing state governments’ involvement in the matter. Between 1988 and 2000, courts in 20 states ruled that state governments must revise school finance systems. Among those states, court-ordered finance reform affected school districts differently depending on the ruling political party. Democratic state governments, in which both governors and legislatures are Democratic, increased state funding to redistribute for public education. Republican governments, on the other hand, did not do much. Divided governments posit in the middle in terms of their reaction to court decisions (Berry and Wysong, 2010).
In American federalism, education is up to the states and school districts. This federalist aspect of public education exacerbates inequality across states. About half the states undertook education finance reform due to court decisions while the other half remained unchanged. Between 1990 and 2012, 26 states implemented or were ordered by courts to implement school finance reform, while 23 states did not (Lafortune et al., 2018: 2). Over the last two decades, both reform states and no-reform states increased education funding to different degrees, only widening the gap between the two groups of states, creating further inequality.
Massachusetts undertook a state-wide education reform in 1993 to equalize public education revenues by subsidizing poor districts in particular. By contrast, in 1997 Georgia began an educational special purpose local option sales taxes, delegating the matter to the county level by popular referendum. In order to maintain low property taxes influenced by the tax protest movements in the 1970s, the Georgia state government delegated the collection of resources via sales tax to county school boards, depending on the approval of the residents in each county school district (Collins and Dove, 2013; Sanders and Lee, 2009). As of 2017, Massachusetts spent US$16,197 and Georgia allocated US$10,205 per student.
Courts and state governments initiated education finance reforms aiming to address the inequality across school districts within a state. However, the same policy changes created even bigger variance across states. States in favor of the state government’s intervention in local education responded differently from the states that place the primary responsibility in local education upon local governments. The Great Recession of 2008 exacerbated this inter-state disparity. In 35 states, school funding per student by state aid was less in 2014 than the level of pre-2008. In such states, local funding did not compensate for the lack of state aid, which led to the overall decline in education funding (Leachman et al., 2016).
Education finance reform by courts
Many states increased school funding to comply with court orders. The Serrano decision of 1971 in California initiated education finance reform to redistribute state resources via inter-governmental financial aids to supplement the lower school district funding in poor neighborhoods. A wave of school finance reforms was implemented to address the inequality between impoverished and affluent communities. In consequence, the main source of local revenue—that is, property taxes—declined its share in education funding from 60% in the 1970s to 35% in 2000 (Boustan et al., 2013: 1294). The Campaign for Fiscal Equity v State of New York (1995) 10 resulted in the state’s educational finance reform, specifically in the passage of the State Education Budget and Reform Act of 2007 in the NYS legislature. Wyoming’s education funding significantly increased after its court decision in the Campbell case. New Jersey increased its education funding in accordance with the rulings in Abbott v Burke.
The efficacy of school finance reforms by state governments is evaluated by scholars asking about the causal relationship between funding and performance. Two reasons why they might not be effective are as follows. First, increased state funding might reduce incentives for local residents to contribute to education, thereby not affecting the overall education funding level. Second, increased spending might not necessarily result in education quality improvement, implicating that resources may be allocated to non-instructional uses (Dee and Levine, 2004). Dee and Levine (2004) refuted such ideas when analyzing Massachusetts education finance reform in 1993.
Fiscal federalism is relevant to the first reason since three levels of governments contribute to education funding. Despite the tradition of local control in American education, local school districts financially rely on state and federal governments. The first concern of inefficacy is shared in the context of fiscal federalism termed Okun’s “flypaper effect” in public finance, implying that an increase in total funding by federal or state might not directly and entirely transfer to the targeted areas’ improvement. Godron (2004) examined how receiving additional federal funds through Title I affects state and local governments’ effort in their own revenue for education. Initially, a change in Title I funds resulted in no change in state and local revenues. Gradually, however, within three years, local governments’ revenue decreased as the federal funding increased. The role of Title I funding is significant since it serves economically disadvantaged students and takes up one-third of the US Department of Education’s elementary and secondary budget.
Jackson et al. (2016) explained that school finance reforms induced by court orders increased per-pupil spending and then ultimately contributed to the improvement in high school graduation rates and educational attainments in the same school districts by comparing before and after the court decisions. Evaluating the efficacy of Massachusetts’s education reform, Guryan (2001) presented two findings. Local schools spent only 50–75 cents of each dollar of state aid. Students’ test scores were not necessarily improved by additional state funds, with mixed results from different graders (4th and 8th).
During the period between 1990 and 2012, 26 states were directed to implement school finance reform in response to court orders while 23 states remained unchanged (Hawaii and DC excluded). Lafortune et al. (2018) compared finance-reform states with no-reform states to show that reform states significantly increased education revenues during the period and no-reform states also increased funding but to a much smaller degree, which ultimately widened the gap between reform states and no-reform states over two decades. They conclude that reforms increased academic achievement in low-income districts.
School districts that wisely spent the additional funding improved education quality. Revere public schools in north of Boston, in which 80% of students are from low-income households, benefited from the 1993 school finance reform. Between 1993 and 2003, Revere’s school budget increased by US$4–6m a year and graduates who went on to postsecondary education increased from 70% to 90%. They adopted an entirely new textbook series in the mathematics department (Carapezza, 2016). Jackson et al. (2016) showed that additional school funding caused by states’ education financial reform resulted in higher graduation rates, higher adult wages, and lower adult poverty rates.
Empirical analysis
Education funding and academic performance in NYS
Disparities between most urban and suburban public schools in the metropolitan areas are ubiquitous in America. Two types of disparities exist: academic achievement measured by test scores and graduation rates, and differential education funding. How much the two disparities are correlated is at the core of scholarly debate on the question of whether money matters. The lower achievement of urban public schools is largely ascribed to the lower level of funding than their counterparts in the suburbs. In fact, many urban school districts received approximately half the funding of suburban school districts across states. Chicago Unified School District’s revenue per pupil was less than half of Evanston Township High School District in Illinois (Baker, 2014: 15). The same pattern of comparison is found in Michigan between East Detroit Public School District and Bloomfield Hills School District. Arizona’s Nogales Unified School District also operated on significantly less funding than Scottsdale Unified School District (Baker, 2014: 17). Education funding inequity is often found in rural school districts in many states, not only limited to urban public schools.
New York state (NYS) is an outlier to this prevalent financial disparity pattern nationwide. The state of New York is one of the most equitable states in terms of education funding across school districts: in fact, all school districts receive education funding much higher than the national average. Despite munificent state aid across school districts, urban school districts are not on par with suburban school districts when it comes to academic achievement. In the Rochester metropolitan area, two public schools show the typical urban–suburban disparity only in terms of achievement. As explained in detail in the introduction, the urban Rochester City School District spends as much as the suburban Pittsford Unified School District while the urban school district’s graduation rate is significantly lower than the suburban one.
NYS is also one of the top spenders on public elementary and secondary education among the 50 states (Census, 2019). During the fiscal year of 2017, the total spending per pupil in NYS was US$23,091, almost twice the average of all states in the US (US$12,201). Spending on instruction, excluding administration costs, was also the highest in NYS amounting to US$16,113 per pupil, which is over the double the amount of the US average. 11 In terms of revenue, not expenditure, New York state ranks only second to DC, with combined revenues from federal, state, and local governments totaling up to US$26,954, significantly higher than the average revenue per pupil of US$14,273. With respect to funding from federal and state sources, eight states received more federal education aid than New York, 12 and four states provided more educational funding per pupil than New York. 13 The level of local sources for public education in the state of New York, however, is significantly higher than other states, except for DC.
Data and methodology
This paper examines 616 school districts 14 in the state of New York to explain academic achievement disparities using ordinary least squares (OLS) regression analysis. The data is retrieved mainly from two sources. The NYS Education Department data site 15 provides information about each school district. This research uses the 2017–2018 academic year data of each school district in the categories of enrollment, assessment, high school graduation rate, and student and educator report. The United States Census Bureau publishes an “Annual survey of school system finances,” 16 which uses 2017 data for NYS school districts, 17 and contains educational revenues from federal, state, and local sources as well as spending for each school district.
Regression model
This regression analysis incorporates multiple factors that affect academic performance in public school districts in New York. The measurement of academic performance in this paper is a high school graduation rate. The dependent variable is each school district’s graduation rate of high school students, a cohort of four years, in 2018.
To validate or falsify the causal relationship between funding and graduation rate, this model adopts six variables that measure education funding as the independent variable of the regression model. The 2017 Census of governments and survey of school system finances contains financial data of 14,860 public school systems for the academic year 2016–2017. 18 The first four measures calculate revenues and the other two variables estimate expenditures to gauge support in the form of education funding in each school district. The previous literature focuses on expenditures to measure education funding. This paper introduces revenues as a new proxy to explain the causal relationship between funding and performance. Six funding variables are the independent variables in this regression model. All funding variables indicate the amount of funding per pupil, the unit of which is US$1000.
Four funding variables measure revenues depending on the sources: local revenue, state aid, federal grant and a total of all three sources (total revenue). ‘Public elementary-secondary education finance data technical documentation’ (US Census Bureau 2019) explains how federal, state and local sources are defined and measured: Revenues from federal sources include monies passed through state governments, as well as federal outlays directly received. Revenues from state sources consist only of amounts originating from state governments. Revenue from local sources is revenue raised locally—including taxes, charges, and miscellaneous revenues.
The control variables of this model include other non-funding factors that have often been discussed as important causes of academic performance in the education funding literature. Five control variables consist of enrollment, poverty, race, class size, and teacher turnover. The enrollment variable measures the number of students enrolled in the school district in the academic year 2017–2018 to see if the size of a school district matters, and in order to investigate whether small school districts perform better than large school districts. The poverty rate variable measures the percentage of the estimated number of relevant children (5–17 years old) in poverty who are related to the householder in the school district. 20 Race is measured by the percentage of white students. Class size means the number of students in a classroom for 10th grade social studies. The teacher turnover variable indicates the percentage of teacher turnover from 2016–2017 to 2017–2018 among teachers with fewer than five years of experience. Of these control variables, small class size with low teacher turnover is expected to uplift graduation rates, while poverty is likely to depress academic achievement.
Regression results
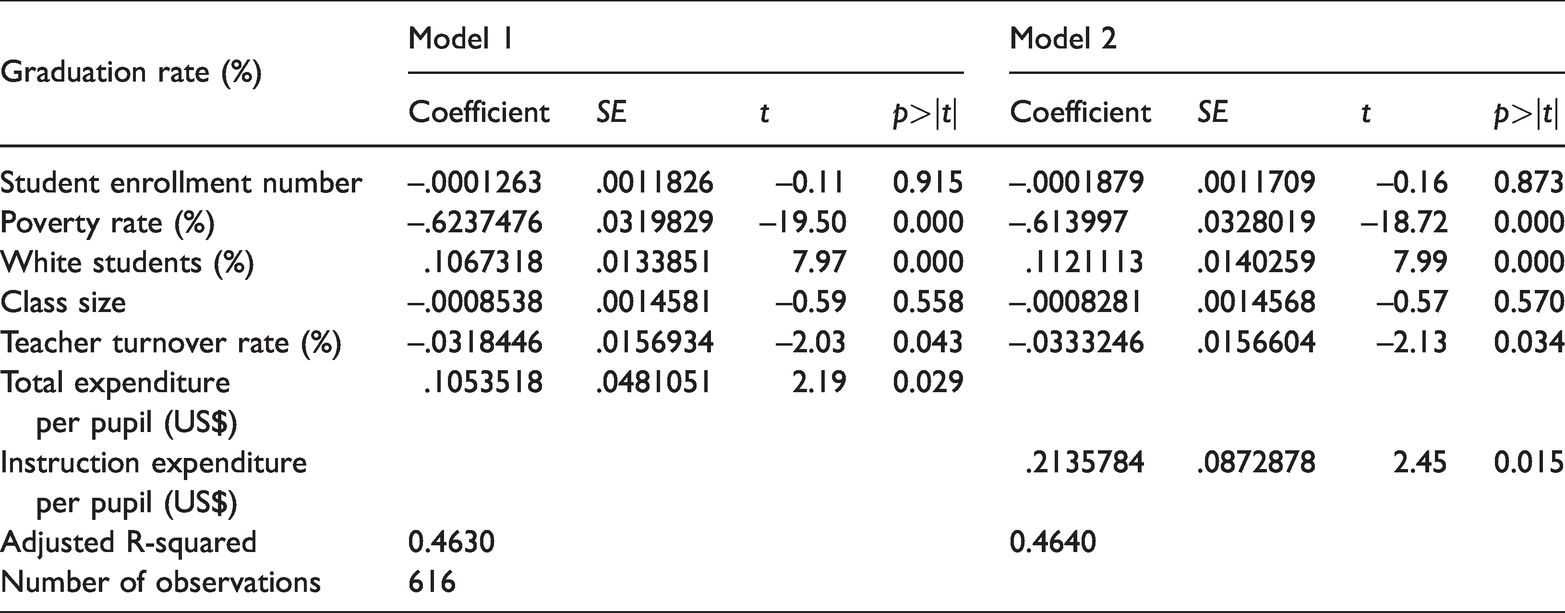
Table 1 summarizes the regression results of the education expenditure model. Both total expenditure per pupil and instruction expenditure per pupil variables are employed to validate that more spending helps to encourage graduation. Both are found to be statistically significant, having a positive impact on graduation. Instruction expenditure, however, seems to have a higher substantive significance. Increasing instruction expenditures per pupil by US$10,000 is expected to raise graduation rates by 2.13%. Similarly, the same incremental increase (US$10,000) in total expenditure is likely to push the graduation rate up, but only half the impact of instruction expenditure, by 1%. Spending matters in general. More specifically, spending on instruction rather than other components of education expenses is more effective in boosting graduation rates. This model also confirms that poverty, teacher quality, and race influence graduation rates. Higher poverty and teacher turnover rates are proven to impede graduation. In a given school district in New York, where more white students are enrolled, the higher graduation rate is expected. Figures 1 and 2 visualize these regression results showing the coefficient estimates and confidence intervals. 21 Comparing two graphs shows that instruction expenditure is a stronger predictor than total expenditure in explaining graduation rates.
The effects of education expenditure per pupil on graduation rate.
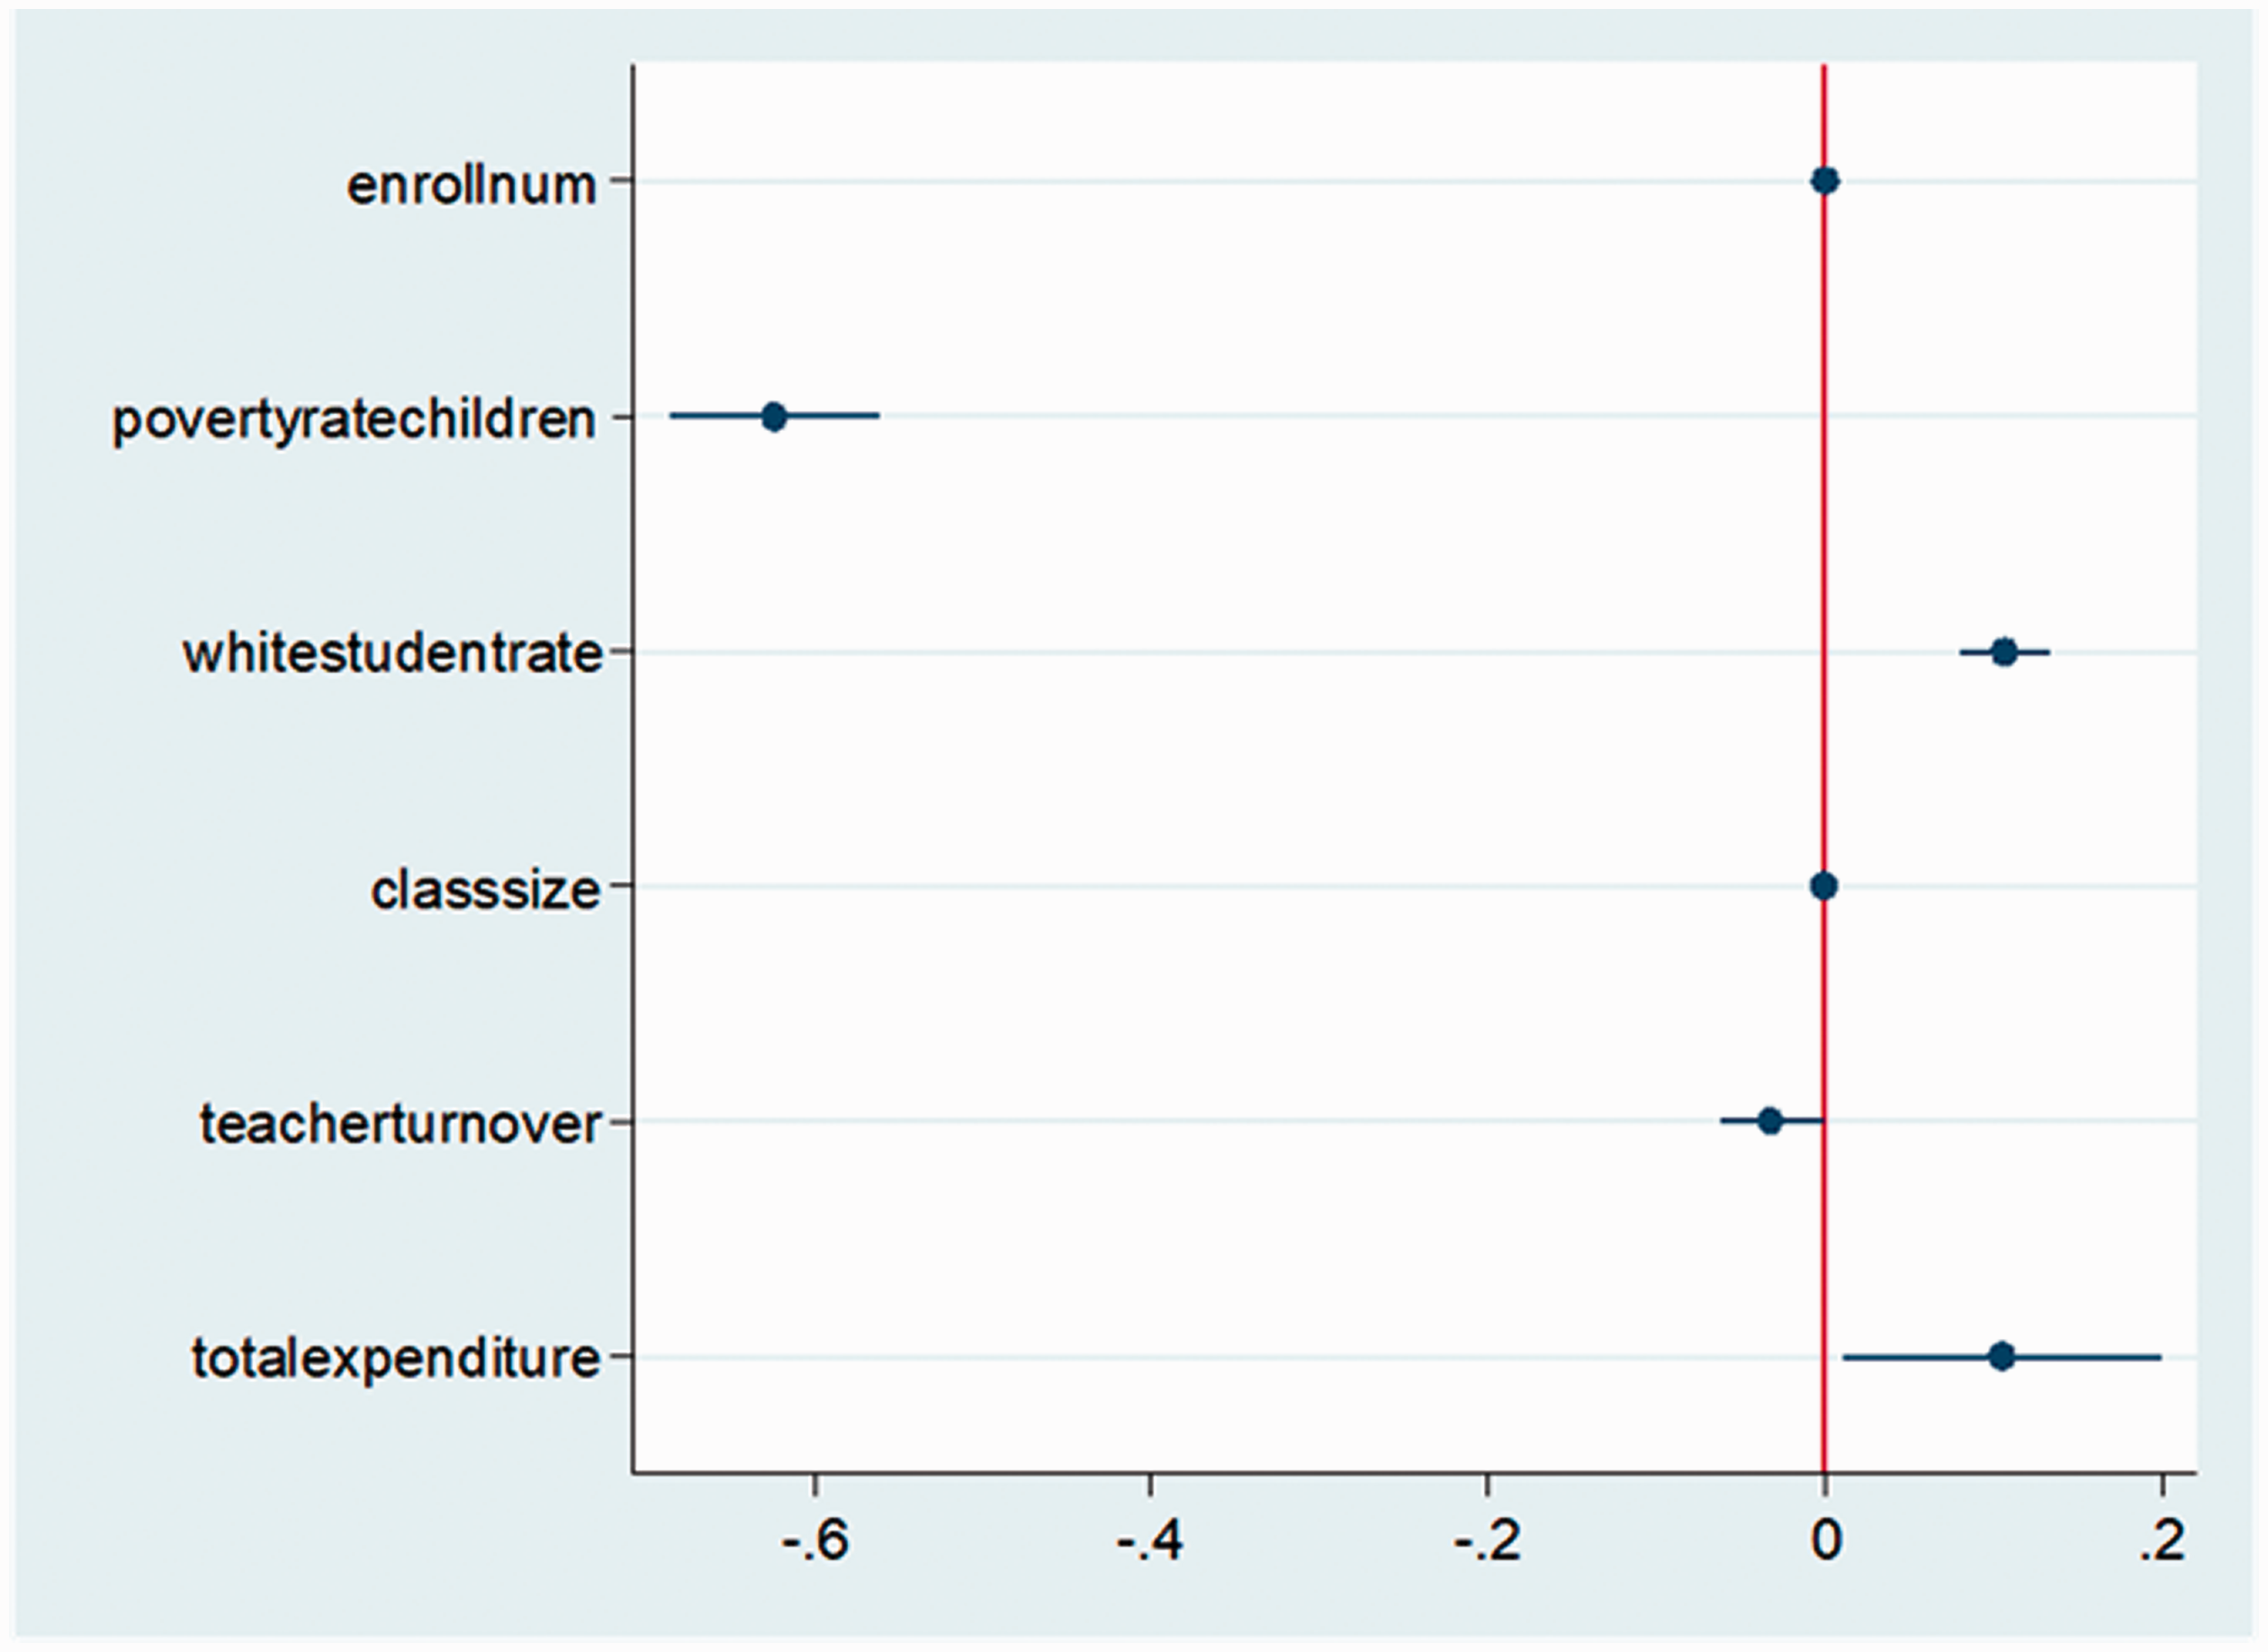
The estimated coefficients and confidence intervals of Model 1 (total expenditure).
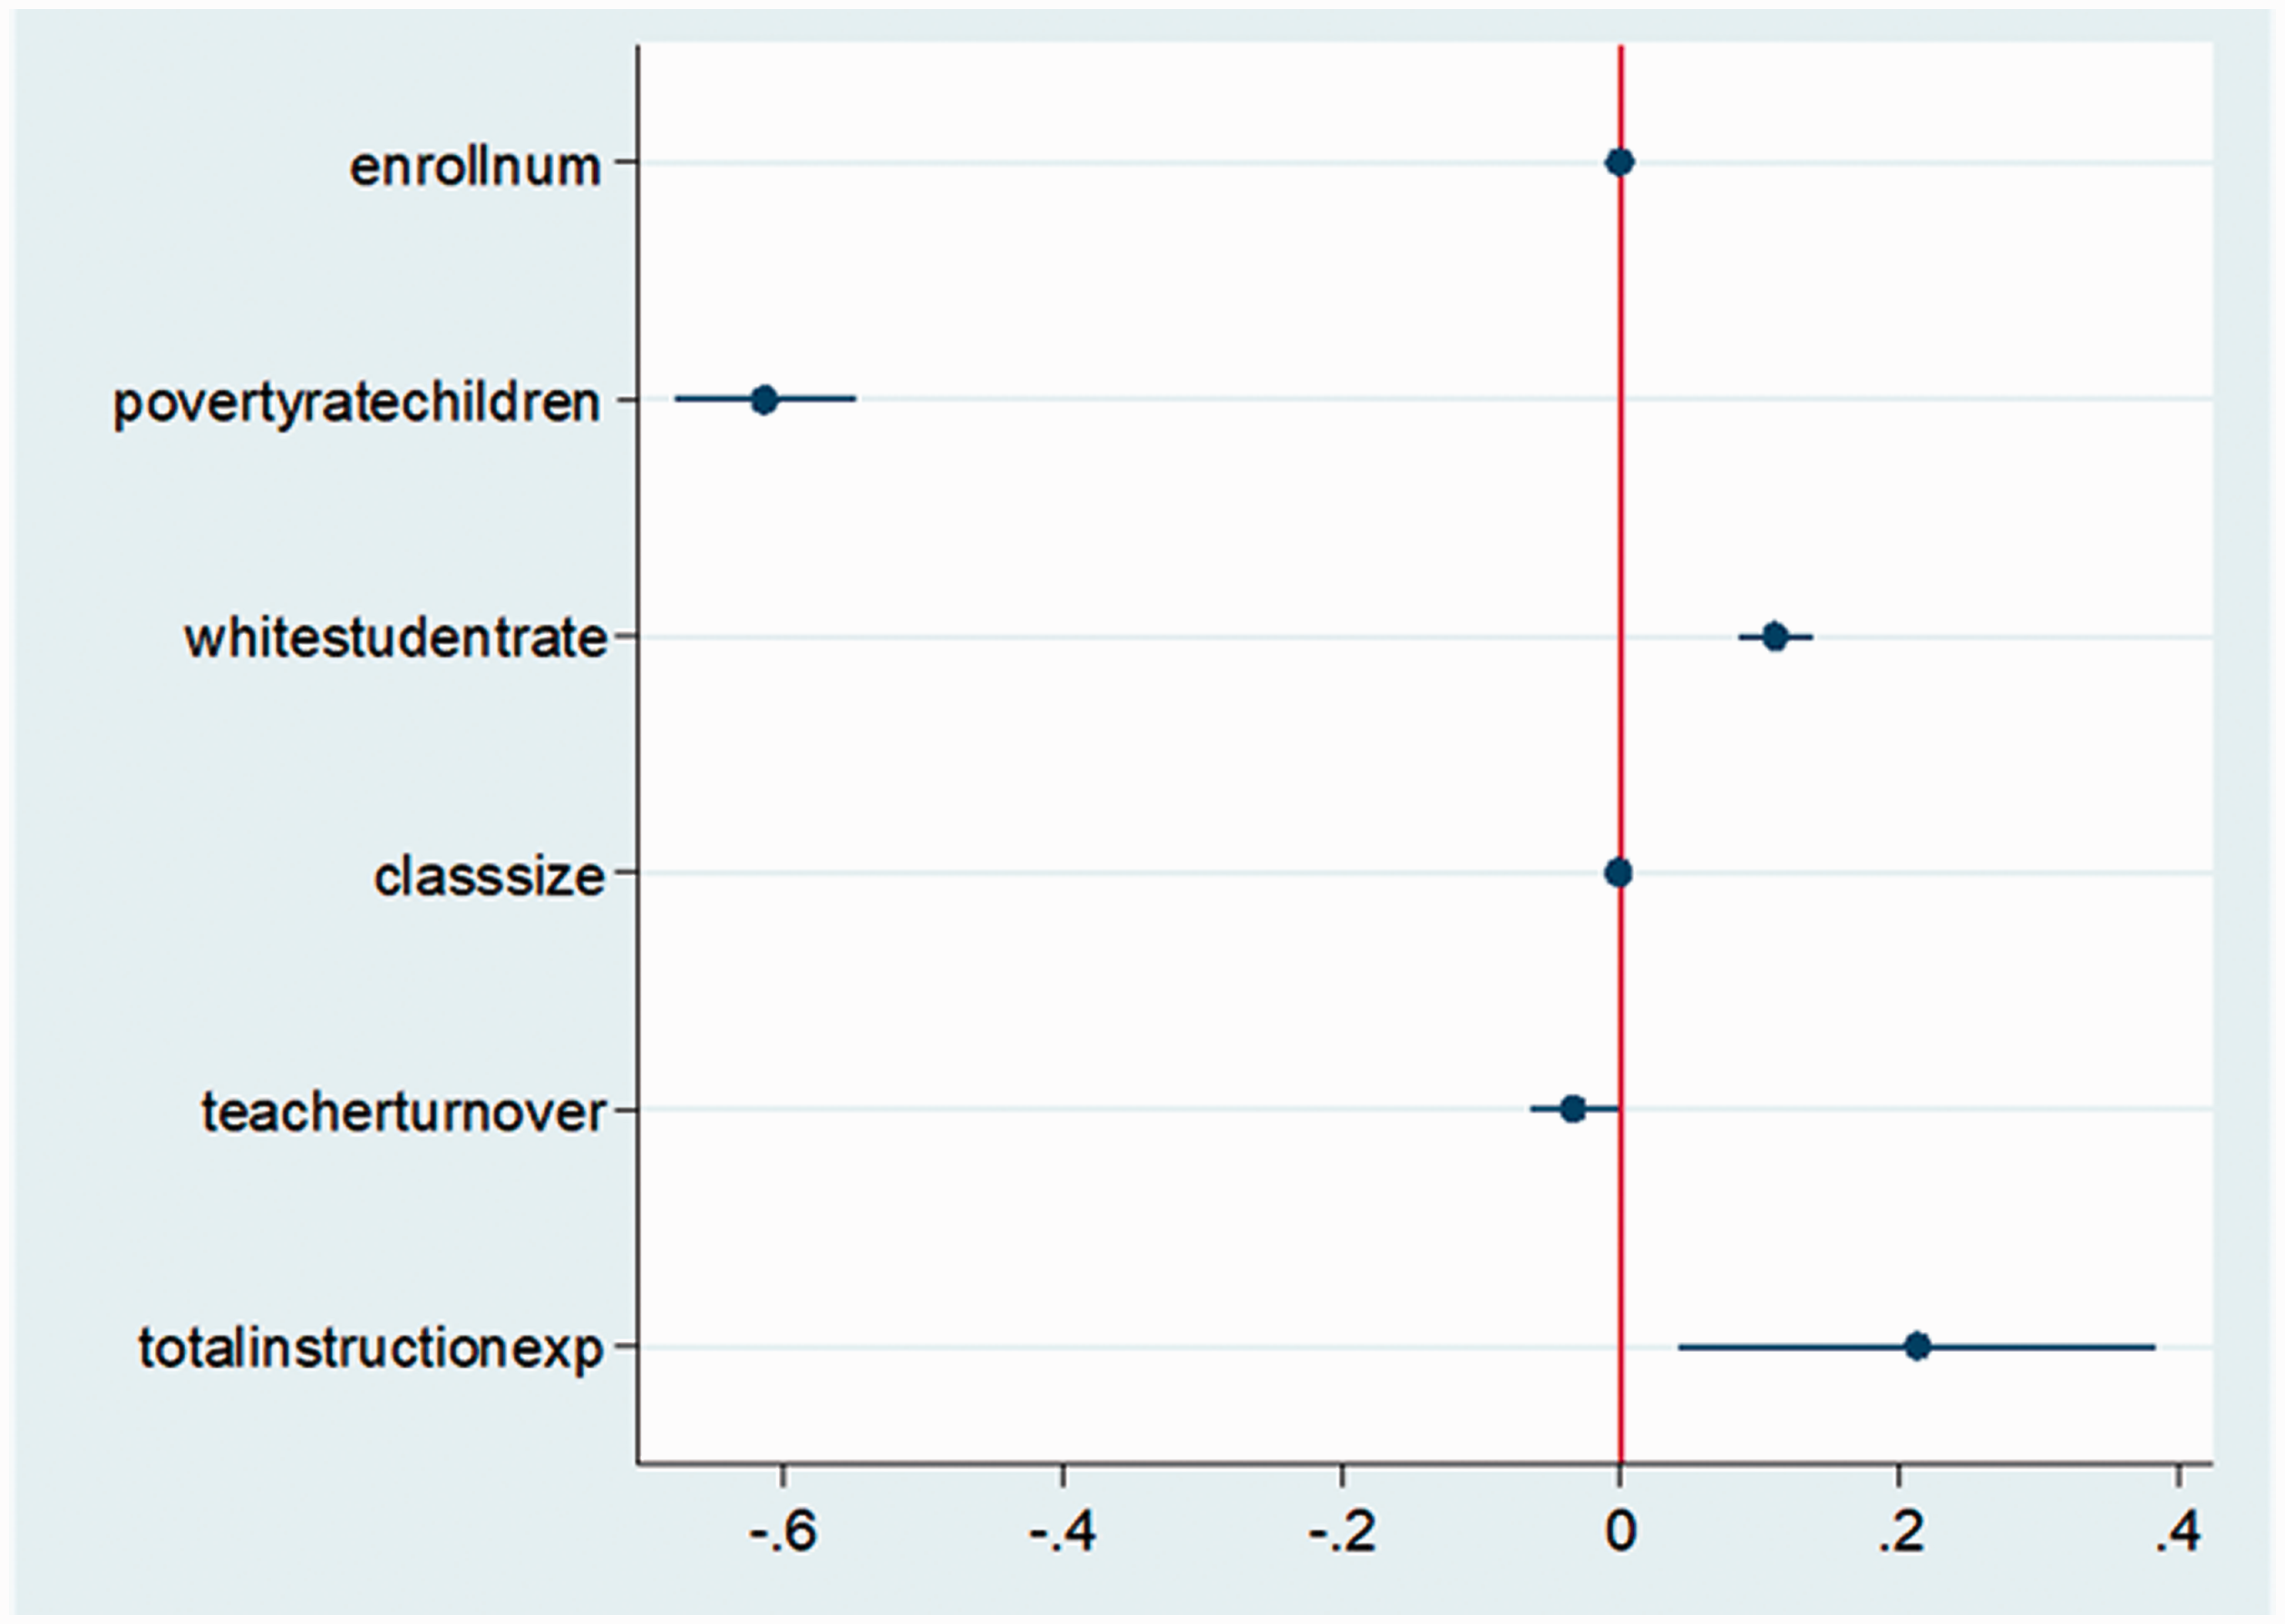
The estimated coefficients and confidence intervals of Model 2 (instruction expenditure).
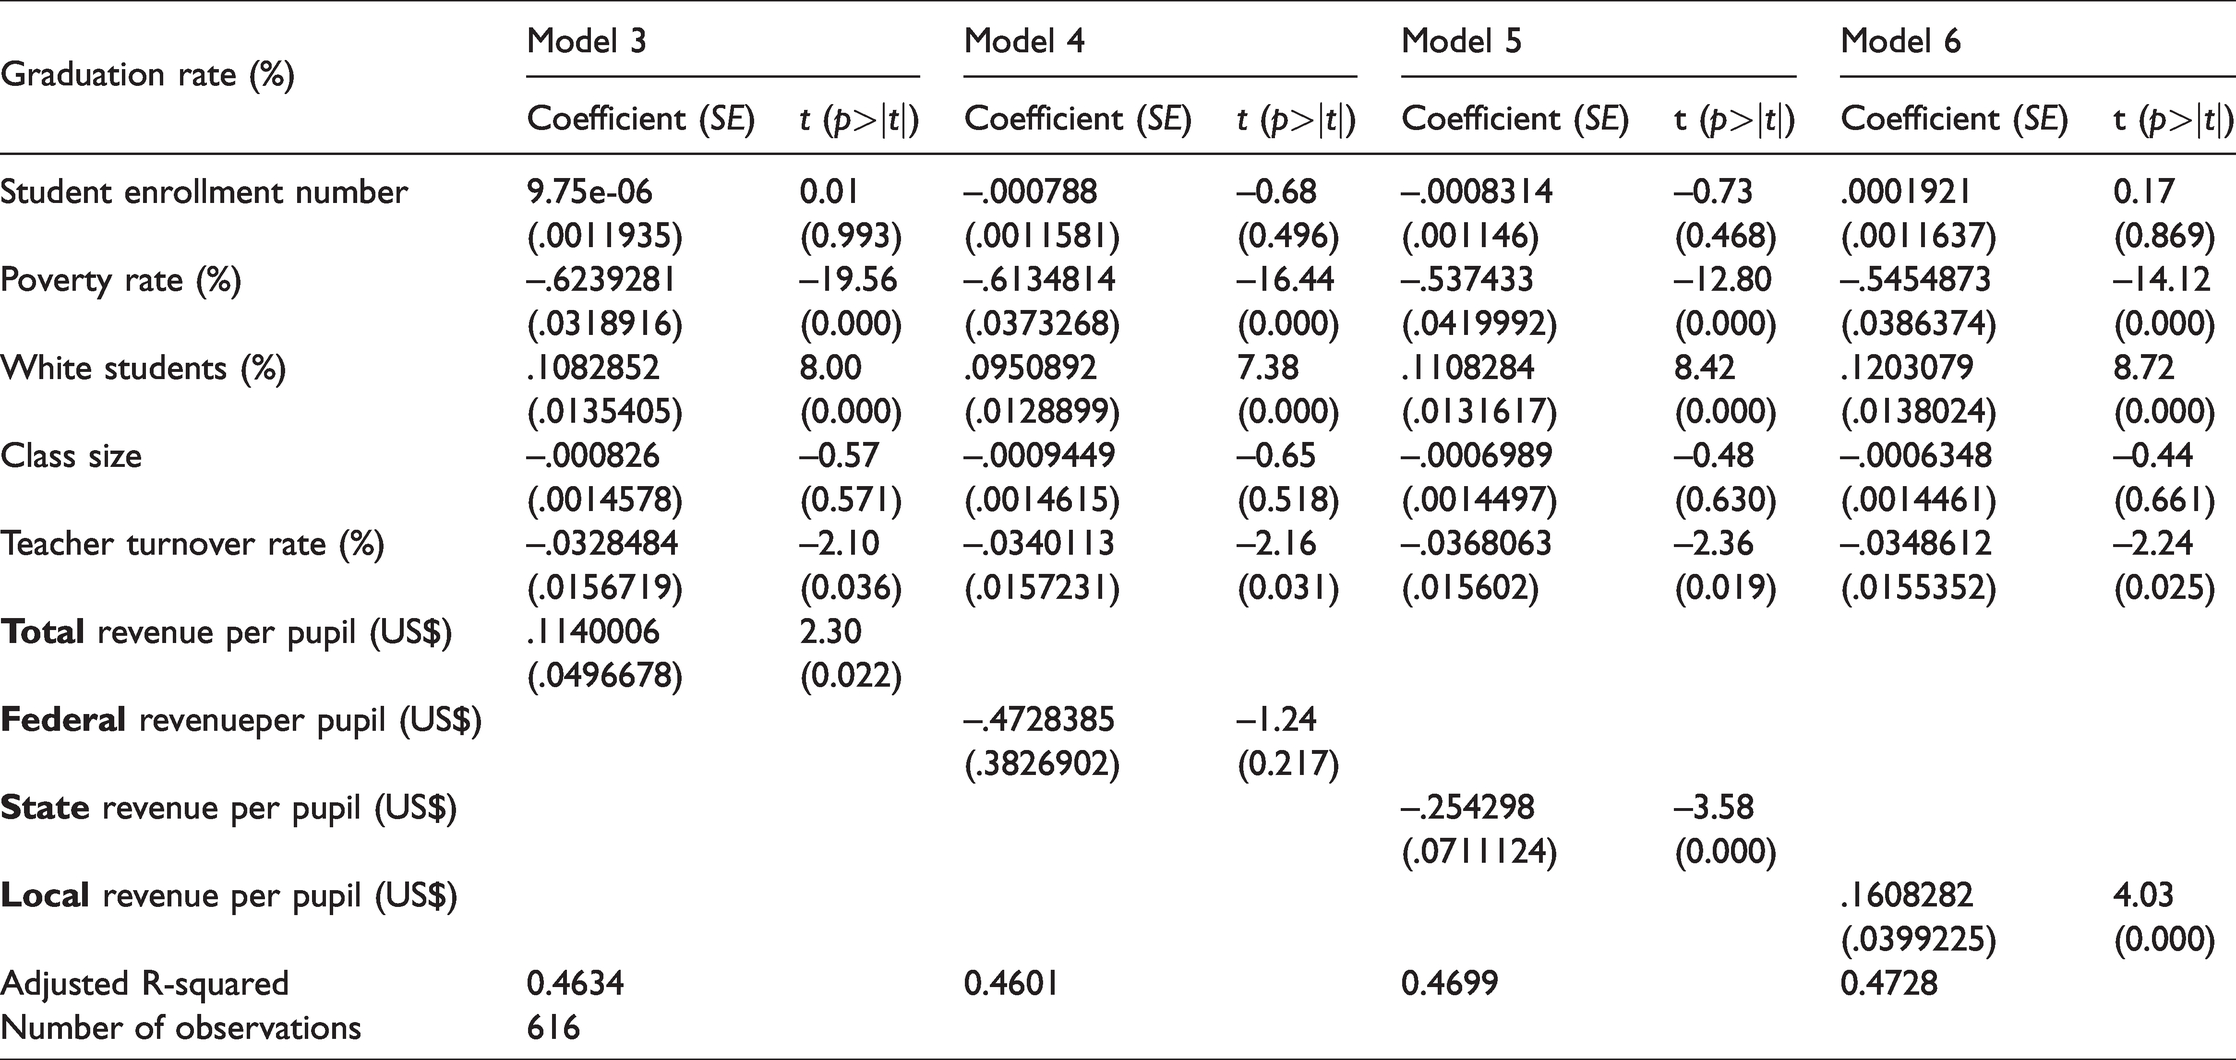
Table 2 tabulates the results of four regression models that employ revenues, not expenditures, to measure education funding. Previous literature on education funding examines how much is spent on students: expenditure. This paper introduces revenues to measure how much comes from whom for education. Model 3 tests total revenue combining all three sources from federal, state, and local governments. As in the case of total expenditure, total revenue also has a positive impact on graduation. Collecting an additional US$10,000 per pupil is likely to increase the graduation rate by 1%. Figure 3 illustrates the coefficient estimates and confidence intervals of Model 3.
The effects of revenues for education funding on graduation rates.
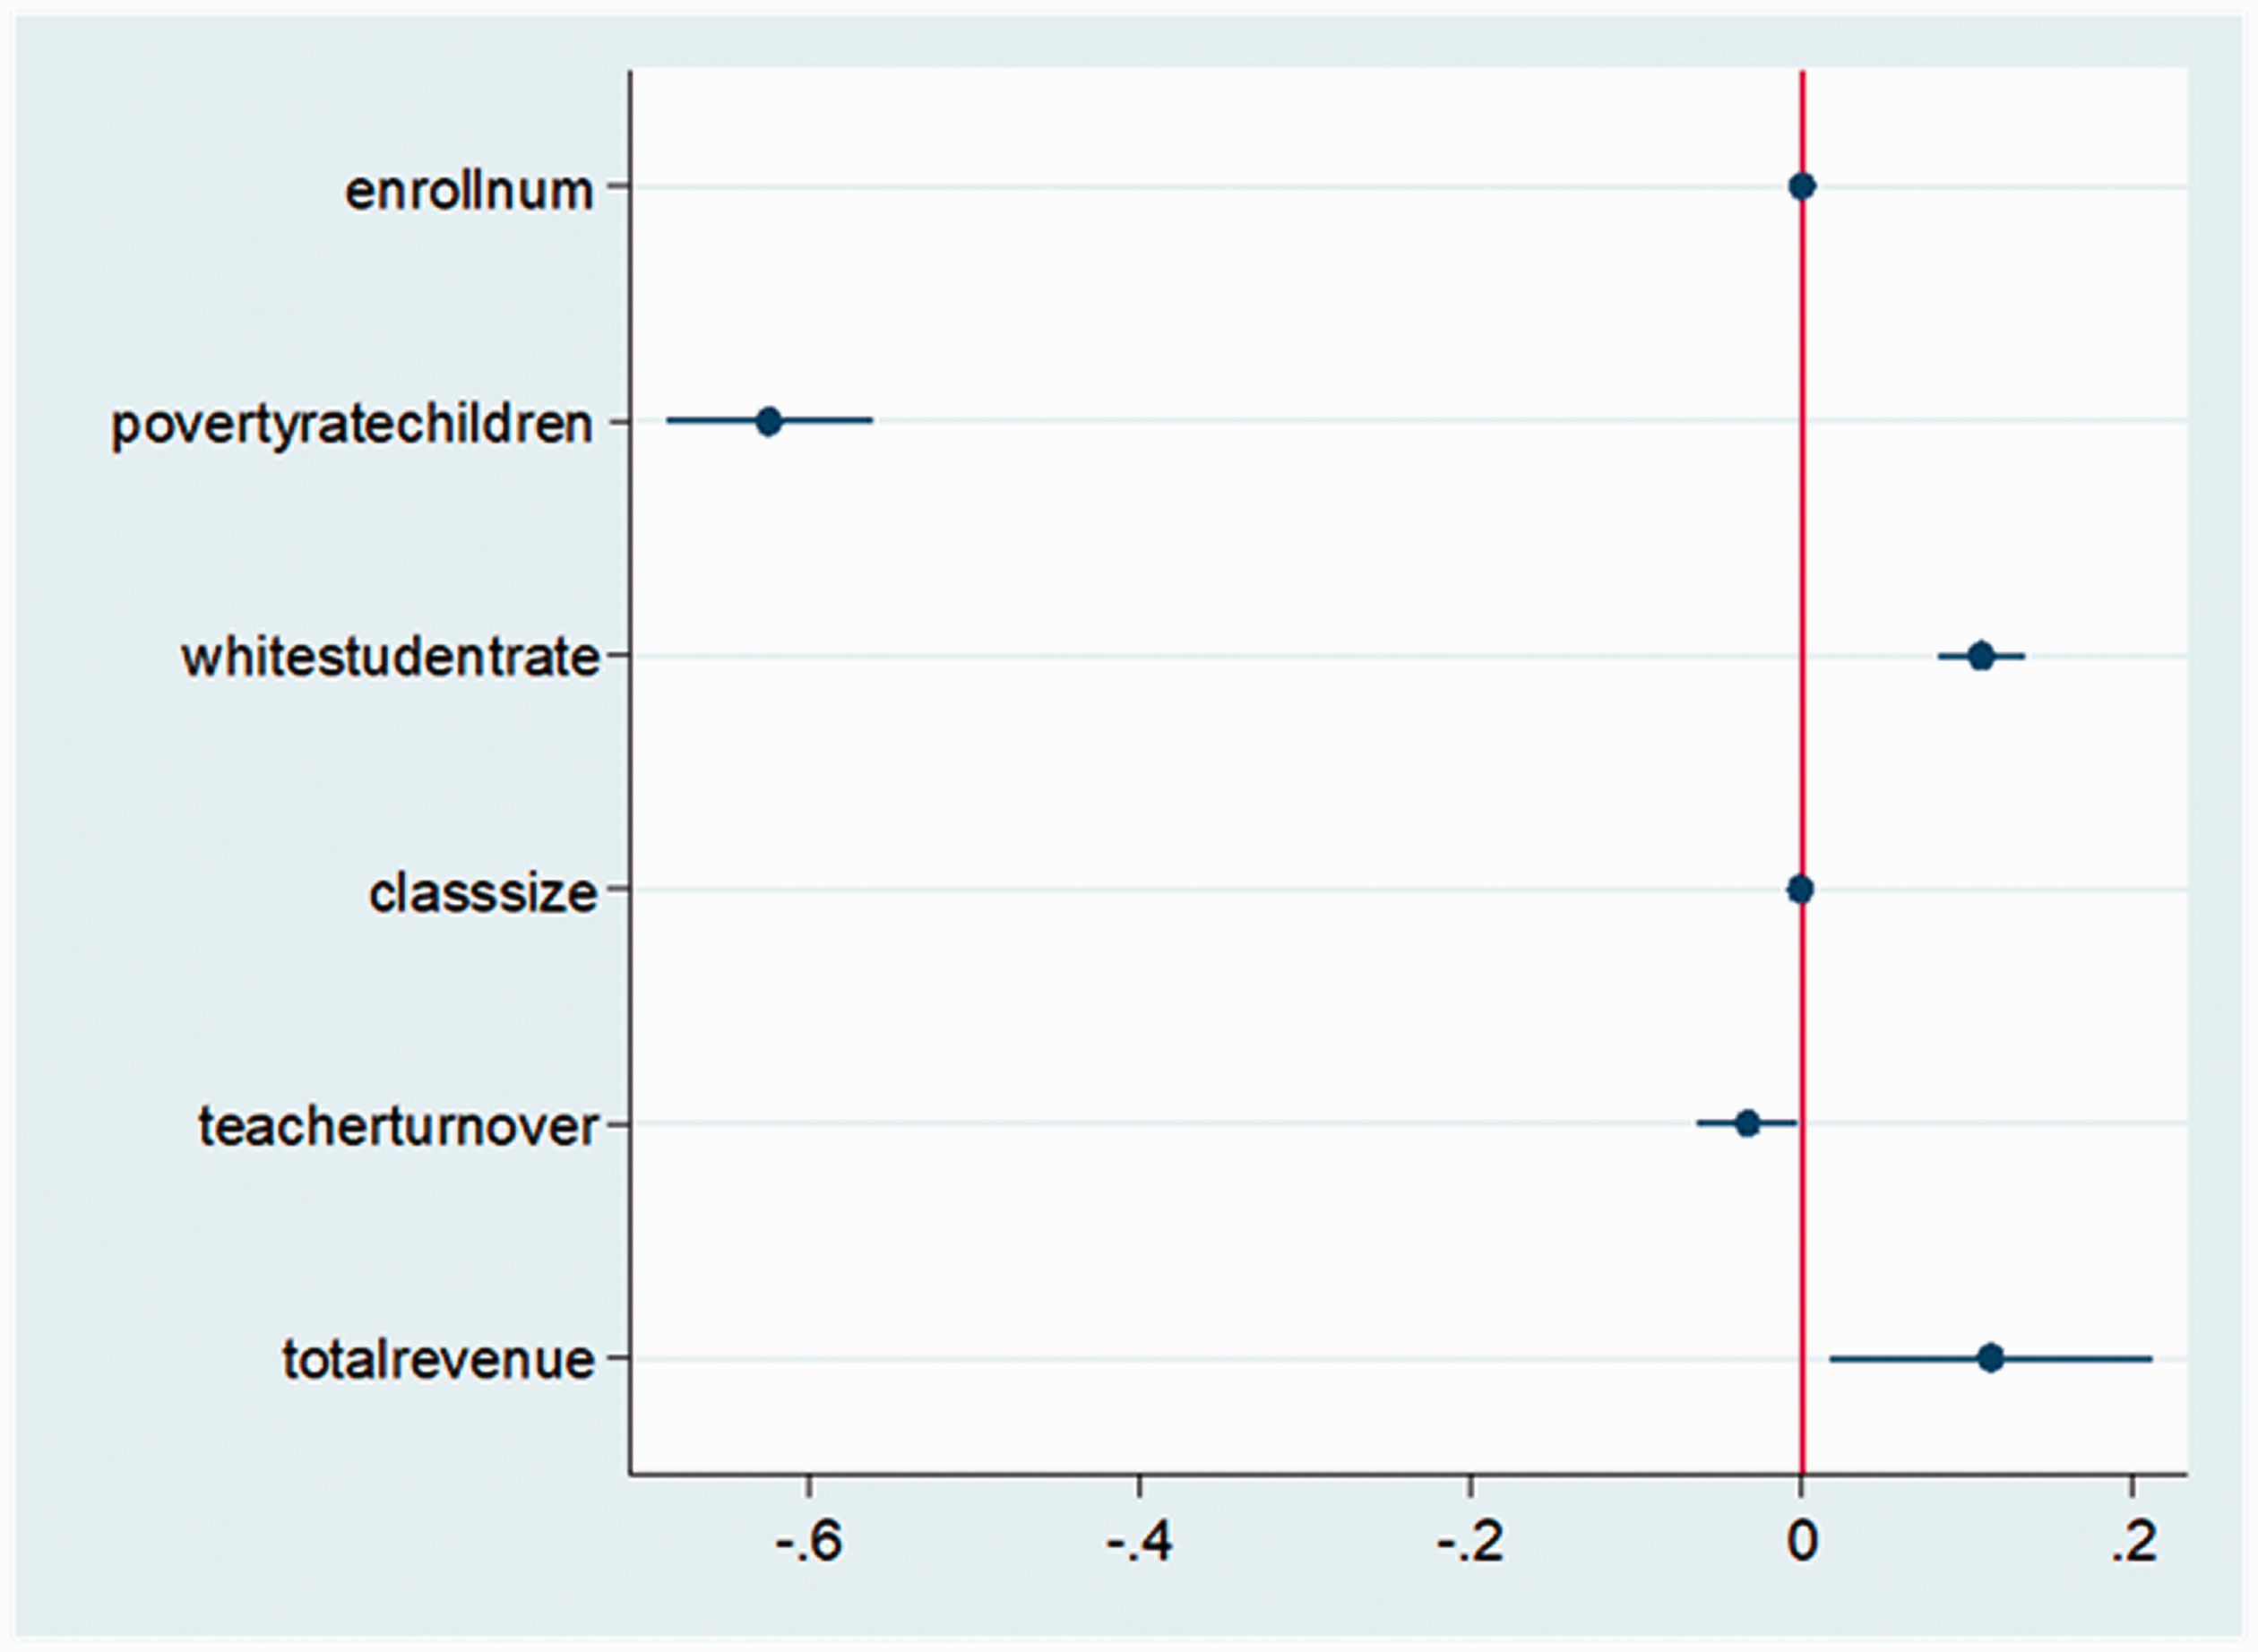
The estimated coefficients and confidence intervals of Model 3 (total revenue).
Model 4 shows that federal grants have no statistically significant effect on graduation rates, which indicates that additional federal funding would not necessarily result in higher graduation rate. Model 5 reveals that state aid to school districts is negatively associated with graduation rates. Given that the lack of funding is the most frequently identified culprit of failing public schools, this negative correlation is somewhat counterintuitive. Establishing a causal relationship based on this result is even more challenging. No one would be convinced that more state funding dampens graduation rates. On the contrary, it is commonly expected that additional state funding is utilized to facilitate students’ completion of their high school programs. This correlation can be explained by the fact that poorly performing public schools with lower graduation rates are prioritized to receive more funding from the state government. Therefore, state financial aid and academic performance are negatively correlated, but this does not mean that state funding causes low graduation rates. However, it is worth noting that years of continued state funding have not created an impressive improvement in graduation rates for struggling public schools. The graduation rate gap between high-performance and low-performance schools is relatively consistent throughout the years. This fact has often been utilized as a rationale for governors to question the effectiveness of state funding in public education as aforementioned in this paper. Figures 4 and 5 visualize the coefficient estimates and confidence intervals of Model 4 (federal funding) and 5 (state funding), respectively.
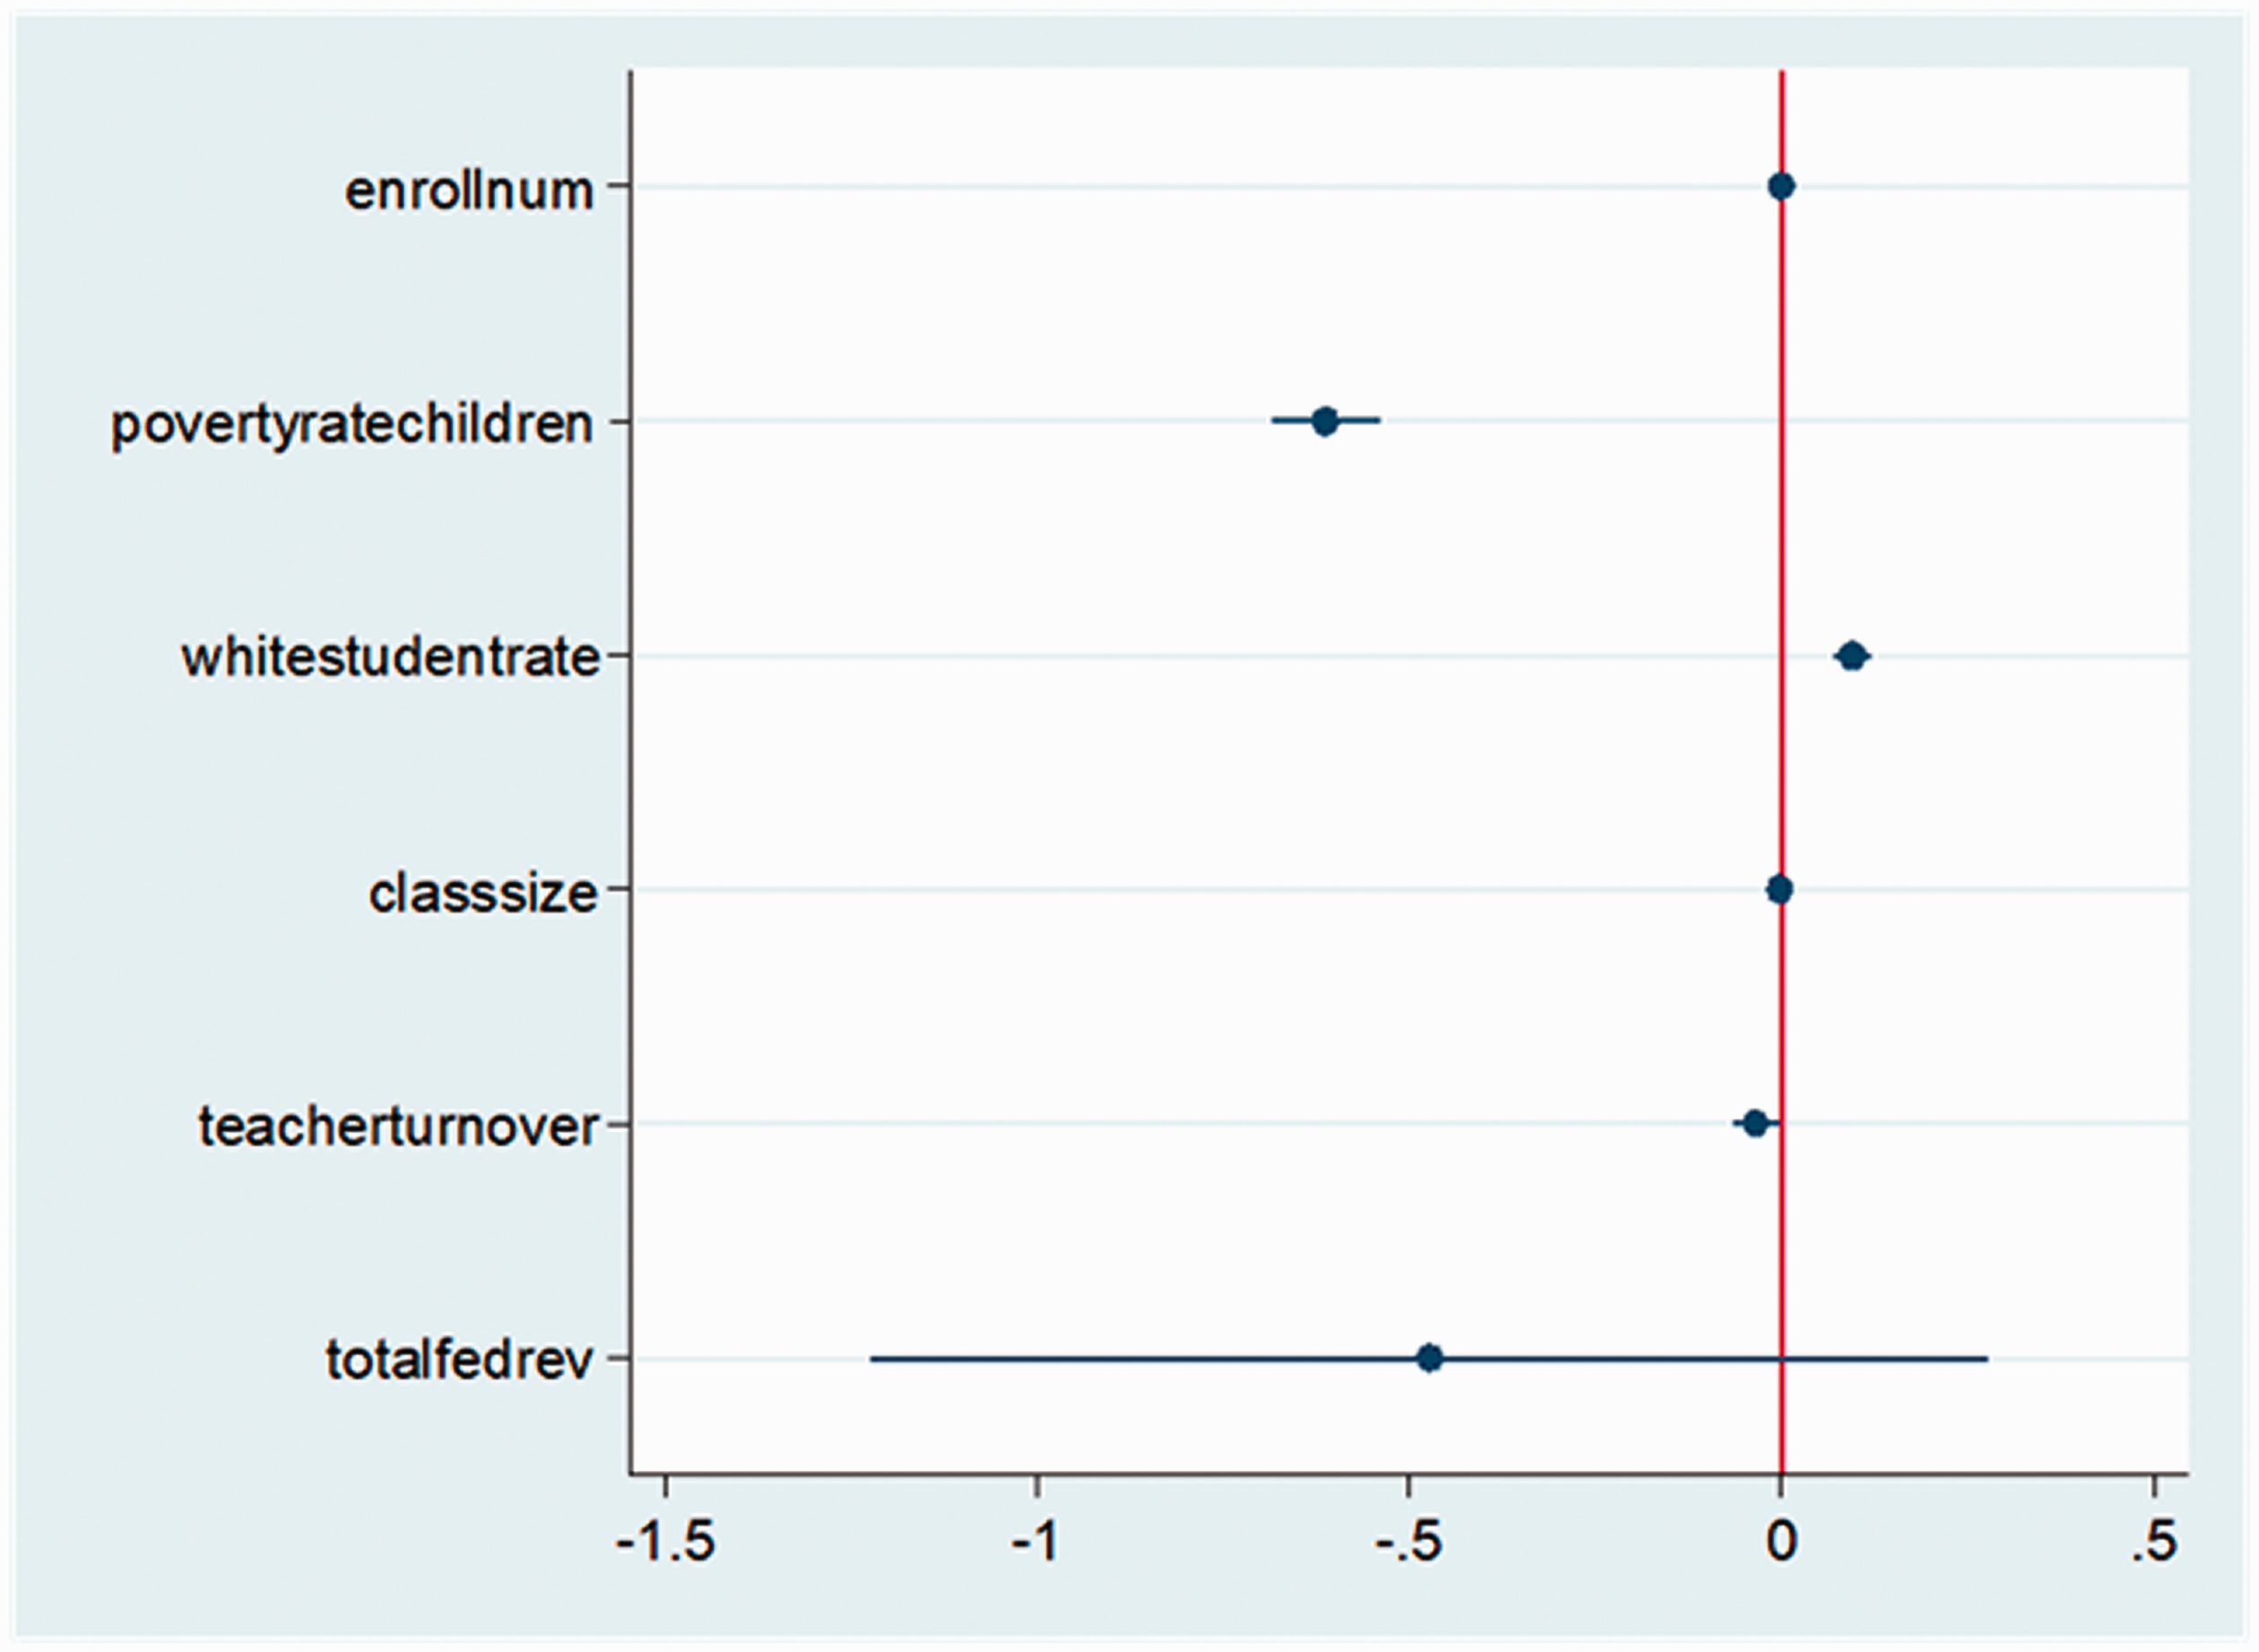
The estimate coefficients and confidence intervals of Model 4 (revenue from federal government).
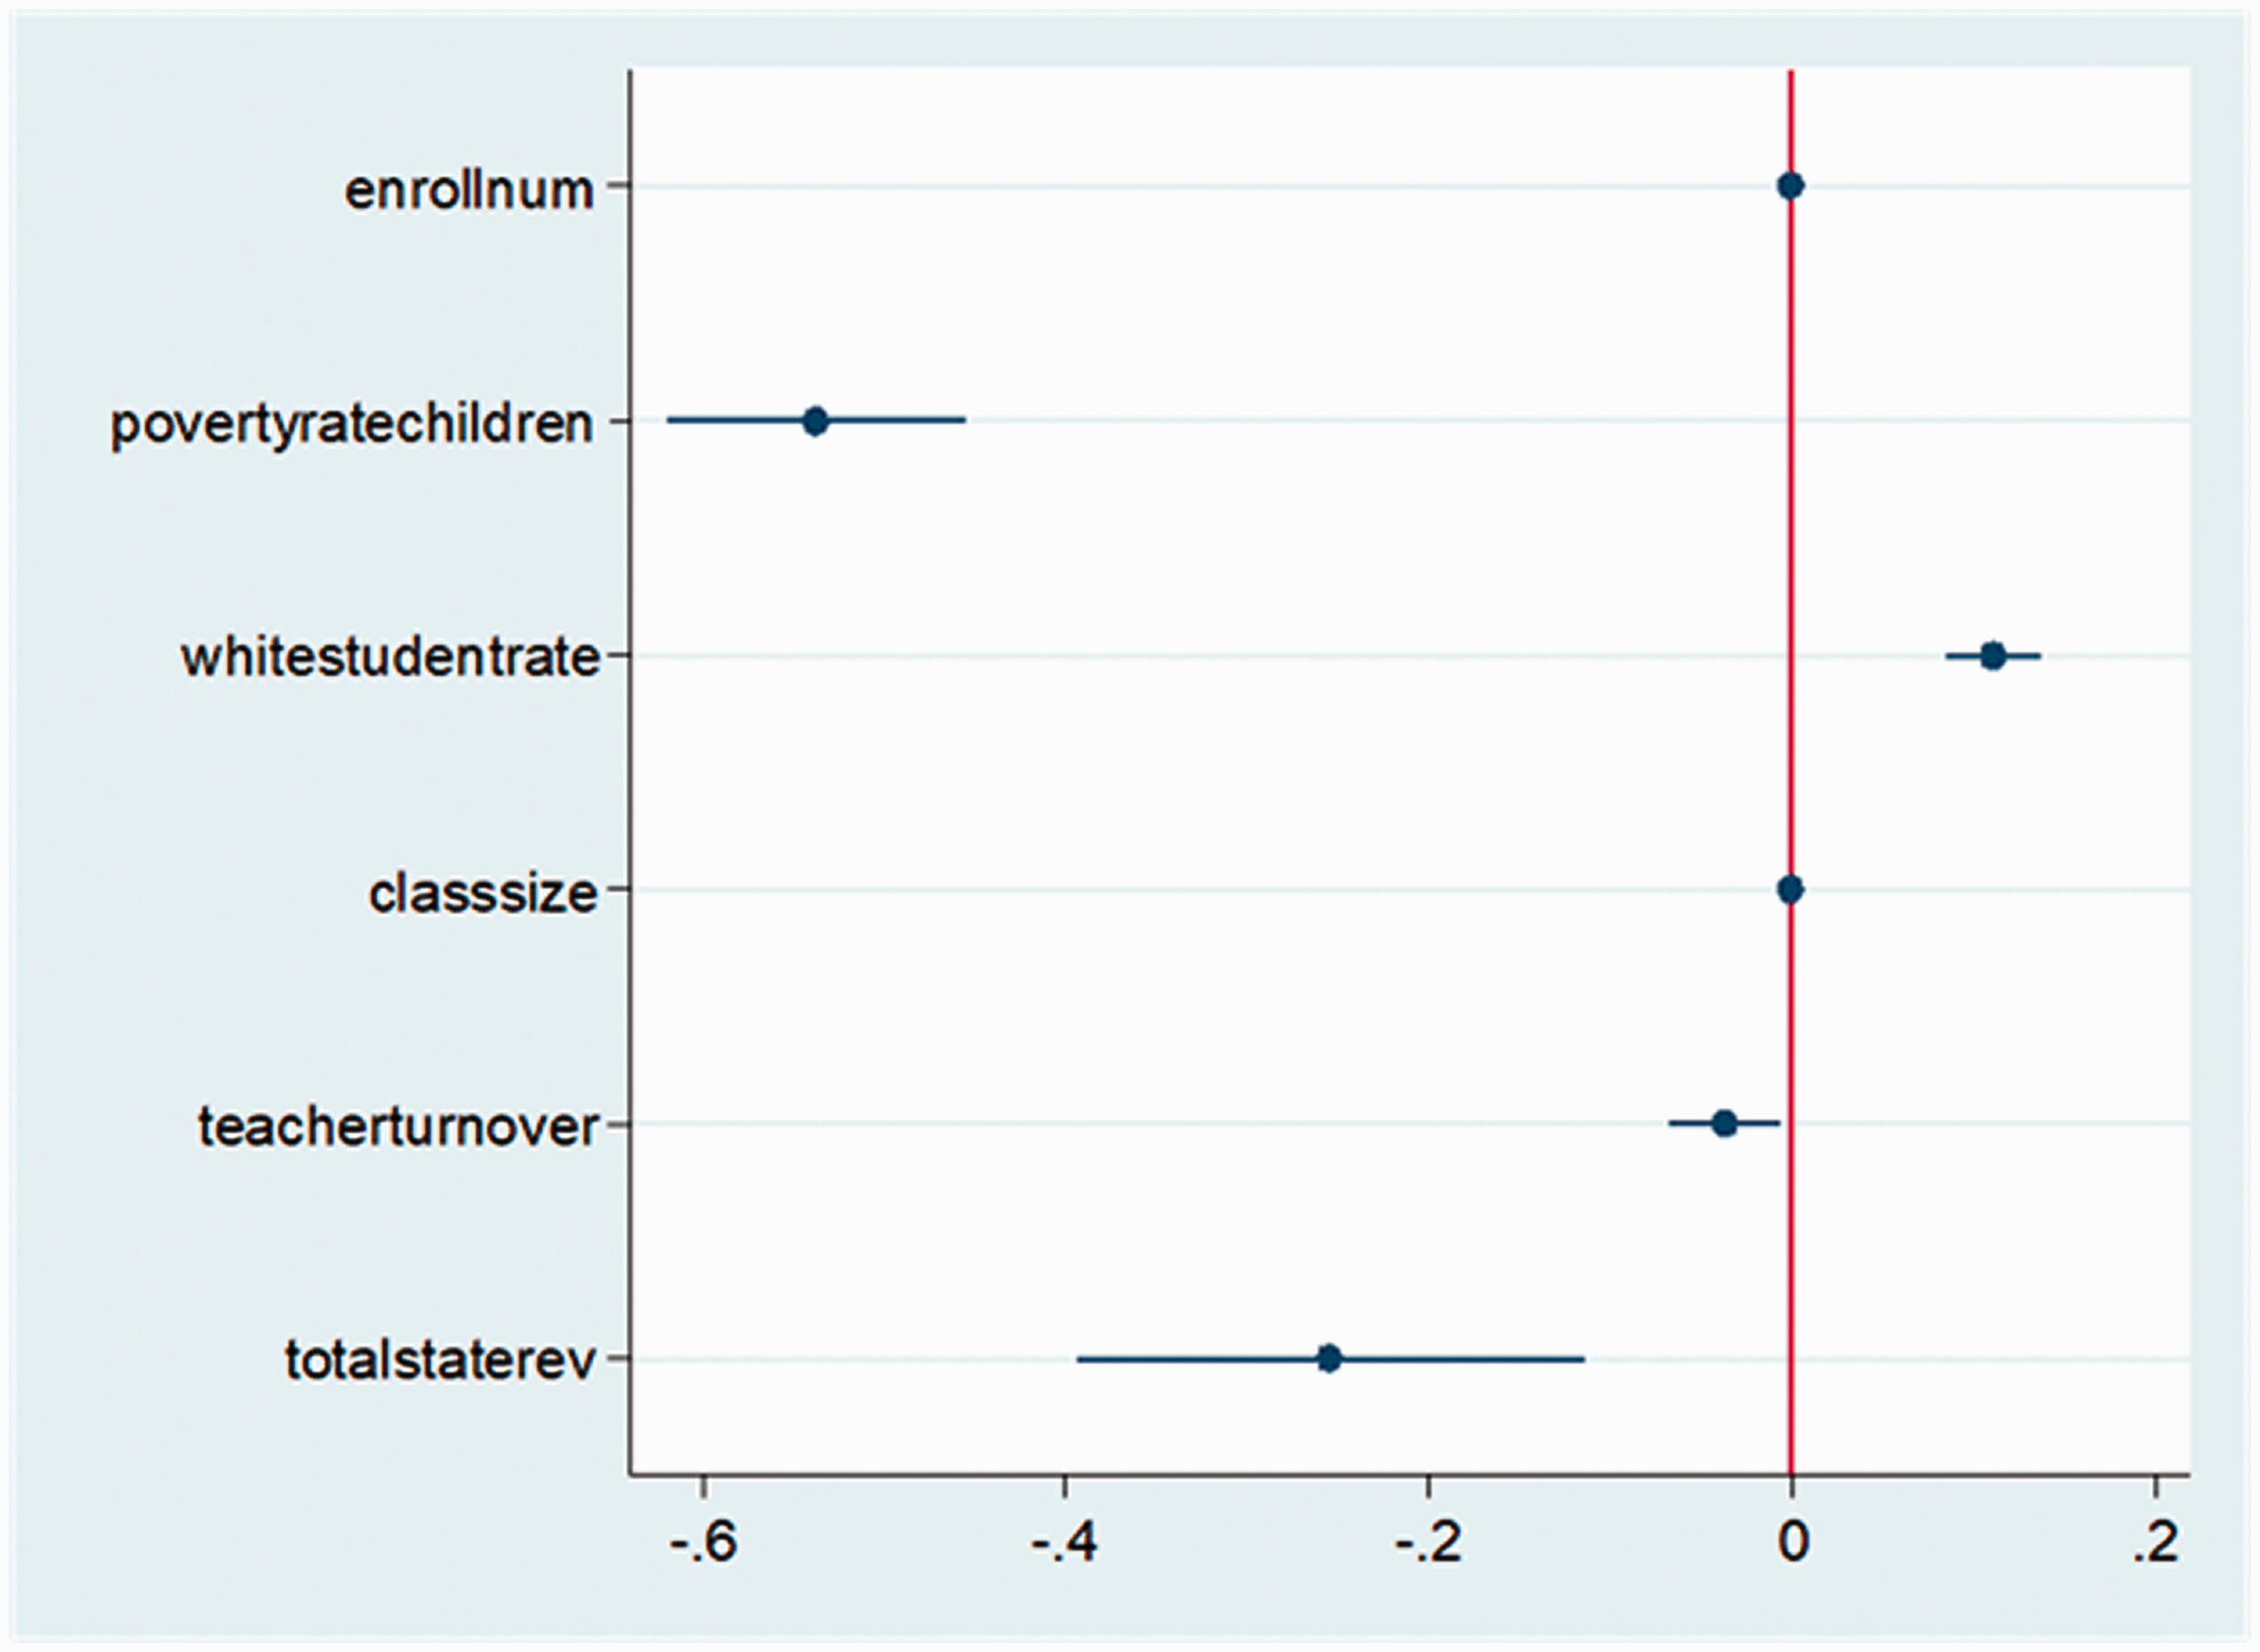
The estimated coefficients and confidence intervals of Model 5 (revenue from state government).
Model 6 ultimately answers the question of whose money really matters. Local revenues—that is, parents’ money—prove to induce a highly statistically significant and positive impact on graduation rates. An increment of US$10,000 revenue from local sources is expected to bring up the graduation rate by 1.6%. Compared to the effects of federal and state revenues on graduation, it is only the local revenue that projects a positive estimate of both statistical and substantial significance. Figure 6 depicts all variables’ estimates and confidence intervals, which makes it easier to compare the effectiveness of each factor including local revenues on graduation rate.

The estimated coefficients and confidence intervals of Model 6 (revenue from local government).
In all six regression models, control variables behave very similarly. Poverty is a crucial factor in academic performance. Alleviating poverty seems the most effective way to increase graduation rate, among all causal factors in the model. Reducing a poverty rate by 10% would, on average, increase a graduation rate by approximately 6%. Whether systemic racism or not, race seems to matter. A school district with 10% more white students is likely to score a higher graduation rate by 1%. Teachers matter as well. If teacher turnover rate declines by 10%, graduation rate is likely to increase by approximately 0.3%. The size of the school district or class does not seem to matter. The size of the school district by the number of enrolled students does not make substantial changes to graduation rate. Class size is not systematically correlated with graduation rate, controlling for all the factors in the models.
In sum, education funding matters. Both expenditure and revenue are positively associated with graduation rate. However, looking into the sources of the money, only local money counts. Neither federal nor state funding makes a positive impact on graduation rates. Parents’ education funding via local taxes only produces a meaningful positive impact on graduation rates.
Discussion of findings
Does money matter in public education? Whose money matters in American public education? These are the questions that regression analysis answers in this paper. The first question was answered by many scholars, but still remains a contentious policy question not only in state governments and school districts, but also in courts. Starting from this timeless first question, this paper poses a newly defined question of public education finance and inequality, the second question: whose money matters in American public schools? The six regression models in the previous section progress from answering the first question to the second one.
The findings in Table 1 confirms a conventional wisdom that more funding in education advances academic performance. In the school districts of NYS, an increase of total expenditure per pupil by US$10,000 is expected to raise the graduation rate by 1%. A funding increase by the same amount solely on class instruction would result in a more substantial improvement, 2.13% increase in graduation rates. Along with financial boosts, a smaller class size, lower teacher turnout rate, higher proportion of white students, and lower poverty rate in the student body would contribute to a higher graduation rate. These are the elements that the previous literature frequently discussed: school expenditure, class size, teacher turnover, race, and economic status.
While regression models in Table 1 measure how much money was spent on students, expenditure per pupil, those in Table 2 instead gauge who contributed to that expenditure to answer the question of whose money matters. This analysis explores the sources of funding from three different levels of governments in federalism: US federal government, NYS government, and local governments. Model 3 shows that total revenue from three governments is expected to produce the same effect as total expenditure. An increase of total revenue per pupil by US$10,000 is likely to raise the graduation rate by 1%. Whether expenditure or revenue, when it is measured as the total sum of money, more education funding improves school performance.
When that lump sum of money is dissected, however, the second question of whose money matters is specifically answered as shown in the last three regression models from Model 4 to Model 6 in Table 2. All the other factors such as class size, teacher turnover, poverty rate, and race being held equal, money from federal, state, and local governments works differently toward graduation rates. Model 4 shows that the federal portion of the revenue fails to explain why some school districts have higher graduation rates than others.
Regression analysis shows that federal money does not matter much in graduation rates. Two factors could be mentioned regarding this finding. First, NYS depends much less on federal funding than other states. On average nationwide, school districts rely on the federal government for approximately 8% of their budget. 25 Based on the 2017 school finance data,26 NYS public schools on average rely for 5.4% of their budgets on the federal government. Despite NYS’s lower dependency on the federal government, a significant variance still exists across school districts within the state. For example, Highland Falls Central School District receives 33% of the budget from the federal government while Shoreham-Wading River Central School District only depends on the federal government for 0.8% of its budget. Given that how much federal money contributes to a school district varies significantly even within the same state, the variance across states is much greater due to American federalism. Second, most federal educational grants are provided to serve students in poverty or with disability. The main purpose of such federal funding is to guarantee all students an equal access to quality public education; it is more about safeguarding fundamental rights than about facilitating academic performance.
Model 5 suggests a puzzling relationship between state funding and graduation rates. More state funding is expected to be associated with lower graduation rates. Inferring from this negative but statistically significant relationship, one would question if additional state funding would dampen graduation rates. Maybe the reversed way is more intuitive. Failing public schools with lower graduation rates tend to receive more funding from a state government because state funds are redistributed to aid school districts in need.
Model 6 shows whose money really matters. Local revenue per pupil is expected to produce a highly significant and positive impact on graduation rates. An increment of US$10,000 revenue from local sources would increase the graduation rate by 1.6%. In fact, regression analysis proves that local funding is the only funding source that meaningfully improves graduation rates. Therefore, money matters, but only local money—that is, parents’ money in the form of property taxes—matters in American public education. Parents purchase good public schools by moving into a school district of academic excellence in return for higher property tax burdens in America.
The efficacy of federal and state funding thus could be challenged, proving that it is not federal or state funding but local funding that really counts for increasing graduation rates. As regression analysis showed, it would cost an extra federal funding of US$10,000 per student only to improve a graduation rate by a mere 1%. New York’s public schools spend US$22,366 per pupil, double the national average of US$11,762. 27 Additional federal funding of US$10,000 on top of US$22,366 would make NYS public schools spend triple the national average only to achieve a 1% increase in graduation rates. Increasing the same amount of local funding would result in a higher return, by 1.6% increase in graduation rates.
This finding does not necessarily imply that more funding from superior governments—that is, state or federal aid—is not required to save failing public schools. Under the entrenched tradition of local control in American education policy, the role of federal and state funding has always been subsidiary. Where parents are less resourceful in supporting public schools, the state or federal government must step up to make sure every child in the state or nation receives the fair and quality public education they are entitled to. However, if a school district mismanages the state or federal funds and therefore fails to put the money into effect, additional state or federal funding is less likely to remedy the achievement gap between students in affluent communities and those in impoverished ones.
Conclusion
This paper’s contribution to the research on American education funding is threefold. First, this paper examines revenues, not expenditures, to discuss the problem of education funding and inequality in American public schools. Focusing on the revenue sources from three (federal, state, and local) layers of governments in American federalism, this paper shows that only local money matters. Parents purchase good public schools by moving into a school district of academic excellence in return for higher property taxes which mainly constitute the local revenue. When the size of local revenues for public education becomes a good predictor of its quality, as this research supports, the current education funding system is antithetical to the rationale of public education as a public good. Public education becomes less effective in diminishing inequality, further consolidating the achievement gap.
Second, this paper employs a political perspective to explain education funding and inequality. Education funding is inherently a political matter in a sense that it is a decision about “who gets what, when, and how,” which is the very definition of politics (Lasswell, 1936). It is a matter of the government’s provision of resources to guarantee a “public” good—that is, free public education for every child. Education funding in America can only be discussed in the context of American federalism involving three layers of governments.
Third, this paper offers public policy implications for education funding controversy. When the state money does not matter, state financial aids to local schools would hardly be effective in improving school performance. The dilemma goes deeper when additional state funding is mismanaged resulting in an enormous budget deficit as in the case of the US$30m budget shortfall of the Rochester City School District. 28 Public scrutiny and democratic oversight need to weigh in to address inequality and achievement gaps even when sufficient external funding is provided. The problem seems to arise when this democratic oversight is either meager or absent in local communities. When oversight is lenient, there looms a possibility of malfeasance and waste. If local governments are not equipped to strengthen accountability, the state and federal government can help to restore democratic accountability in municipalities to save failing public schools.
This paper shows that among three sources of education funding, only local funding positively affects academic achievement. When only local money matters, additional funds from federal and state governments might not generate an expected outcome in the form of academic achievement. Therefore, the effectiveness of federal and state funding became challenged and debated among education scholars and policy makers. To make the issue even more complicated, America spends more per child than any other developed country, but its pupils perform below their peers on international tests (Rushe, 2018). This paper by no means dismisses a voice for additional state funding for public schools in need. Instead, it affirms that adequate funding is a necessary condition, but not a sufficient one for quality public education. State funding needs to be accompanied by scrupulous administration in school districts.
With the inception of the Elementary and Secondary Education Act of 1965, the goal of public education was to address inequity. When students cannot afford quality education due to limited resources from their communities and families, they can rely on state governments and the federal government for additional financial aid. In addition to the federal law, state constitutions dictate that all students are entitled to receive a basic sound education. At the signing of the federal legislation, Lyndon B Johnson noted that education is “the only valid passport from poverty.” Despite this rationale, achieving efficient and equitable education funding allocation in public K-12 education is far from complete. Since Ferguson (1991: 465) portrayed such allocation of education funding as an “elusive goal” almost three decades ago, that reality is still the case.
The strong tradition of local control in public education dating back to the colonial period still persists in modern American federalism. The fact that three governments financially contribute at different magnitudes across school districts creates a distinctive characteristic in the American K-12 public education system: geographical inequality. The quality of education can be easily associated with a ZIP code. When it comes to public education, the school district your house belongs to matters.
This paper presents evidence that affluent communities with higher property tax revenues are highly likely to provide quality education, thereby leading to higher graduation rates. External financial support from state and federal governments in NYS school districts does not seem to increase graduation rates. If education is the most effective anti-poverty tool, quality public education is essential for students in poor communities. In fact, this paper’s regression analysis shows that household poverty is the most inhibiting factor for graduation rate.
The findings of this paper project that parents matter for public education in two ways. First, parents’ contribution to local revenues via taxes enhances students’ academic performance. Parents’ money coming to local governments’ coffers ultimately support public schools. As their contributions rise, residents are highly likely to be motivated to be vigilant over how their money is put to use. Second, parents hold politicians and school districts accountable for maintaining desirable communities with highly rated public schools by participating in budget hearings,PTSA meetings, and school district board elections.
This paper could be advanced by further research in two specific directions. In terms of research methodology and data, the scope and time of this study can be extended by employing a pooled, cross-sectional time series analysis to suggest a more generalized policy implication that applies beyond New York state and across time periods. That study would explain how American federalism produced different, or consistent, tales of education funding equity across states. Building upon the finding that federal and state subsidies are not a sufficient condition for improving public schools, further research can guide all stakeholders at three levels of governments in their efforts to address public education inequity. Local factors could be further explained. Local school districts’ transparent and efficient financial management can be achieved by community oversight, the role of homevoters, in addition to state regulations. In addition to adequate financial support, comprehensive community support including parental involvement should be encouraged and incentivized under the guidance of state and local governments. Exploring other local factors in depth, such as race and poverty, would also enrich the discussion of education funding in American public schools in relation to education inequity.
Footnotes
Funding
The author received no financial support for the research, authorship, and/or publication of this article.