
Abstract
The field of education technology (edtech) has emerged as a complex, multimillion-dollar industry, with various hubs in the USA leading the boom. This exploratory article uses a networks perspective to reveal the power dynamics of investor firms in edtech. The analysis examines the current top venture capitalists and their edtech companies, based on primary funding relationships. The article begins with an explanation of how edtech emerged, an overview of the K-12 environment, and an analysis as to why edtech companies have become vital players in the education sector in the USA. This study highlights the most influential actors in the edtech political economy and their structures and interactions, and concludes with recommendations for future research. The investigation has involved examining the top investors and companies closely, alongside the political and economic motivations behind their investments.
Introduction
In the past decade, a surge of investment in the education technology (edtech) industry and the emergence of powerful firms have resulted in complex, entangled interrelationships that have affected the content and delivery of education at all levels. As edtech has grown in importance, attention has shifted to the political economy underpinning its growth and reach, particularly at the K-12 level. Much of this attention is directed at the large companies moving into this space, particularly Google, Facebook, Pearson, and Microsoft, as well as at wealthy philanthropists and foundations with an interest in education, such as Bill and Melinda Gates. Although these players may well be genuinely interested in improving K-12 education, they are also entering a market projected to reach $21 billion in sales by 2020 (Singer and Ivory, 2017). Moreover, these large players are not the only companies active in edtech (Singer, 2015).Our study adopts a systematic approach for exploring the emerging funding relationships between several other key companies and investors in the edtech environment.
Over the last 20 years, technology has become ubiquitous in classrooms at all levels (Collins and Halverson, 2018; Magana, 2017). This is particularly true at the K-12 level. We examine this critical level, which is mandatory and involves what is often referred to as a vulnerable population, to illustrate emerging trends as well as the importance of investment funding. Many factors contribute to the growing importance of edtech at the K-12 level, including: the focus on STEM education; the general social trend toward a more technologically sophisticated society; the need to prepare future generations to compete in that environment; and the fact that computer-assisted learning might entice students into engaging with material initially less attractive. However, other factors are also at work here, especially the pressure on students to achieve, teaching effectiveness, and the necessity of controlling school budgets, as well as the interests of technology companies in this seemingly lucrative market.
With the expansion of edtech at the K-12 level, the controversy about its effects has similarly grown, with proponents emphasizing its positive effects on student learning and teacher effectiveness (West, 2012) and critics questioning the hype surrounding edtech and its negative implications for student privacy and socialization (Hood, 2018; Zeide, 2016). At the same time, the introduction of edtech into the K-12 educational space raises time-honored metaphysical and epistemological questions about what it means to learn, to know, to be a teacher, and to be a student, as well as ethical issues with regard to what values should be reflected in edtech applications and their use in the classroom (Aviram and Dotan, 2009; Tesar, 2016b, 2016c). Reflecting on the social history of technology innovations in education, Langdon Winner (2009: 588) reminds us that technology enthusiasts “often lack any coherent philosophy of education, relying instead on the uncritical faith that delivering masses of information in electronic form will magically enhance what happens in the school, classroom and home study.” Educational policies that embrace such enthusiasm undermine “foundational educational dignity and professionalism, and the established truths on which they are based” (Arndt and Tesar, 2018: 234). The growth and breadth of edtech’s reach underscores the importance of a critical analysis of the complexity of the modern education sector and the power relationships existing therein (Tesar, 2016a).
Although we recognize the importance of these larger philosophical, pedagogical, and ethical controversies and the policy issues generated, our focus is on the political economy of edtech, which serves as a key component of its growth at the K-12 level. As Winner (2009: 589) points out, very often, new educational technologies are promoted not because there is any well-conceived idea about their value in teaching and learning, but because they offer an attractive market for vendors and because educators want to appear fully up to date.
Applying theory and methods from social network analysis, we identify the top players in the edtech industry at the K-12 level, both edtech companies and their investors, and explain their influence within these networks. Based on investments current as of February 2017, the study provides insights into the patterns evident among the top venture capitalists (VCs) with regard to their investments in edtech companies. Network visualizations of the top 13 VCs and their edtech companies, alongside their top co-investors (based on the number of companies they have in common within their investment portfolio), illustrate interconnectivity in the network and reveal the most influential and central investors and edtech companies.
Our analysis provides a preliminary insight into these dynamics and addresses the following questions: What kinds of patterns are found in the VC funding relationships and what does this tell us about the nature of the edtech industry? Who are the top edtech investors? Who are the most influential edtech companies funded by the top edtech investors? Before presenting the network analysis and findings, we begin with a brief review of edtech at the K-12 level and the expansion of the edtech industry within this space.
Edtech in the K-12 environment
Concerns about commercial influences in schools date back to the 1920s, and neoliberal proposals with regard to privatization and market influences in schools (Ball, 2012) date back to the 1980s, as exemplified by school choice and the charter school movement (Chubb and Moe, 1990). We see edtech in schools as the latest iteration of this trend—but an iteration that we believe involves qualitatively different implications. Alex Molnar distinguishes three types of commercialization: selling to schools (textbooks, sports equipment); selling in schools (vending machines, magazine subscriptions); and selling of schools (privatization, charter schools). He further points out that selling to schools has been relatively noncontroversial (Molnar, 2017: 622). Arguably, edtech fits into the selling to schools category; however, there are a number of features of edtech that distinguish it from traditional products.
First, edtech is being aggressively marketed as a suite of products and services that will both improve student learning by presenting students with more engaging lessons, enabling more individualized instruction, and reduce overall school budgets through more efficient teaching and administration. Marketing by edtech companies involves a number of strategies, including advertising in teacher publications, offering “free” software products to schools and individual teachers, and sponsoring trade shows (Player-Koro et al., 2018), at which educators can learn about edtech’s advantages and products. For example, the International Society for Technology in Education’s annual conference in 2018 drew more than 18,000 attendees from 87 countries, as well as 6000 representatives from edtech companies (Noonoo, 2018). Second, edtech is transforming what is occurring in classrooms in ways that may limit the control of teachers. Selection of a particular software program shapes the way a lesson is presented and the activities in which students engage with the material. Personalized learning applications may lead students in different directions that are not apparent to the teacher (Roberts-Mahoney et al., 2016). Third, edtech entails the transfer of student and teacher data to private companies, raising privacy concerns and legal implications as schools are responsible for protecting such data (Peterson, 2016; Reidenberg et al., 2013; Zeide, 2017). Finally, improvements to edtech products involve using this data and, therefore, commodifying students in particular and teachers to a lesser extent. Edtech companies often partner with schools to beta test new products, with the idea that such testing will improve products and, therefore, student learning. However, at the same time these companies are using students and teachers as testers of the products (Cavanagh, 2013). Edtech applications that employ algorithms incorporate improvements in those algorithms based on their use by students.
As Boninger and colleagues similarly point out in a 2017 report (Boninger et al., 2017: 3): For-profit entities are driving increasing reliance on education technology with the goal of transforming education into an ever-larger profit center—by selling technology hardware, software, and services to schools; by using technology to reduce personnel costs; by creating brand-loyal customers; and increasingly, by turning student data into a marketable product.
Given the broad effects that edtech is poised to have on K-12 education and the political support for technology in the classroom (Bienkowski et al., 2012), an analysis of the commercial factors influencing edtech seems warranted. Four different groups of actors have been important in advocating edtech. First, there are wealthy foundations that are concerned about the state of the US education system and believe that technology offers tools for improving children’s educational experience (Baltodano, 2017; Hess and Henig, 2015; Reckhow, 2013). These philanthrocapitalists (Bishop and Green, 2008) include the Bill and Melinda Gates Foundation, the Carnegie Foundation, and the Chan Zuckerberg Initiative. Second, there are the tech companies themselves, Google, Facebook, Microsoft, and Apple, who are developing and marketing their products for use in K-12 classrooms (Singer, 2015, 2017; Singer and Ivory, 2017). Third, there are the education publishers, such as Pearson (Hogan et al., 2016) and McGraw Hill, who are offering online and software programs derived from their print materials. Finally, there are the VCs who see growth potential in the education market and are investing in edtech start-ups. This latter group has received less attention than the other three and is the group that we analyze in this article.
The edtech sector is booming. In 2014 more than $1.8 billion in venture capital was invested in the estimated $8 billion market for edtech software (CB Insights, 2015). This has meant a surge in new start-ups and an increase in interest in the sector from large and established technology companies, and has led to increased competition for domain space. There was a massive boom in investment in the edtech space between 2010 and 2015 (EdSurge, 2015). The year 2015 was noted a peak year for edtech, indicating the exponential growth of this market and strong interest among the investor community in the profitable prospects of the edtech industry. All categories of education, including higher education, adult learning, corporate learning, and K-12 education, were included in the surge of investment in edtech products and activities. Initially, more edtech funding went to higher education, particularly to massive open online courses (MOOCs). Education companies had a rocky start before 2000 with many companies plummeting when the stock market crashed in 2001, and by 2010, trends showed more entrepreneurs and investors returning to K-12 education. In the last six years, more money has gone to K-12 edtech ventures with record numbers in dollars and deals (EdSurge, 2015).
Most funds from VCs go to larger and more established edtech companies (EdSurge, 2015) rather than new start-ups or less well established companies. However, some sources indicate that edtech investments have reached a peak, because investors are finding it difficult to accept new ideas (Sheiber and Magee, 2015). Although a plunge in investment was evident in 2016 (CB Insights, 2016c) as shown in Figure 1, the edtech industry remains vibrant. Big players that have been in the industry longer, are “eating up” or gradually eroding the smaller players, and start-ups have a more difficult time developing novel ideas that can spark investor interest. Investors often pull out of deals because ideas and start-ups are not innovative enough (Griffith, 2014). These dynamics have introduced the need to examine the motivations of these larger companies and investors.

Edtech global investments 2011–2016.
According to a managing partner at a top VC in the education sector, Learn Capital, funding can have crucial implications for edtech companies and the education scene decades into the future (Koba, 2015). Because of the influence that funds have on the edtech market and, in turn, on society, our focus in this study is on the “funding” component of the relationship. However, other types of relationships and considerations may also matter in decisions about edtech. Some have questioned the effectiveness of edtech applications as teaching tools or noted that various forms of edtech may not currently show their full effect, or pointed out that, as far as students are concerned, edtech could hinder the experiences of human interaction and the development of basic social skills. Equal access to technology in school districts based on geography and financial resources is another important obstacle. Hence, it is also important to follow the motivations of these investment firms beyond their business and economic objectives. The first step toward understanding the complex relationships in and implications of this sector—and our focus here—is to identify the key players and their relationships.
Access to edtech innovations is often explained in terms of geographic coverage. Some of the biggest hubs for edtech companies and projects include Silicon Valley, Los Angeles, New York, DC, Baltimore, and Chicago (Chadha, 2015). In general, the K-12 sector in the USA has experienced increases in funding and school adoption with regard to edtech, although this varies by location and has an impact on inequalities already apparent in the education system. Only a few VCs invest in edtech based on the companies’ interest in education reform efforts, in particular, the promotion of diversity and inclusion. Two of the most notable who do so are Kapor Capital and the New Schools Venture Fund. These two VCs search for companies that aim to have a positive social impact or to eliminate social and economic barriers.
Furthermore, edtech investors also vary in their focus: the specific edtech sector, number of deals, level of activity, and amount of investment (EdSurge, 2015). Investors tend to favor a particular few edtech companies, and many investors focus on sectors beyond the K-12 space. Additionally, as noted above, VC funding is just one source of finance for edtech; government funding, personal spending from billionaire entrepreneurs, and philanthropy from individuals and companies are also critical sources that need to be taken into consideration. Edtech experts suggest that the future of edtech will be crafted by these investors (Watters, 2015). As in other areas of education policy, identifying and understanding networks of actors that have an influence on edtech is increasingly important in understanding power relationships and policy outcomes (Ball, 2012; Hogan et al., 2016; Lubienski, 2018). Investigating the network structures of investors and their roles (i.e. who they fund) is imperative for an understanding of the crucial implications of funding for edtech. This preliminary analysis will begin to map out these funding relationships through a review of the top VCs and their portfolios in the current (as of February 2017) edtech economy. The next section provides an overview of the data, a literature review, and the methodology for the network analysis.
Data and methods
As part of this exploratory analysis of network effects on the edtech industry, the first step was to review various sources and trade press outlets, including online publications about developments in the edtech arena. Based on information derived from top edtech trade resources, most notably CB Insights and EdSurge, the top 13 VCs were identified. 1 These are: Kapor Capital, Learn Capital, GSV Capital, 500 Startups, the New Schools Venture Fund, Social Capital, Rethink Education, New Markets Venture Partners, Reach Capital, Catamount Ventures, Owl Ventures, New Enterprise Associates, and Accel Partners (CB Insights 2015, 2016a, 2016b; EdSurge, 2015). After identifying these top investors, a content review of their portfolios from databases including Crunchbase, EdSurge, CB Insights, TechCrunch, and their associated online websites disclosed the different edtech companies they fund. Crunchbase also provided all the co-investors with which the top 13 VCs have a co-investment relationship. An examination of the websites of these investors helped triangulate and verify the information and determine which start-ups and companies still existed at the time of research. The review of investor website portfolios revealed the primary funding relationships of each investor and details on each top VC are provided in Table 1. The data and research cover the period up to February 2017. 2
The top 13 VCs.
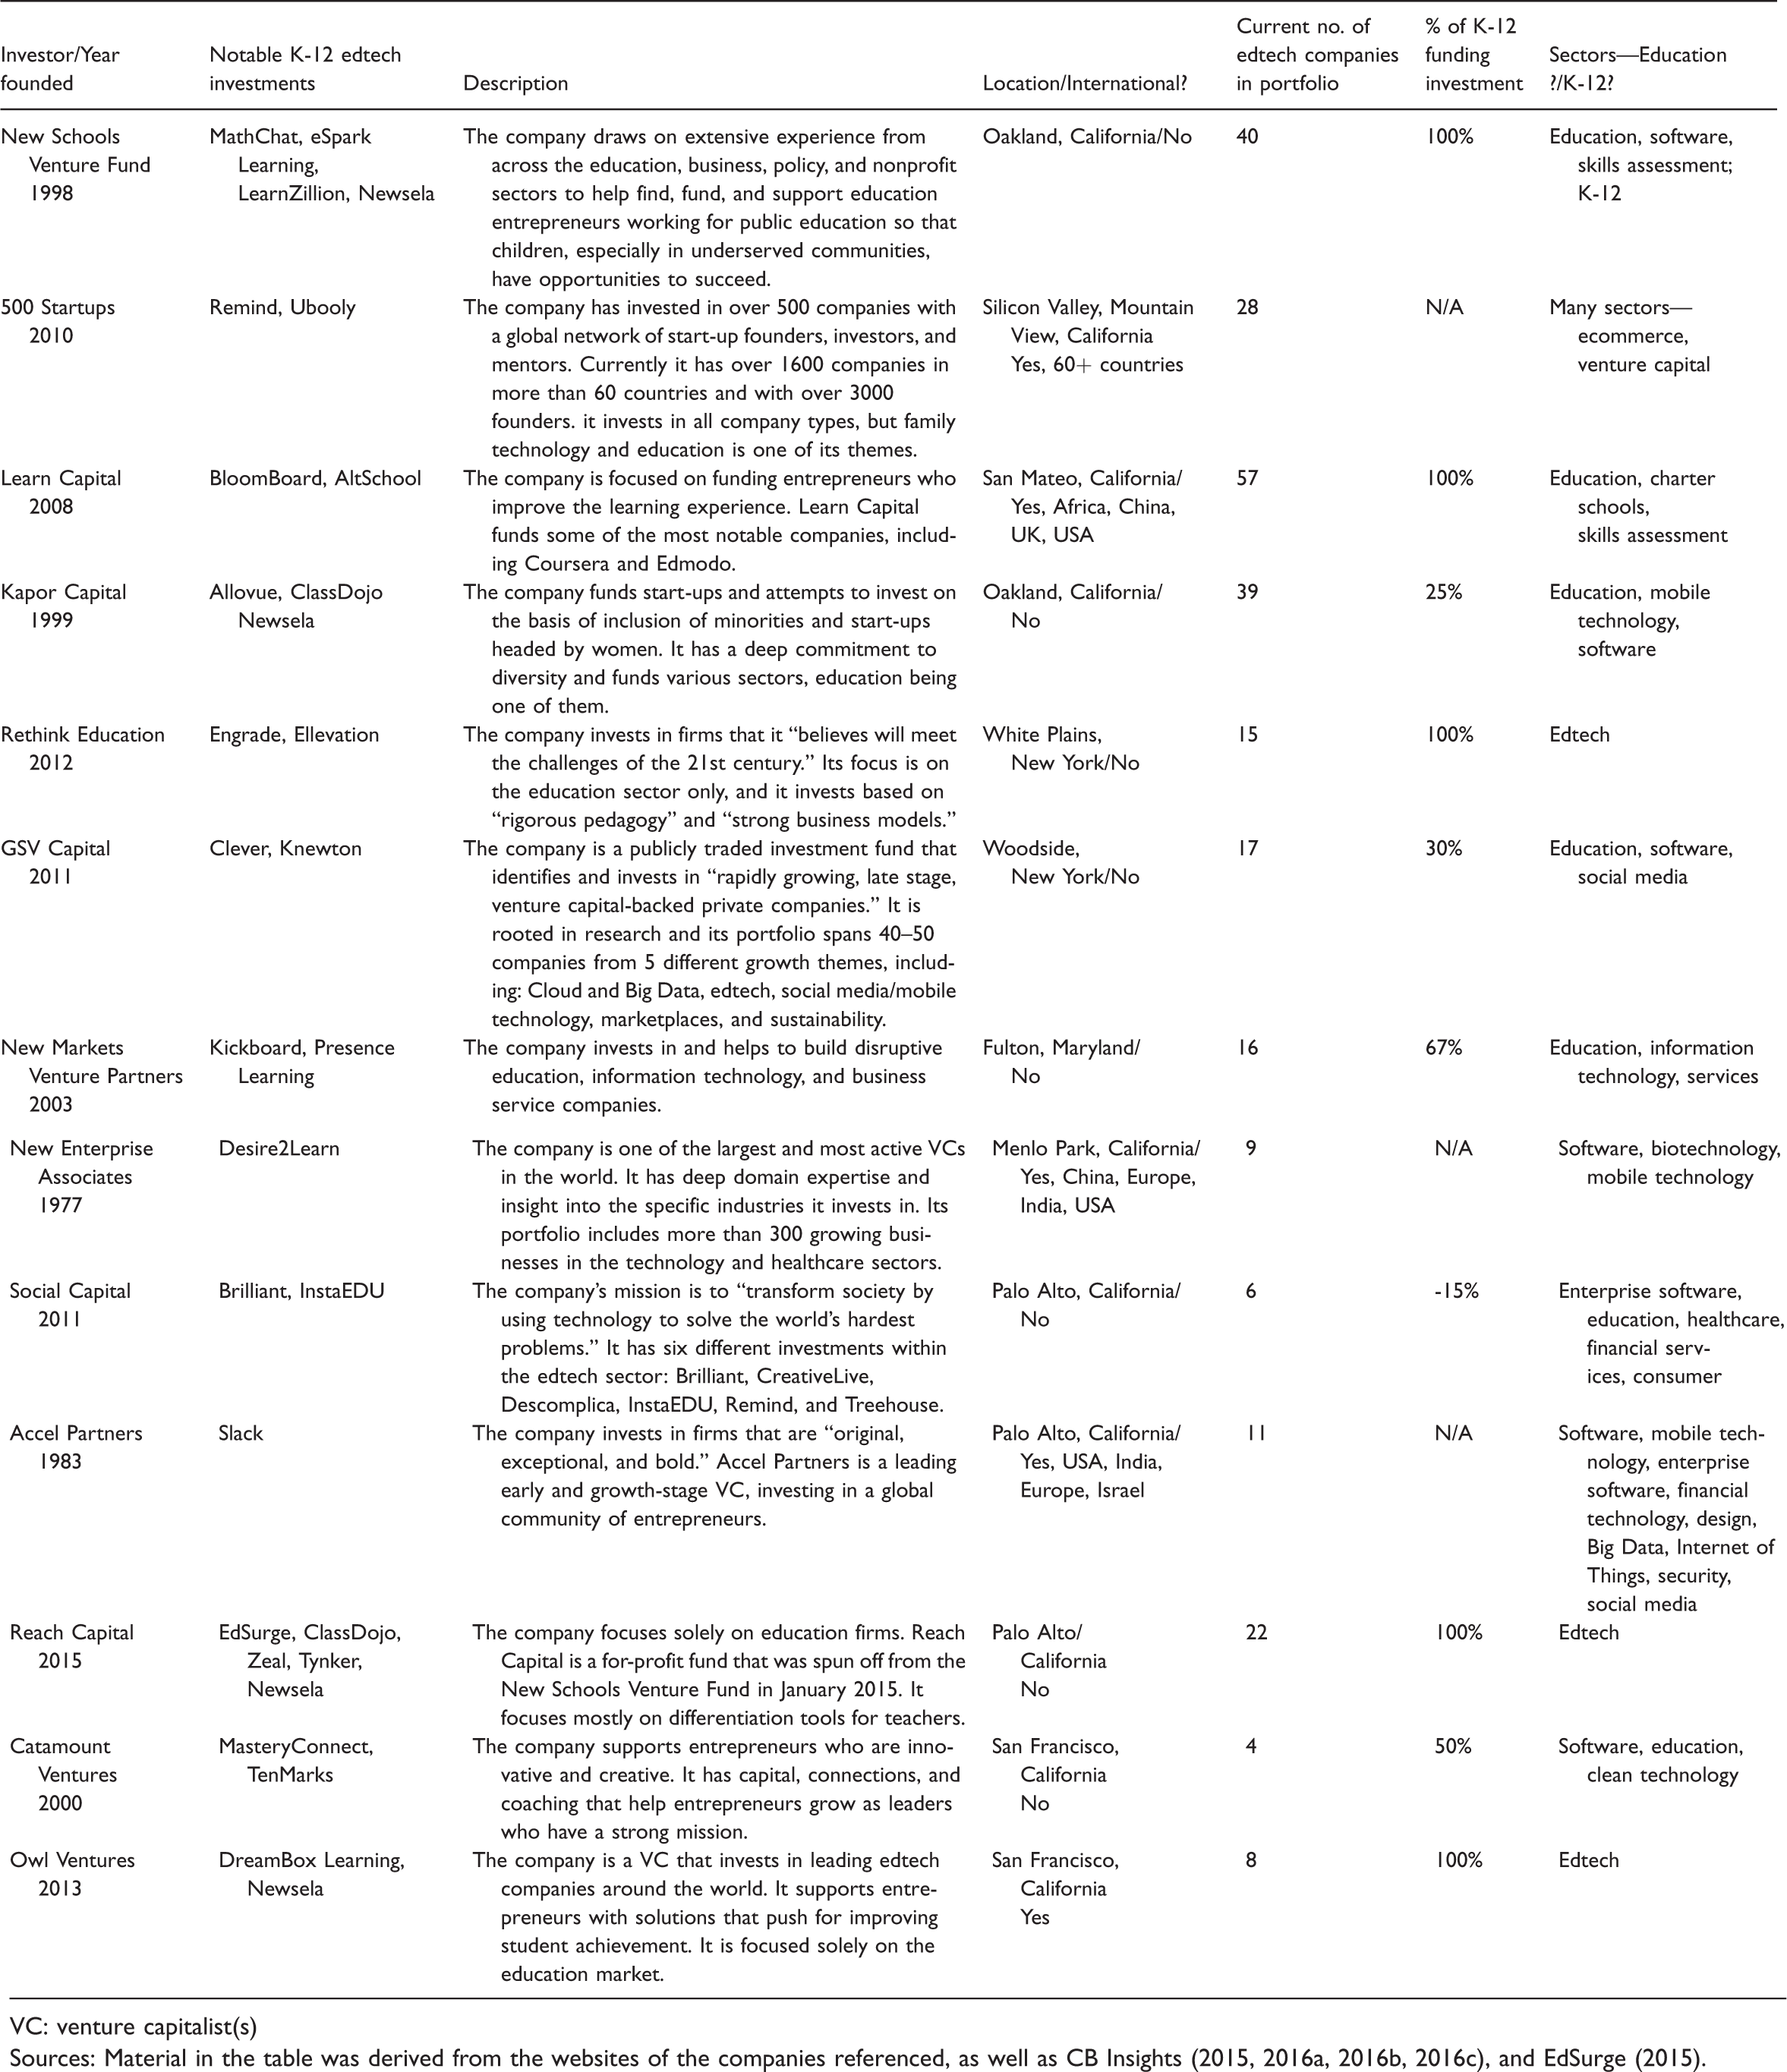
VC: venture capitalist(s)Sources: Material in the table was derived from the websites of the companies referenced, as well as CB Insights (2015, 2016a, 2016b, 2016c), and EdSurge (2015).
It is important to make a few observations about the top VCs prior to our network analysis. The majority of these investors are situated in the hubs of the edtech industry in the USA, but some have demonstrated international expansion. Most of them are situated in California, two are located in New York, and one in Maryland. Although most of these investors fund companies in the USA, four have international outreach: 500 Startups, Learn Capital, New Enterprise Associates, and Accel Partners. The VCs that show the greatest total number of investments in companies are those whose focus is outside of the education sector and who raise a higher amount of funds. The companies with 100% focus on edtech and K-12 investments include the New Schools Venture Fund, Learn Capital, Rethink Education, Reach Capital, and Owl Ventures. This is important to note, as despite the 100% focus, other VCs that have expanded beyond the edtech and K-12 space may prove to have greater influence on important socio-economic issues associated with the expansion of edtech even though their emphasis or consideration is not on or for this sphere.
Social network analysis was used to reveal trends for and insights into the relationships between the edtech companies and the top 13 VCs and between the top 13 VCs themselves (Hanneman and Riddle, 2005; Seidman, 1983). The social network analysis was completed with Gephi and UCINET software (Borgatti 2002; Borgatti et al. 2002). Two different datasets were constructed and data was coded as follows: for the first dataset we coded for the mere existence of edtech companies in the portfolios of the top 13 VCs, and an edge list (a list of all the relationships among each node in an Excel spreadsheet) was created based on this coding; for the second dataset we coded based on the co-investor relationships, creating an edge list of the top 13 VCs and their top 5 co-investors. The ties were weighted based on the number of companies they share in their investment portfolios.
Once computed in Gephi and UCINET, two groups of analyses were created. The top 13 VCs and their edtech portfolios are directed graphs (depicting the direction of the relationships—the giving and receiving of funds), with 239 nodes (actors) and 272 ties in both Gephi and UCINET (Borgatti, 2002; Borgatti et al, 2002). The second set of graphs, the top 13 VCs and their top 5 co-investors, are directed graphs with 45 nodes and 65 edges in both Gephi and UCINET. Ultimately, all nodes in both graphs are either edtech investors or edtech companies (both classified as firms) and the ties represent the investment in the company or the shared investment with other companies. The tie weight for the first group of graphs is 1 (based on a simple investment made to a company). The tie weight for the co-investors’ data is based on the number of edtech companies they co-invest in together, or share in common for investment.
Findings
Our findings are organized into two categories: first, we focus on the VCs and the edtech companies in which they are investing; and second, we examine the relationships between the VCs themselves. Our main findings are summarized briefly below.
The funding network demonstrates breadth and interconnectivity, as well as diversity among the connections. The diversity of the edtech companies in which funders are investing suggests that investors are casting a wide net and do not have any perceivable criteria for investment. Edtech companies with a large number of investors represent a range of substantive subject areas. None of the top edtech companies have a particular focus on targeting issues associated with student diversity and learning needs. Several edtech companies serve as bridges keeping the investors connected to the same number of other investors. There is great interconnectivity among the actors within the investors’ network. Investors that focus only on edtech sector investments demonstrate a stronger intermediary role in the edtech landscape than investors who have several sub-categories of investments. The most influential investors co-invest with companies who have high numbers of investments.
VCs and their edtech companies
The top 13 VCs are investing in a wide variety of edtech companies. Remarkably, all of the top 13, except one (Accel Partners) invest in at least one of the same edtech companies (see Figure 2). The funding network demonstrates great breadth and interconnectivity, as well as diversity among the connections. Additionally, as the network shows, we see two components, one large with 12 investors and their portfolios, and one small with just one investor and its edtech portfolio. Accel Partners, a top VC that funds edtech, is disconnected from the rest of the network. This suggests that none of the companies in which Accel invests are funded by any of the other investors. The edtech company with the highest number of investors is Newsela. Newsela is an edtech start-up with the aim of using technology to engage students in grades 2–12 with news and nonfiction articles and to expose them to the real world of the newsroom and boardroom. Four companies from the top 13 VCs invest in Newsela: Owl Ventures, Kapor Capital, Reach Capital, and the New Schools Venture Fund. As Table 1 demonstrates, all of these companies have 100% focus on the K-12 sector in their investments. Kapor Capital shows a 25% focus on edtech, but has a large presence in the investment scene as a company operating longer than the others.
VC and Edtech company network.
Figure 2 also shows that seven other edtech companies, including Coursera, Brilliant, ClassDojo, Tynker, Chromatik, LearnZillion, WriteLab, and Zeal, have the next highest number of funders. These edtech companies represent a great deal of diversity in terms of their substance, technology, and education level market niches. Only one company, Coursera, focuses exclusively on the higher education environment offering universal access to online courses through partnerships with top universities. Three companies have no particular education level focus but do have a specific educational niche. Brilliant focuses on math, and science and engineering, and allows users from around the world to pose a problem and have it solved by other users. Brilliant seeks to create a community of all ages, backgrounds, and nationalities working together to share possible solutions to problems. Chromatik uses technology applications to redefine how people of all ages learn, practice, and perform music (Kozlowski, 2012). The co-founder of Chromatik was a music teacher in the Los Angeles County public schools. WriteLab operates in both the K-12 and higher education environments, using machine learning and natural language processing to identify patterns in students’ writing in order to provide feedback and suggest revisions.
The three other companies with the next highest number of funders are focused primarily, if not exclusively, on K-12 education. ClassDojo occupies the K-12 space, offering a communication application connecting teachers, parents, and students so they can share photos, videos, and messages throughout the school day. LearnZillion operates in the K-12 space with a focus on more effective Common Core education, offering digital curricular materials, an enterprise platform, and professional services in order to enable districts and states to take ownership of their curricula and provide teachers with tools to engage students. The co-founder of LearnZillion was a principal in a DC charter school. Tynker focuses on fourth grade and higher with the aim of providing students with a better foundation in computer science, programming, and critical thinking skills so they are prepared for the future. Finally, Zeal provides online math tutoring, allowing teachers to assign students specific math problems and enabling students to work with Zeal’s online coaches, who are mostly current and retired teachers, in live sessions using a shared whiteboard and audio connection.
The diversity of these edtech companies suggests that investors are casting a wide net and do not have any fixed criteria for investment. Generally speaking, these top 13 VCs are not restricting or controlling the range of edtech options available to students but instead appear to be opening up some rather innovative technologies for students. The K-12 sector is well represented among the edtech firms receiving funding from a large number of top investors with Newsela, ClassDojo, LearnZillion, and WriteLab. In general, edtech companies with a large number of investors also represent a range of substantive subject areas—everything from music, news, and writing to math, computer science, and science and technology. None of the top edtech companies, however, appeared to be focused on targeting issues associated with student diversity and learning needs.
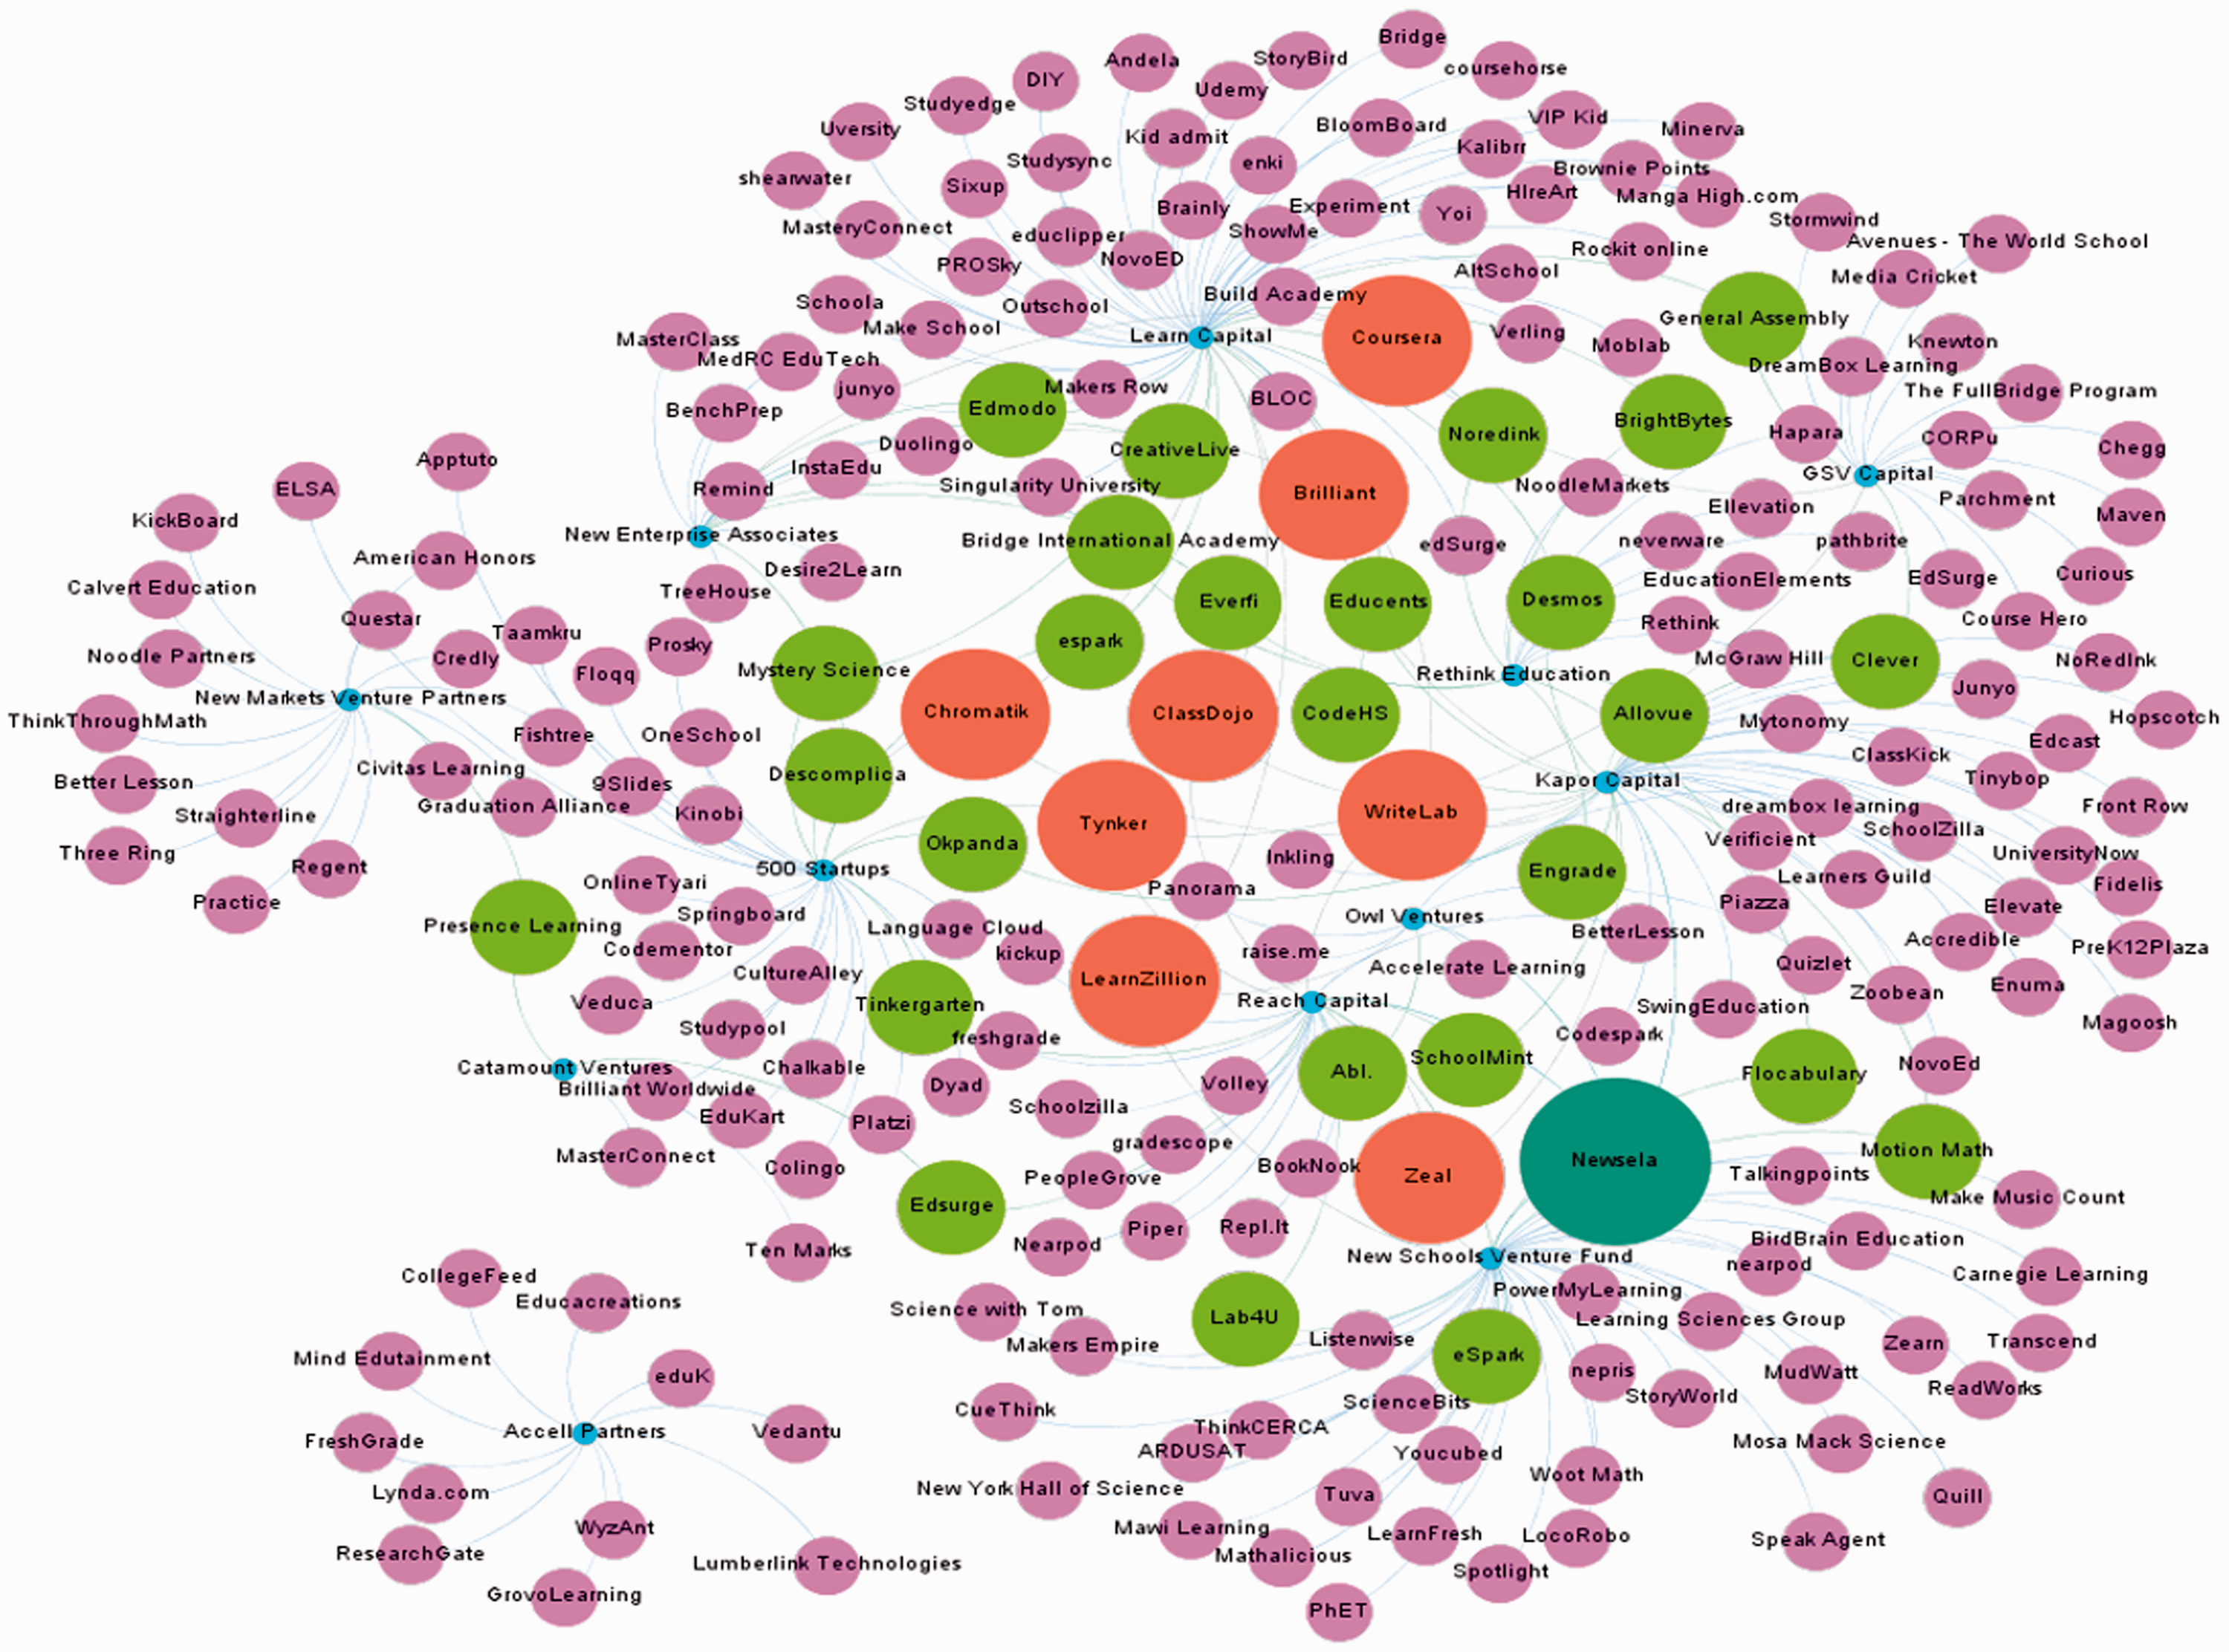
Next, we determined which of the top 13 VCs had the largest number of edtech companies in their portfolios. Learn Capital is the player providing the largest number of investments in the general edtech sector, alongside Kapor Capital and the New Schools Venture Fund (see Figure 3 for the network and Table 1 for more information on these investors). In Figure 3, through a “community detection” method in network analysis (see Appendix A for the description of this method), we also identified the communities and sub-communities in this network. Although the network as a whole is not highly connected, there are 11 distinguishable communities. There are 13 investors and 11 communities, and two of the investors along with their edtech network portfolio overlap: Owl Ventures and Reach Capital are in one community (modularity class), and Catamount Ventures and the New Schools Venture Fund are also in one community. When a company is in the same community as another, the connections between those companies are stronger. Given that both duos of companies share the same community, this suggests their interactions within their respective communities will be greater. This is critical, as it shows the increased strength of relationships between companies in the same community as opposed to them having weaker relationships with other companies in the network (Blondel et al., 2008). There is more interconnectivity between Owl Ventures and Reach Capital (whose focus is 100% K-12) and their edtech portfolios, as well as between Catamount Ventures and the New Schools Venture Fund (50% and 67% focus on K-12 investments, respectively) and their edtech portfolios. Catamount Ventures was founded in 2000, is based in San Francisco, invests only in US companies, and supports innovative and creative entrepreneurs in a range of areas.
VC Edtech company communities: modularity class (by node color) and out-degree centrality (by node size).
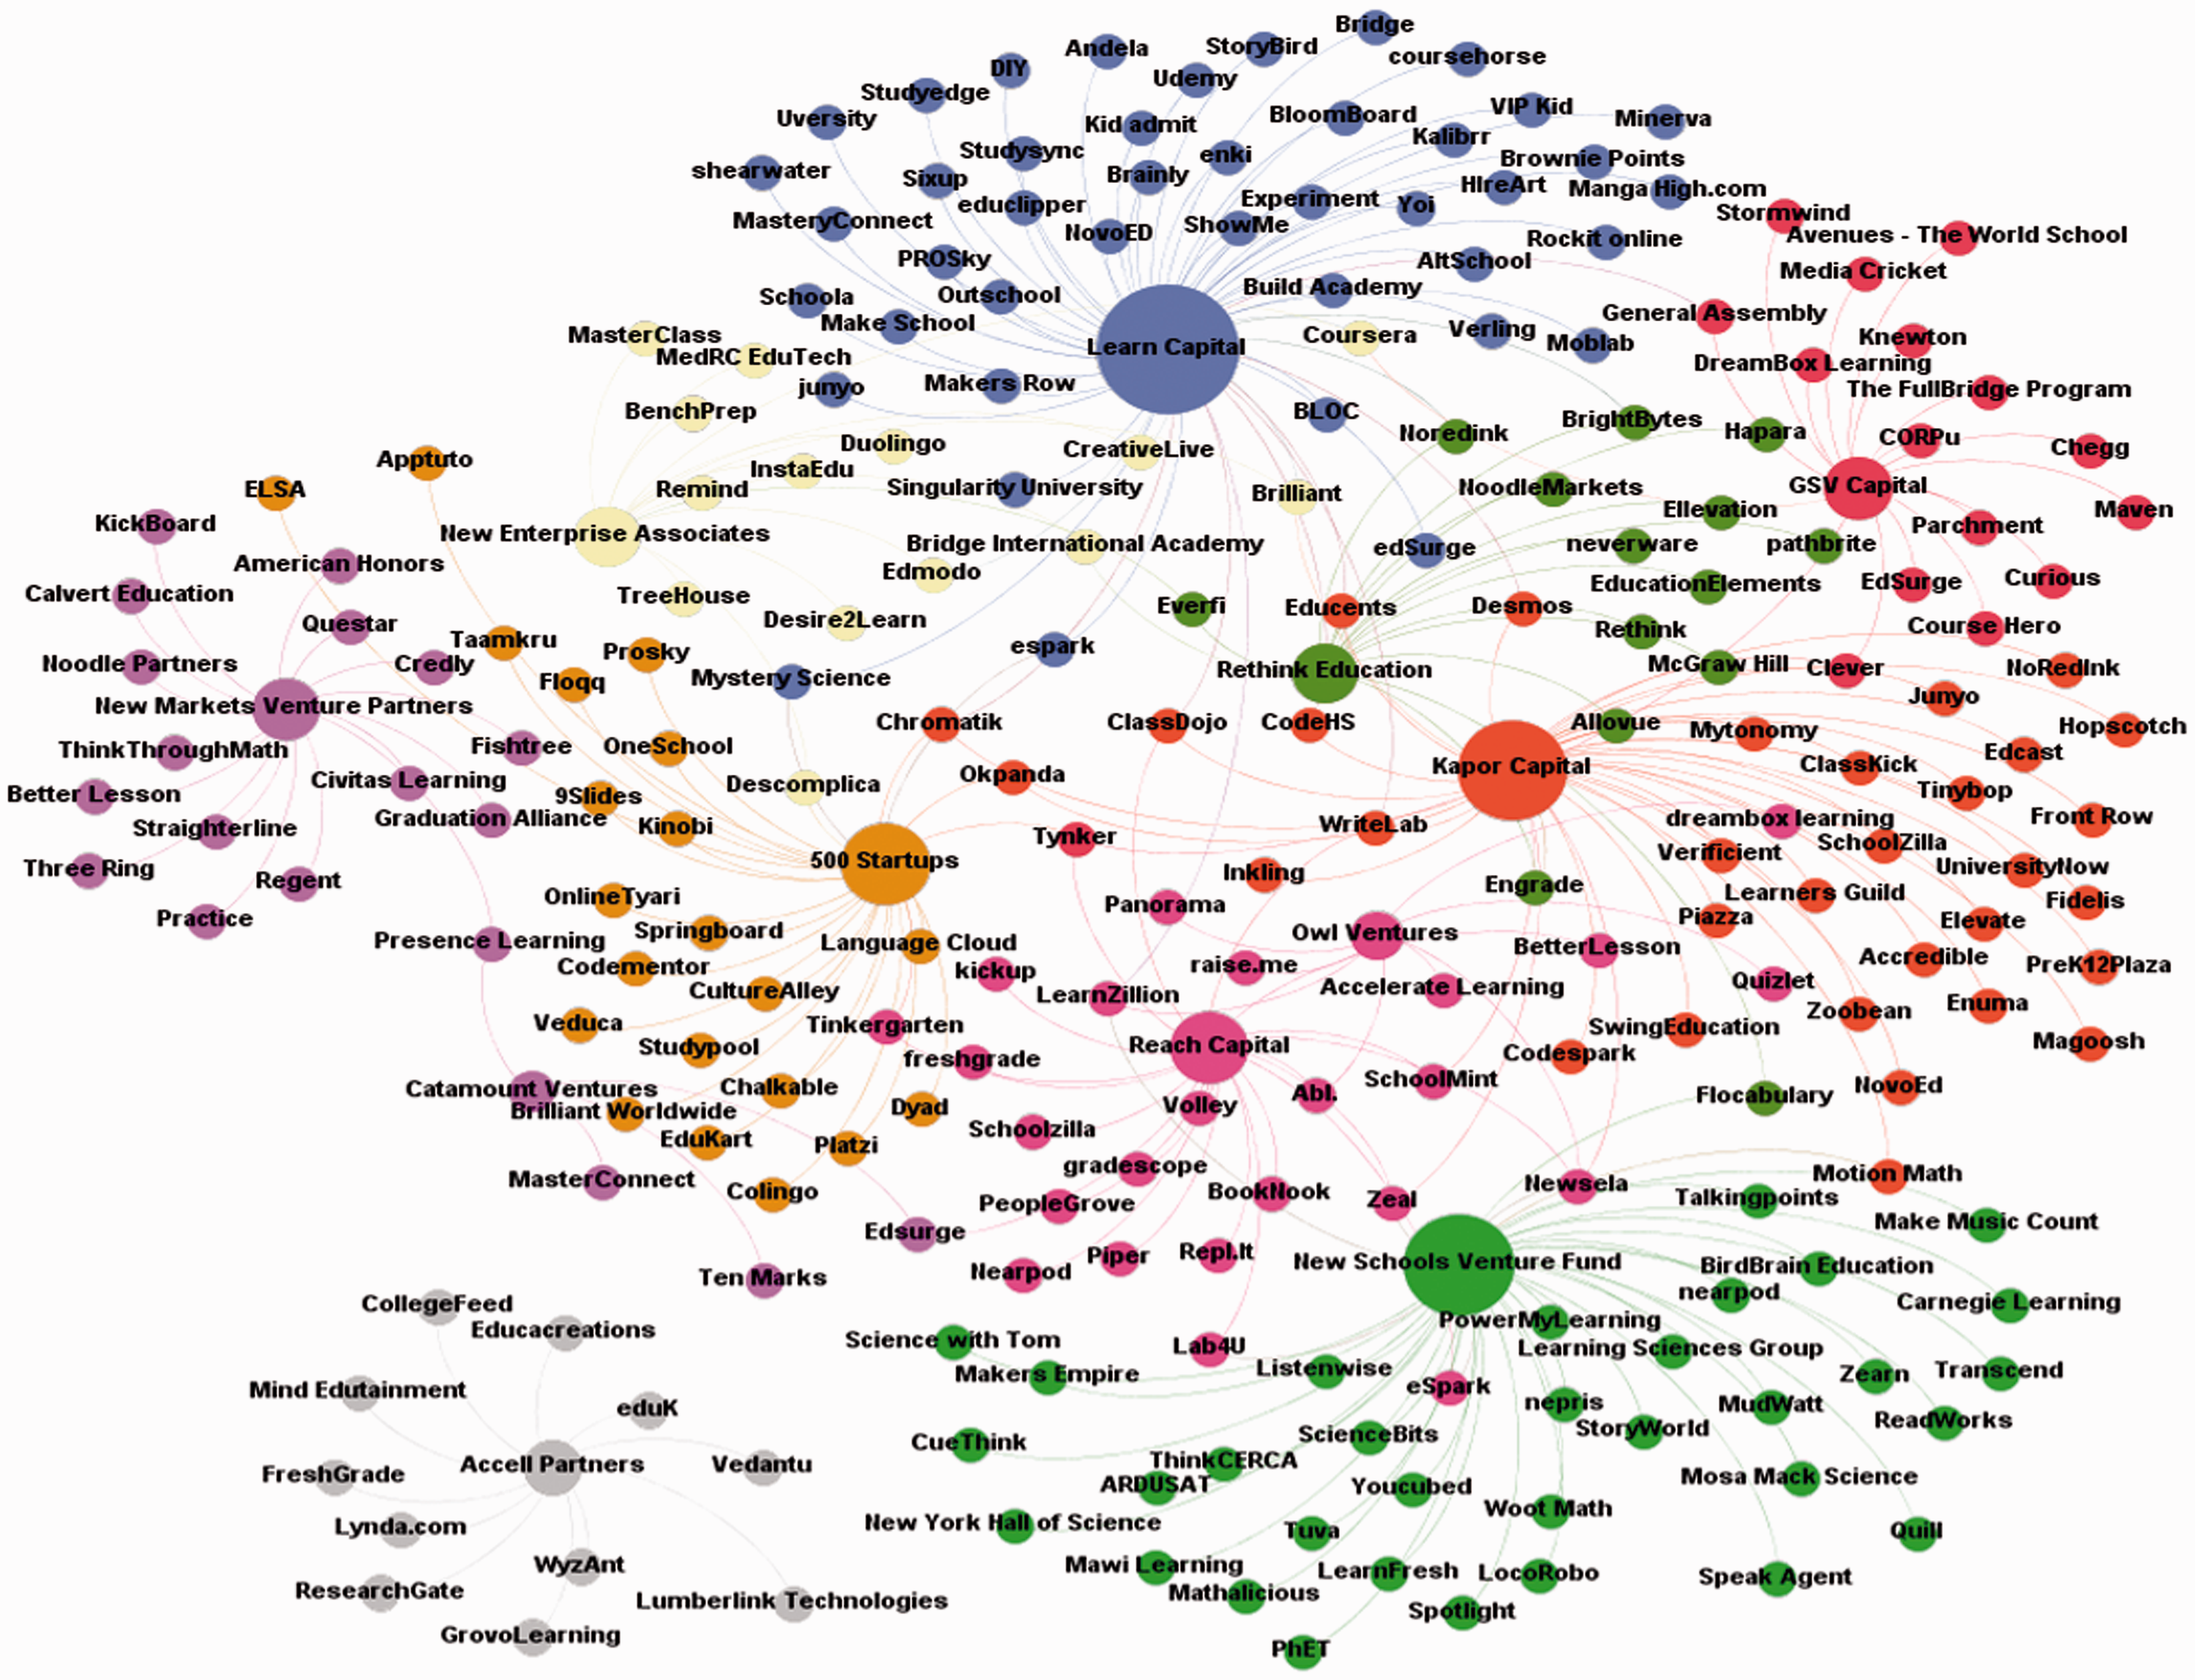
The high interconnectedness (density) of the 13 VCs and their edtech companies is further illustrated in Figure 4, which also shows the edtech companies that serve as bridges, keeping the VCs connected to a similar number of other investors. Several edtech companies again stand out as big players based on the number of VCs investing in them, particularly LearnZillion, Newsela, WriteLab, Brilliant, ClassDojo, Chromatik, and Coursera.4 It is also important to point out the pivotal roles played by EdSurge and PresenceLearning, which bridge the network to one of the top key investors, New Markets Venture Partners (as distinct from New Markets Venture Fund), and its edtech portfolio. EdSurge and PresenceLearning have the potential to play influential gatekeeper roles for the diffusion of resources throughout the network.
Edtech companies serving as bridging players (by node color); node size based on number of investments received.
VCs and their top five co-investors
When we turned our attention from the top 13 VCs and their portfolios of edtech companies to the relationships between the other investors in edtech, we found a greater level of involvement or interconnectivity between actors in the investors’ network. From the investor network structure 3 (see Figure 5), 500 Startups is the most influential actor with the largest number of co-investments made with its co-investors (weighted ties). The weight of the relationship (meaning the number of co-investments shared with each co-investor) is shown in the thickness of the lines between each actor. As mentioned earlier, 500 Startups focuses on investment in sectors beyond education and edtech, and expands its outreach to companies around the world. Other top investors include Accel Partners, New Enterprise Associates, and Kapor Capital and, potentially, Social Capital. All these companies extend their focus beyond the K-12 sector. As Table 1 shows, Accel Partners, founded in 1983 and located in California, is a leading early and growth-stage global VC that invests broadly; one of the notable K-12 companies in which it invests is Slack. New Enterprise Associates, founded in 1977 and located in California, is one of the largest VCs in the world and although its focus is primarily in health care, it does have edtech investments as well. Kapor Capital is another Californian firm founded in 1999 and it funds various sectors including education; Kapor Capital is committed to diversity and invests in ClassDojo in the K-12 space. Social Capital, another Californian firm founded in 2011, invests in a number of sectors and has six different investments in the edtech sector, including Brilliant.
VCs based on number of investments shared with their co-investors.
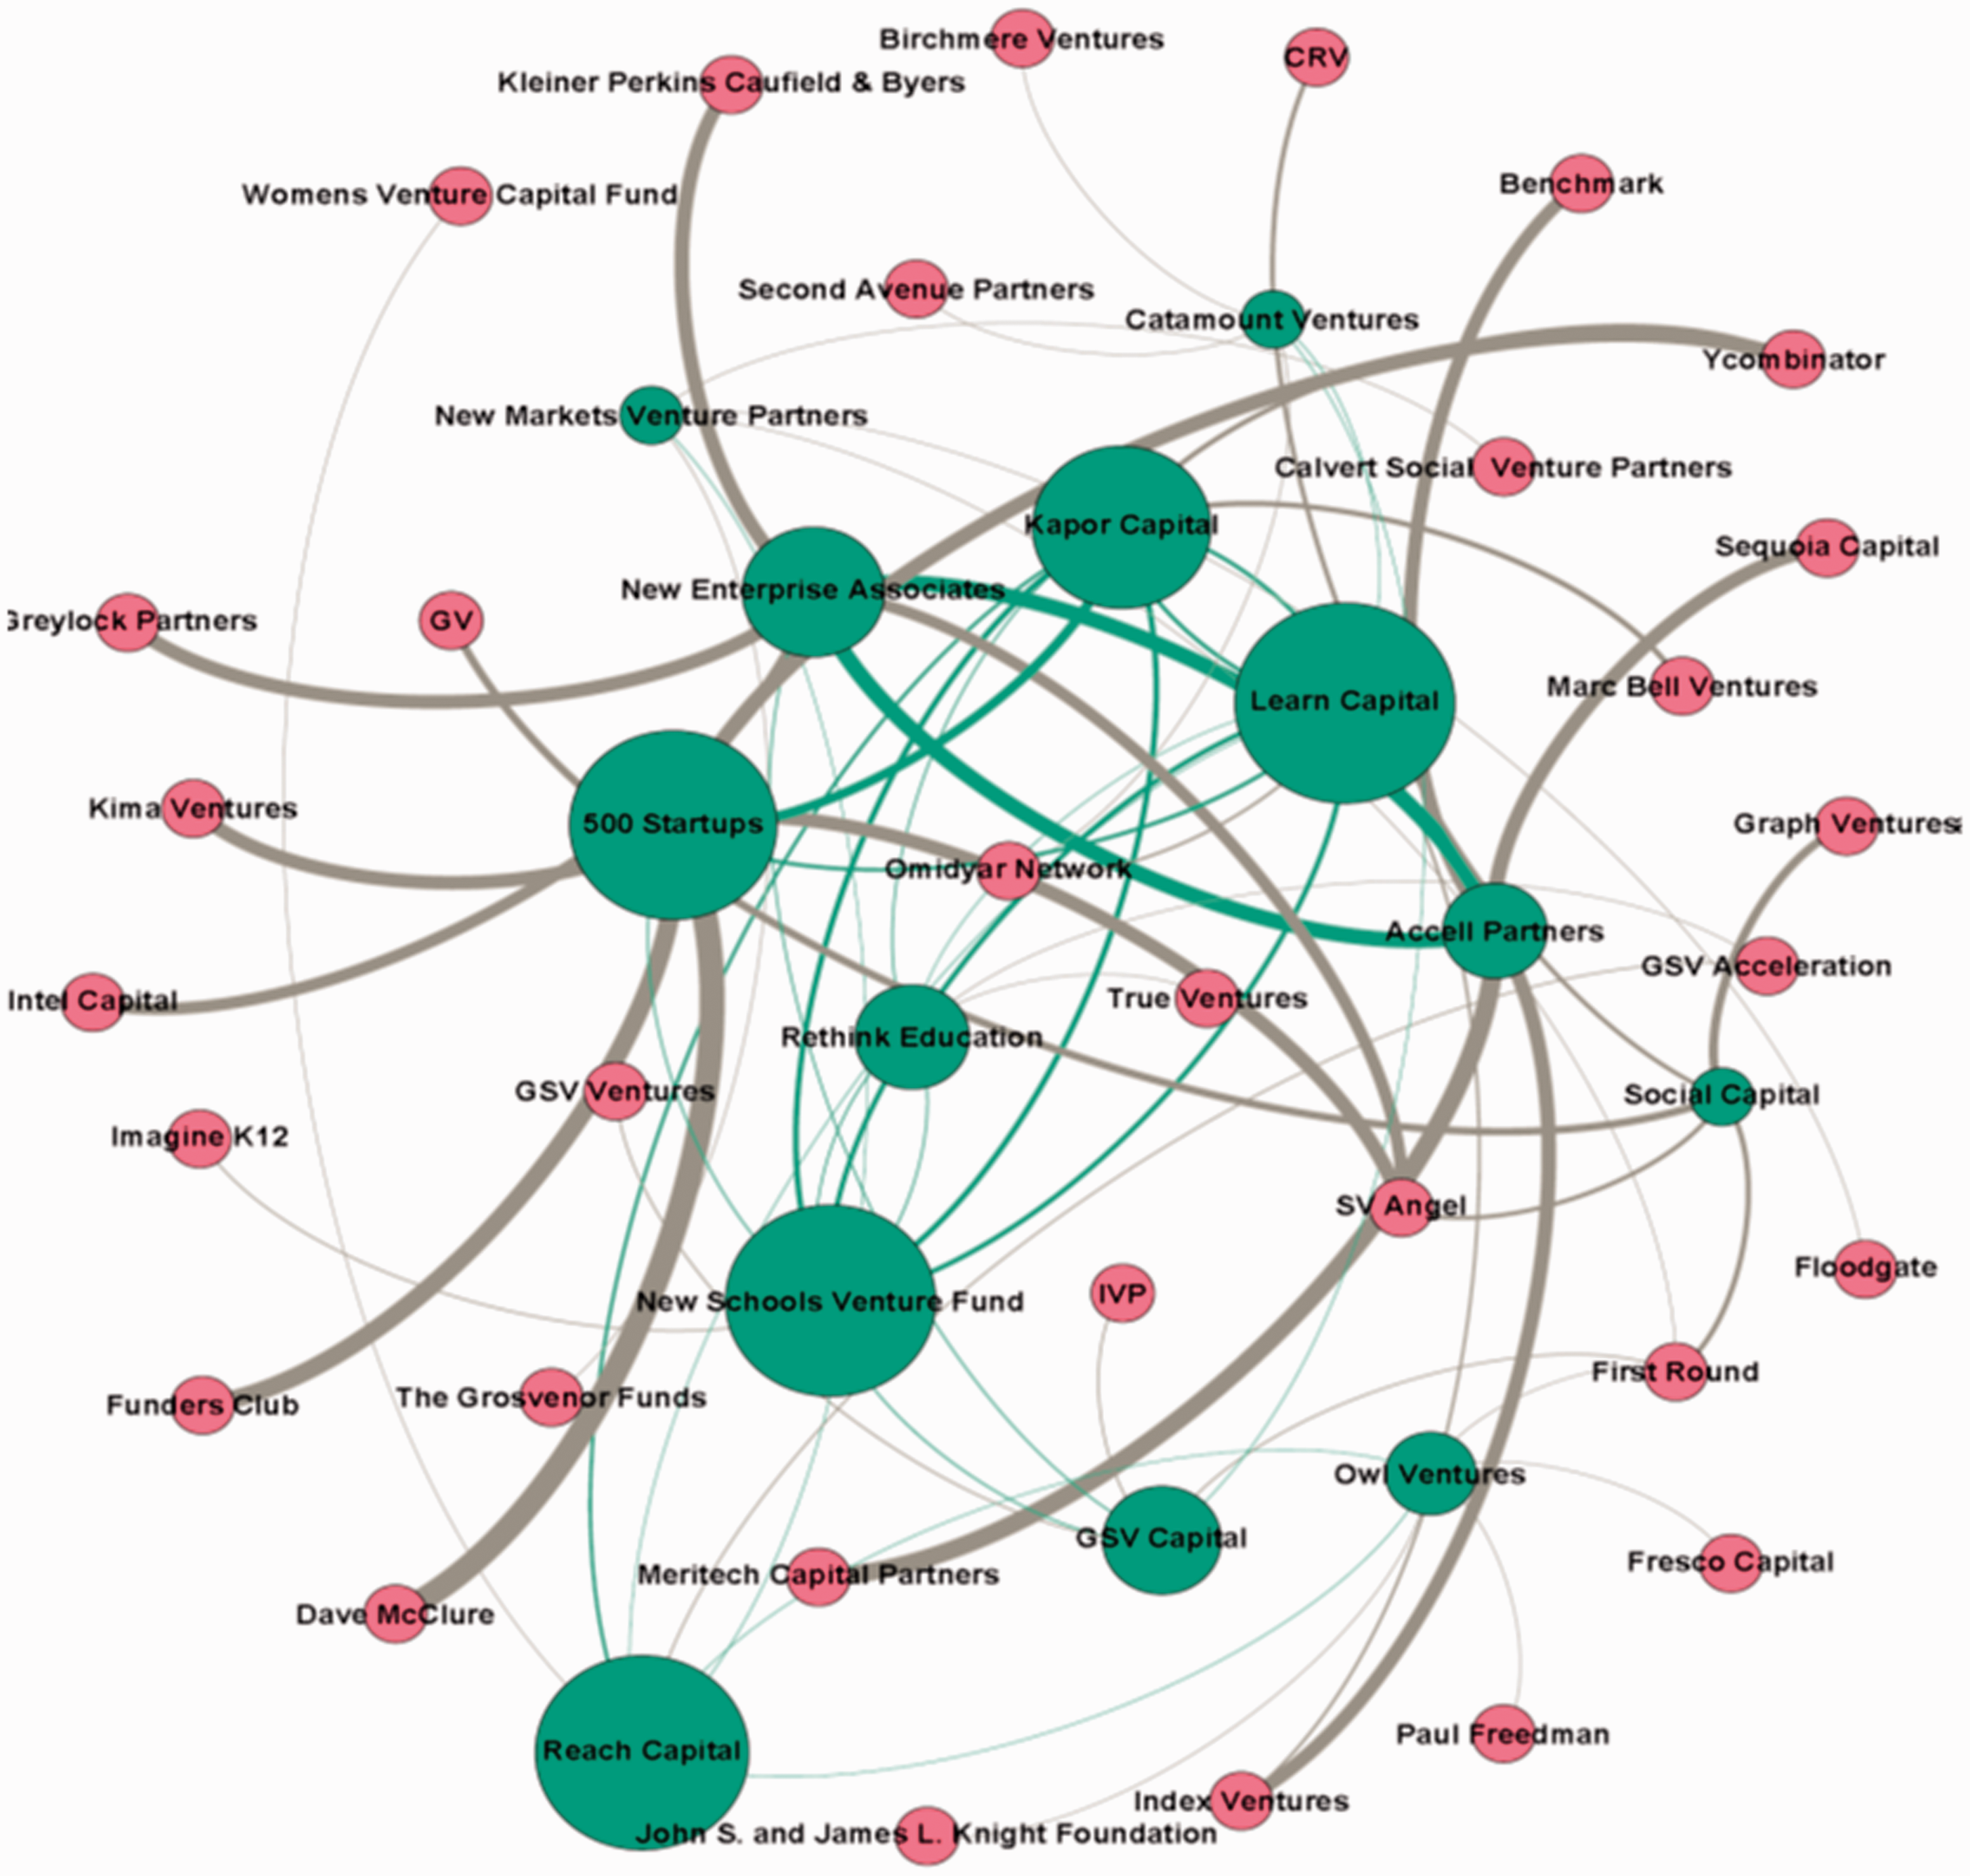
The top players, who are potential brokers or intermediaries in the network based on their co-investor relationships, are those identified earlier as the prime VCs: Learn Capital, Kapor Capital, 500 Startups, the New Schools Venture Fund, and Reach Capital (see Figure 6). Accel Partners, 500 Startups, Social Capital, and New Enterprise Associates, who have a higher number of co-investors and shared investments (Figure 5), have a lower brokerage level (Figure 6). This could suggest that, given their emphasis on other sectors besides education, these latter companies are not gatekeepers of the network with regard to an interest in education. Instead, companies that focus only on edtech sector investments (Learn Capital, Reach Capital, and the New School Ventures Fund) may demonstrate a stronger intermediary role in the edtech political economy than the companies who have several other sub-categories of investments. Additionally, a number of the top brokers in this network fall into the same community through a common “community detection method” in network analysis (Blondel et al., 2008). These include Kapor Capital, Learn Capital, 500 Startups, and the New Schools Venture Fund. It shows that brokers are also in relationships (co-investments) with other brokers and are, ultimately, the most central actors in the investment landscape.
Communities formed by VC and co-investor relations (by node color) and bridging roles (node size).
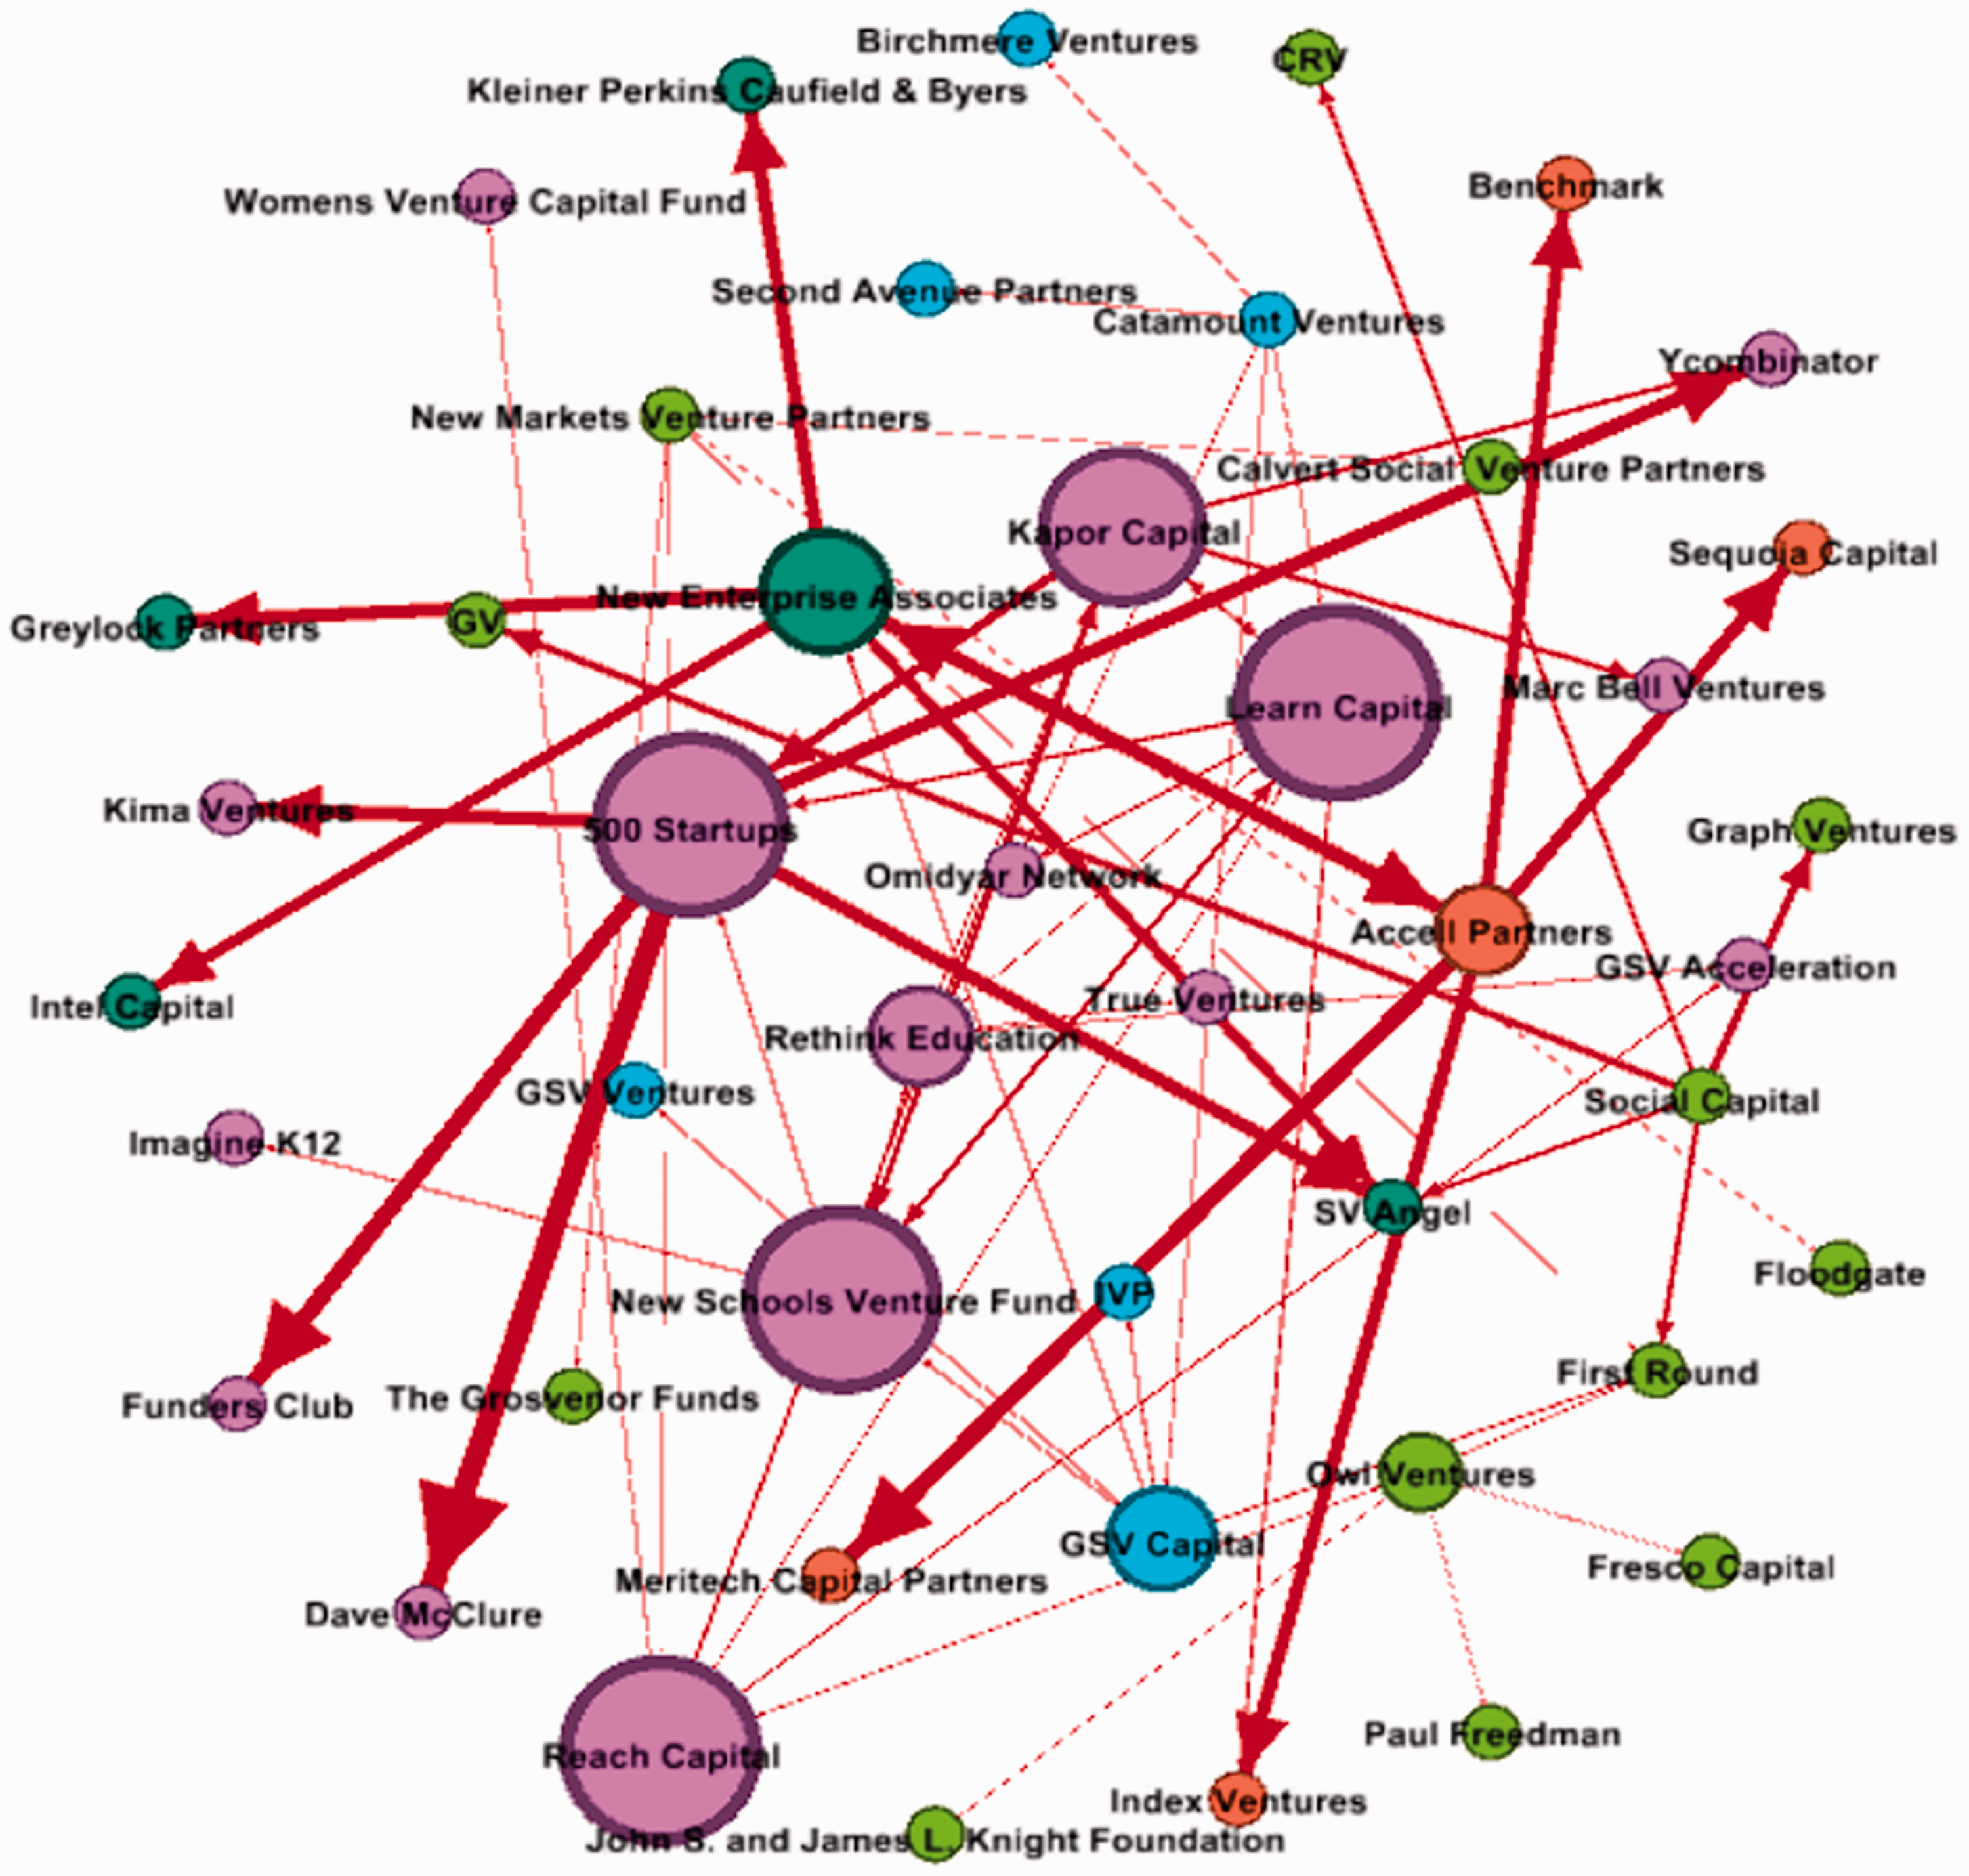
In Figure 7, we measured the “reliance” of ties to other ties in the network (how actors connect to other actors through their own strong connections; or eigenvector centrality) in order to determine their level of influence compared to the rest of the nodes in the network (Prell, 2012). Some actors outside the top 13 VCs, such as Y Combinator, Imagine K12, FundersClub, Dave McClure, Index Ventures, SV Angel, and the Omidyar Network, stand out more with this metric (see Figure 7) because they are connected to the larger investor firms who have greater influence due to their large edtech portfolio. Understanding their level of influence is particularly important because of their association with an actor who has a greater number of ties (high degree centrality, i.e. 500 Startups). We can hypothesize that the most influential firms tend to associate with other actors who have a large number of investments. Hence, it may be crucial to track those investors that co-invest with larger investors or investors who have a larger number of investments and/or co-investors.
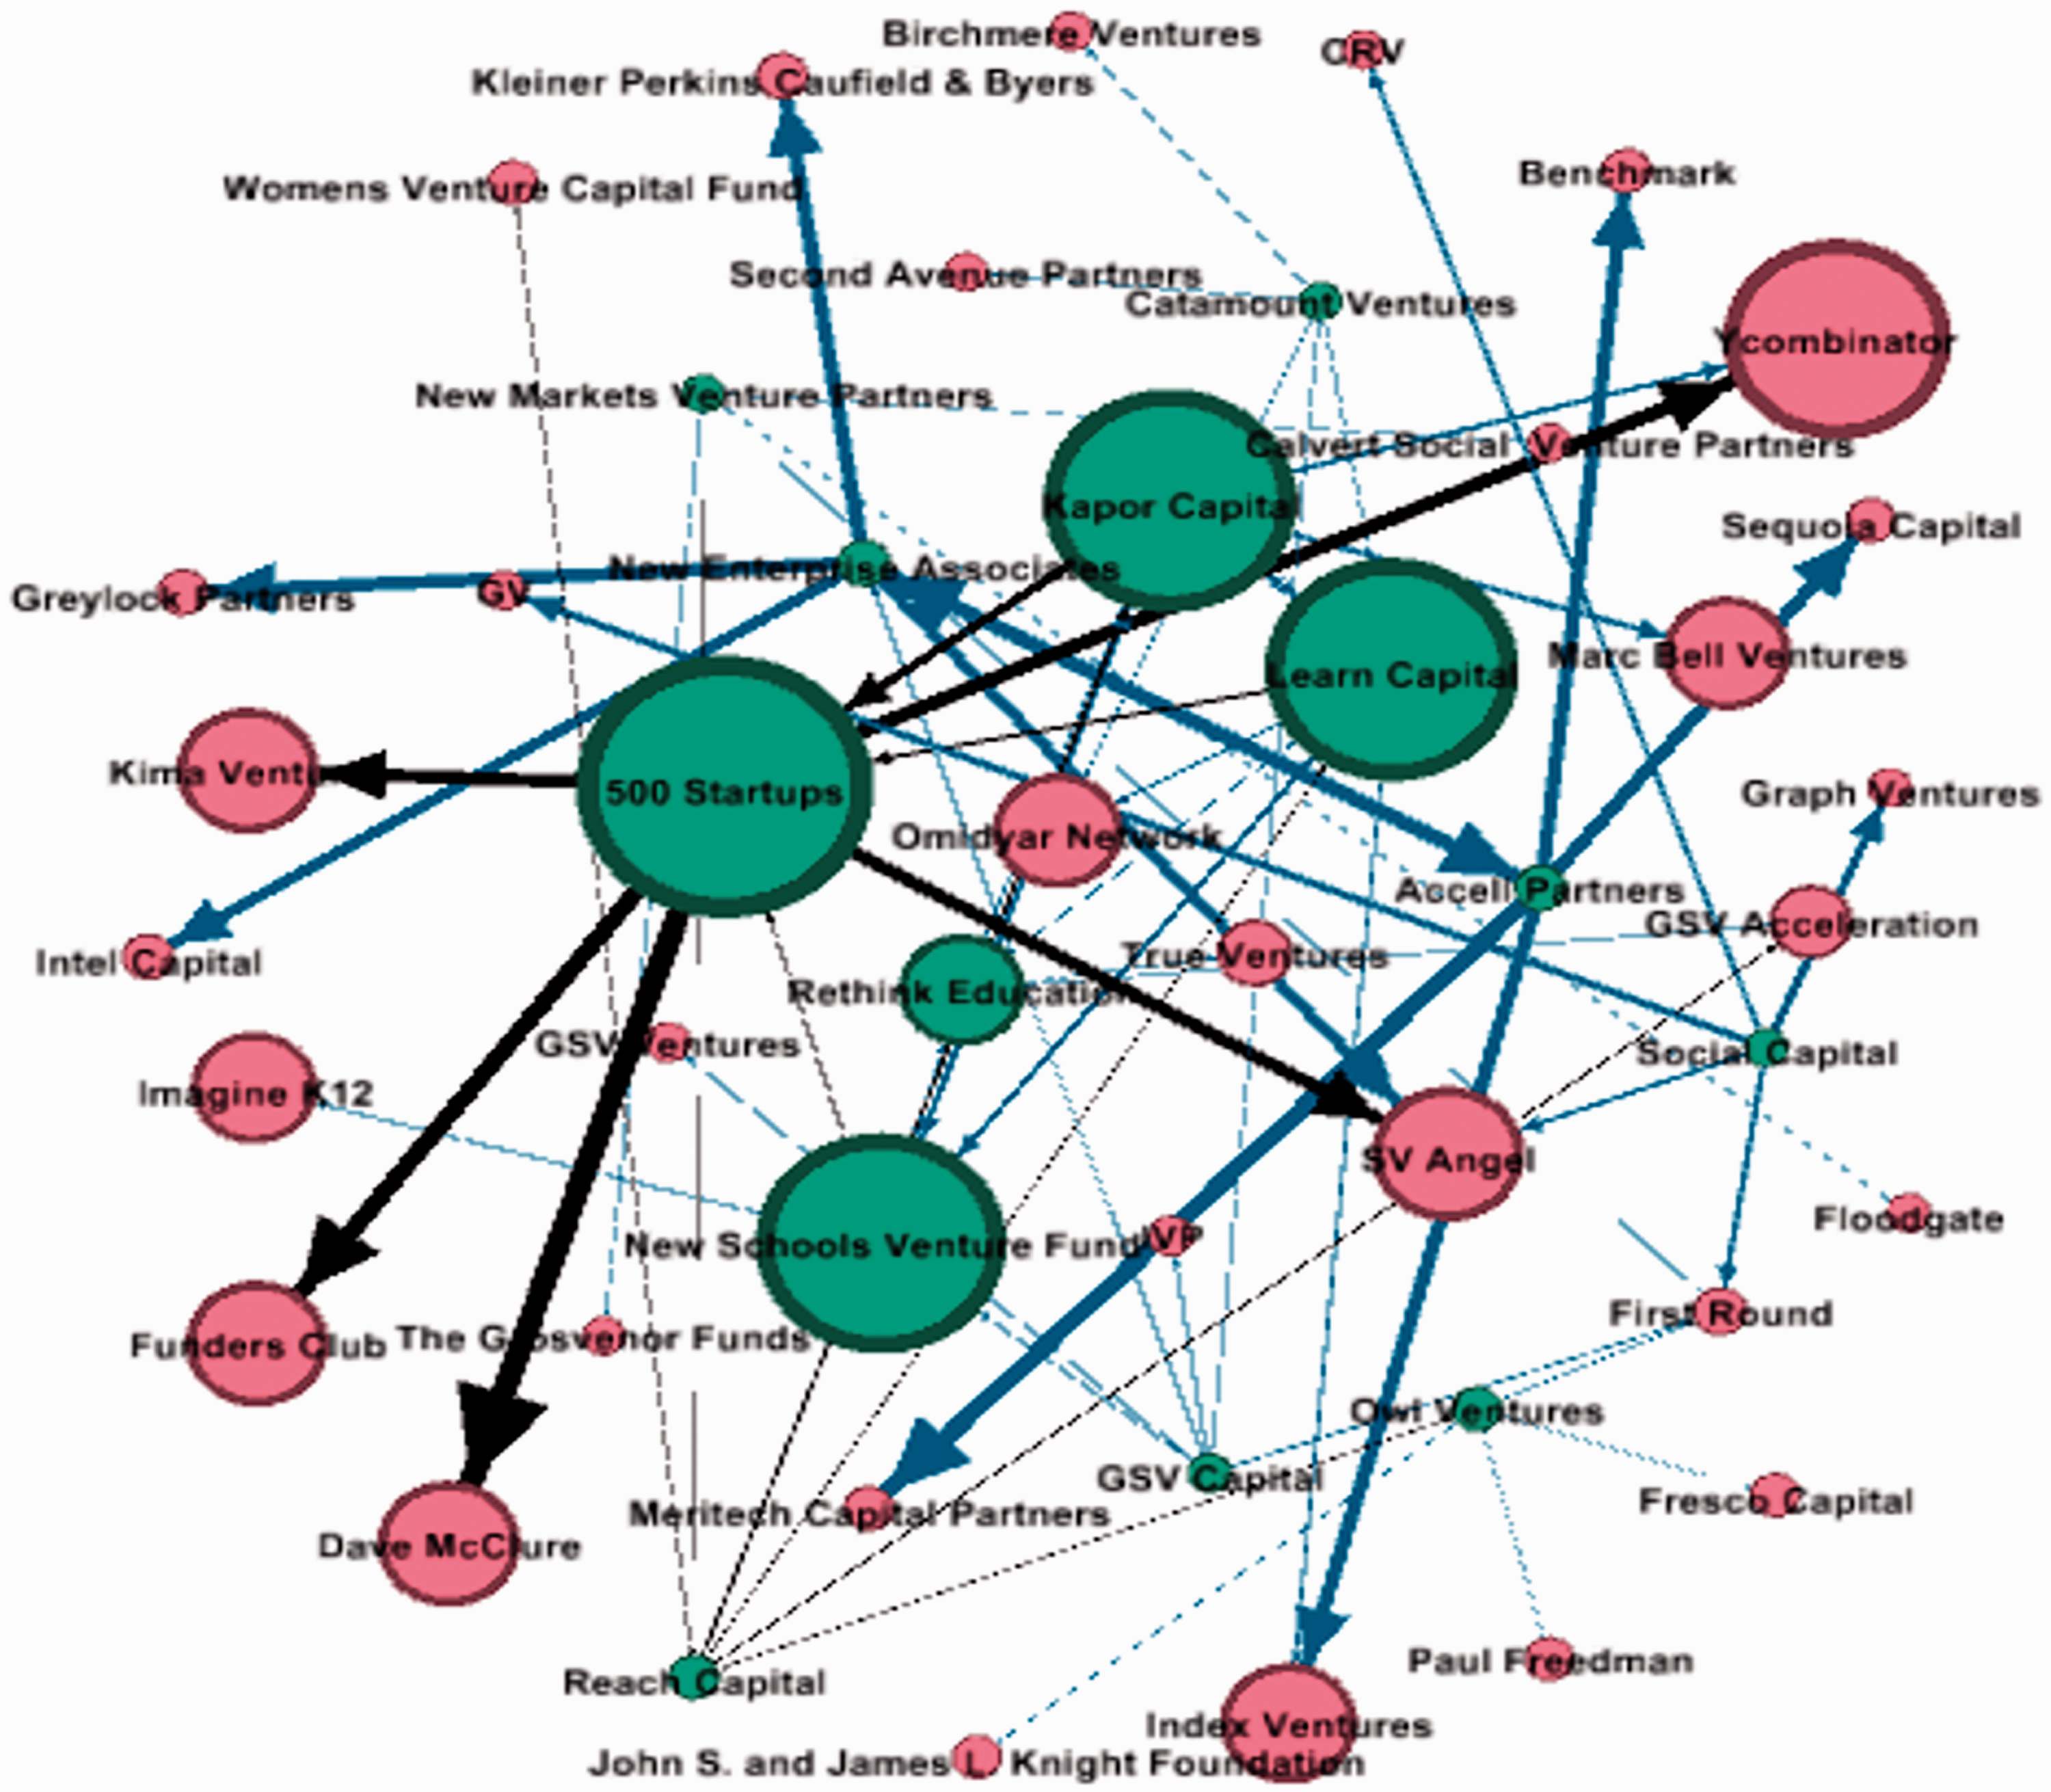
The top 13 VCs (green node color) and co-Investor (pink node color); with most influential ties (by node size).
Discussion and conclusion
As edtech has become more important in learning environments at all levels, attention has begun to focus on the political economy underpinning its growth and reach, particularly at the K-12 level. Edtech represents, as we discuss above, the latest iteration of the decades-long trend in privatizing and commercializing the fundamental components of K-12 education. Policy initiatives in the USA, such as the Every Student Succeeds Act (2015), which have generated funding and support for edtech initiatives, mirror earlier policy initiatives, such as the charter school movement (1980s), No Child Left Behind (2001), and Race to the Top (2010), that instilled market values into and introduced private sector influences on K-12 education (Convertino et al., 2017). Given the political support for edtech and the policy issues surrounding its effectiveness, as well as broader implications for privacy and social equity, it is important to examine the dynamics of and influences on the edtech industry itself. Understanding the actors in this sector is critical both for tracking overall trends in the political economy of education but also for identifying the relationships in edtech’s evolution and reach. To date, the focus has been on the large companies moving into this space, particularly Google, Facebook, Pearson, and Microsoft, as well as on wealthy philanthropists and foundations, such as Bill and Melinda Gates and the Chan Zuckerberg Initiative. However, these big players are not the only companies interested and active in edtech and our research began to explore the dynamics of other investors and their edtech portfolios. Specifically, we identified the top edtech companies and their investors at the K-12 level, and examined the influence of the top 13 VCs and the patterns that are emerging in this area.
Our study adopted a systematic approach for exploring the emerging funding relationships in the edtech environment. First, we reviewed the trade press and databases in the edtech sector to identify the top 13 VCs in the edtech arena and then researched more fully the portfolios of the edtech companies in which they were investing as well as their co-investors in these companies. We then used social network analysis to reveal the relationships between the edtech companies and their top investors and those between the investors themselves to reveal the outlines of the network that is shaping the evolving edtech sector. Figures 1–7 show the structures of these VCs and their edtech relationships based on their positioning in this boundary-limited network of actors. The figures map the centrality of the investors and edtech companies in relation to the other top actors in the edtech industry. This network analysis demonstrates the different ways in which investors show influence and power within the network based on their investments in edtech and indicates with whom they co-invest. Ultimately, this reveals the dynamics of funding relationships.
A network perspective can help identify important considerations for potential policy implications associated with the growing edtech industry. Scholars of education policy have recognized that network analysis is useful in revealing the components and features of relationships and the dynamics of processes for formulating and implementing education policy (Hogan et al., 2016; Lubienski, 2018). At the time of this research, very little scholarship incorporated a network study of the top players in the edtech industry, particularly in the K-12 space. As we note above, the K-12 space is important from an industry and investor perspective, given that education at this level is mandatory and viewed as critical to the future workforce, thus generating a steady demand for products and services, especially more innovative and engaging ones. Our research demonstrates that top VCs funding these edtech programs in K-12 schools play a vital role in determining which types of companies are favored and funded, and what types of programs are implemented and, therefore, need to be considered in the future assessment of the impact of edtech in the classroom.
There are important caveats to consider in this exploratory analysis. Because of potential data limitations, the current analysis shows a vague network boundary (data limitation of only the top 13 VCs). For that reason, no clear quantitative/inferential assessments and comparisons will be evident. This boundary specification problem and “missing-ness of data” is commonplace in network studies but, based on a qualitative review of literature and databases, we limited the actors (nodes) and connections to these investors and their portfolios, with the focus on the top 13 VCs in edtech. Another limitation is evident in the second dataset, which depicted only the top 5 co-investors partnering with the top 13 VCs. The network dynamic could be different with the addition of more nodes. Adding and deleting nodes can change some of the results of the descriptive analysis (Borgatti et al., 2013), for example, the eigenvector centrality metric could highlight more actors with greater importance based on their connection to other more important actors. Expanding the networks with more nodes and links (more investors and edtech companies) could, therefore, prove to be of more value in any future research. Last, but not least, the VC industry is always updating and changing with start-ups and closeouts of edtech companies, which could influence the “real time” level of influence or power of an edtech VC as well as of the edtech company itself. As noted, the data used in our analysis are from February 2017. Changes have likely occurred since then, but our analysis provides a baseline from which it is possible to identify how the network evolves over time.
It is evident from the content analysis of the data, as well as from the network analysis results, that investors tend to co-invest with the same top VCs. For the purposes of understanding the impact and policies of edtech companies, it will be crucial to track those investors that co-invest with larger investors or investors who have a larger number of investments and/or co-investors. Our analysis demonstrates that there are key players who serve as brokers keeping the network connected, producing what is commonly known as a “weak tie” or bridging effect (Granovetter, 1973). Further research may be necessary to assess why investors fund certain companies from an economic and political point of view. For example, there is a need for more analysis of companies such as Kapor Capital and the New Schools Venture Fund, which appear to place greater consideration on education inequalities when making decisions as to which edtech companies to fund.
The preliminary steps have been taken to illustrate the network structure and dynamics of top firms in the edtech industry. However, more can be done in the future at both a descriptive and inferential level to highlight the embeddedness of influential firms and how they influence and motivate the edtech industry. For this initial exploratory analysis, we investigated the mere existence of a tie between investors, and the co-investment relationship among VCs. Our analysis suggests that future research on four aspects of funding relationships may offer important insights on the business of edtech. First, examining the dollar value ascribed to edtech companies will enable a more complete picture to be formed of the influence of particular investors on an edtech company as well as the dependence of edtech companies on VC funding. Second, future research would be valuable in highlighting some of the cases in more detail and further investigating the political and economic motivations of the top and central players in the network. This could be conducted from the perspective of either specific investors or specific edtech companies and would entail more qualitative research, possibly using a comparative case perspective. Third, research investigating whether or not, how, and why edtech investors and companies attend to concerns with regard to diversity and the need for social inclusion in developing K-12 edtech products and applications would be valuable from a broader social and policy perspective. Finally, research into how the activities of edtech investors and companies align with government funding for edtech and the funding decisions of edtech philanthropists and larger companies would add to a fuller understanding of the motivations of edtech investors and companies in the broader political economy of K-12 education. With the escalating growth and influence of the edtech industry (Shulman, 2018), monitoring and tracking its trends, start-ups and investment flows will continue to be vital for years to come.
Our analysis has started to unveil the complex political economy of edtech, but future research must also address the larger philosophical, ethical, and policy issues with regard to the use of edtech at the K-12 level. Important questions in relation to how the modern educational landscape is developing and what implications this has on student learning, the role of teachers, and the values underlying these changes are critically important and should be explored further (Aviram and Dotan, 2009; Hood, 2018; Tesar, 2016a, 2016b, 2016c). The edtech industry is likely to continue to grow and be influential at the K-12 level but educational policy that addresses the larger philosophical and ethical issues can affect the direction and breadth of that growth. Without positive policy direction, as Amichai-Hamburger (2009: 604) notes, a market-driven system will create false priorities, skew investment in short-term educational applications, lack real direction, and drain the education sector of other important investments.
Appendix A: Details on social network data and analysis
Figures 2–7 show all the network graphs from the network analysis for the two separate datasets. Figure 2 shows the VC and edtech portfolio network, based on the in-degree centrality metric of both size and color of the nodes. In-degree centrality shows a type of power, significance, or influence based on the number of ties received. The larger the node in the graph, the larger the number of ties. Thus, the top edtech companies are identified based on their number of investors (with the highest in-degree centrality). The nodes with the same color have the same number of ties received.
Figure 3 shows the community detection, with the color of node displaying the modularity class (division) and the size demonstrating a key metric of betweenness centrality. Betweenness centrality refers to the extent to which an actor is located between other actors and no others are located between those actors (Prell, 2012). It implies power as a gatekeeper or intermediary in the network. The community detection reveals the divisions within the network, detecting “communities” and “sub-communities.” Nodes are shown here as partitioned based on the Louvain method in Gephi, which measures the strength of the division and shows the clustering into hierarchical communities (Blondel, 2008). In Figure 3, with a modularity score at 0.727, higher than 0.4 based on this algorithm, the partition is determined to be strong according to this method (Blondel, 2008).
In Figure 4, a “blocks and cutpoints” analysis, completed in Netdraw and UCINET, shows the “cutpoints” of the VC and edtech network. The nodes are sized by betweenness centrality and the node color is based on UCINET’s “cutpoints” analysis. The nodes in red are the “cutpoints,” which can be interpreted as potential “brokers,” further emphasizing the concept of betweenness centrality. If the red nodes are removed, the entire network will be disconnected. Hence, these can be interpreted as the powerful and influential actors within the network, binding the nodes.
Figure 5 illustrates the weighted out-degree centrality. The graph shows the centrality metric in both the color and the node size. It is simply the degree (number of contacts), in addition to the weight of relationship they have with each investor in their contacts. However, the node color separates the out-degree and the in-degree nodes. This could be because the degree is simply only “five” when not weighted, as the top five co-investors were chosen for each prime VC. The centrality measure is generally useful for valued and weighted networks like this one, because of the values in edge weights (number of companies they co-invest in with their alters (connecting nodes and their co-investors)).
Figure 6 shows the community detection of the VCs and their co-investor network. The modularity here is strong, at 0.567, with a score higher than 0.4 (the rule of thumb), and with a generally high number of communities (five), showing breadth and heterogeneity in the network. Similar to the first set of graphs, modularity helps show which nodes they connect to most strongly and the strength of that division to verify the density level. The nodes in the same color in the visualization are in the same groups. For example, top firms like 500 Startups, Kapor Capital, Learn Capital, New Schools Venture Fund, and Reach Capital also include Kima Venture, Rethink Education, Omidyar Network, True Ventures, GSV Acceleration, Imagine K-12, Funders Club, Dave McClure, Mac Ball Ventures, Women Capital Fund, and Y-combinator in their group. Generally, this helps to visualize the different groups in the data, partitioning the investor partnerships and demonstrating potential interconnections and greater flow of activity within that funding relationship. Contrary to the previous graphs, it did not separate based on individual portfolios, suggesting more traffic is evident in this network. In sum, based on modularity class partitioning, there is great heterogeneity (a diverse group of actors and breadth) in this network.
Finally, Figure 7 demonstrates the critical network metric of eigenvector centrality (size of node) and out-degree centrality (as color of node). Eigenvector centrality measures the “reliance” of ties to other ties in the network. Eigenvector centrality measures the nodes that connect to those with high degree centrality, hence an indicator of their level of influence compared to the rest of the nodes in the network. The actors with the same color have the same number of contacts. As Figure 7 illustrates, Eigenvector centrality is an influence measure and demonstrates connectivity to an actor with a high degree of centrality in order to gain an advantage from the association. This illustration helps differentiate the nodes by color and size based on their number of contacts (color) and the nodes with association with the more popular contacts (size).
Footnotes
Declaration of conflicting interests
The author(s) declared no potential conflicts of interest with respect to the research, authorship, and/or publication of this article.
Funding
The author(s) disclosed receipt of the following financial support for the research, authorship, and/or publication of this article: The research for this article was funded by The eQuality Project Partnership Grant from the Social Science and Humanities Research Council of Canada.