
Abstract
In Arizona, individuals can receive a tax credit of up to US$200 per individual taxpayer for donations to public schools. We analyze public school tax credit donations to charter schools and document inequalities in the distribution of donations associated with the percentages of more advantaged students charter schools serve. The differences in donations may be partially attributable to parents’ ability to invest in their children and the extent to which schools actively solicit donations. These dynamics suggest a Matthew effect of cumulative advantage among Arizona’s charter schools. We discuss our findings in relation to a legislative proposal to change the public school tax credit program, the current political environment in Arizona, and in the context of a more transformative social change.
Introduction
In 1997, the Arizona state legislature passed House Bill (HB) 2074, which created a unique set of policies that allow taxpayers to make contributions to public and private schools and receive tax credits for their donations (Arizona Revised Statutes (ARS) § 43-1089; Wilson, 2000). In its earliest iterations, HB 2074 created a policy mechanism aimed at allowing families to donate to private schools. As the bill moved through the legislative process, Republican lawmakers added a separate public school tax credit to the legislation to appease Democratic legislators who were opposed to a private school tax credit (Melendez, 2009). This latter credit, the Credit for Contributions Made or Fees Paid to Public Schools, hereafter the public school tax credit, is the focus of our analysis. For tax year 2018, the public school tax credit donation limits were US$200 per individual taxpayer or US$400 for married couples filing jointly. The public school sector in Arizona includes traditional public schools operated by school districts and charter schools (ARS § 15-101; see also ARS § 15-113). Public schools that receive tax credit donations are restricted in how they spend these funds. State law stipulates that public schools can only use the revenue from tax credit donations to support extracurricular or character education programs (ARS § 43-1089).
Arizona’s public school tax credit program is one of a set of neoliberal policies aimed at privatizing education in Arizona (Powers, 2009; Klees, 2017). These include interdistrict choice, charter schools, tax credits for donations to private school tuition organizations (STOs), and, most recently, an empowerment scholarship program which allows students to opt out of their public schools and use the funds that would be distributed to the public schools they attended to purchase the educational services of their choice. Public school tax credit donations provide a way for taxpayers to allocate funds to specific schools that would otherwise be collected as general state revenue (Wilson, 2000). Two additional tax credits allow taxpayers to claim up to US$2134 in tax credits for donations to STOs, which provide scholarships to private school students. 1 All of these tax credit policies are well-established—the original public and private school tax credits are almost two decades old—and utilized by an increasing number of taxpayers (Arizona Department of Revenue, 2018).
Public school tax credits tend to be more politically palatable than a traditional, large-scale voucher program (Huerta and d’Entremont, 2007) or tax-credit-supported scholarships for students to attend private schools (Welner, 2008). However, some researchers have questioned whether public school tax credit programs support a broad range of schools, or if they instead provide tax relief to more advantaged families and subsidies for the schools their children attend (Huerta and d’Entremont, 2007). Moses (2000) argued that tax credit programs do not address the inability of families in poverty to participate in them. For example, if individuals do not pay taxes, or have limited earnings or savings, they may not have the means to contribute money directly to schools.
While a substantial amount of research was conducted on Arizona’s school tax credit policies in their early stages of implementation (Keegan, 2001; Moses, 2000; Welner, 2000; Wilson, 2000, 2002), the ongoing expansion of school tax credit programs alongside school choice in Arizona has stimulated renewed interest in the former (Faller, 2015; Harris, 2013). To date, few scholarly studies have documented such contributions or have addressed the relationship between the tax credit donations a public school receives and school characteristics. Because Arizona’s public school tax credit is essentially a tax cut that, although modest, is likely to benefit more affluent families, it is important to document how these funds are distributed across schools. We analyze public school tax credit donations to charter schools for the 2012 tax year. As we explain in the following section, charter schools comprise a substantial portion of the public school sector in Arizona. Our central research questions are: How do public school tax credit donations vary across charter schools? What is the relationship between school characteristics and the public school tax credit donations a charter school receives?
In the sections that follow, we provide an overview of charter schools within US and Arizona contexts, and the policy and research context for education tax credits. We then describe our conceptual framework—the Matthew effect of cumulative advantage. There are two components of the analysis that follows: (a) a descriptive and multivariate analysis of public school tax credit donations; and (b) an analysis of a sample of charter school websites aimed at understanding how schools solicit donations. We conclude with a discussion of the policy implications of our analysis.
Arizona’s charter schools: Blurring the line between the public and private sectors
In the USA, charter schools are a neoliberal education reform that combine “a market-style consumer sovereignty idea with notions of personal liberty” (Minow, 2010: 110; see also Ball, 2013; Whitty, 1997). Established by contracts between public agencies and charter school organizers, charter schools are exempt from some of the state regulations that school districts operating traditional public schools must comply with. The theory driving charter school reform is that in exchange for increased autonomy, charter school organizers agree to be held accountable for the educational outcomes outlined in their schools’ charters. However, few charter schools have been closed because of academic performance (Osborne, 2012). Charter school laws are passed by individual US states and vary considerably . In 2015–2016, Arizona had the second highest percentage of public school children attending charter schools after Washington DC (US Department of Education, 2018). Approximately 16% of all public-school students in Arizona were enrolled in charter schools (US Department of Education, 2018), and one third of the state’s public schools were charters (Arizona Charter Schools Association, 2015).
While in some states charter schools are more tightly regulated, Arizona is one of the five US states with the fewest restrictions on charter school operations (Zgainer and Kerwin, 2015). For example, in Arizona, charter schools are not subject to state teacher certification requirements, but are required to participate in the state’s accountability program, which includes annual school report cards and administering annual state assessments. Like traditional public schools, charter schools receive annual performance ratings by the state. Yet, charter schools can be established by for-profit or non-profit corporations. Many, although not all, charter schools are operated by educational management organizations. As a result, some federal agencies and courts have determined that this latter group of charter schools are private entities for employment purposes. 2 While charter schools blur the line between the public and private sectors, charter schools are treated as public schools by the state of Arizona in many policy areas, including school funding and tax credit policies.
Arizona supports charter schools using the school finance model used to allocate state support to school districts for traditional public schools, although the components of the funding formulas used to allocate monies to school districts and charter schools differ (Arizona State Senate, 2016; see also Huppenthal, 2014). Charter schools and school districts are provided the same amount of base-support-level funds, which includes weights for specific categories of students such as English language learners and students with disabilities (Arizona State Senate, 2016). Unlike school districts, charter schools cannot raise revenue from property taxes through budget overrides and bonds and do not receive facilities funding from the state, both of which are built into the school finance formula for the former. To compensate, the state provides charter schools with state aid in the form of “charter school additional assistance” or additional per student funding for capital and transportation that is intended to match the funding provided to school districts for capital funds (Arizona State Senate, 2016). Finally, the Arizona Department of Revenue considers charter schools to be public schools for tax credit purposes (Arizona Department of Revenue, 2017). Taxpayers who wish to claim the public school tax credit for donations to charter schools report them on a form used for donations to charter schools and traditional public schools (Arizona Form 322), and are required to report the name of the school(s) and the amount donated. Both traditional public and charter schools are subject to the restrictions on the use of tax credit donations described above, and the same reporting requirements.
All public schools in Arizona have experienced severe funding cuts in the years since the recession (e.g. Santos and Rich, 2015). Charter and traditional public schools have responded to Arizona’s funding shortfalls by encouraging families to donate to the schools their children attend through the public school tax credit program. We analyze how public school tax credits are distributed across charter schools which, as we detail in the following section, has received little attention from researchers. An early study addressed Arizona’s tax credit program during its first years of implementation (Wilson, 2002) when charter school reform was also at a relatively early stage in its development, while a more recent analysis of the public school tax credit program focused on unified school districts (Melendez, 2009). Given the lack of scholarship on tax credit programs, it is important to better understand how these funds are distributed to charter schools.
The policy and research contexts for education tax credits
Tax credits allow eligible taxpayers to reduce the amount of money that they owe on their taxes dollar for dollar—in this case, Arizona state income taxes. In contrast, a tax deduction reduces taxable income, so the value of a deduction for an individual taxpayer is tied to her marginal tax rate (Tax Policy Center, 2010). 3 Some tax credits are means-tested; taxpayers with incomes that are higher than a specific threshold are not eligible for such credits. Perhaps the most well-known of these is the Earned Income Tax Credit (EITC), a federal tax program which is targeted toward low-income individuals with taxable earnings, and provides greater benefits for individuals with families (Dickert-Conlin et al., 2005). Tax credits also vary based on whether they are refundable or non-refundable. When a tax credit is refundable, if the tax credit reduces an individual’s tax liability to below zero, she will be paid the excess funds. Individuals whose tax liabilities are zero or lower do not benefit from a non-refundable tax credit because they are not eligible to receive any funds that exceed the tax liability. Examples of federal non-refundable tax credits include the Child and Dependent Care Credit and the Lifetime Learning Credit.
Arizona’s public school tax credit is a non-refundable tax credit, although taxpayers can carry unused amounts for up to five years (Arizona Department of Revenue, 2017). Taxpayers receive the credit for donations to schools. All taxpayers are eligible to claim the credit regardless of income or if they have children attending the recipient school. Parents or guardians may receive the credit for fees they pay for their children to participate in extracurricular activities or character education programs. If taxpayers donate more than US$200 individually or US$400 jointly to a public school, they can claim the additional contributions as itemized deductions if they do not benefit a specific child. In March 2015, the Arizona legislature expanded the program to allow parents to use the public school tax credit to deduct fees for standardized testing, career/technical certification assessments, and standardized test preparation.
Tax credit donations must be paid directly to the school—contributions to parent–teacher organizations or school foundations are not eligible for the credit. If a school district establishes a central fund to collect contributions to schools, it must account for donations to specific schools and cannot transfer funds between schools. Most of the research on tax credit programs focuses on federal programs, and the EITC has received the most scholarly attention. For example, Dickert-Conlin et al. (2005) conducted one of the few analyses of how the benefits from tax credit programs are distributed. They found that taxpayers in the higher-income brackets received most of the benefits from non-refundable federal tax credits such as the child care credit and the education credit.
Few other states offer similar education tax credits. 4 As we detail in the following, Arizona’s public school tax credit is unique because: (a) it is a tax credit and not a deduction; (b) it is available to any taxpayer and not just families with school-age children or families attending specific schools; (c) it provides a full credit on the full amount of the donation up to US$400 for married couples; and (d) it is not means-tested or limited to specific groups of students. Minnesota provides parents with a tax credit for up to 75% of expenses incurred by parents, which can include fees for extracurricular activities and other school-based experiences but does not require direct donations to schools (Minnesota Department of Revenue, 2013). Eligibility for Minnesota’s tax credit is income-restricted. For example, the income limit for families with two children to claim the credit is US$37,500. Minnesota also allows all families regardless of income to subtract educational expenses up to US$2500 per child from their income on their state taxes, which amounts to a tax deduction.
In Louisiana, families can deduct 50% of qualified expenses per dependent child attending a public school on their state taxes up to a maximum deduction of US$5000 for purchases including textbooks, uniforms, and school supplies (Louisiana Department of Revenue, 2014). Iowa provides families with a tax credit for 25% of their education expenses with a limit of US$250 per child. Illinois also allows deductions of 25% of educational expenses with a maximum deduction of US$500, but families are only eligible for the deduction after they have spent US$250 in school expenses. In 2013, the Alabama legislature passed a law creating a credit which allows families whose children attend or are assigned to attend a public school that has been designated as failing to claim up to 80% of the cost of transferring to another public school or the amount of tuition and fees for an accredited private school on their income taxes (Alabama Policy Institute, 2017). In January 2018, the Alabama Department of Education designated 75 public schools as failing; families whose children attended those schools were eligible for the tax credit (Crain, 2018).
Few researchers have addressed the distribution of school tax credit donations in Arizona or other states. An early analysis of the Arizona’s school tax credit program conducted after its first year of implementation indicated that approximately 75% of tax credits (public or private) went to individual donors with incomes of US$50,000 or more (Wilson, 2000). To put this figure in perspective, the median income in Arizona in 1999 was US$40,000 (US Census Bureau, 2000). More recently, Melendez (2009) focused on public school tax credit donations to unified public school districts between 2005 and 2007, and found that as the number of students who received free and reduced-price lunch increased, districts’ per-pupil revenue from the tax credit program decreased. These findings are consistent with national studies of the tax code. For example, Weinberg (1987) found that tax expenditures or provisions in the federal tax code that collect and distribute an equal amount of funds tend to disproportionately benefit the highest income earners. In contrast, Murray’s (2010) analysis of Arizona’s private school tax credit program suggested that the median family income of private school tuition scholarship recipients was approximately US$5000 lower than the state median income. However, Murray’s (2010) analysis compared the median income of scholarship recipients with the median income of all families rather than the median income of families with children under the age of 18. The latter figure is lower, 5 which raises questions about Murray’s claim that low-income families were substantially benefitting from the private school tax credit program. If the more conservative estimate of median family income for families with children under 18 is used for comparison, the median family income of scholarship recipients reported by Murray was above the state median income.
A few studies have explored the politics and policy implications of tax credit donations (e.g. Huerta and d’Entremont, 2007). Over time, the cost of tax credit programs will reduce total tax revenues, which has implications for state education funding (Huerta and d’Entremont, 2007). Likewise, a small number of studies have explored the implications of tax credits and variations of tax credit programs on school competition and regulatory burden (e.g. Buddin, 2012; Coulson, 2011; Figlio and Hart, 2014). These studies, although important for understanding the broader impact of education tax credit programs on the provision of public education, do not address the distribution of public school tax credit donations among charter schools.
The Matthew effect of cumulative advantage
To frame our analysis of the distribution of Arizona’s public school tax credit, we draw upon Robert Merton’s (1968) conceptualization of the Matthew effect of cumulative advantage, named after a passage in the Gospel according to St Matthew: “For unto every one that hath shall be given, and he shall have abundance: but from him that hath not shall be taken away even that which he hath” (Matthew 25:29, cited in Merton, 1968: 58). The Matthew effect is often referred to in shorthand as the “rich get richer” (Merton, 1968: 62). Actors with favorable social circumstances accumulate additional advantages that widen the inequalities between them and their less advantaged counterparts. In the process, the poor become comparatively poorer (Merton, 1968; Rigney, 2010; see also McMahon, 2004). More specifically, two prominent privatization policies— market-style school choice and private transaction-oriented relationships with taxpayers’ preferred public schools— intersect in public school tax credit donations to charter schools. Public school tax credit donations can also be understood as an aspect of parental investment in education. At the same time, some charter schools are actively soliciting donations from parents. If these donation-seeking schools serve more privileged charter school families, then already advantaged schools are essentially able to leverage this policy to raise additional funds for their schools. We describe each of these processes in turn below.
Parental investment in education
Parents not only invest time in their children’s education in the form of parental involvement, but they also spend money on educational goods, activities, and services for their children. Lino (2013) estimated that in 2013, half of all families had some expenditures on child care and education and that the probability of making such expenditures varied by family income. Forty-five percent and 56% of middle and higher-income families spent household funds on child care and education, respectively, compared to one-third of lower-income families. However, although income and wealth inequalities in the USA have been expanding since the 1970s, relatively few scholarly studies have addressed this latter issue (Kornrich and Furstenberg, 2013).
In an early analysis, Bianchi et al. (2004) found that parental spending on children remained relatively stable between 1988 and 1998. When Bianchi et al. (2004) examined specific types of spending, they found that this pattern was, in part, driven by a rise in spending on day-care-related expenses and a decrease in spending in other areas. Families with more educated parents and greater financial resources tended to spend more on their children, and the gap between families with higher levels of education and financial resources increased between 1988 and 1998. However, Bianchi et al. (2004) did not provide estimates for education-related spending. Kornrich and Furstenberg’s (2013) analysis of the Consumer Expenditure Survey covers a longer time span (1972 to 2007) and, unlike many studies, disaggregated child care and education expenses. Across all families, spending on education has increased over the past 25 years. While families of all income groups increased their total spending on their children between 1972 and 2007, the amount of money the highest income families expended on their children has far outpaced the spending of all other families. For example, in 2006–2007, families in the highest income decile spent almost twice as much on their children as the families in the next lowest decile, which is also an extremely advantaged group. This shift in spending patterns reflects the expansion of income inequality in the USA over the same period (see also Kaushal et al., 2011). A substantial portion of this shift in spending during this period is attributable to income gains among the families in the top decile of the income distribution (Kornrich, 2016).
Charter schools as market actors
Arizona’s educational policies have also created a context that encourages school districts and charter schools, particularly those in densely populated metropolitan settings, to be market actors and compete for students and schools (Powers et al., in press). In general, charter schools that serve higher percentages of white students and lower percentages of low-income students tend to attract similar students from among the population of choosers (Garcia, 2007; see also Johnson, 2006). ore advantaged families are also likely to remain in charter schools once enrolled (Dong, 2012). Once families are enrolled, charter schools often encourage their students’ parents to donate funds to the school and to defray the cost of that donation via the public school tax credit program. Parents can also solicit donations for their children’s schools via their social networks either on their own initiative or because schools encourage them to do so. Social networks tend to be homogeneous by social class (DiPrete et al., 2011; McPherson et al., 2001). However, families with higher incomes also tend to be situated within social networks that are larger and less closely knit than families with lower incomes (Campbell et al., 1986). As a result, families with higher incomes are more likely to be able to take advantage of the public school tax credit than families with lower incomes, and are also more likely to have wider social networks that they can use to solicit donations for their children’s schools. Taken together, these processes result in a Matthew effect of cumulative advantage whereby some charter schools are able to raise substantially more funds via the public school tax credit program than other charter schools (Merton, 1968; Rigney, 2010).
Data and methods
We use statewide school-level data obtained from the Arizona Department of Revenue that detailed public school tax credit donations in fiscal year 2012 for charter schools. The Arizona Department of Revenue (2017) requires each school to report the number of donors, the dollar amount of contributions received, and the amount of money spent by specific extracurricular activity and/or character education program. For each school we have the total funds received and the number of donors. We matched this data to enrollment data for 2012–2013 from the Arizona Department of Education (ADE) 6 and school characteristics from the Common Core of Data (CCD). Our final sample for fiscal year 2012 comprises 531 charter schools. 7 We used ArcGIS to match the schools with the 2012 mean household income of the census tract in which they are located. 8 While charter schools are schools of choice and draw students from outside of their neighborhoods, this variable provides an indicator of the characteristics of the families that schools are targeting by virtue of where they open their doors (Gulosino and Miron, 2017; Lubienski et al., 2009; see also Bifulco and Buerger, 2015; Henig and MacDonald, 2002; LaFleur, 2016). That is, unlike traditional public schools, charter schools select their locations, and the neighborhoods they choose often serve as a signaling effect for families (Holme, 2002; see also Sampson, 2012). Eighteen (3%) of the 531 schools were virtual or online schools, which we coded as an indicator variable. 9 Our final set of variables includes: total funds received, number of donors, donations per pupil, percentage of students eligible for free/reduced-price lunch, school racial demographics, school level (elementary, middle, high), total school enrollment, mean household income, and the indicator for virtual schools.
We calculated four measures of horizontal equity in school finance to assess the distribution of donations per pupil: the restricted range, the coefficient of variation (CV), the McLoone Index, and the Verstegen Index (Odden and Picus, 2014; Verstegen, 1996). We used measures of horizontal equity because Arizona’s public school tax credit is not means-tested. All schools and taxpayers are eligible to participate in the public school tax credit program, the credit does not phase out at higher income levels, and there are no incentives to donate to schools that serve high percentages of free and reduced-lunch students. The restricted range provides the difference in donations per pupil between the 95th and the fifth percentiles. The CV summarizes the variation within the distribution around the mean and generally ranges between zero and one, although it can be higher than one (National Forum on Education Statistics, 2007). If the CV is 0.20, then two-thirds of the funding distribution, in this case donations per pupil, is within 20% above and below the mean. A CV of zero indicates that funding is distributed evenly among all schools.
The McLoone Index and the Verstegen Index provide measures of equity within the bottom and top half of the funding distribution, respectively (Odden and Picus, 2014). The McLoone Index ranges between zero and one; a value of 1.0 indicates perfect equality of funding of schools below the median. A low value on the McLoone index indicates greater inequalities of funding, in this case donations per pupil, within the group of schools below the median. The Verstegen Index has a value of 1.0 or greater, where 1.0 indicates equity among schools. Higher values indicate that disparities within the top half of the funding distribution, or schools above the median in tax credit donations per pupil, are large. Odden and Picus (2014) recommend calculating and comparing the latter three indices to assess funding equities. In analyses of district spending per pupil within states where there is a relatively constrained range between the highest spending district and the lowest, the McLoone Index should range between 0.7 and 0.9, with values above 0.95 indicating a desirable level of horizontal equity (Odden and Picus, 2014). That said, the conventional standards for assessing equity statistics are not applicable here because charter schools’ tax credit donations could theoretically range from US$0 to up to US$680m if a school received a US$200 donation from each of the approximately 3.4 million taxpayers in the state (Arizona Department of Revenue, 2015). To confirm the patterns we found in our descriptive analyses, we used ordinary least squares (OLS) regression with donations per pupil as the dependent variable. We also analyzed a sample of charter school websites to understand the extent to which they were promoting the public school tax credit to potential donors. We describe the latter analysis in more detail in the following section.
Results
Arizona’s charter schools received US$7,073,223 from 26,752 donors in 2012; the average school received US$13,444 from 57 donors, or US$45 per student in public school tax credit donations. However, these figures mask a substantial amount of inequality in the distribution of tax credit dollars among charter schools. The median school received approximately US$2400 in total donations, and 143 charter schools that enrolled students in 2012–2013 did not receive any tax credit donations in fiscal year 2012. The top 10 receiving schools – schools at or above the 98th percentile in total donations—received over US$110,000. The top grossing school received just over US$270,000, which amounted to 2.4% of its annual budget for 2012–2013, or more than half the funds the school budgeted for instructional improvement (Huppenthal, 2014). Schools at the 70th percentile received approximately US$7400, while schools at or above the 90th percentile received over five times more than the schools at the 70th percentile in tax credit donations.
The pattern is roughly similar if the distribution is plotted by donations per pupil (Figure 1), although the increases at the top of the distribution are less sharp. What is striking about the results shown in Figure 1 is the first incline in donations per pupil at the 60th percentile. Schools at the 70th percentile raised almost two times the donations per pupil than the schools at the 60th percentile, and this pattern is roughly consistent through the 90th percentile. However, the school that generated the most donations per pupil raised more than three times the dollars per pupil than the school at the 90th percentile, which highlights the stark inequalities in charter schools’ capacities to solicit donations even within the top of the distribution. The school that received the most donations per pupil enrolled 250 pupils in 2012–2013 and received US$511 per student in 2012, which suggests that the school successfully solicited tax credit donations from taxpayers who did not have children attending the school. Only four other schools solicited more than US$400 per student, which is the amount that a married couple filing jointly can donate and claim as a credit.
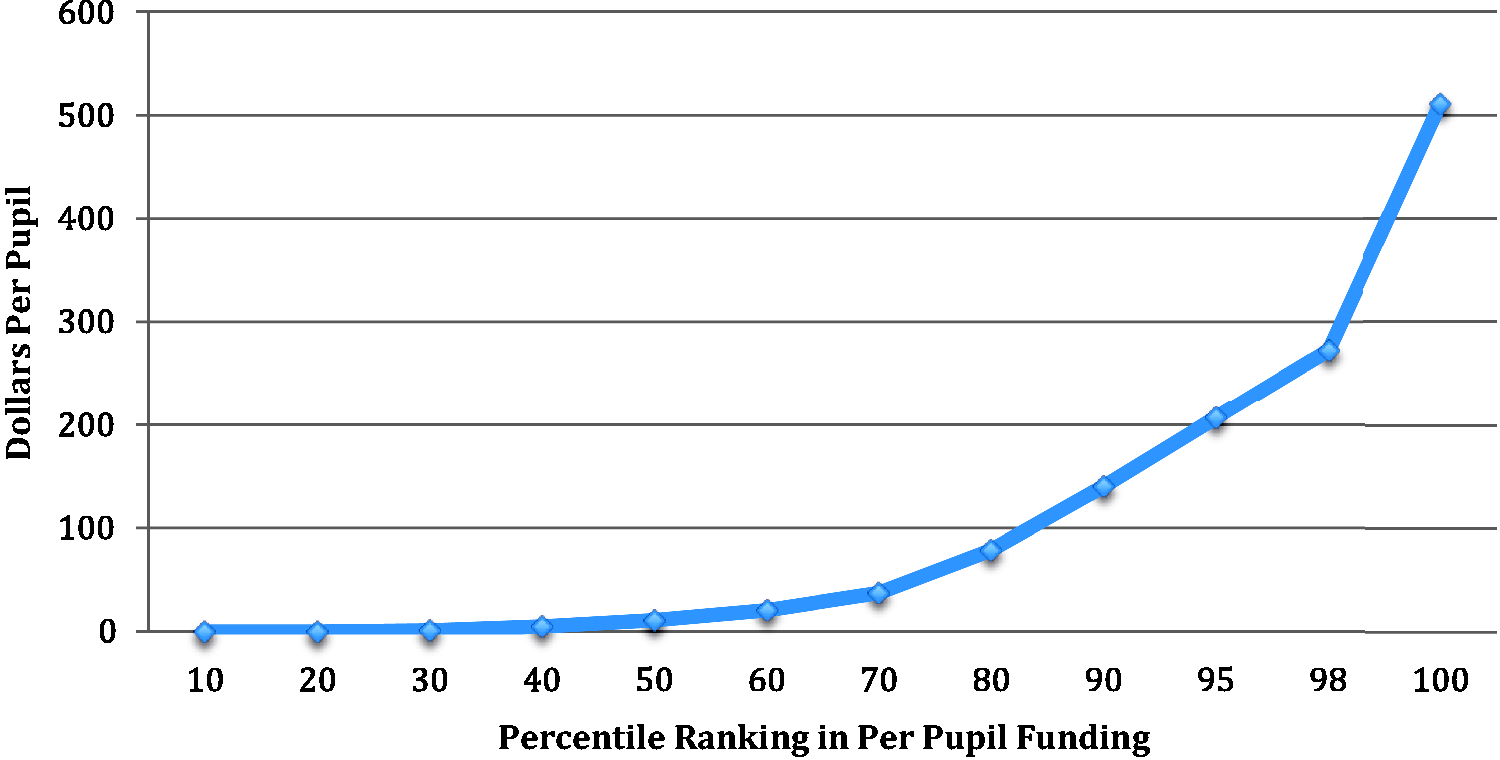
Tax credit donations per pupil by percentile.
In Table 1 we present our measures of horizontal equity, which help us assess the extent to which schools receive similar benefits from the policy. We also provide the mean, standard deviation, and median for comparison. All four indices highlight the extreme inequalities in the distribution of tax credit donations among charter schools. Notably, the McLoone Index is low, and the Verstegen Index is high, which indicate inequalities throughout the distribution—that is, tax credit donations per pupil are highly inequitably distributed among schools below the median and there are also substantial inequalities in the distribution of funds above the median.
Measures of horizontal equity using donations per pupil.
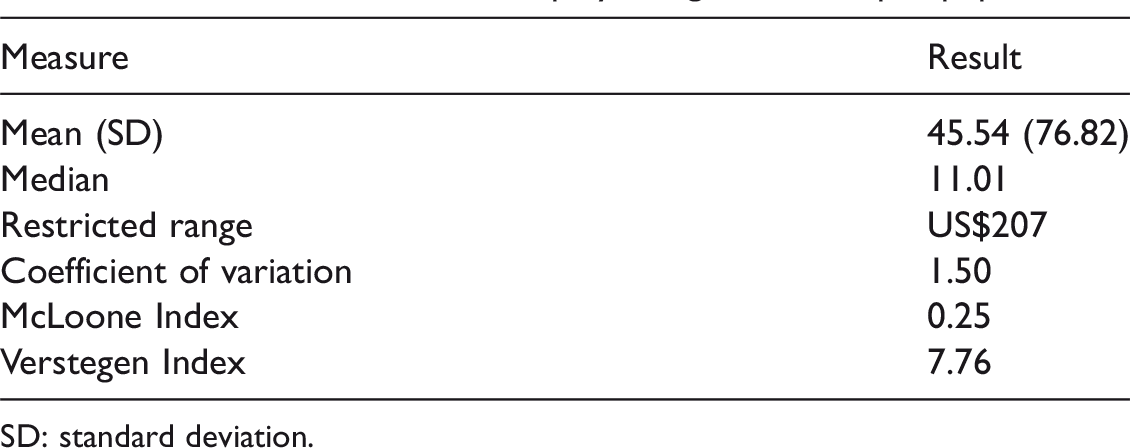
SD: standard deviation.
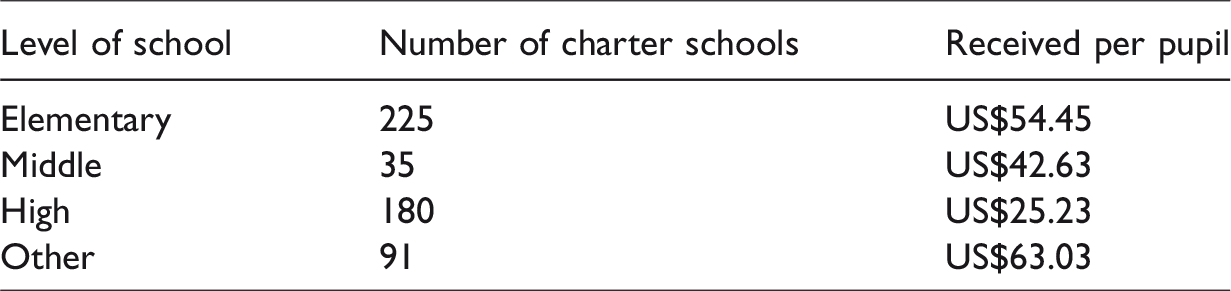
Our next step was to analyze the school characteristics that were associated with the public school tax credit donations charter schools received. Charter schools varied considerably in their donations per pupil by school level. The schools that received the most funds per student had non-traditional grade spans (e.g. schools that served kindergarten through 12th grade). On average, charter high schools received the lowest donations per pupil (Table 2).
Donations per pupil by charter school level.
We also examined the relationship between the percentage of students receiving free and reduced-price lunch and donations per pupil. The percentage of free and reduced-price lunch students that schools served was negatively associated with the amount of donations per pupil a charter school received (r = –0.327, p < 0.001, N = 515 10 ). We obtained a similar result when we correlated the percentage of minority students served with donations per pupil (r = –0.366, p < 0.001, N = 526 11 ).
Table 3 compares the demographics of the charter schools in the sample with the 143 schools that did not receive tax credit donations, and the schools in the top decile of donations per pupil. We also included the demographics of the first 38 charter schools that received more than one dollar in public school tax credit donations as an additional comparison to the top decile group. Perhaps surprisingly, the charter schools that received the lowest funding within the group of schools that received funding served higher percentages of free and reduced-price lunch students and minority students than charter schools that did not receive any public school tax credit donations. Both groups of schools were located in census tracts with mean household incomes below US$67,444, the mean household income for Arizona in 2012. 12 Likewise, on average, the charter schools in the top decile of donations per pupil were located in census tracts that were substantially above the state’s mean household income. Only three of the 18 virtual schools received public school tax credit donations, so the average donation per pupil was extremely low (US$1.77). This could be partially attributable to the restrictions on the use of the funds. Schools can only use public school tax credit donations to support extracurricular activities and character education which are less likely to be offered by virtual schools.
Demographics of charter schools grouped by donations per pupil.
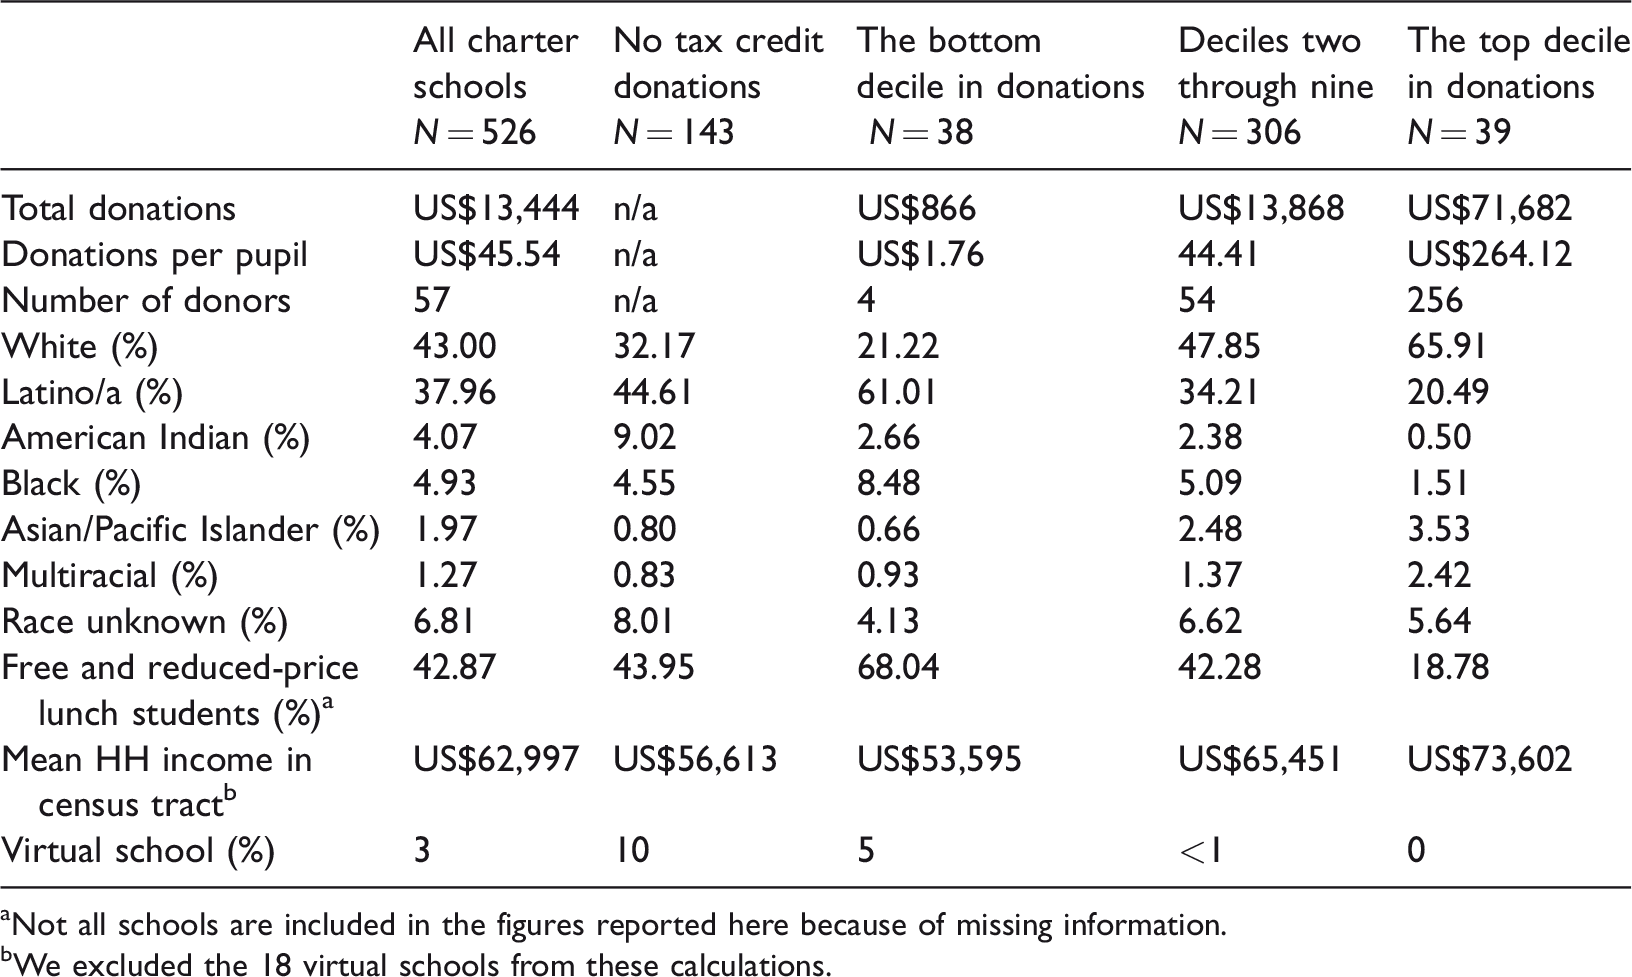
aNot all schools are included in the figures reported here because of missing information.
bWe excluded the 18 virtual schools from these calculations.
Regression with donations per pupil as the dependent variable.
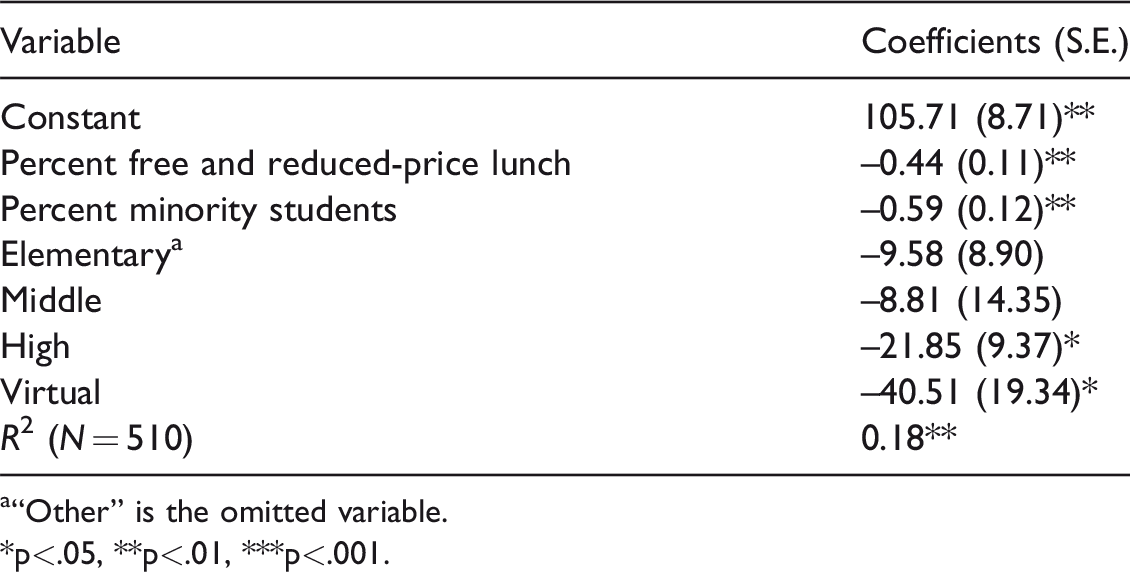
a“Other” is the omitted variable.*p<.05, **p<.01, ***p<.001.
Most of the patterns highlighted in the descriptive analyses above were consistent with the results of an OLS regression analysis using donations per pupil as the dependent variable (Table 4). Both the percentage of students receiving free and reduced-price lunch and the percentage of minority students in a school were significantly and negatively associated with the donations per pupil that charter schools received. Our findings presented in column three in Table 3 suggest that the lower donations in charter schools that serve high percentages of minority students reflect income and wealth gaps between minority and white families rather than willingness to donate (see, for example, Pew Research Center, 2016). With the exception of high schools, which received the lowest average donations per pupil, school level was not significantly associated with donations per pupil once other school characteristics were controlled. Virtual school status was also negatively associated with donations per pupil received, which is consistent with the findings from the descriptive analysis. We did not include mean household income in our final model because the coefficient was not statistically significant and there was only a marginal increase in the R2 when it was added to the model. The regression coefficients indicate that for every 1% increase in the percentage of free and reduced-price lunch students, donations per pupil decrease by 44 cents. Likewise, for every 1% increase in the percentage of minority students, tax credit donations per pupil decrease by 59 cents.
The relatively low R2 (0.18) in the multivariate analysis presented here suggests that there is a considerable amount of unexplained variation in charter schools’ tax credit donations. To understand how charter schools might be functioning as market actors, we analyzed a sample of 82 (15%) charter school websites to assess how the schools promote the public school tax credit to their families and the general public. To get an overview of charter schools’ advertising practices, we first sampled one out of every 10 schools in an alphabetical list that contained only the schools’ names, city, and total donations, with no other identifying information. Next, we ordered the schools by total donations received and randomly oversampled charter schools at both ends of the distribution (i.e. schools that received no donations and schools in the top two deciles of donations). We also selected some additional schools from those in the group with the lowest total donations, which ranged from US$50.00 to US$200.00. 13 Fourteen charter schools in our final sample received US$100,000 or more in total donations. Of these, 10 had an online credit card donation link easily available on their schools’ homepages for present or future tax year donations. On the other hand, there was much more variation in the websites of the schools that received very few donations. Over half of the charter schools in our sample received US$200 or less. Five of these schools did not have functioning websites, 23 did not have a link to general or school-specific public school tax credit donation information, and only six had an online credit card donation link available.
This analysis also provided insights into the somewhat surprising finding from our descriptive analysis (see Table 3) that the charter schools that received no tax credit donations were relatively more advantaged than schools at the bottom of the distribution of schools receiving funding. Our website analysis sample included 28 out of the 146 charter schools that did not receive any donations. Of the 28 schools, five did not have websites and an additional 19 did not include any information about the public school tax credit donation on their websites. The websites of 11 of the 15 schools that received between US$50 and US$200 provided information about the public school tax credit program, which may be why they received some funds even though relatively few of their families were likely to have the resources to participate in the program.
Conclusions and policy implications
Our analyses highlight how neoliberal education policies organized around market assumptions reproduce and compound educational inequalities. There are some clear and striking disparities in the distribution of public school tax credit donations among charter schools in Arizona related to the percentages of white and middle-class students the schools served. In the 2012–2013 academic year, charter schools spent US$6777 per student across all expenditure categories (Huppenthal, 2014). The public school tax credit provides a significant amount of extra funding to some, but not all, charter schools. We suggest that this pattern is a result of families’ abilities to donate to schools or to solicit donations from their social networks, and is also related to the ways in which schools solicit donations from the families attending their schools. These processes result in a Matthew effect of cumulative advantage where some charter schools are able to leverage the public school tax credit to raise funds to support extracurricular activities at their schools. At the top of the distribution, this amounts to a substantial amount of additional funding for a very small number of charter schools.
A bill introduced by Democratic lawmakers in the Arizona House of Representatives in February 2015 proposed increasing the credit to US$500 for individuals and US$1000 for married couples, but would also require schools to transfer 25% of the funds they receive over US$250,000 to a public school needs fund to be redistributed to other schools (Arizona Legislature, 2015). This bill did not move out of committee during the 2015 legislative session. Our results suggest that this policy change would do relatively little to equalize funds among charter schools given that a small percentage of Arizona’s public schools raise US$250,000 or more in tax credit donations. 14
Some local organizations and reporters have attempted to raise public awareness about the funding inequalities created by the public school tax credit and have encouraged the public to donate to underfunded schools and districts (Irish, 2014; Maricopa County Education Services Agency, 2016; Roberts, 2015). These efforts, while commendable, are unlikely to substantially alter the patterns documented here given the magnitude of the inequalities in donations across schools. Another policy option for equalizing funding is to create a second public school tax credit targeted at low-income schools to encourage taxpayers to donate funds to public schools that serve the highest percentages of free and reduced-price lunch students. The state currently offers taxpayers two tax credits for donations to charitable organizations that provide services to the working poor and organizations that provide services to individuals in the foster care system. In 2009, approximately 50,000 Arizona taxpayers took advantage of the tax credit to charitable organizations, and the program has grown by at least 10% annually since its inception in 1998 (Karshannon, 2013). An additional credit could be offered to individuals who donate funds to schools that serve at least 70% or higher free or reduced-price lunch students.
At this writing, this latter strategy is likely the only politically feasible strategy to equalize this component of the school funding system in Arizona because donations can be framed as a way for taxpayers to reduce their state income taxes while assisting students who attend high-poverty schools. Arizona’s state legislature is currently dominated by a Republican supermajority that has been consistently cutting corporate and income taxes over the past decade at the cost of underfunding all public schools (Leachman, 2018). Any state lawmaker who proposes raising taxes will have an uphill political battle because of a voter-mandated constitutional requirement passed in 1992. Tax increases must be passed by a two-thirds vote of both houses of the state legislature and signed by the governor (Center on Budget and Policy Priorities, 2018). Only three other states have similar provisions. State lawmakers’ proposals to raise revenues for public schools generally entail regressive options such as raising sales taxes and fees, which disproportionately burden low-income families, rather than restoring corporate and income taxes to pre-recession levels. Arizona has one of the top 10 most regressive state and local tax systems in the US (Institute on Taxation and Economic Policy, 2015). Under pressure by the 2018 teachers’ strike, the state legislature passed a bill that increased funds to public schools that will be funded largely through unsustainable revenue sources, raising vehicle registration fees, and redirecting funds that support desegregation programs (Levitz, 2018; Ruelas et al., 2018).
These issues raise broader questions about the limits of education policy to ameliorate the inequalities that are “intrinsic to the ordinary functioning of capitalist economies” (Wright, 2013: 6). 15 Our suggestion to create incentives for taxpayers to give money to schools with higher levels of financial need may incentivize some taxpayers to support and nurture public schools that do not serve the children of the families within their social networks. However, this admittedly limited solution will not alter the larger school funding system that allows these and other inequalities between schools to persist. In an emancipatory transformation of capitalism where both economic and state power are subordinate to social power or “power rooted in voluntary cooperation for collective action” (Wright, 2013: 19), funds would be distributed to schools so that all students had access to the educational opportunities that would allow them to flourish (Wright, 2013; see also Klees, 2017; Wall, 2005). Allocations to and within schools would be determined by participatory budgeting processes. In such a system, the public school tax credit would no longer be necessary because extracurricular activities would be sufficiently funded.
Our initial scholarly assessment of Arizona’s public school tax credit program focused on charter schools, a growing segment of the public school sector in Arizona. As we move forward, we plan to analyze and compare the patterns we document here with the state’s traditional public schools to assess the broader implications of the tax credit program for public school funding in Arizona, as well as assess changes in the distribution of public school tax credit dollars within and across both sectors over time. Another fruitful area for future research is to more fully document and analyze schools’ mechanisms and strategies for raising tax credit dollars and how these are related to the patterns we describe here. Finally, little is known about taxpayers’ knowledge of and perceptions of the public school tax credit program and other aspects of public school finance policies in Arizona.
Footnotes
Declaration of conflicting interests
The author(s) declared no potential conflicts of interest with respect to the research, authorship, and/or publication of this article.
Funding
The author(s) received no financial support for the research, authorship, and/or publication of this article.