
Abstract
This article presents a method for constructing circulatory networks that intrinsically combine geometric, topological, and semantic spatial attributes. The objective of this work is to generate concise graph representations extracted from spatial geometry that may be used for wayfinding and code compliance analyses to inform architectural design and urban planning. Our approach is based on shape analysis using the Medial Axis Transform skeletonization method. We present a process for the semantic classification of its nodes and edges by constructing an analytical rational piece-wise 3D surface representation. This overcomes the problem of identifying salient or otherwise graph features. Furthermore, we augment the networks with peripheral pathways. This addresses the fundamental limitation of skeletal graphs forcing paths exclusively through the middle of space and thus producing unreasonable detours. We demonstrate that our approach encompasses subtle circulatory features and generates concise graphs for open and free-form spaces that do not exhibit corridor-like structures.
Keywords
Introduction
Spatial circulation is a notion employed by architects, engineers, and planners to express the routes people encounter while moving within and among spaces. It is commonly studied during the early design stages concurrently with the functional arrangement of spaces. Circulation is an important component of a building’s performance, used in numerous architectural and urban planning analysis procedures and it is often regulated by codes administered by relevant government authorities.1–3
Conceptually, spatial circulation is fascinating because it is most often implied, rather than explicitly documented in two and three-dimensional representations of the built environment. Additionally, there is no generally accepted representation for spatial circulation. 1 Perhaps this is because of the fundamental challenge in translating higher dimensional constructs, such as volumes and areas, into simpler entities such as pathways. As there is no best way to approach this dimensional reduction problem, there have been several approaches proposed in the past.
The objective of this work is to study the spatial and circulatory structure of the built environment in a manner where geometry, topology, and semantics are intrinsically combined. This article presents an approach for constructing circulatory networks from Building Information Modeling (BIM) and translating them into Geographical Information Systems (GIS) representations based on shape analysis methodology. Our approach is part of the skeletonization, namely the Medial Axis Transform (MAT) family of graph-theoretic circulatory analysis methods. The contributions of this work are in presenting a novel topological analysis method for semantic edge classification and introducing the concept of peripheral edges to augment the graph’s circulatory structure.
Background
Computational analysis of spatial circulation within and around buildings has been extensively studied in the past.4–6 The methods investigated may be categorized as (a) Simulation-based, where autonomous agents with prescribed behaviors, modeled after relevant empirical studies, are performed in a transient sense,7–9 and (b) Analytical, methods employing graph theory concepts, in the form of Euclidean metric networks, expressing pedestrian pathways.6,10,11 There are benefits and limitations for each approach, for instance, calibrated simulations against pedestrian behaviors produce more people-centric results, whereas analytical methods primarily capture spatial structure and its implications to mobility. The approach presented here belongs to the latter category.
Several graph-theoretic methods have been proposed in the past expressing circulation as a set of spatially located nodes and edges. Typically, a circulatory graph is defined as
Grid-based methods11–13 discretize space into often uniformly spaced cells, such as rectangular, triangular, and hexagonal. Grids are efficiently mapped onto polygonal areas by rasterization or triangulation, and they are simple to visualize as plan overlays due to their cellular structure. Important parameters for grid-based methods include their tiling pattern, resolution and the treatment of the nodes and edges interacting with spatial boundaries (Figure 1(a) and (b)). Paths are approximated by sequences of nodes connected by adjacent edges between one or more sources and destinations. Limitations of spatial grids are (a) semantic, in that nodes do not intrinsically capture spatial features as they merely discretize space, and (b) they are computationally expensive because they scale quadratically to the area for a given grid resolution. (a) Square grid with 1.0 m cell-size containing 71 line-segment edges. (b) Square grid with 0.3 m cell size containing 442 edges. (c) The visibility graph contains 48 line-segment edges across mutually visible polygon points. (d) The Geodesics graph contains 21 line-string edges between 7 door-pairs. (e) The straight skeleton graph contains 29 linear edges. (f) The medial axis transform graph contains 18 line-string edges.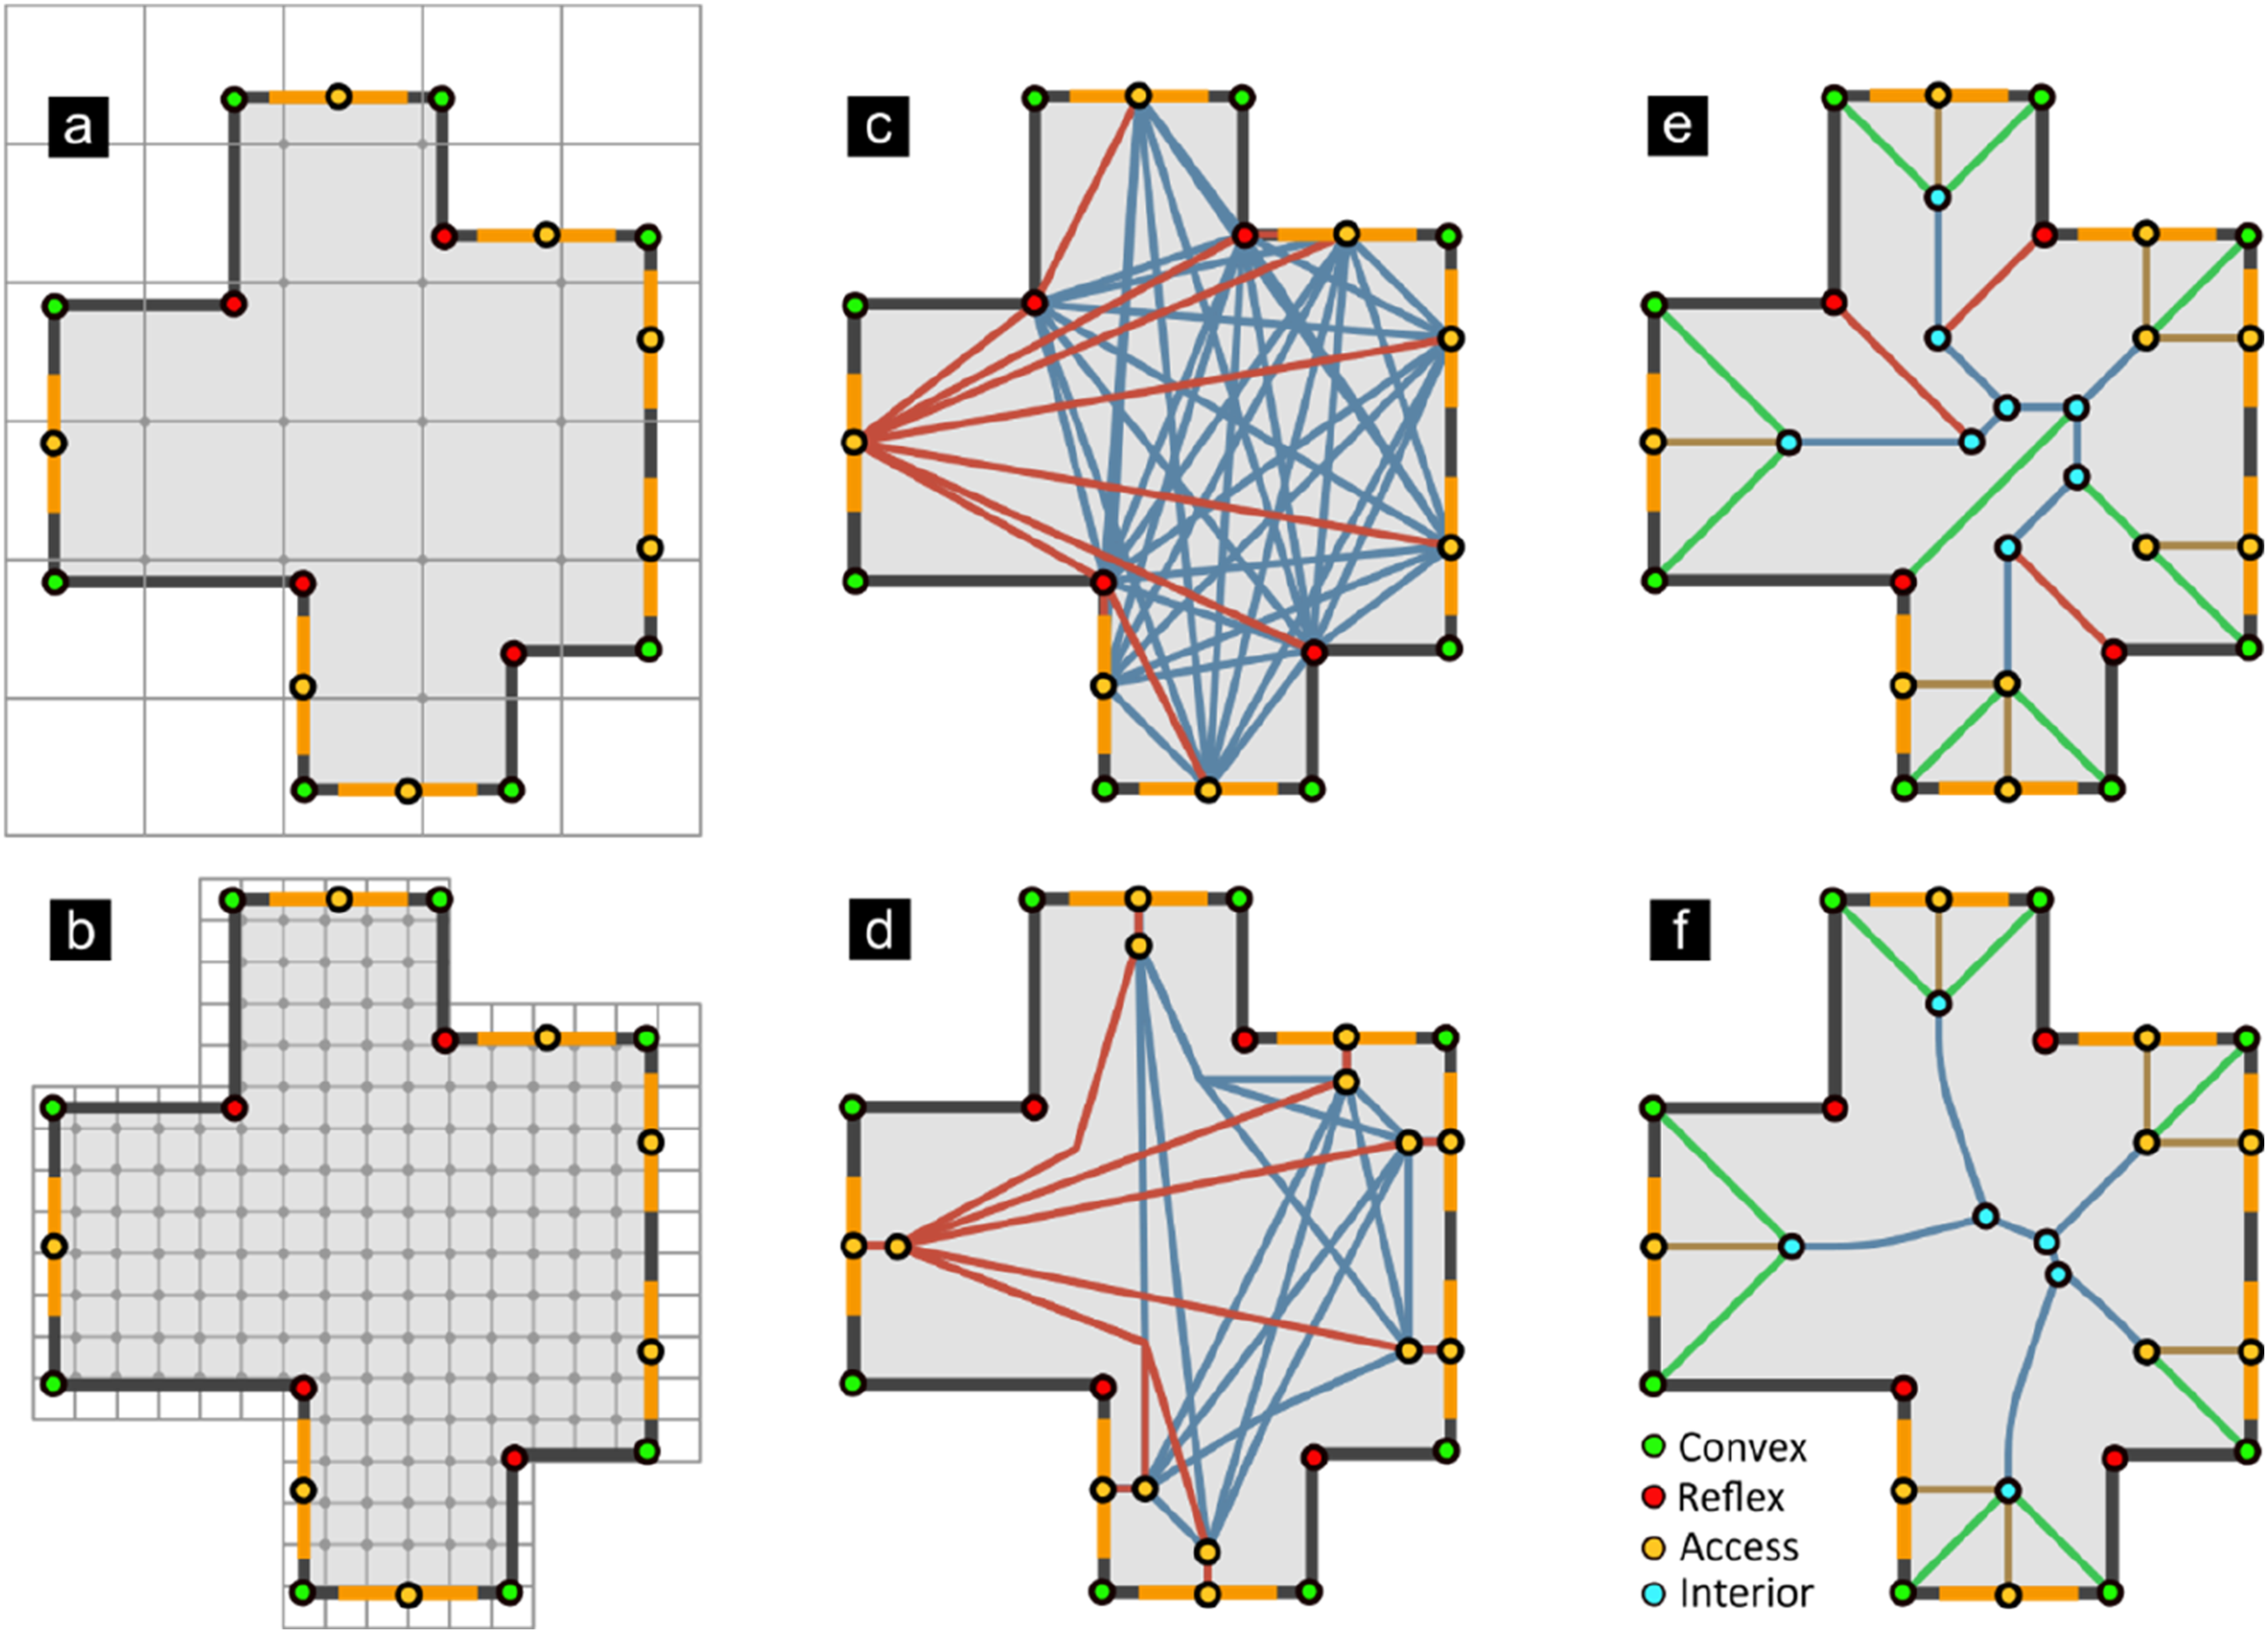
The Visibility Graph (VG) is a network representation, originally proposed for the optimal robot path-planning in the presence of spatial obstacles 14 and studied for being associated with Art Gallery Problem. 15 The VG contains edges between mutually visible locations within a polygonal area. Euclidean geodesics are recovered using Dijkstra’s shortest-path algorithm. 16 Conceptually relevant circulatory graphs, in the local visibility sense, were previously proposed, where doors are introduced as semantically important nodes associating adjacent spaces 6 as well as graphs encoding the set of pairwise geodesics between doors 1 (Figure 1(c) and (d). Shortcomings of visibility and geodesics graphs include (a) limited spatial structure and semantic contents, because they are primarily concerned with the shortest paths, (b) they imply complete knowledge of the spatial organization from the user’s perspective, manifested in their unrealistic routes optimally turning around corners, and (c) only single-source single-destination and perhaps single-source all-destinations are visually tolerable because they contain dense sets of overlapping edges.
A class of circulatory networks based on polygon skeletonization of floor plans has also been investigated in the past.3,12,17,19 They are derived from shape analysis methodology aiming to extract compact shape descriptors 20 capturing geometry and topology combined. 21 The Medial Axis Transform (MAT) 22 and the Straight Skeleton (SS)23,24 graphs are the most prominent (Figure 1(e) and (f)). Contextualized versions of those skeletal graphs for circulatory networks were investigated in the past, namely the Straight MAT, 17 the Modified MAT, 12 SS Navigation Networks, 3 Image-Thinning Networks 19 and Hybrid SS-VG Networks. 25
While offering compact circulatory representations, there are challenges also associated with skeletal graphs such as: (a) they contain superfluous edges, associated with small boundary details, which are semantically unimportant and there is no generally accepted approach for removing them, (b) they work exceptionally well for plans with compact corridor spatial structures, but they produce unreasonable detours when encountering open spaces, (c) their pathways always take place exactly through the middle of the space even though it may not be required or reasonable (Figure 2). (a) Straight skeleton and (b) Medial axis transform challenges. (1) T-junctions are acceptable as long as all corridors are similar. Asymmetric branches and open spaces cause awkward detours. (2) Arcade columns produce undulating routes. (3) Small boundary features can have substantial geometric and topological effects on the skeleton.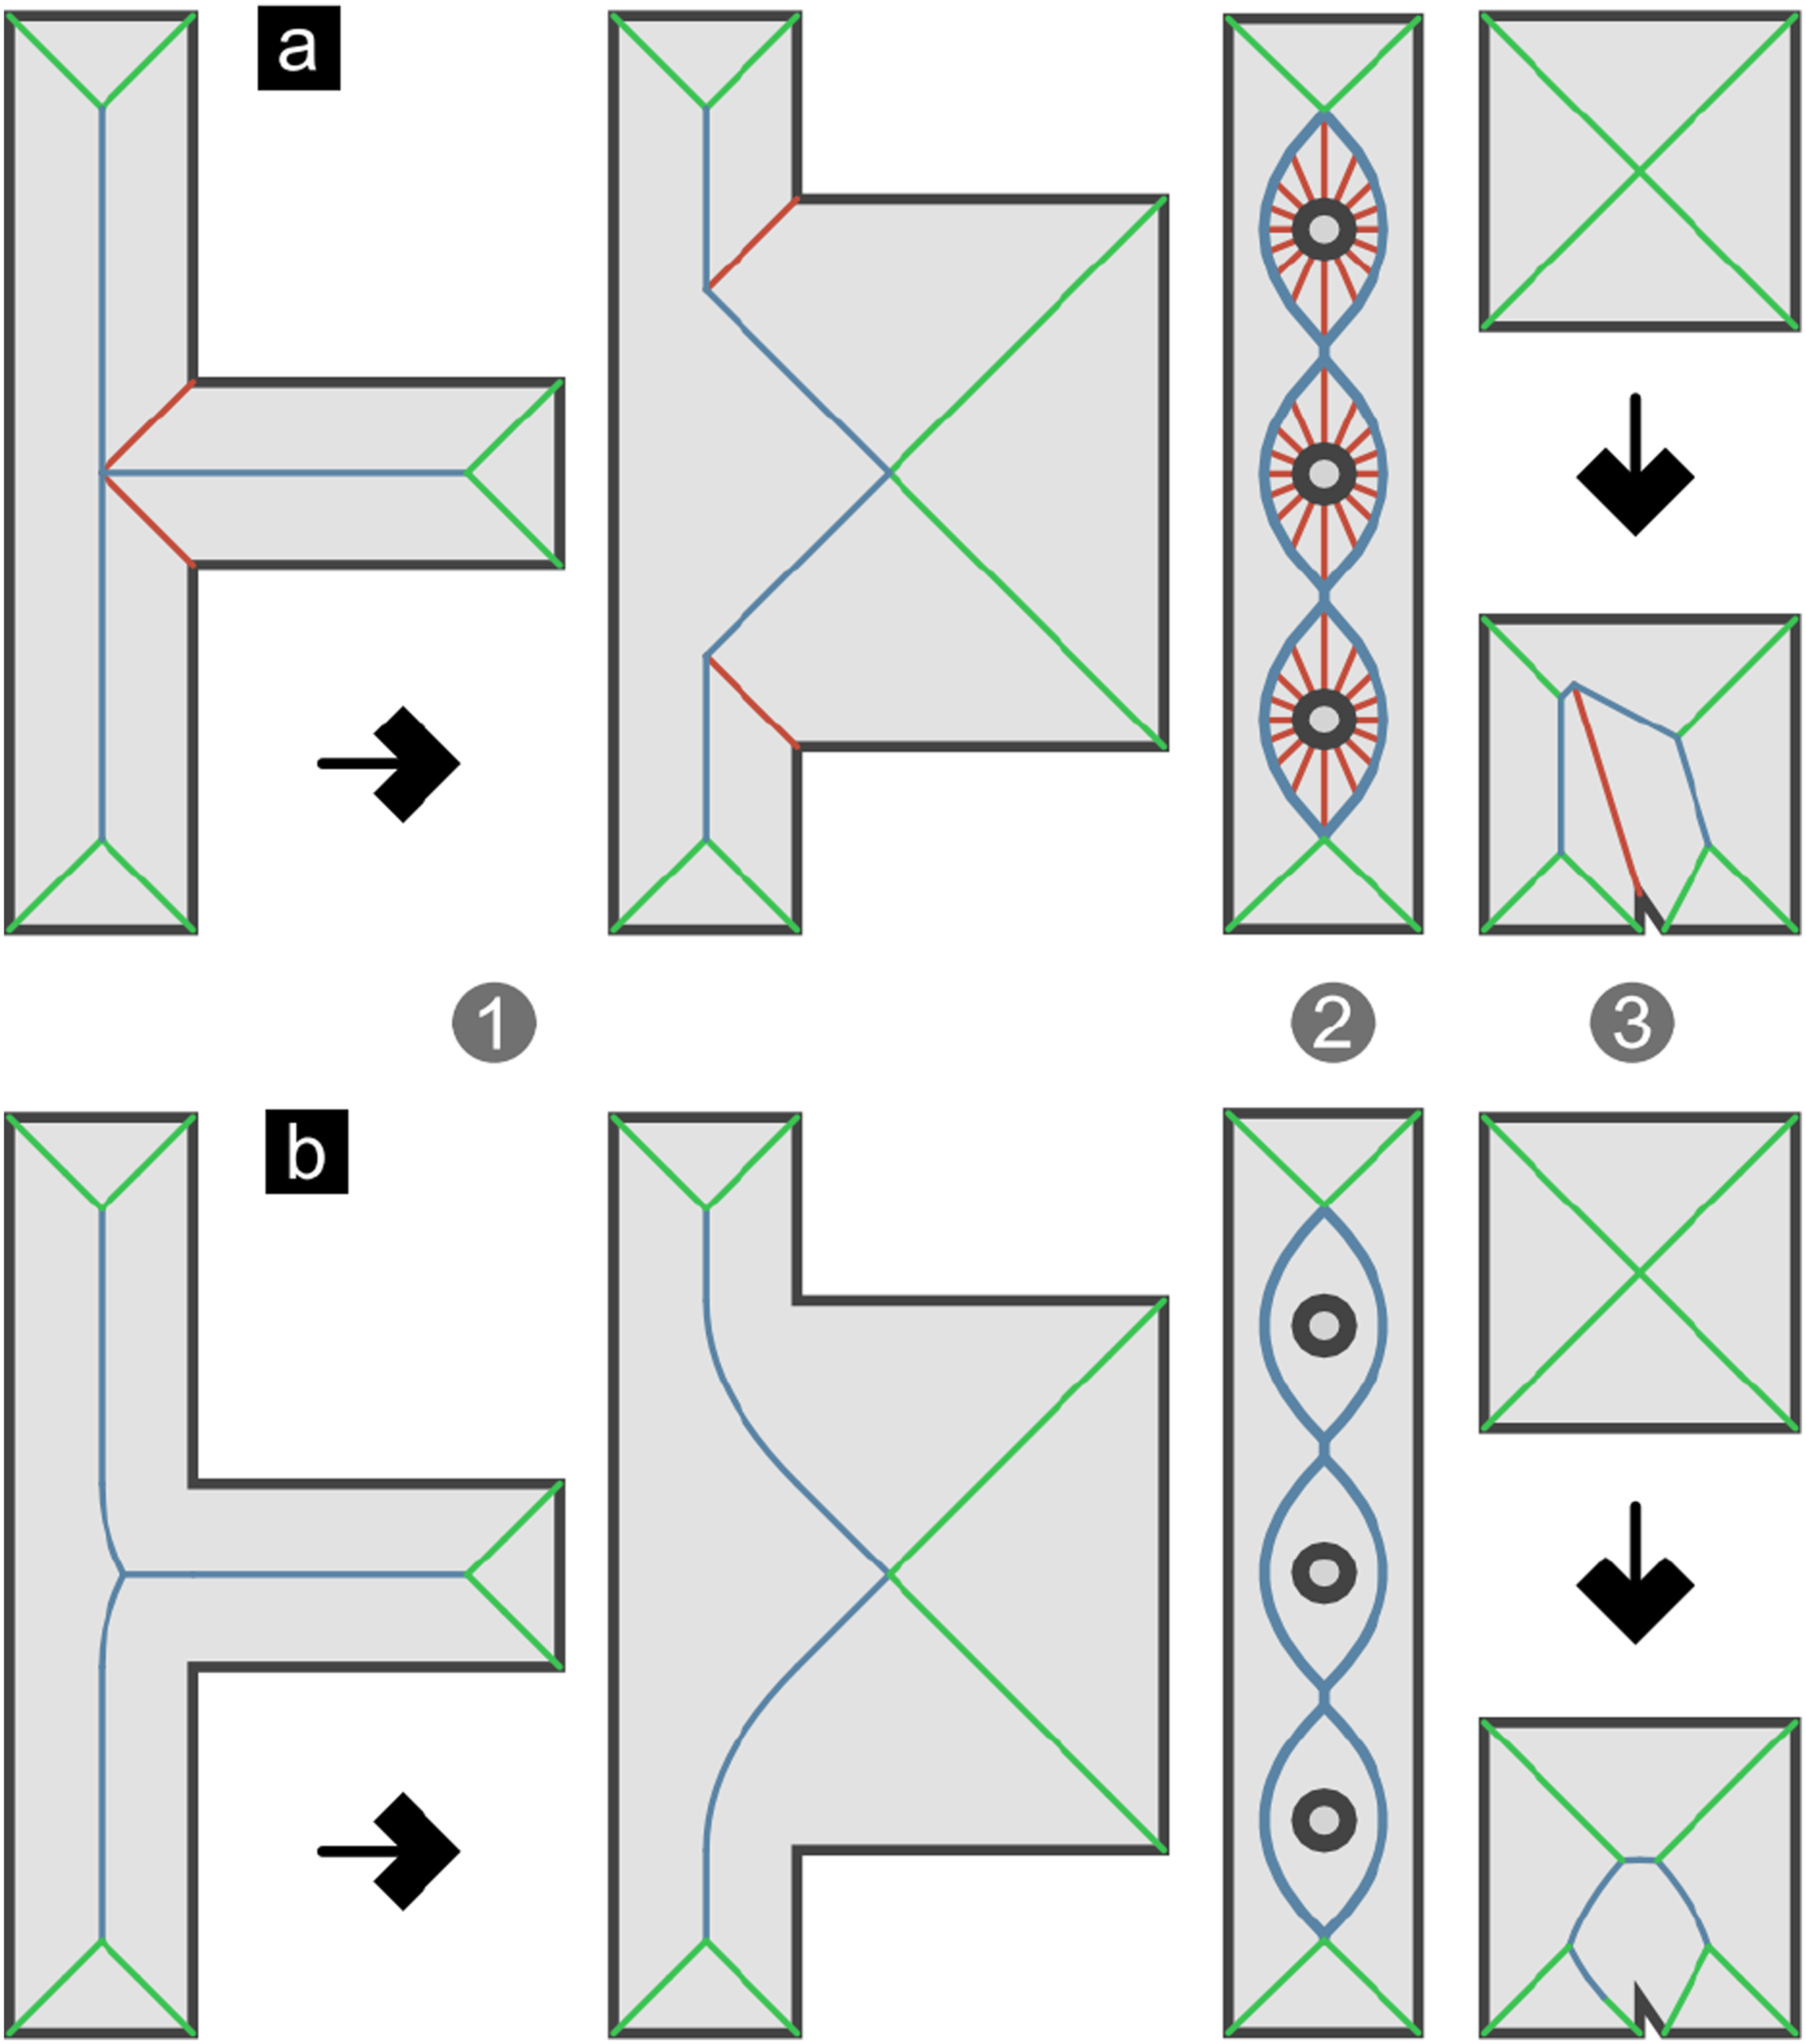
Our approach is part of the skeletal family of graph-theoretic methods. Unlike relevant work, the MAT graph is not approached here as a piece-wise linear collection of 2D edges expressing center-to-center routes. Instead, an analytical form of the MAT is first recovered by lifting the MAT in 3D. This results in a surface comprised of piece-wise planar and conic patches. The ridge line of this surface consists of lines and conic sections. Topological analysis of this representation reveals spatial and circulatory features that naturally overcome the problem of MAT edge classification. In addition, we augment the circulatory graph with peripheral pathways that complement the centrally predisposed MAT edges.
Methodology
Construction of the circulatory graphs consists of the following procedures: (a) Conversion of BIM entities into annotated GIS polygons, (b) Generation of the logical graph associating spaces with one another, (c) Construction of a spatial graph per space using the MAT, (b) Classification of spatial graph’s edges associated with circulatory semantics, and (d) Augmentation of the spatial graph with peripheral pathways.
Building information modeling
Translation of BIM data into a GIS was performed, aiming to overcome the demand for computational resources required by BIM applications using a lightweight spatial entity framework based on labeled polygons. The software developed reconstructs plans by performing intersections and projections between solid geometries and the base and reference plane associated with a plan. It produces regions containing polygons with one exterior and optionally interior loops as well as identification, numerical, and categorical attributes. Regions are classified as (a) Spaces, capturing walkable surfaces in the net internal area sense, labeled with attributes such as elevation from ground, space usage, indoor or outdoor enclosure, and surface flatness; (b) Accesses, expressing links between spaces such as doors, stairs, escalators, and elevators; and (c) Visuals, containing auxiliary information such as spatial boundaries, structural elements and furniture, used for visualization (Figure 3). The models generated define an intermediate representation of spatial structure which is subsequently processed to produce circulatory graphs encoded as geojson layers. This process decoupling is provisioned for cases where BIM information is unavailable but instead polygons from CAD or GIS models can be employed. (a) BIM of a residential block. (b) Extracted representation comprised of spatial, access, and visual polygons.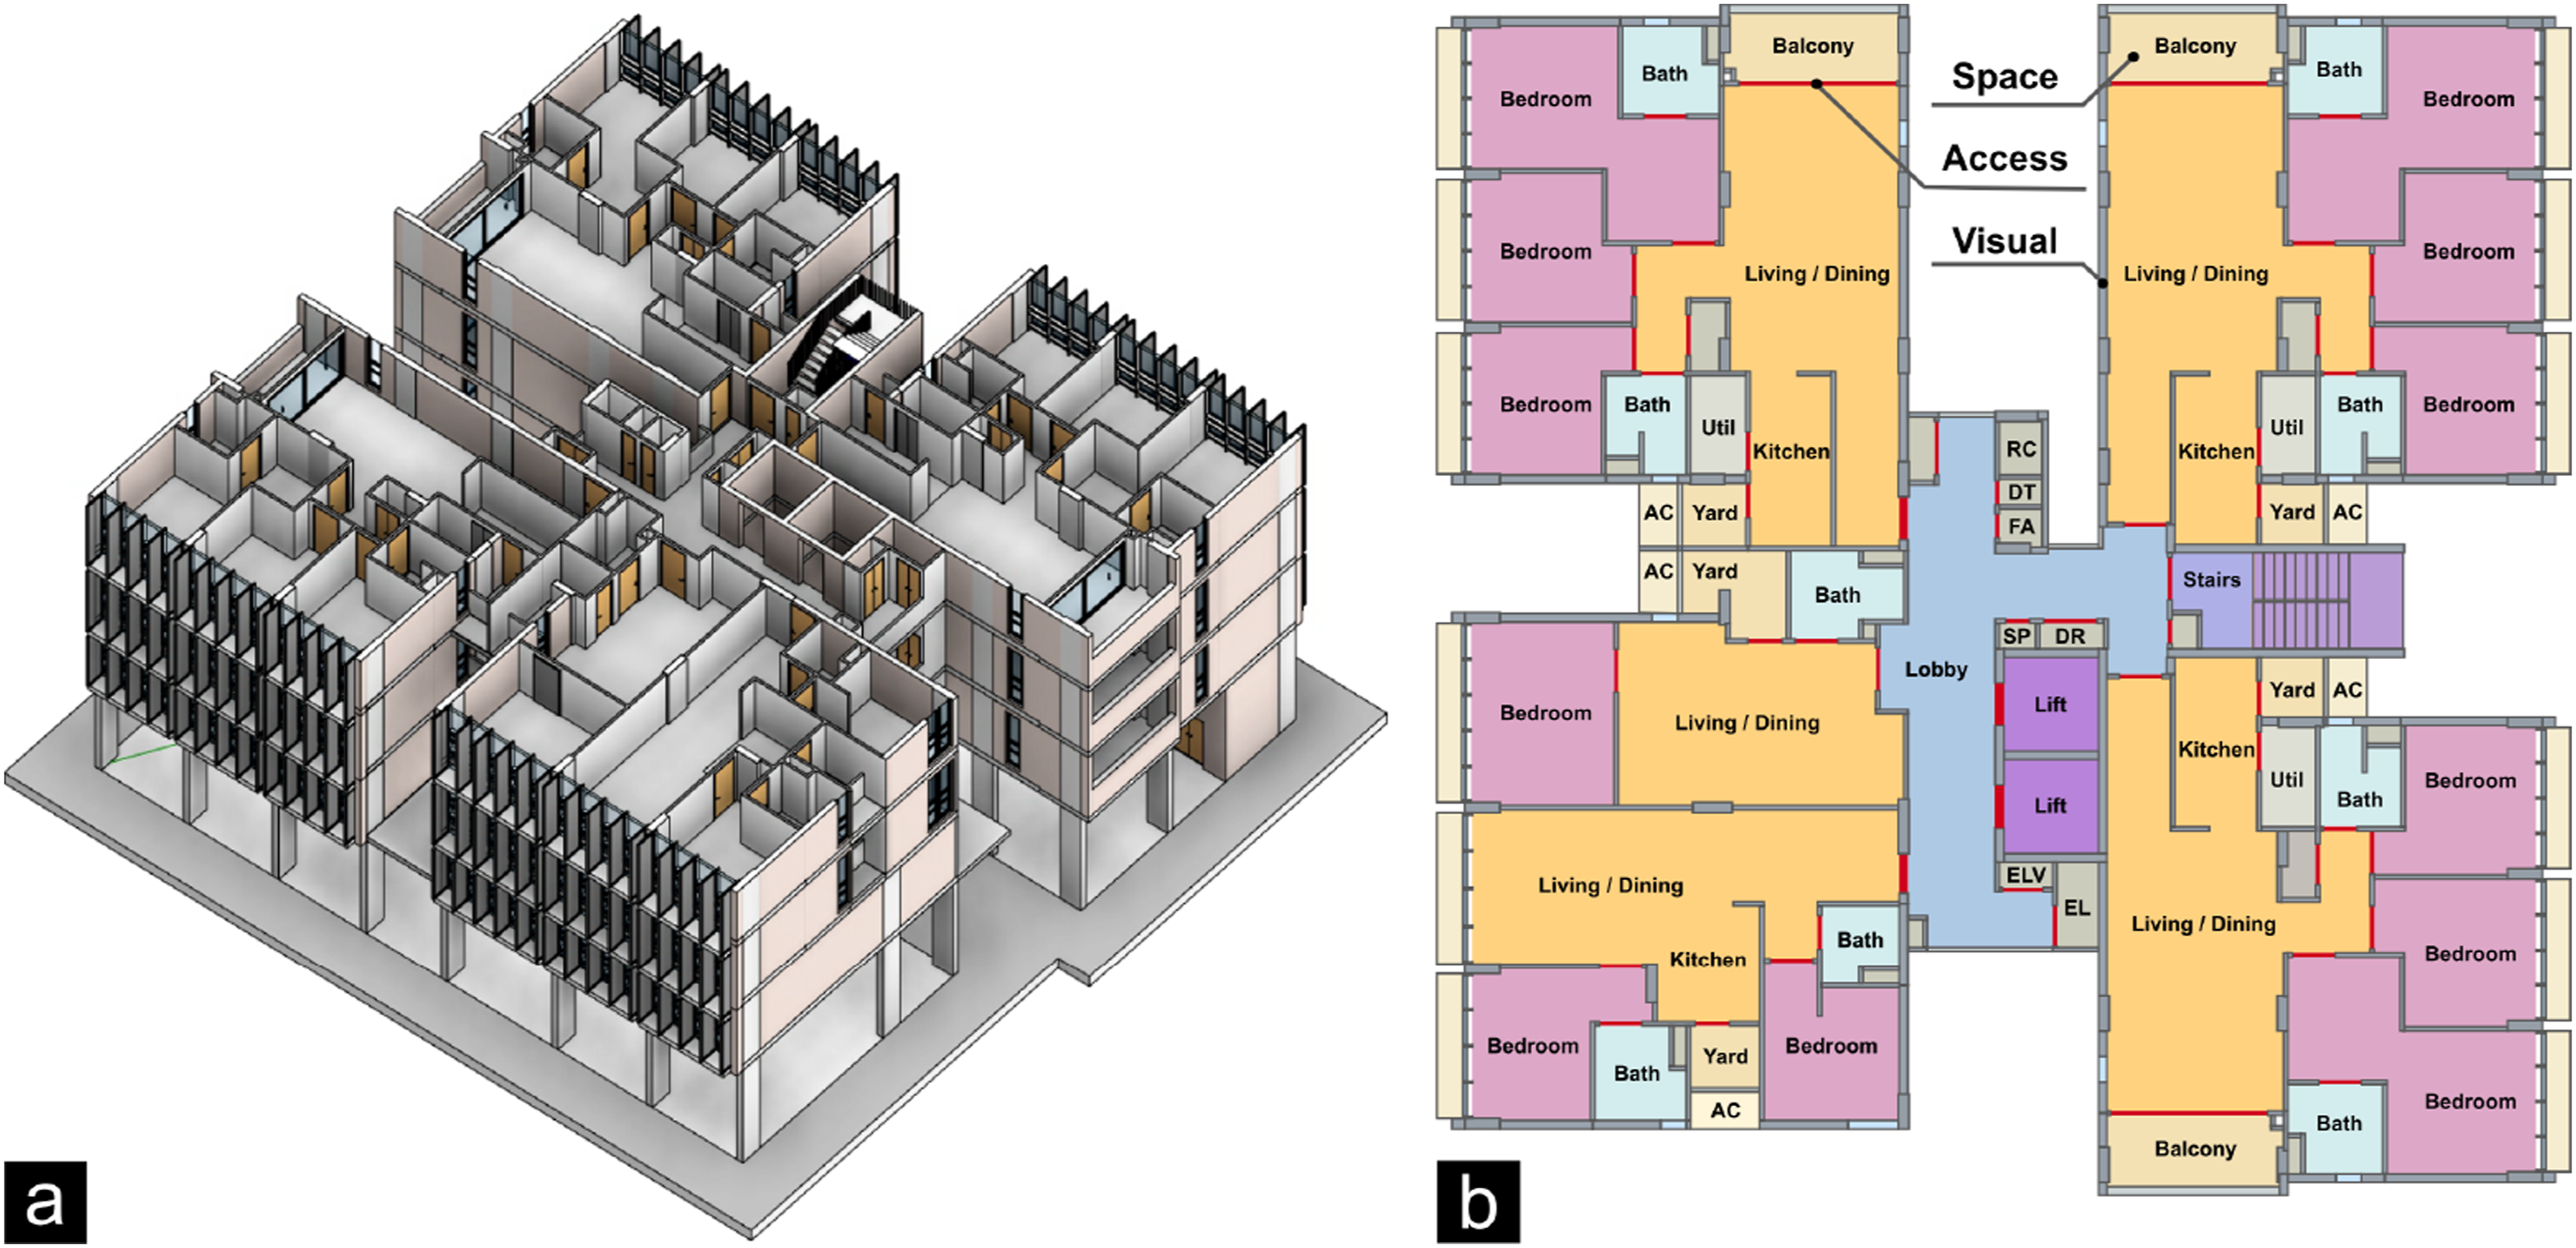
Logical adjacency graph
The logical adjacency graph captures top-level spatial relationships. Its nodes are spaces or accesses, and its edges express the connections among them. Space nodes may only associate with other spaces via access nodes, while spaces may be associated with one or more accesses. The purpose of the logical adjacency graph is to encode spatial structure hierarchically and parallelize per space circulatory graph computation. The associations between spaces and accesses are computed by identifying the polygons latterly situated about accesses using point-in-polygon queries. The logical adjacency graph is purely topological in that visual representations thereof are only meaningful in simple scenarios where spaces are convex with no interior loops, and thus space nodes may be located at the geometric centers of the associated polygons (Figure S1).
Medial axis transform graph
The construction of Peripheral MAT (P-MAT) graphs follows a sequence of procedures: (a) Computation of the approximate MAT using Voronoi diagrams, (b) Graph rationalization using analytical primitives, (c) Semantic classification of nodes and edges, (d) Graph augmentation by insertion of peripheral pathways. Initially, an approximate MAT graph per space is computed via the Voronoi diagram method.
26
The polygon of each space is sampled to produce a Delaunay triangulation, where the circumcenters of its faces are Voronoi vertices and nodes of MAT graph.
27
The Delaunay triangulation’s face adjacency defines the MAT graph’s edges. The circumscribed circles contact the polygon in at least two points forming a set of maximally inscribed discs.
28
The radius of a disc conveys a notion of local size or capacity per location and the sum thereof reconstructs the polygonal area. Tangents to the MAT graph’s edges represent axes of local shape symmetry.
21
Nodes of degree one are situated at convex polygon points and represent terminal locations, where a circumcircle’s radius becomes zero. Nodes of degree two represent transits within the graph, capturing locations where the maximal discs contact exactly two boundary segments. Finally, nodes of higher degree represent junctions, where the discs contact three or more boundaries (Figure 4). (a) Spatial polygon. (b) Delaunay triangulation. (c) Voronoi diagram from face circumcenters. (d) MAT approximation. Terminal nodes are anchored at convex points. Junctions are centers where the circles contact the polygon at three of more points and transit nodes at exactly two.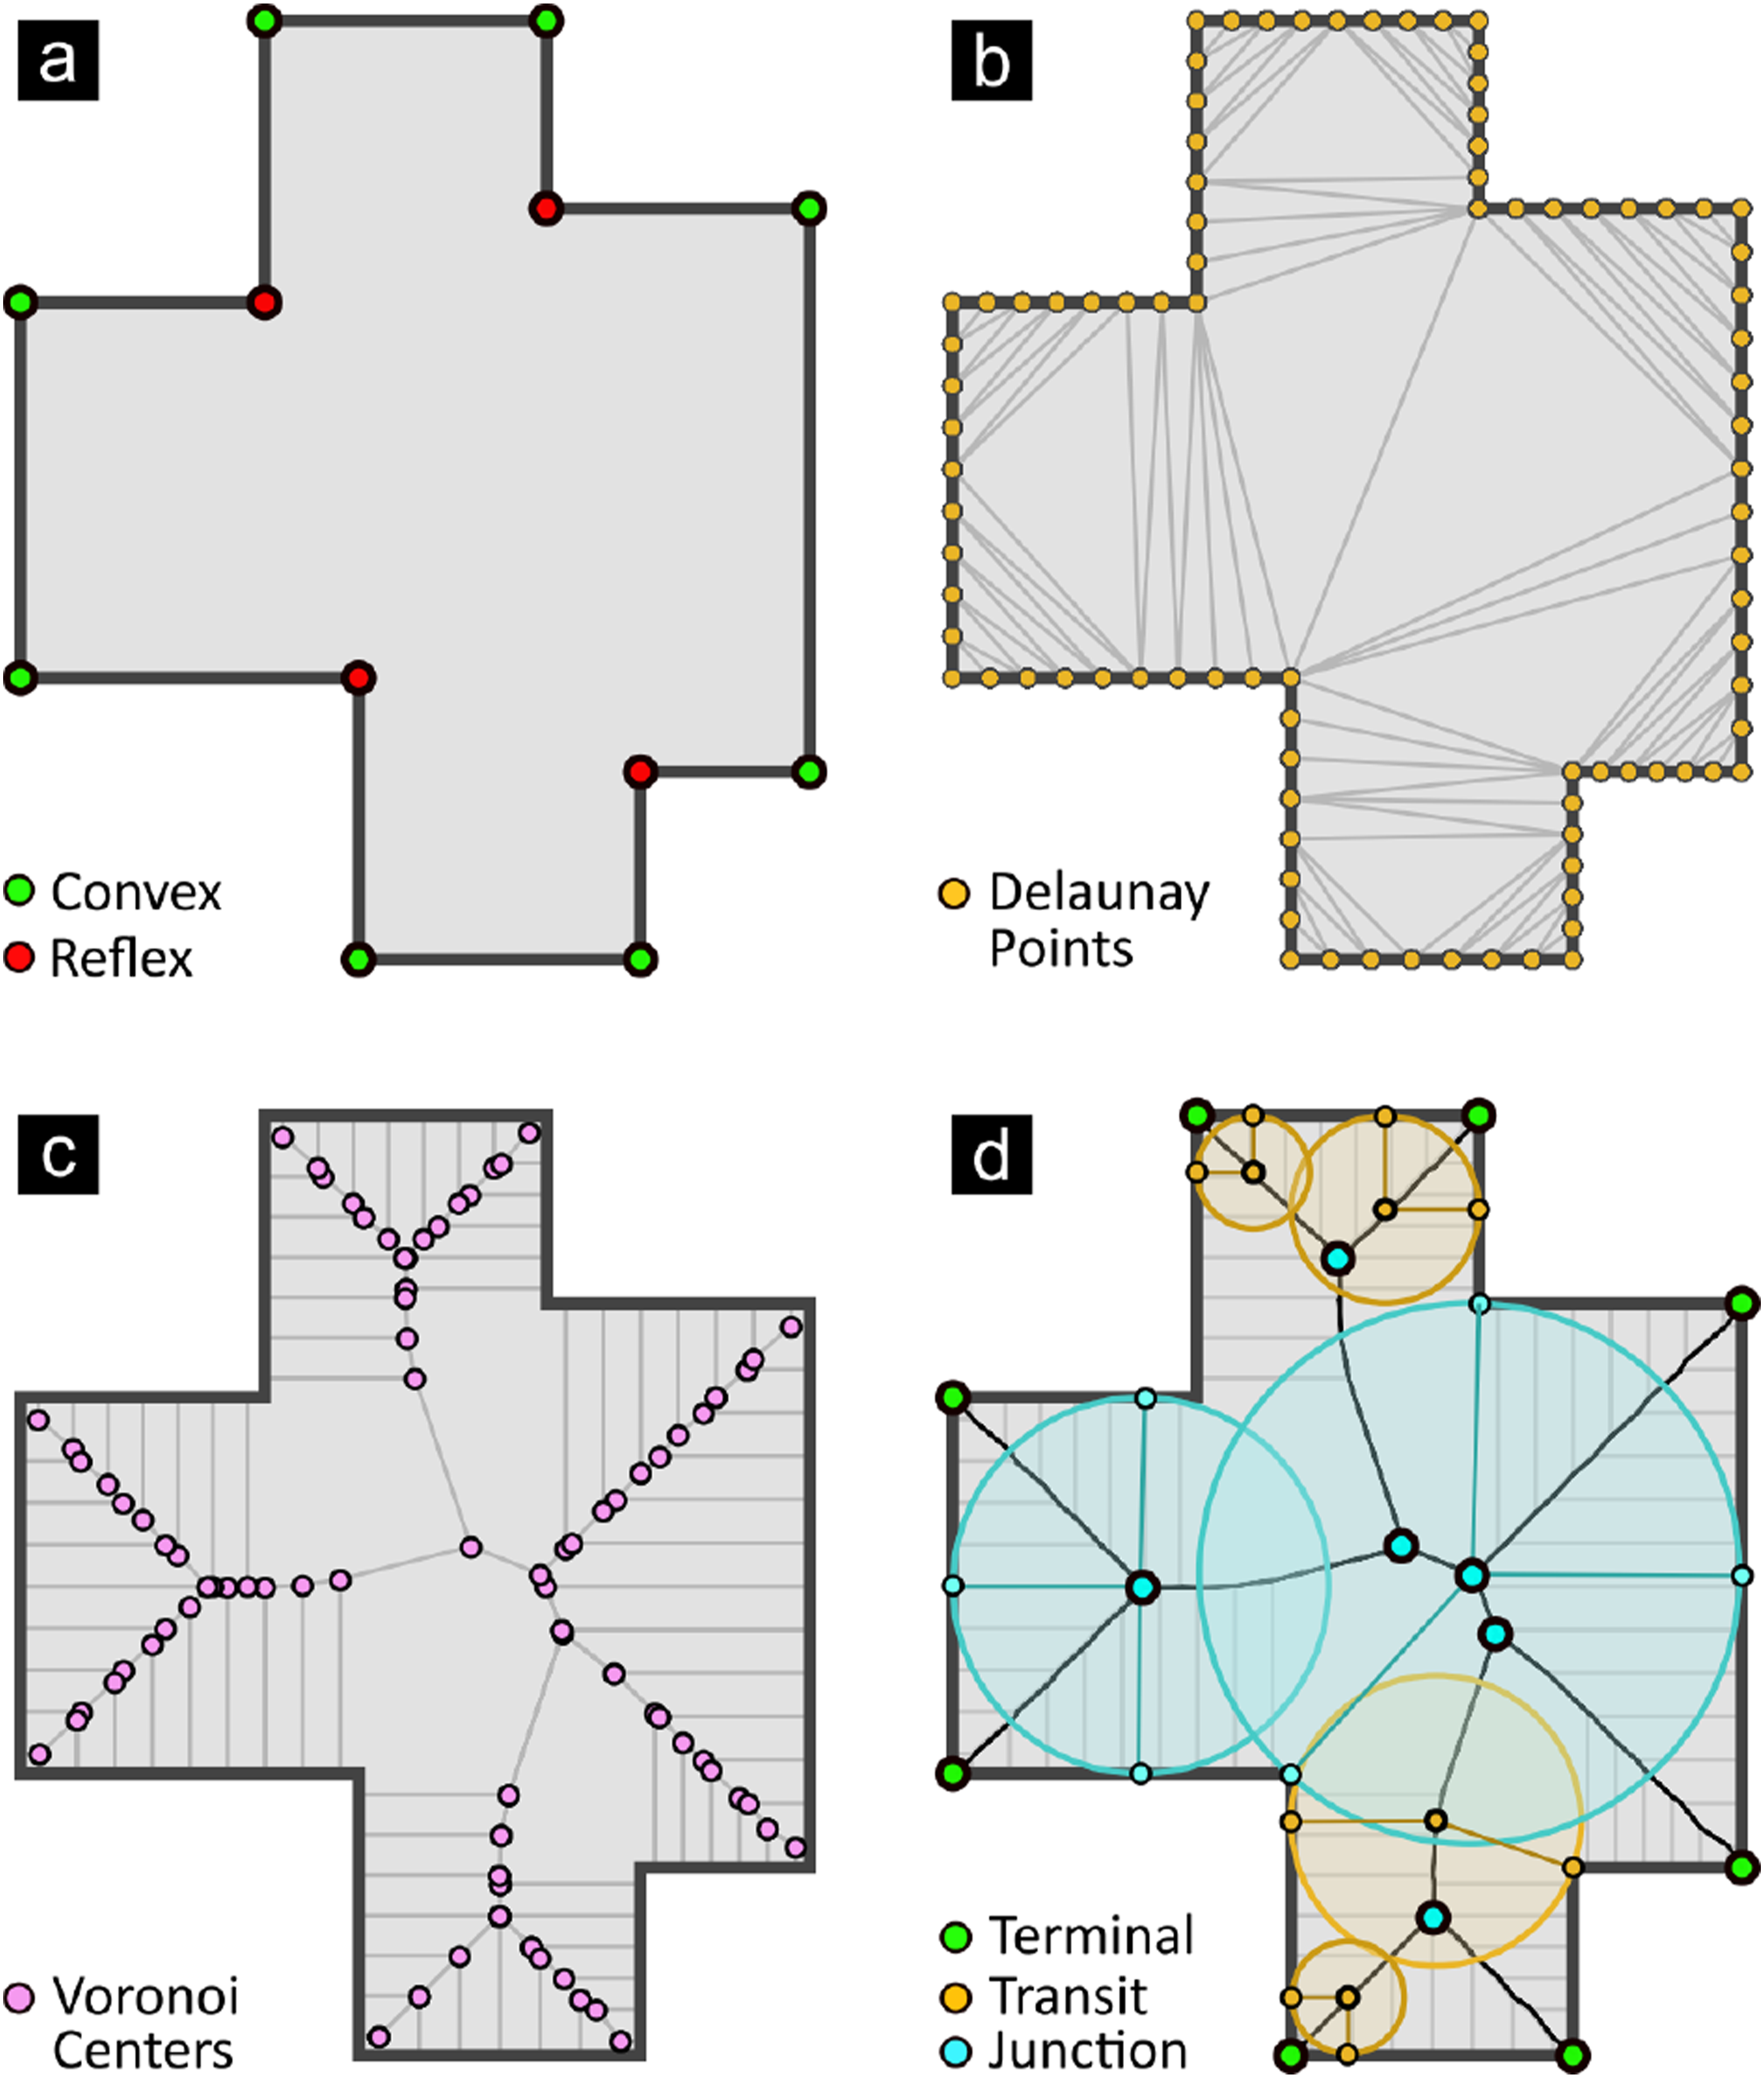
A limitation of this approximate MAT graph is that its edges cannot be easily classified because straight and bent routes are fused between junctions. To disaggregate the MAT graph’s components, a rational 3D representation was recovered. First, the nodes are lifted off the plane using their circumcircles’ radii as Z-coordinates. This operation produces a roof-like surface structure
20
which reveals that the MAT graph’s edges may be considered as the result of plane and cone intersections emanating from the polygon’s segments and reflex points at 45° from the vertical, respectively (Figure 5). Rationalization of the 3D MAT graph is performed by first determining new node locations by splitting the graph’s edges that enter and exit conic surfaces. This is computed by plane-edge intersections, where the planes’ origins are situated at the reflex points and their normals are derived from the adjacent polygon edges’ directions. Subsequently, the polygon’s points and segments are associated bidirectionally with MAT’s nodes, such that each graph node contains sets of its generating polygon segments and reflex points, and each polygon segment and reflex point contains an ordered set of the nodes encountered. The association is performed by traversing the graph in the shortest path sense, using the deviation of the nodes from the respective planes and cones. (a) Insertion of turn nodes by edge-plane intersection from reflex polygon points. (b) MAT roof surface representation. The surface contains piece-wise tangent planar and conic patches. Polygon offsets are equivalent to surface contours projected in the XY plane.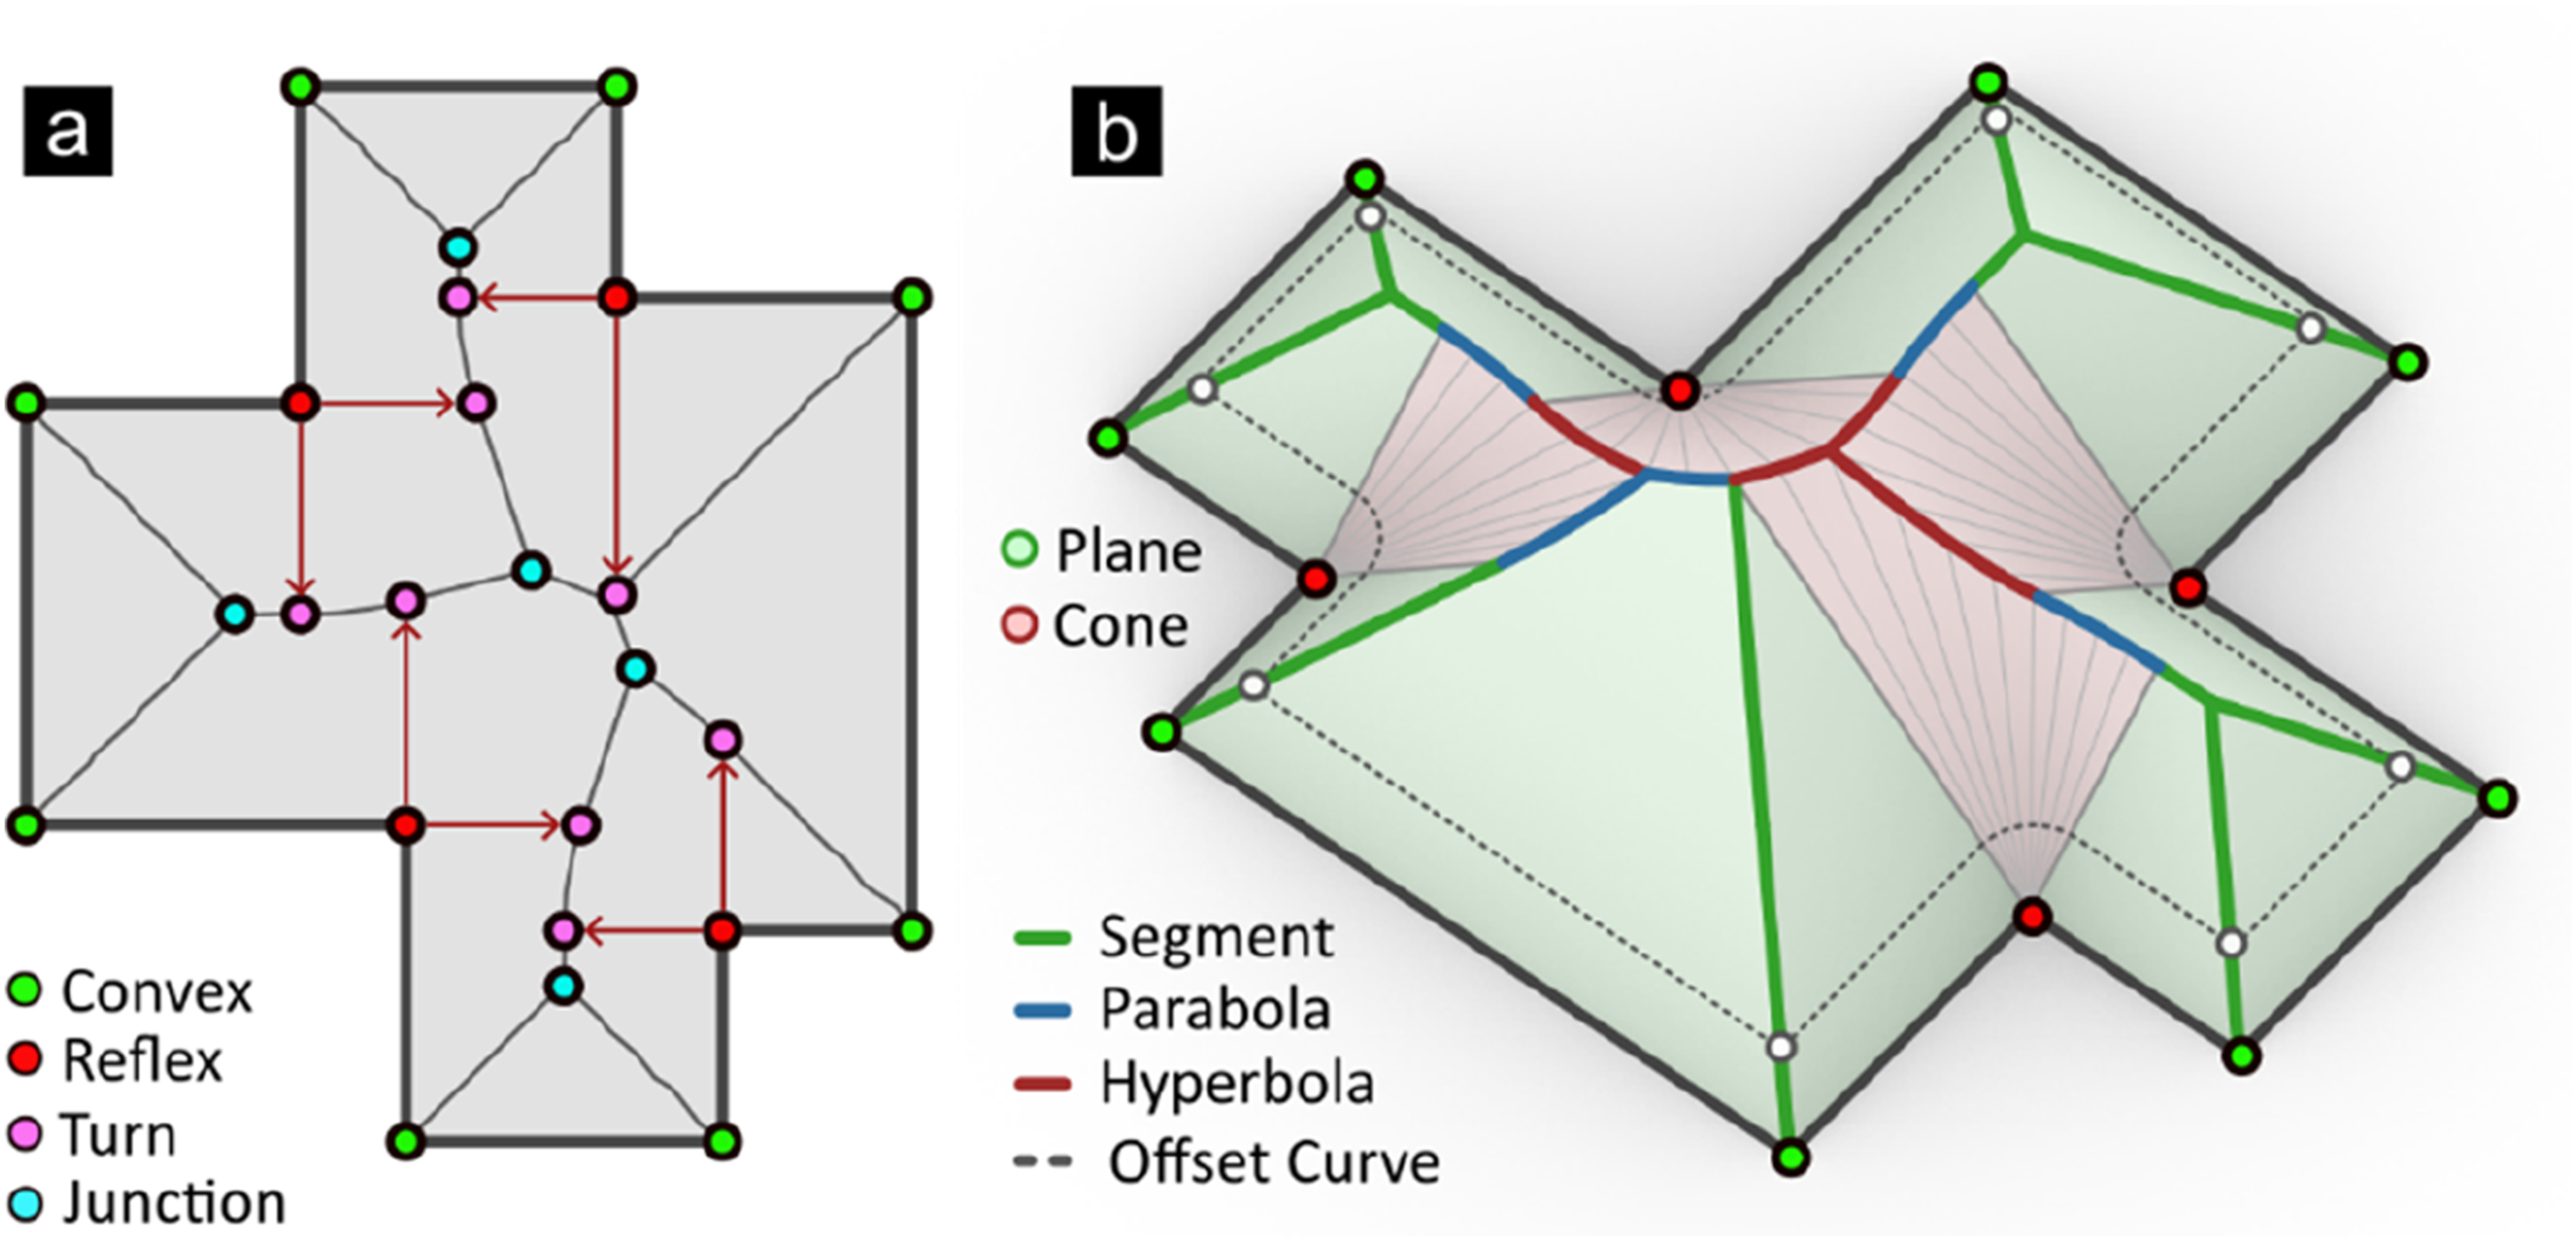
The MAT’s edges are rationalized by computing the set-intersections between the associated polygon points and segments of its source and target nodes. Edges are classified as being the result of the following events: (a) Plane-Plane intersection, for two common segments and no common reflex point, (b) Plane-Cone intersection, for one common segment and one reflex point, and (c) Cone-Cone intersection, for two common reflex points and no common segment. An exact analytical conic section is associated with each edge, namely a line
Semantic classification
The objective of the procedures performed in this section is to overcome the challenge of filtering the MAT graph’s edges for being salient or otherwise and to attach circulatory semantics to its nodes and edges. The sensitivity and stability of MAT graphs 29 as well as edge filtering strategies 30 have been investigated extensively in the past but with no conclusive results as per the criterion31,32 that can classify the MAT’s edges. Both tasks are approached here by leveraging geometric and topological features of the graph which are associated naturally with spatial and circulatory concepts.
Initially, graph edges are split at points that fall below a minimum accessibility threshold, namely the radius which expresses the smallest distance from a spatial boundary a person can be physically situated. In relevant studies 1 and building codes for fire precaution, 34 this threshold is typically 0.3 m or 0.4 m. These nodes represent global graph minima and semantically remote locations within the plan, which may be used for egress analysis. Subsequently, accesses are incorporated in the graph by the intersection of its edges with planes situated at the middle of each access and normal vectors derived from the associated walls (Figure S2).
Horizontal edges, where their nodes’ elevations are equal up to tolerance, are special because they represent plateaus where the radius remains constant. They are the result of pairs of polygon segments that are parallel, and they may be associated with corridor-like structures. However, not all horizontal line segments are corridors because some segments are artifacts of wall-ends and additionally curved corridors are comprised of small segments and parabolic arcs. Hyperbolic arcs in 2D views of the MAT are conflated with linear segments because Cone-Cone intersections always take place within vertical planes, thus their projected images appear linear. However, in 3D the vertices of hyperbolas, the points where
Edges containing remote, access, plateau, and valley nodes, are temporarily removed resulting in several disconnected graph components. For each component, the maximal radius node is labeled as salient because it represents the largest most central location of the space locally. The original graph is thereafter pruned by temporarily discarding paths from each leaf node up to the first junction encountered, as long as they don’t contain the salient nodes and edges previously identified. Removal is performed recursively until no edges can be further eliminated. This is because subtle polygon features, such as wall-column penetrations, produce irrelevant nested branches. Bottom-up branch removal also ensures that circulatory cycles are retained. Finally, edges that have not been labeled as either salient or temporarily discarded are classified as linkways for playing a secondary role within the graph connecting salient locations (Figure 6). (a) Insertion of access and remote nodes. (b) Detection of plateaus and valleys. (c) Peak detection and graph segmentation. (d) Edges that do not contain salient nodes are marked as discarded while the remaining are labeled as linkways.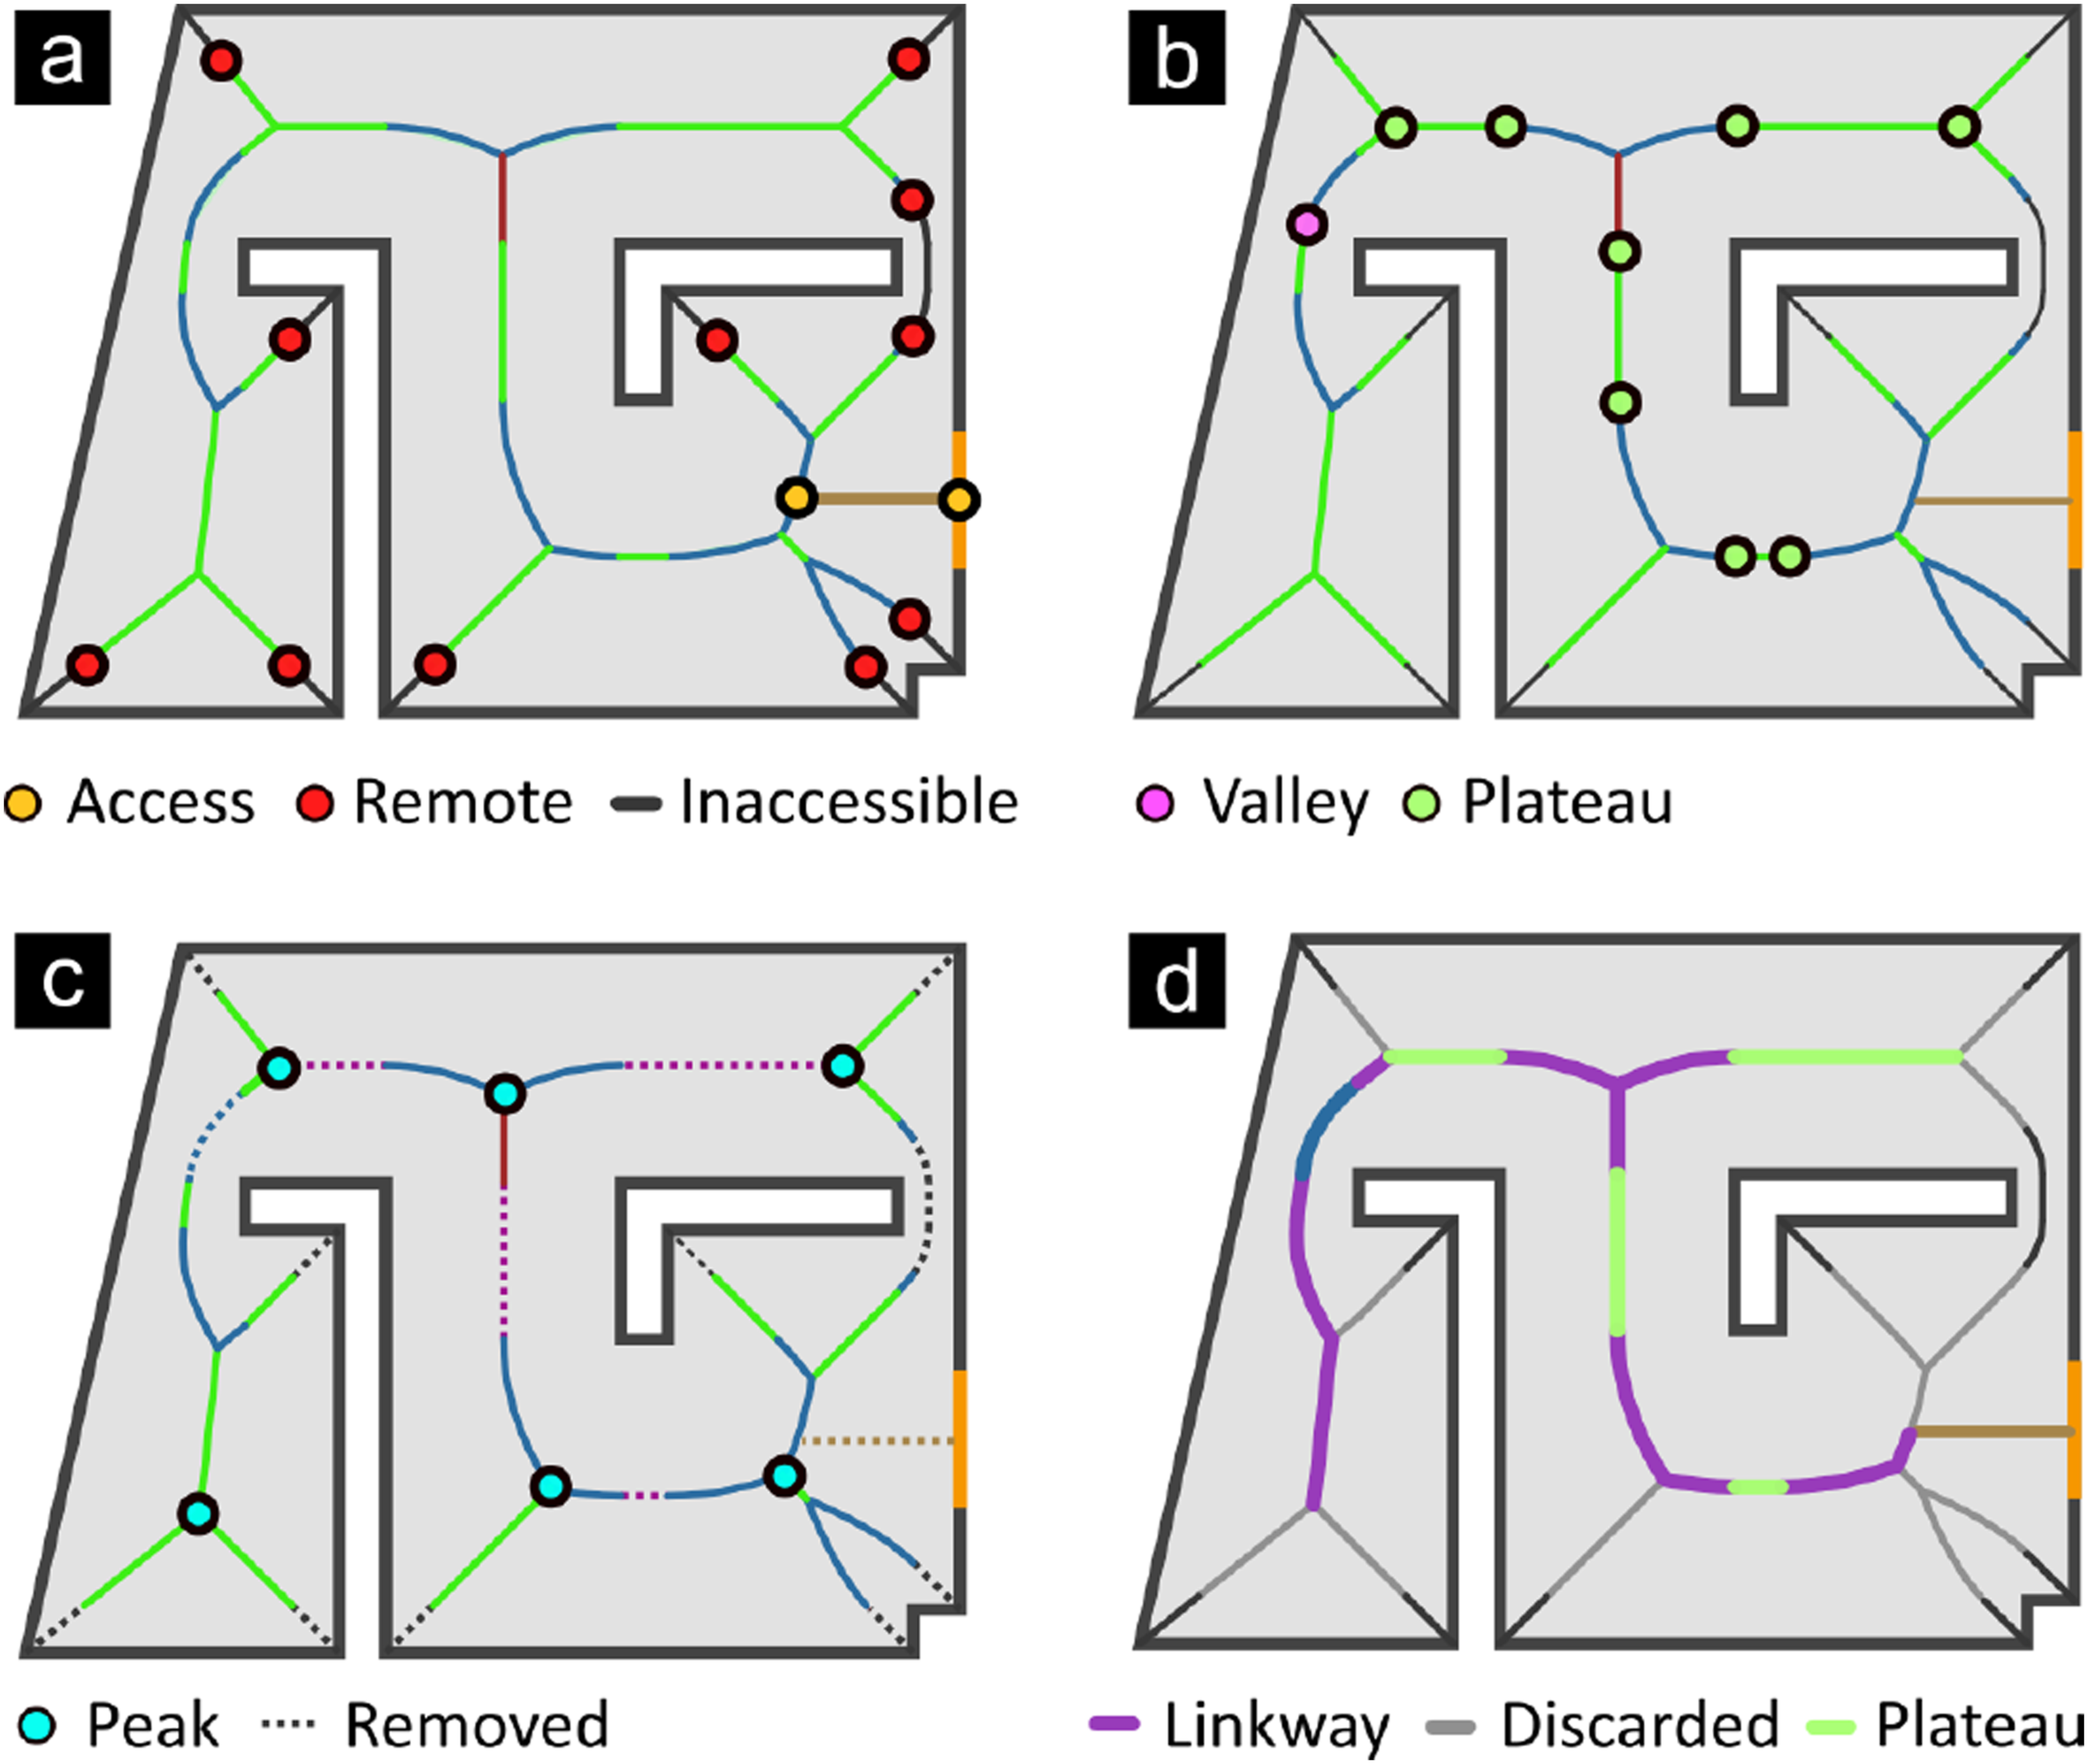
Peripheral pathways
A fundamental attribute of the graphs produced by skeletonization is that they force pathfinding through the middle of spaces. This works well for corridor-shaped spaces, but it results in awkward routes when encountering lobbies, concourses, and generally open urban spaces. Intuitively the objective of the procedures presented below is to introduce a series of peripheral pathways to overcome this problem. This may appear as simple as introducing parallel routes at a constant distance from spatial boundaries by exploiting the MAT’s structure encoding all possible polygon offsets. However, this yields unsatisfactory results because it produces unnecessary routes indiscriminately because corridors do not always have the same width (Figure 7). Conceptually, the aim is to provide peripheral routes for polygonal segments that are unrepresented, in the sense that there is no associated corridor to them, thus forcing motions through the middle of the space. Geometrically, this may be considered as a variable distance offset of the spatial polygon or equivalently a traversal of the MAT’s roof surface between points that do not follow its ridge line. Plan where several corridors encounter an open space causing awkward paths through its center. Using a parallel offset as a peripheral pathway is not effective because the corridors have different widths and not all polygon segments are equally important.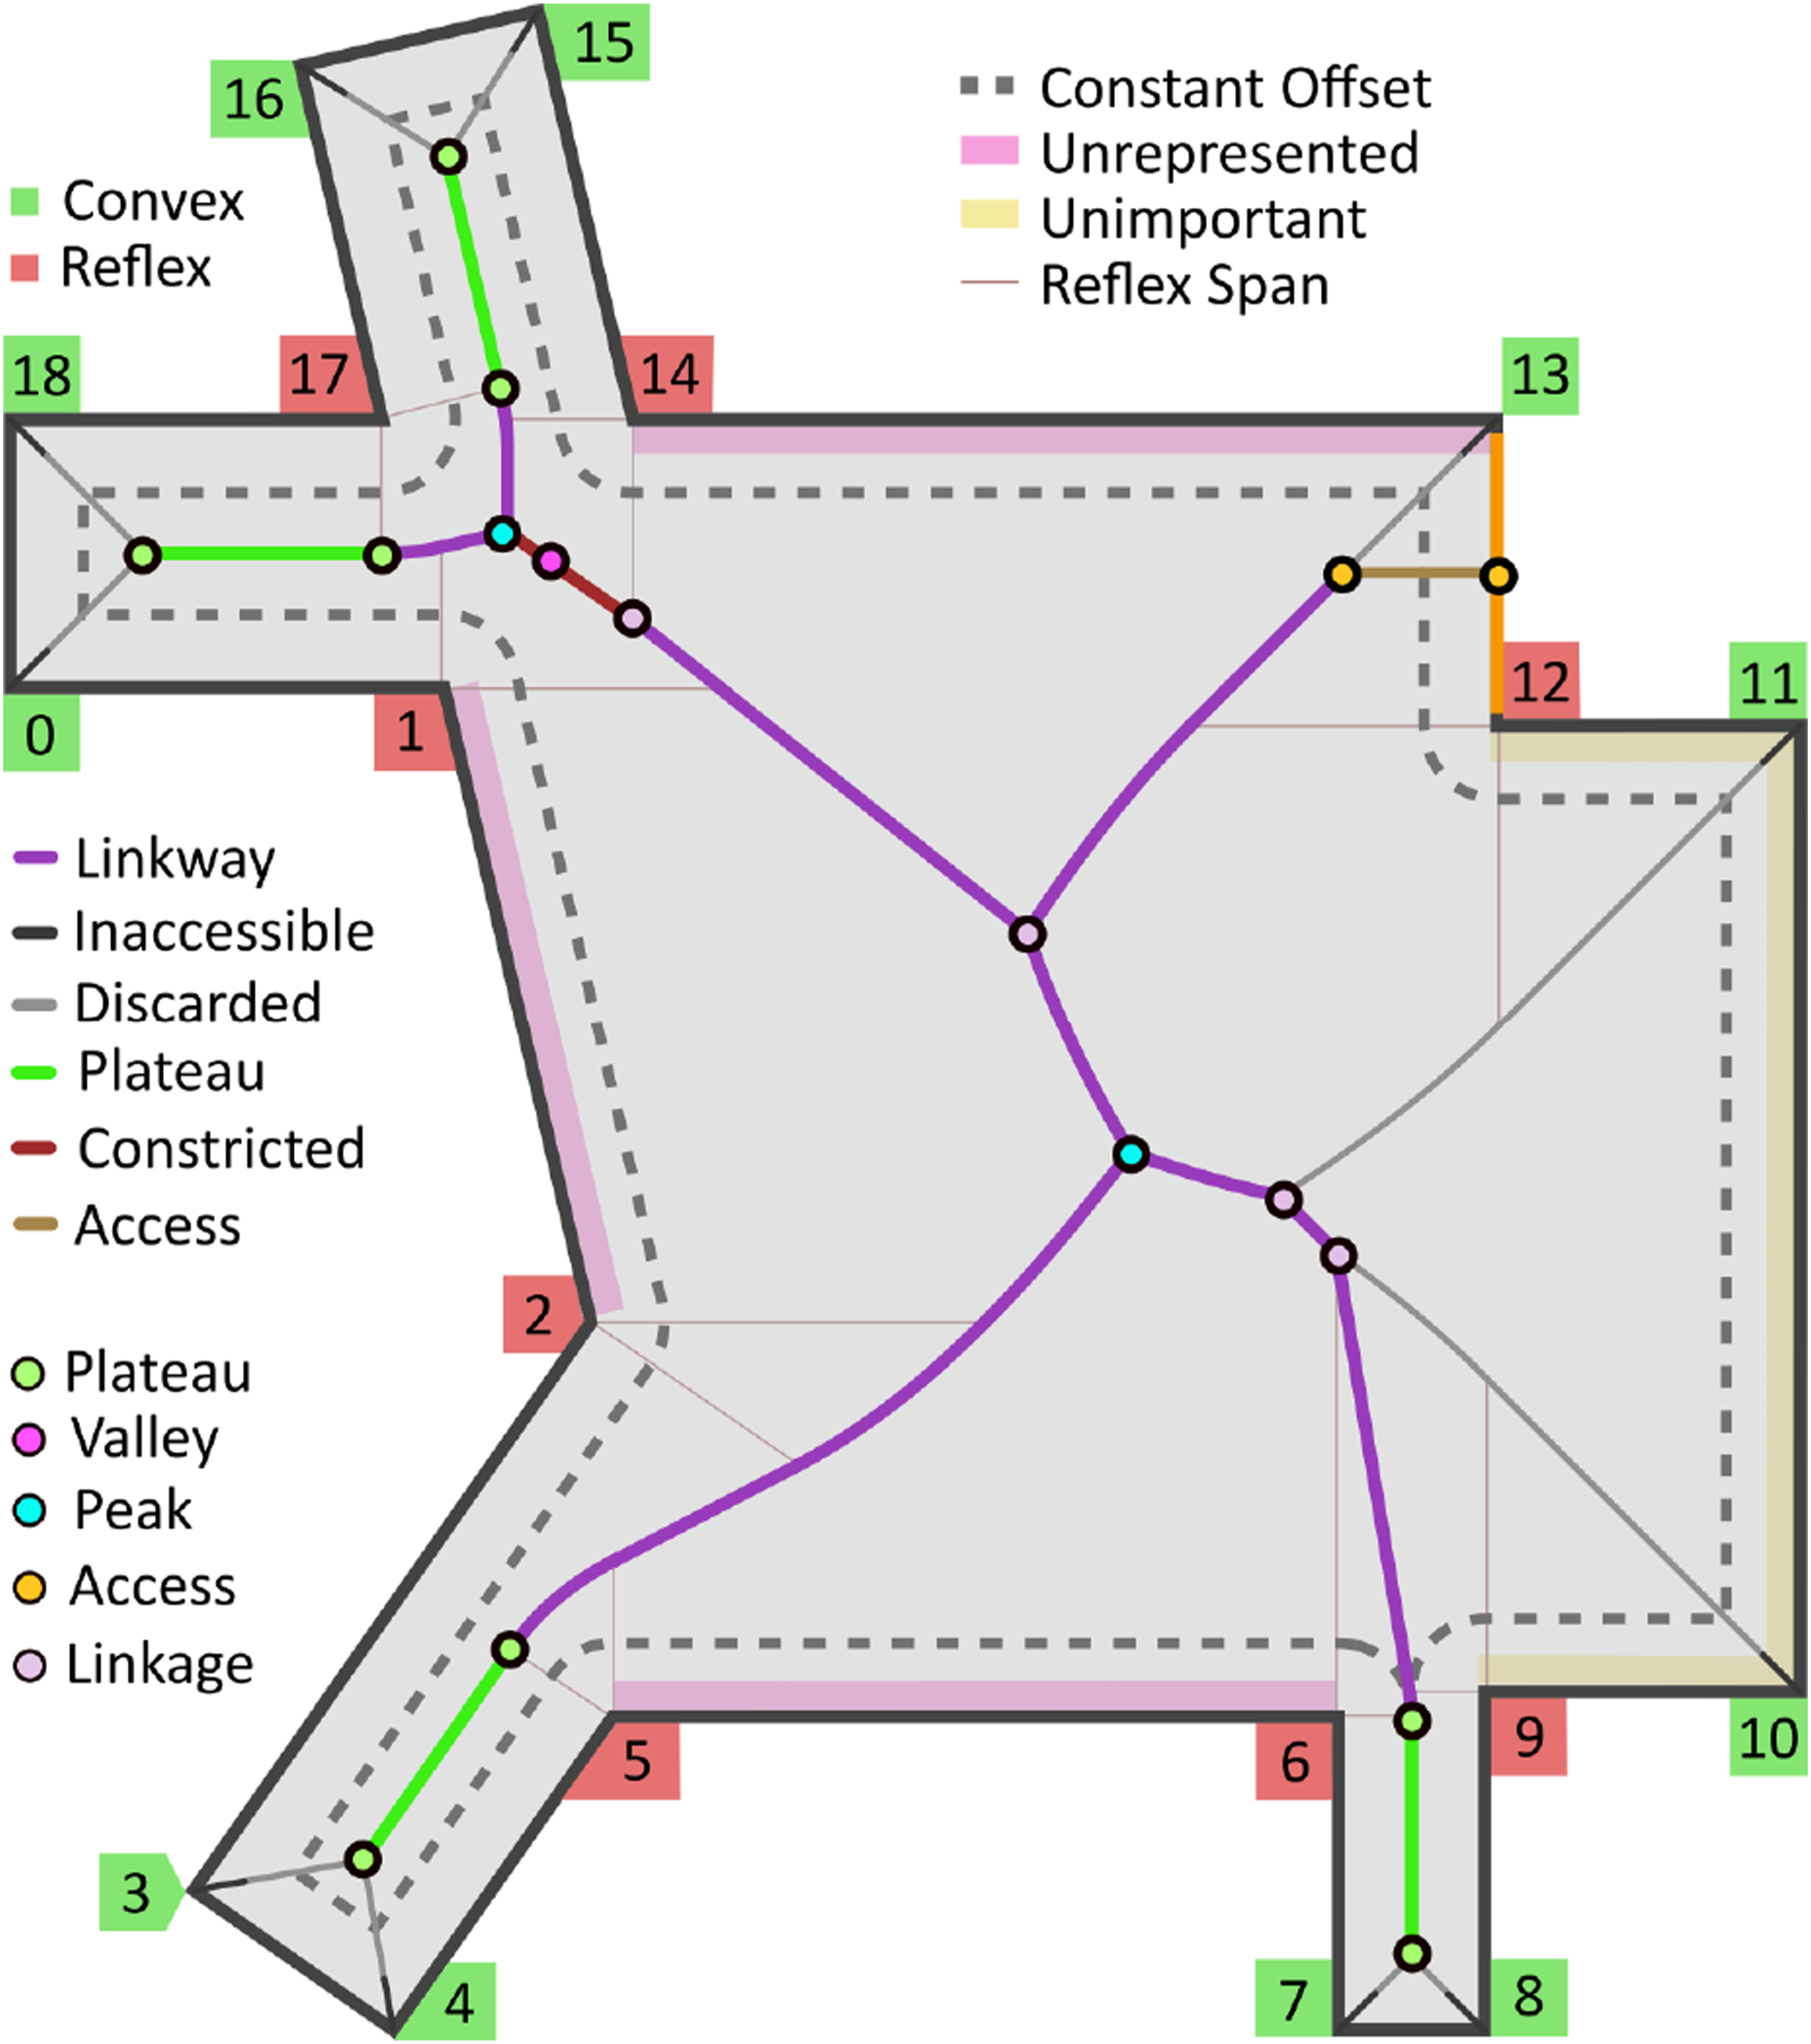
Computationally, this operation is performed by traversing each polygonal loop, clockwise for the exterior and counterclockwise for interior loops, while collecting the associated graph nodes visited. Each graph’s edge is visited exactly twice capturing the bidirectional, or undirected, nature of the graph. The sequence of radii is then examined as a cyclic signal whose local minima and maxima are used to segment it into spans. Specifically, a span is a sequence of nodes starting and ending at a plateau, access, or valley node, and it contains a peak node (Figure 8). Conceptually, spans represent candidates for shortcut edges, where the associated local maximum may be bypassed thus avoiding motions through the local subspace center. Spans that contain all edges of a loop, which often occur around columns, may be ignored. Furthermore, spans are inserted into a directed graph and its cycles are analyzed. A span cycle with two edges implies an equal number of alternative peripheral routes for which one is often longer than another and thus superfluous. Span cycles with three edges often occur when three spaces meet (Figure 8). In these cases, it may be meaningful to either ignore the span cycle or remove the MAT’s edges within the interior of the cycle. Finally, it is possible to render part of the original graph’s edges as irrelevant when a peripheral route produces a shortcut where its lateral medial route contains edges with only junctions to unimportant branches. For cycles with more than three spans, we may consider the contained medial edges as diagonals cutting across the spatial zone, while spans define peripheral pathways. (a) Visual representation of peripheral spans and the cycles formed by consecutive spans. (b) Node radius along the polygon’s loop. Spans are detected by identifying low-high-low sequences, where low is the start or end of a plateau, a constriction or an access node, and high is a locally maximum node.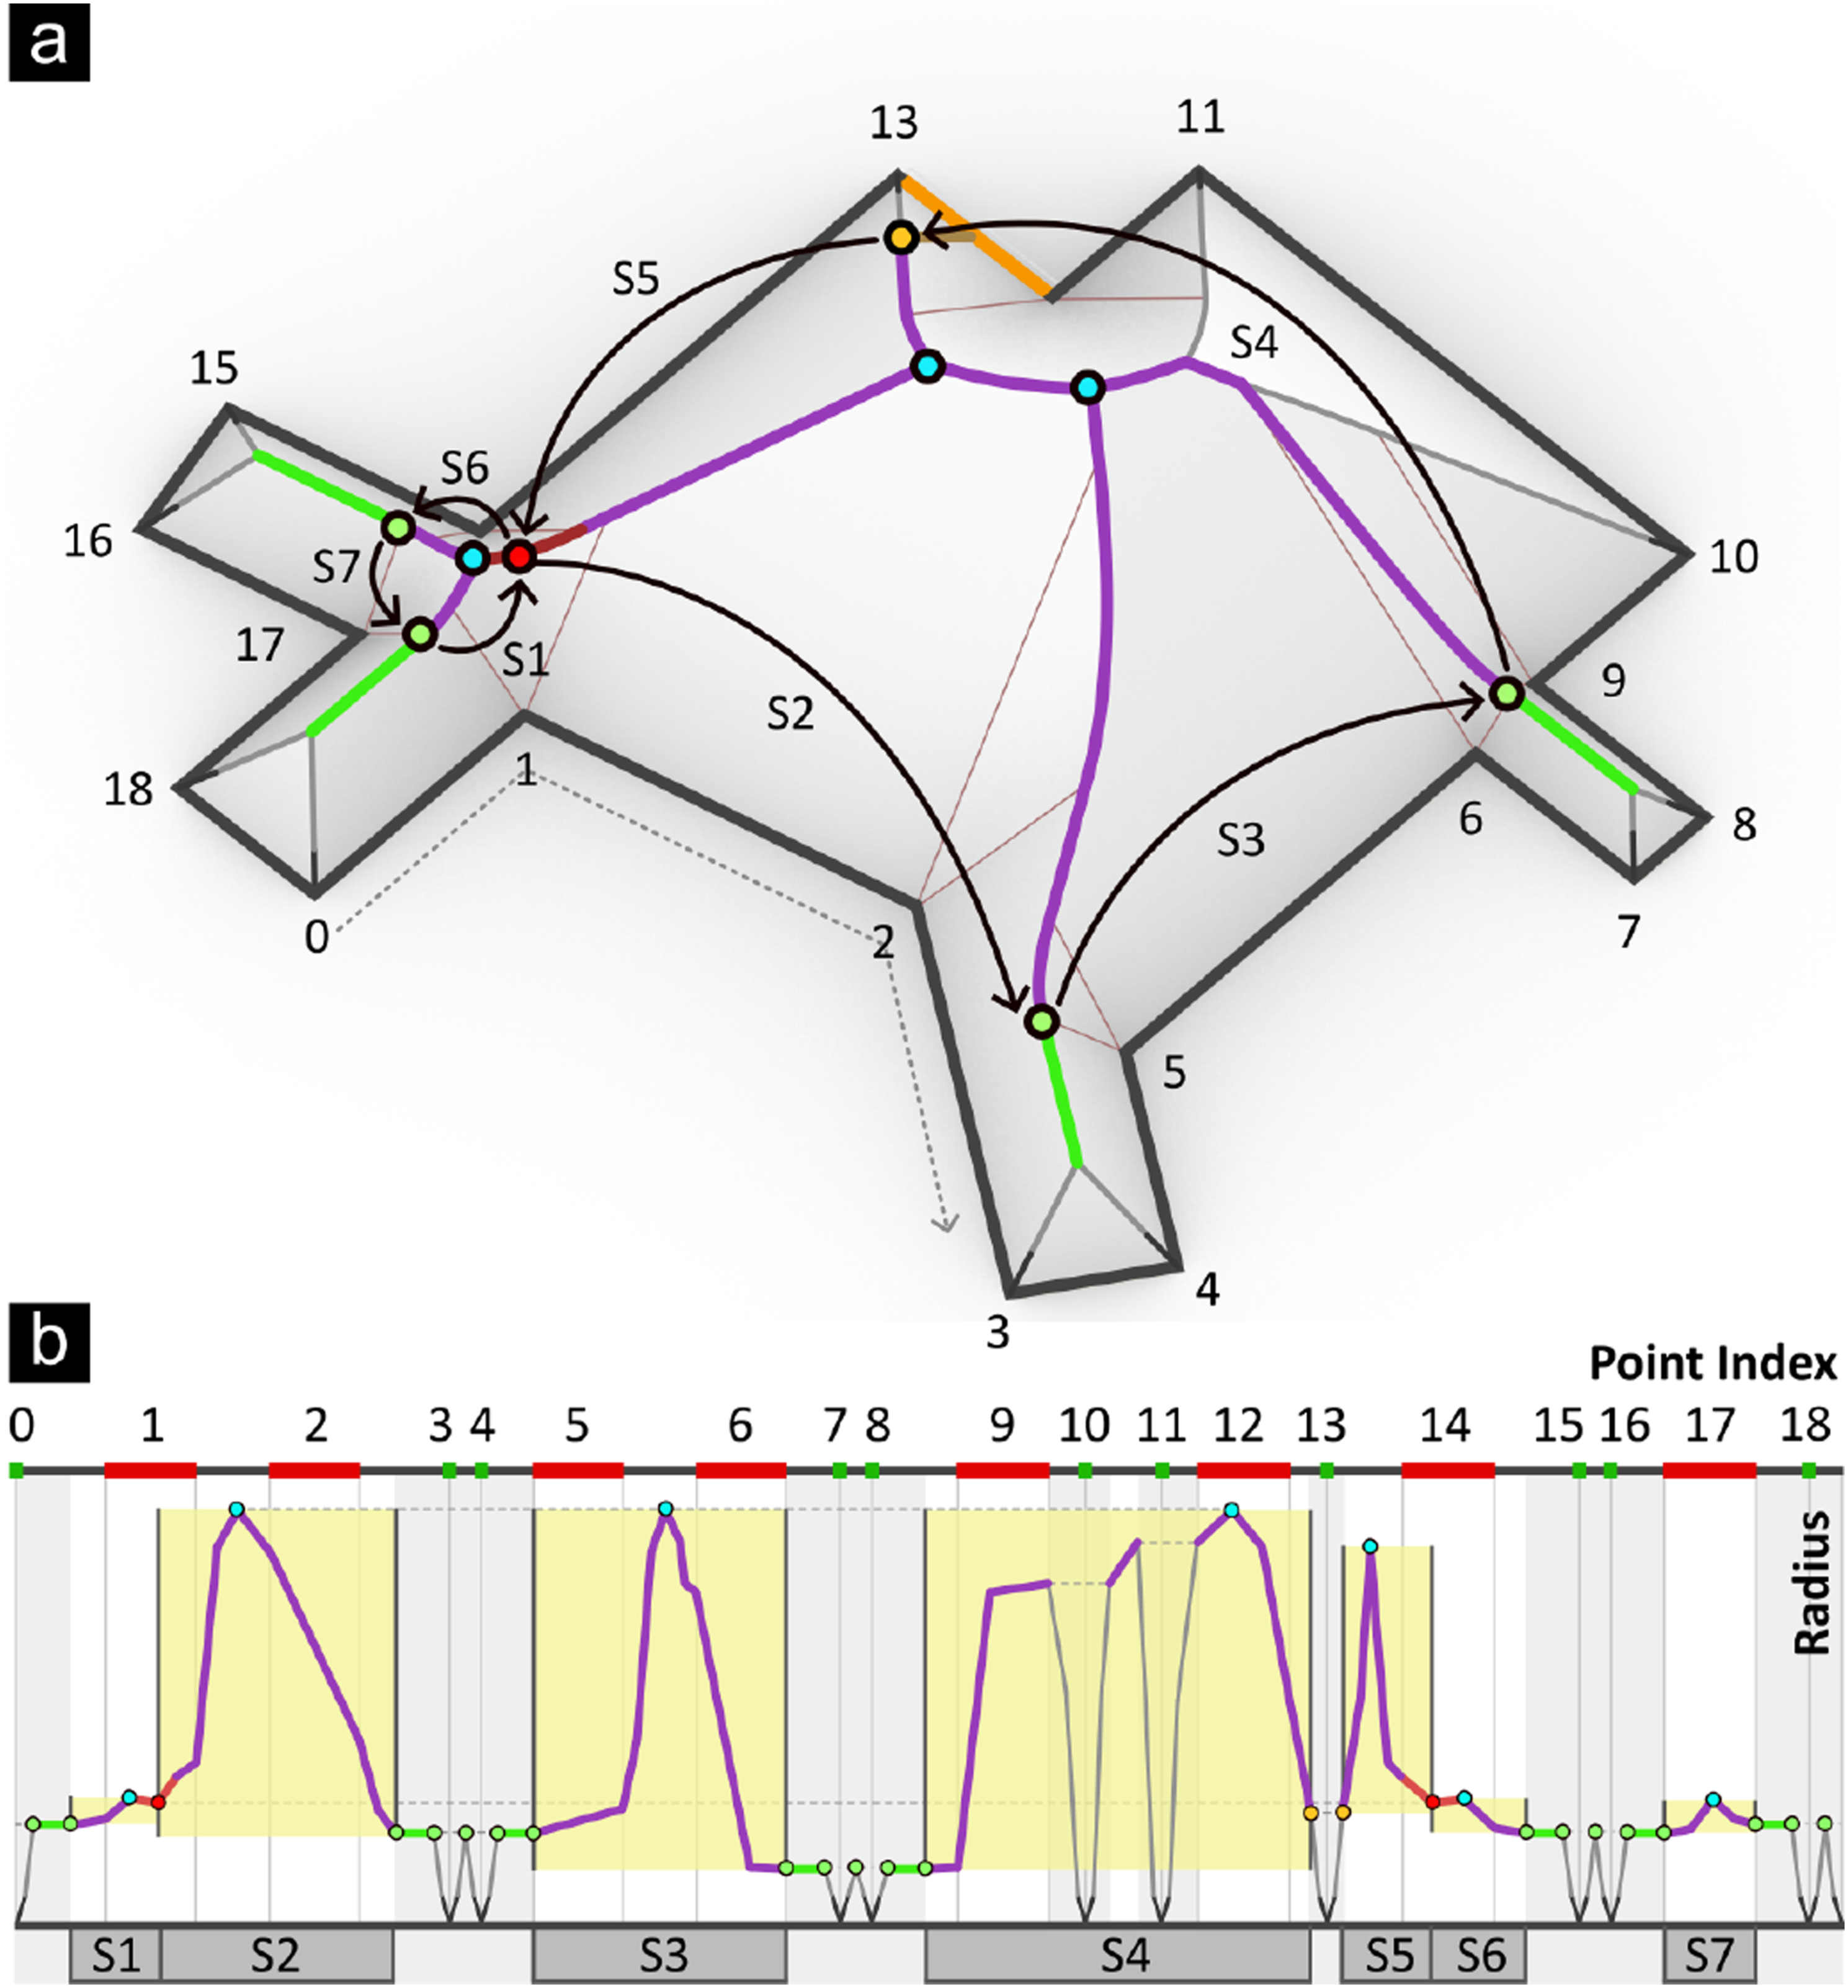
The last operation performed translates peripheral spans into geometric entities. The natural approach in the sense of being faithful to the MAT’s structure is to traverse its surface in the geodesic sense. Another option is to route peripheral pathways in a circulatory-efficient sense by restraining the route within the surface but minimizing the in-plane distance traveled. Both approaches are handled here in the same manner, where each span’s node location is projected onto its associated polygon’s segment or reflex point forming a set of linear rails (Figure S4). The LBFGSB 35 optimization method is used to trace paths among consecutive rails. Its input is a vector of parameters along the rails and its output, or cost, is the sum of the piece-wise edge lengths. Optimization constraints are encoded as domain bounds. All rails’ domains are bounded below by the minimum of the span’s source and target nodes’ radii, to prevent routes from hugging walls and turning tightly around corners, or in other words to interpolate between the span’s source and target distances from the boundary. In addition, upper bounds are applied for parabolic segments within planar patches to prevent the route from intersecting the MAT’s ridges. Only routes that encounter discarded edges may cross the ridge line. Finally, routes connecting adjacent accesses are constrained such that the paths generated are parallel to the boundary.
Results and discussion
Evaluation of the method presented was performed by analysis of a university campus student and faculty housing master plan (Figure 9). The parcel contains five residential buildings featuring open layouts at the ground level, as well as an extensive outdoor pedestrian network. In total 790 spatial polygons covering an area of 15,972 m2 and perimeter of 9,714m were analyzed, requiring 55sec to generate all relevant graphs, on an Intel i9-12700K CPU. Computationally the most time-consuming process is the derivation of the MAT graph using the Voronoi method. There exist more efficient algorithms available36–38 that may be employed. Nevertheless, processing is trivial to parallelize as each spatial graph can be computed independently before consolidation. (a) Complete and compact graphs for the residential block at level 3. (b) Compacted graph for the residential block at level 1. (c) Peripheral edges recover straight routes along arcade colonnades. (d) Peripheral routes around complex intersections override medial edges. (e) The junction between three curved walkways renders medial edges unnecessary. (f) The peripheral edge bypasses the waiting area along the walkway. (h) Peripheral routes bypass local space enlargements providing straight continuations.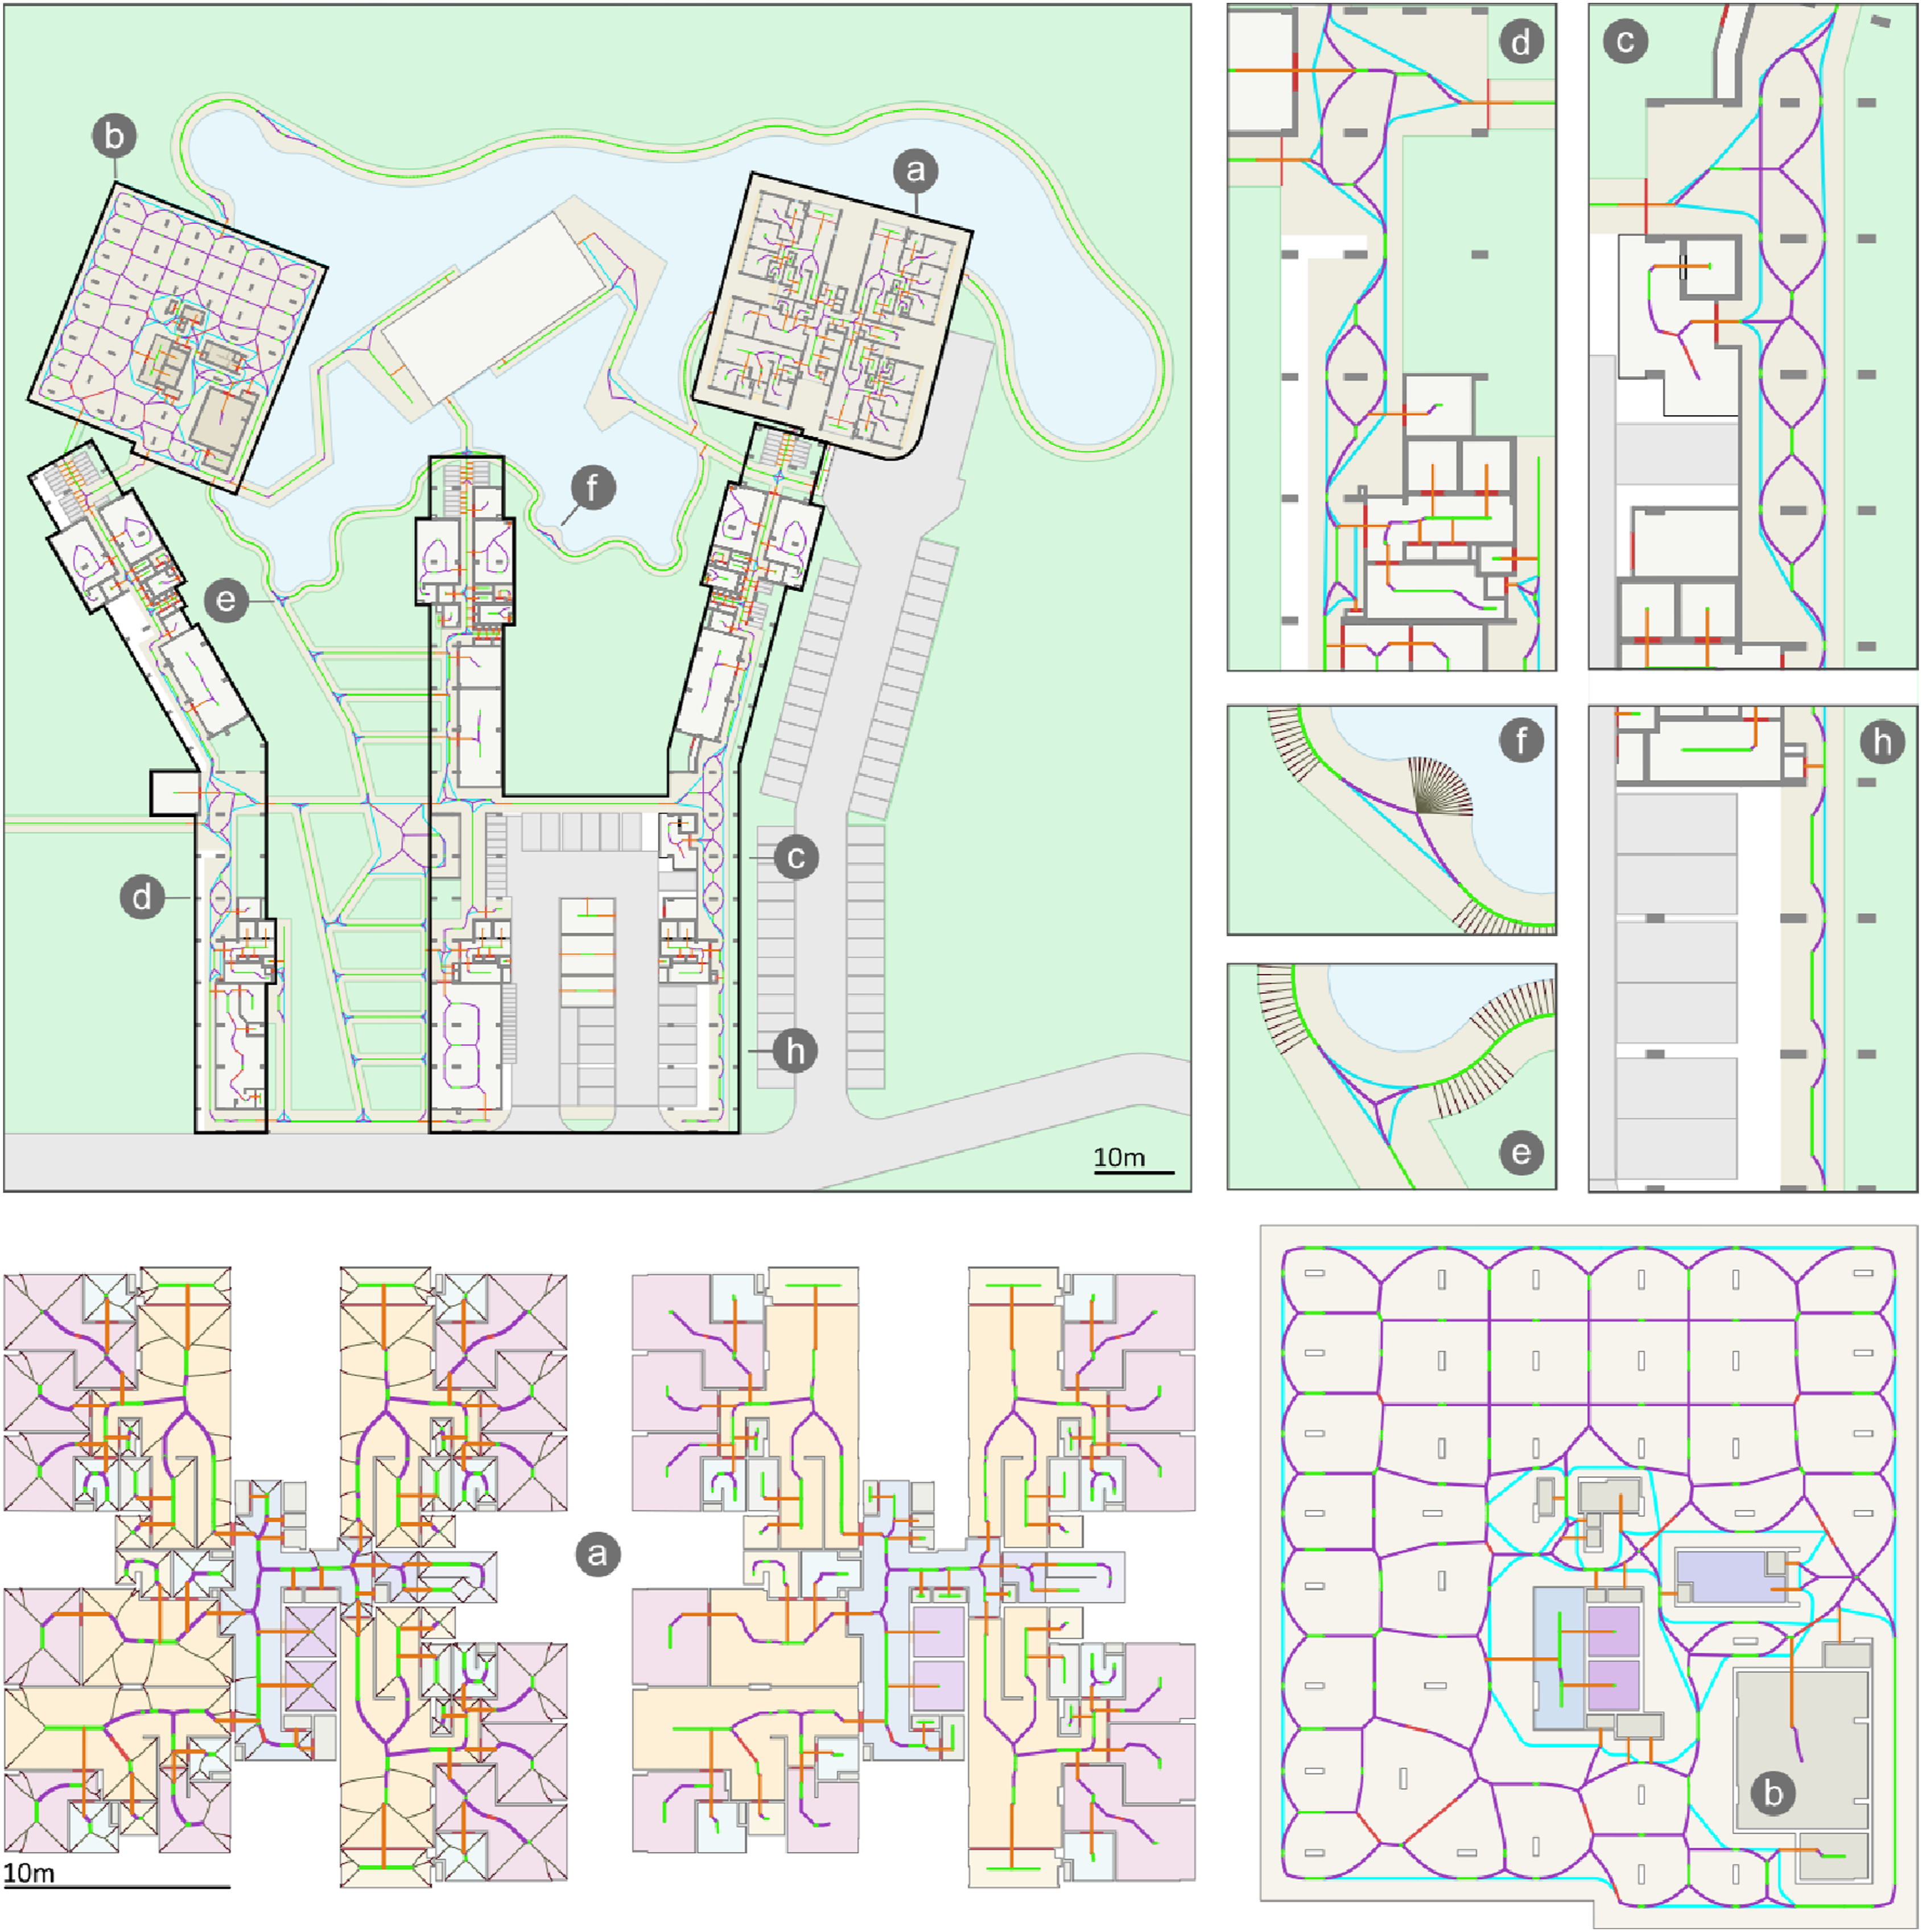
Overall, the results are satisfactory in the sense that all networks generated are reasonable and overcome the shortcomings of skeletonization methods. The algorithm produced compact graphs, by removing irrelevant edges, capturing essential features of the spatial structure. The acyclic versus highly circuitous graphs of the residential block, at the upper and ground levels, are highly indicative (Figure 9(a) and (b)). Furthermore, the method performs well even with free-form geometries, something that has not been explored by relevant work in the past, generating continuous shortcuts both across junctions and waiting areas along the curved outdoor paths (Figure 9(e) and (f)). Undulating routes around arcades’ columns were bridged by straight segments creating the logically expected continuations (Figure 9(c) and (h)). Compared with alternative graph representations, the P-MAT networks contain no overlapping edges and provide not merely positional and topological features but also spatial. This is because the graph’s edges are analytical 3D curves whose Z-component expresses the maximal circle’s radius from the nearest spatial boundary. It is therefore trivial to compute a local spatial capacity characteristic for each point of the graph including positions along peripheral pathways. Several aspects may be further improved to address some issues as well as exploit some interesting opportunities highlighted by examining such a vast campus network.
While the method removes irrelevant branches from the MAT graph, their impact on the remaining edges is still evident by small positional fluctuations. It may therefore be useful to perform additional edge simplification. Instead of retaining the exact ridge line of the MAT structure, we may employ the same surface geodesic routing method used for the peripheral network to connect exactly between junction nodes. An interesting opportunity arises when observing the peripheral network’s behavior around open or complex spaces. In many cases, it seems that the peripheral network becomes more dominant in the sense that it may render parts of the medial graph unnecessary. We may completely discard parts of the medial edges that are bypassed by the peripheral edges. This requires defining additional topological, geometric, and semantic rules for filtering. Finally, the classification and peripheral network analysis were primarily topological and semantic in the sense that no dimensional metrics were used, apart from the minimum accessible threshold. However, we observe that in some instances it would be meaningful to combine consecutive peripheral routes to obtain tighter routes around spatial boundaries. These observations suggest that while the MAT graph is useful, it may be that its role is potentially more appropriate as an underlying rather than a foreground structure.
Conclusions
We presented a method for generating circulatory graphs capturing geometric, topological, and semantic properties of the underlying spatial structure. Our approach proposes new concepts for graph classification, rationalization, and simplification of its nodes and edges. It generates graphs for non-corridor, free-form and open spaces which encompass the notions of central and peripheral circulation. The P-MAT networks present numerous opportunities for investigating the spatial and circulatory structure of the built environment, performing analyses related to indoor and urban mobility, regulatory code compliance, and functional performance assessment. Indicatively, the availability of local spatial capacity features enabled us to evaluate regulatory code compliance for both building and urban planning regulations 18 as well as to assess the potential problems arising from shared use of sidewalks by pedestrians, cyclists and ePDM users. 33 In conclusion, we look forward to further developing the P-MAT circulatory graphs and investigating their applications to architectural design and urban planning.
Supplemental Material
Supplemental Material - Spatial circulatory networks based on the peripheral medial axis transform
Supplemental Material for Spatial circulatory networks based on the peripheral medial axis transform by Stylianos Dritsas, Cheryl Lee Teng Teng and Khystelle Yeo Zi Yi in International Journal of Architectural Computing.
Footnotes
Acknowledgments
This research is supported by the National Research Foundation, Prime Minister’s Office, Singapore under its Cities of Tomorrow R&D Programme (COT-H1-2020-2). Any opinions, findings and conclusions or recommendations expressed in this material are those of the author(s) and do not reflect the views of National Research Foundation, Singapore and Ministry of National Development, Singapore.
Declaration of conflicting interests
The author(s) declared no potential conflicts of interest with respect to the research, authorship, and/or publication of this article.
Funding
The author(s) disclosed receipt of the following financial support for the research, authorship, and/or publication of this article: This work was supported by the National Research Foundation; COT-H1-2020-2.
Supplemental Material
Supplemental material for this article is available online.
References
Supplementary Material
Please find the following supplemental material available below.
For Open Access articles published under a Creative Commons License, all supplemental material carries the same license as the article it is associated with.
For non-Open Access articles published, all supplemental material carries a non-exclusive license, and permission requests for re-use of supplemental material or any part of supplemental material shall be sent directly to the copyright owner as specified in the copyright notice associated with the article.