
Abstract
This article elaborates a computationally enabled approach to the study of design methods in 1960s North America. This entails the construction, visualization, and analysis of a digital database built from entries of the Design Methods Group Newsletter, a periodical published monthly between 1966-71. The article proposes a workflow that combines methods such as topic modeling and network visualization to activate the Newsletter as a source of anecdotal and informal knowledge, and to enable histories of connectivity and transaction that may elude archival investigations on singular actors or institutions. In doing so, the article contributes arguments and techniques for the study of design methods as a complex social, technical, and intellectual meshwork. The meshwork brings discursive themes, techniques, actors, and institutions at the same level of investigation and allows for layered cartographies of the field that advanced the systematic study of design and ushered in the development of early computer applications.
Keywords
Introduction
Historical accounts of design studies and design research collectively acknowledge these fields’ historical ties to the movement of “design methods,” an influential endeavor that proliferated across sites of education and research in the 1960s.1–6 “Design methods” was an umbrella term that included diverse work on descriptions, analyses, formalizations, and theorizations of design across disciplines and contexts. With its key hubs in British and American research institutions, design methods recast design as a process—a sequence of actions and events—that could be studied as an academic subject.7–9 Method further suggested that these actions and events could be sequenced in pursuit of a goal or set of goals. Early activity in design methods was chiefly concerned with devising courses of actions and decisions for meeting certain functional and performance aims, drawing from lateral developments in engineering education that cast design as a process for setting and achieving far-reaching goals.10–13 In this pursuit, it engaged logical and mathematical procedures and it fostered some of the earliest applications of computers in design and architecture. 14 However, as the movement developed, and in the context of sociocultural transformations at the end of the 1960s, design methods shifted from a narrower commitment to scientificity and rationality to a methodological pluralism motivated by avid philosophical debates about the objects, subjects, and processes of design.15,16
The current article presents a new approach for the historical investigation of early design methods activity that focuses on connectivity, mobility, and transaction of individuals, concepts, and techniques within larger institutional landscapes. Our focus is specifically on the North American contingent of design methods, expressed primarily through the 1966-founded Design Methods Group. The historical study of design methods is important because it unveils the multiple and varied intellectual lineages of design research—a prolific area of investigation that is now the focus of many scholars, institutions, and publications—and because it historically served as a prime site for the development of formal and computational approaches to design. Early design methods activity provides rich ground for critically examining design’s flirtation with science, the specific meanings and formulations of “research” in their cultural and socio-technical dimensions in the decades following the Second World War, and the basal motivations for design’s entanglement with computational tools and concepts.
There is already a rich body of first-person accounts, retrospectives, and reflections provided by key interlocutors of the design methods movement.8,10,17 These accounts are complemented by wide-lens overviews or anthologies that interpret design methods as a phenomenon and pay tribute to some of its main figures and organizations.2,5,18 More recently, scholars have also pursued archivally based investigations in efforts to critically interpret the institutional and intellectual contexts that gave rise to the design methods movement.19–21 However, much of this emerging scholarship has focused on the examination of specific individuals or groups of actors operating within bounded institutional settings. This affords compelling specificity and narrative grain at the perhaps inevitable expense of discerning wider trends and trajectories of concepts and techniques. Our approach seeks to support the historical study of design methods as a social, technical, and intellectual phenomenon that spanned geographic and institutional boundaries.
We engage methods of digital history from the broad field of the digital humanities to activate an informal publication--a newsletter--that played a key role in connecting researchers across disciplines and institutions loosely aligned around their interest in “rational approaches to design.” 22 Though the periodical mostly circulated in North America, it also solicited submissions from researchers working in the UK and eventually internationally. The article begins by introducing our main corpus and archive: the Design Methods Group Newsletter, a periodical headquartered at the University of California, Berkeley, and published monthly between 1966 and 1971. We discuss the Newsletter’s format, historical context, and significance. We then present the methods we used to translate the Newsletter into a digital database. Drawing from methods such as topic modeling and network analysis in digital history, we advance an approach to querying the database and activating it for historical inquiry. Next, we demonstrate preliminary results from our methods and discuss their implications for historical work. The newsletter’s informality, we argue, enables tracing a field in formation, retrieves and safeguards anecdotal evidence, and renders it available for historical interpretation, representation, and analysis. By overlaying mobilities of concepts and techniques within a social network of actors situated within institutions, we generate a layered and interconnected meshwork that reflects the agile topologies of design methods at a time of remarkable intellectual energy and social urgency.
Context: Design Methods as viewed through the DMG Newsletter
The Design Methods Group or DMG was founded in June 1966 as a “loose coalition of people engaged in research or application of rational theories and methods of environmental design” [ 23 p. 1]. The DMG was the main design methods association in North America and figured as the sister organization of the Design Research Society or DRS, which was founded in the same year in the UK by the organizing committee of the 1962 Conference on Design Methods and other researchers who had embarked the design methods enterprise in the first half of the 1960s. 24 The DRS was founded with the interdisciplinary aim to “provide facilities for the exchange of new knowledge about the design process in engineering, industrial design, the graphic arts and all other creative disciplines.” 23 The DRS and the DMG were intimately linked from the onset, eventually publishing the joint journal Design Theories and Methods and sharing conferences.
Although British design methods have attracted scholarly interest, the history of the North American contingent remains more sparsely studied. This may be, to a degree, a result of a perception that design methods in North America did not share the theoretical concerns or interdisciplinary spirit of their British counterparts and that they were mostly characterized by a “pragmatic” outlook, oriented toward outputting functional computer programs. 25 The DMG grew out of conversations at the International Design and Planning Conference at the University of Waterloo. Themed “Computers in Design and Communication” the Waterloo conference was portrayed by its organizer Martin Krampen, a Professor of Design and Psychology at Waterloo and instructor at the Hochschule für Gestaltung in Ulm, as “the first design conference in which the speakers were not mainly designers but computer specialists.” 26 The foundational filiation of North American design methods with computer research was also reflected in the Waterloo Conference proceedings, co-edited by Krampen and graphic designer Peter Seitz and published both as a book and the impactful double issue of Design Quarterly “Design and the Computer.”26,27 In 1968, reacting to the narrower technical focus of the DMG and aspiring to a more holistic approach to environmental issues, members of the Group founded the still-active Environmental Design Research Association (EDRA). 28
This article’s focus is on an informal periodical produced and circulated by the DMG, which was nonetheless essential in connecting disparate research endeavors across different institutional sites and actively building a network of knowledge exchange. The DMG Newsletter, as the publication was called, was initially sponsored by the Center for Planning and Development Research and the Department of Architecture at the University of California, Berkeley College of Environmental Design and edited by faculty member Gary Moore [ 23 p. 2]. It solicited submissions by members of the DMG, but also served as a mechanism for expanding the group’s membership with “those actively involved in research or application of rational theories and methods of environmental design” [ 22 p. 5]. The first issue, for instance, included a list of DMG founding members, as well as their networks: people who had written to the DMG or otherwise come to its members’ attention [ 22 p. 5]. Membership could be acquired by directly contacting the DMG at Berkeley and cost $5 per year and members received the newsletter on the first week of each month and had until the third week of each month to submit content. The newsletter content included news, abstracts of research reports and papers, outlines of work in progress, reviews and criticisms, bibliographies of design methods, and computer program abstracts [ 22 pp. 1–2]. Members could request to receive publications mentioned in the newsletter by writing directly to their authors and including a stamped self-addressed return envelope [ 22 p. 2].
Because of its informality and presentation of in-progress research or even failures that did not make it into formal publications, the DMG Newsletter entries give access to the active, constructive, and situated processes of knowledge production and technology development. Scholars have made compelling arguments for the work that newsletters do in forging communities and creating networks, operating in some ways as a form of pre-digital inter-net. 29 Aligned with this view, we approach the DMG Newsletter as an important mechanism that helped build the design methods research network in North America and its international connections.
The DMG Newsletter is currently not easy to access—it is only available through a small number of university libraries. It is also difficult to navigate because of its density, frequency of publication, and fragmentary exposition. To activate this important document and make it available to scholars for further analysis, we begin by constructing a database from information that is explicitly presented in its entries. Each entry offers useful information about authors who self-enlisted in the DMG broader research community by submitting material to the Newsletter, the activities that they described, the institutions in which these took place, and the funding bodies that supported their endeavors. Individually, entries can be starting points for further historical investigation. Taken together, they can start mapping out an emerging network of research in its geographic and institutional expansion. Aside from enabling illuminating cartographies of design methods activity often constructed through this contingent document, the network is also amenable to analytic probing through computational tools.
In other words, the Newsletter is not only useful as a database that enables provisional cartographies of design methods activity in the form of maps and social networks. As a corpus—a term used in the digital humanities to suggest a collection of texts—the Newsletter also enables the application of quantitative text analysis methods that allow for the mining of key discursive threads and themes. We view these methods as an opportunity to activate the informational and statistical components of the Newsletter corpus. This allows for a new roster of investigations in which, for instance, informational aspects of the work such as metadata of entries foreground context over content and statistical aspects of the text lend themselves to the exploration of patterns of change and overall trends. Yet, these inquiries do not in themselves offer arguments or conclusions. 30 We take computational techniques for historical research as media that allow researchers to think through and with them along their critical inquiry. They allow modeling systems and investigating relationships based on specific research questions, offering generative avenues for exploration.31–33 The methods presented in the next section are motivated by these attitudes.
Methods: A digital history approach to the DMG Newsletter
Making the database
In recent years, the construction and online publication of accessible databases that connect actors, institutions, and concepts has been a productive area of investigation in design and architecture history. One well known example is Spatial Agency (spatialagency.net), which maps historical and contemporary participatory and community engagement methods under key thematic rubrics.34,35 Our approach to the database is distinct from similar projects, where the collection of information presented in the database is assembled by its authors. Our database takes the DMG Newsletter as its source and boundary, embracing the contingent and incomplete nature of its content. Creating a database from the DMG Newsletter involved moving from a periodical in a printed form where entries are presented in a linear order to a structured digital format. This was not about digitizing the periodical’s entries but entailed choices of which informational fields to highlight and how to structure their connections. 36
We began by familiarizing ourselves with the Newsletter content to understand the entries’ structure and data elements. This preliminary reading helped identify recurring elements such as names, titles, publication dates, institutional affiliations, as well as determine some other implicit fields that seemed to characterize most entries, such as research intentions and techniques. The provisional data fields that we identified for each entry were entry type (news, abstracts, reviews, etcetera), actor (author/s), date (issue), institution (author affiliation/s), funding, intention, and technique. Entry types, actors, dates, institutions, and funding could be drawn directly from the entry while intentions and techniques were assigned by the research team based on certain recurrent keywords across entries (we will return to these assignments later in the section). Constructing the database required defining an Entity-Relationship Model (ER Model) as the data organization’s conceptual core.
37
Doing so required first, identifying the primary “entities,” data categories such as “author” or “institution.” Second, it involved attaching types of information to each entity that not only reflected information about the entity itself but also its types of connection, “relationship types,” with other entities.
37
These relationships can range from “one-to-many” or “many-to-many relationship type.” In our case, a “many-to-many” relationship exists between each entry in the DMG Newsletter and entities such as authors, institutions, or techniques. In other words, although each entry is singular, an entry can involve multiple authors, multiple institutions, and multiple techniques. The considerations of the ER model yielded the Entity-Relationship Diagram (ERD) shown in Figure 1. Here the objective was to define, for each entity, the appropriate data types to be represented in the database. We considered the type of data to be stored in each attribute, such as strings, dates, or numerical values. Entity-relationship diagram for the Design Methods Group Newsletter database (created by the authors).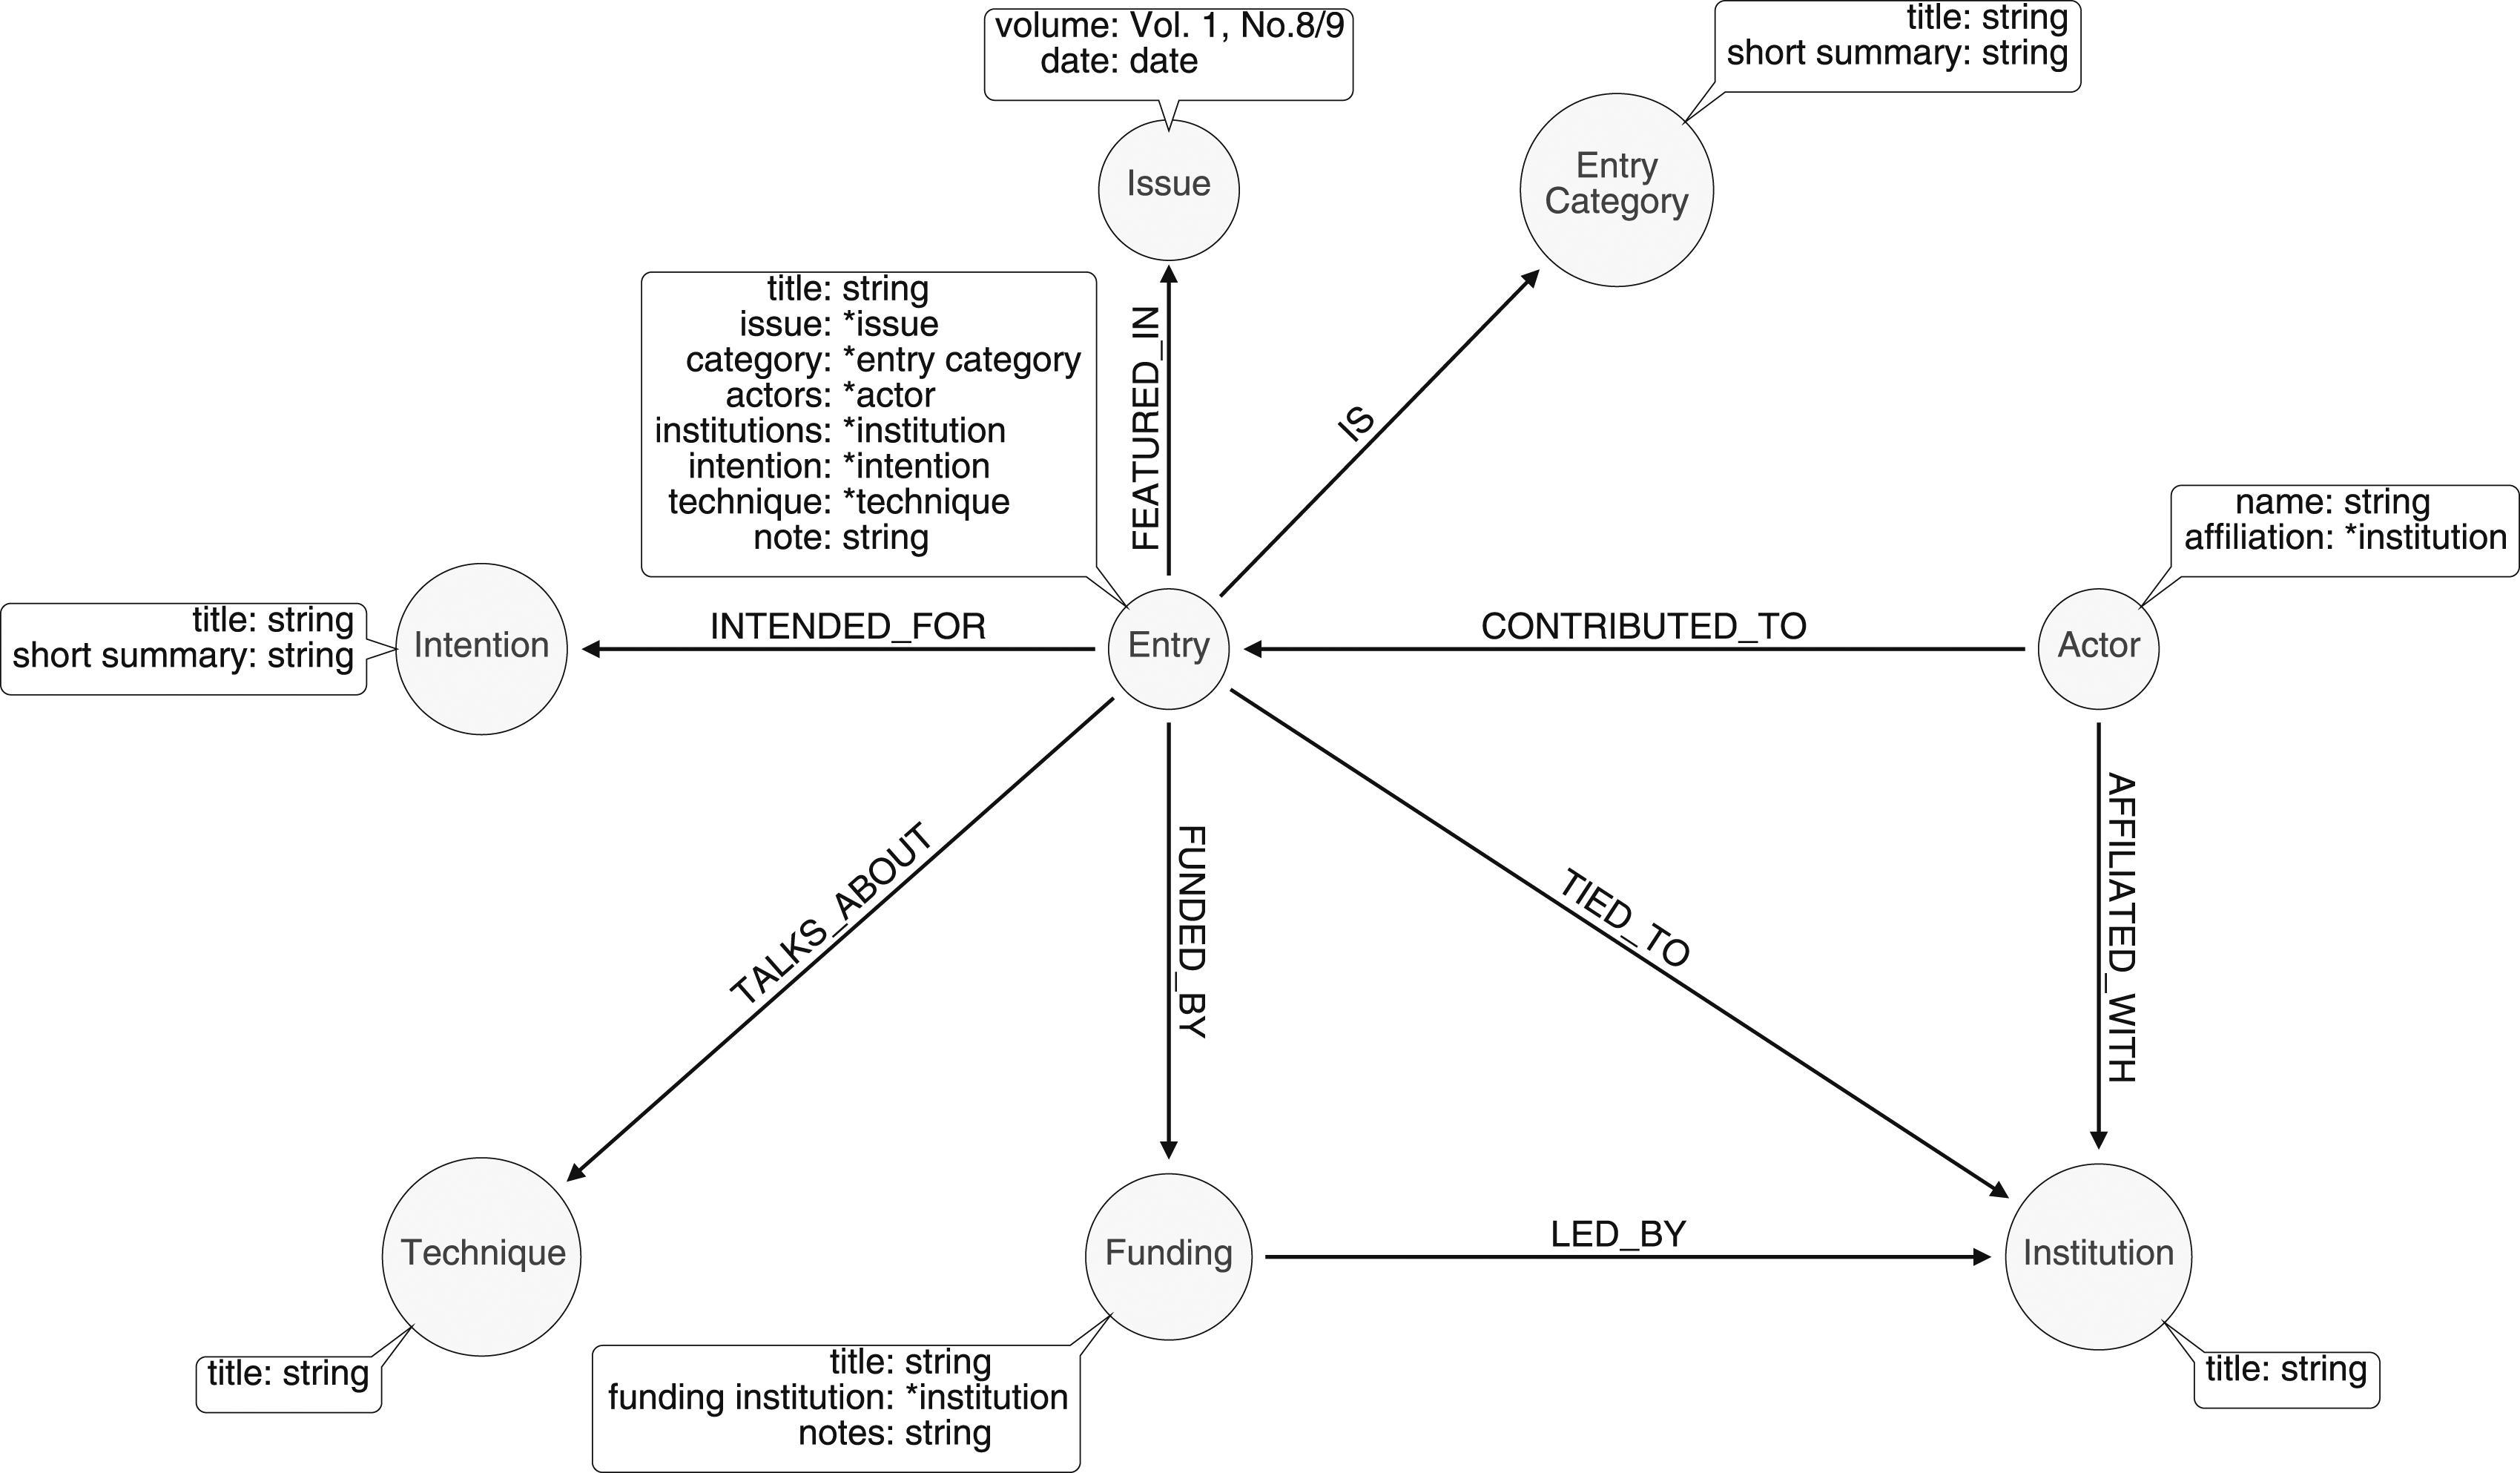
Based on this model of entities and relationships, we experimented with two distinct approaches to database construction: relational approaches and native graph approaches. In a relational database, one might have separate tables (CSVs or JSON files) for storing entities and others for representing relationships between those entities. In this case, the relationships are defined through an external index that links data between the tables. 38 This structure requires joining tables to traverse relationships and retrieve related data. On the other hand, in a native graph database, nodes and relationships are directly coded in the components of the database schema, meaning they are represented directly in the data model without the need for separate tables. Nodes are entities, and relationships represent the connections or associations between those entities. Each node and relationship can have its own set of properties to store additional information. Our first version of the database used an open-source Database Management System developed by the University of Sydney called Heurist. 39 Database Management Systems (DBMS) provide an infrastructure for storing and organizing data, which in the case of Heurist are chiefly qualitative. At its core, Heurist employs a relational database structure. We also experimented with Neo4j which is among the most popular native graph databases. 40 Neo4j is built for efficient traversal of relationships between entities in the database, as well as matching patterns and querying the database based on the inherent structure of the graph. Neo4j also provides its own query language called Cypher, which is specifically designed for working with graph data.
While Neo4j offered many benefits for creating a stable and searchable database of the DMG Newsletter, we moved forward with the relational approach. While scalable database infrastructures such as Neo4j are valuable in the long-term, the simplicity and agility of the relational approach, which relied on populating tables as opposed to coding graph nodes for each entity, appeared suitable for the size and scope of this research project. We used the knowledge base application Obsidian for its graph visualization capabilities and the coupling of the graph with a structure of text files or “notes” for each entity. 41 Obsidian uses a simple markdown-based linking system to establish bi-directional relationships between entities. It automatically translates these relationships into a “graph view” that visualizes connections between entries. Obsidian has the added benefit of treating nodes as notes that can be populated with text and images. This opened the prospect of producing an “augmented” version of the Newsletter in which all entities, not only “entries,” are populated with content. For example, an “author” entry could be populated by the research team or, crucially, by other users of the database with a biographical note, a library link indicating the location of their archives, a set of images, or a bibliography.
On a critical note, our decision to use a relational instead of a native graph approach to structuring the data may raise questions as to the long-term scalability of the graph. It also carries potential limitations around handling more complex relationships as we analyze larger parts of the Newsletter corpus or, if this workflow is adopted by other researchers, other corpora. While populating tables instead of coding graph nodes of each entity facilitates more expedient database creation, it could prevent serendipitous search queries in more complex relationships between entities. Furthermore, while using Obsidian for graph visualization and exploration provides an intuitive way of representing interconnections within the database, the system presents limitations in legibility and the ability to perform targeted queries when dealing with larger datasets. While the simplicity of the relational approach aligns well with the size and scope of the current project and the corpus that we are investigating, it may limit the potential for more advanced querying of complex relationship representations. A future step in the development of this research project is to explore hybrid approaches combining relational and graph database management systems to limit trade-offs between simplicity and scalability.
Creating the final Obsidian database involved exporting the Heurist tables into a JSON format and importing each entity (entry, author, institution, category, funding body, intention, and technique) as its own “note” into Obsidian. We then linked the “notes” together bi-directionally using custom scripts and plugins created by the Obsidian development community. The Entity-Relationship database structure we had developed lent itself well to the note-link structure of Obsidian graph visualization. Using a script-based workflow, we automated the translation of the entities (entries, authors, institutions, and techniques) as Obsidian notes (markdown.md files) and of their connections as links (wiki-linked through the .md files). Figure 2 shows the note for an entry, which includes links to related entities, and the “graph view” for this entry. The bi-directional linking means that clicking on an entry will show its authors, and vice versa, clicking on any of the authors nodes will show the corresponding entries. Markdown note and local graph view of one entry, which highlight the potential of the local search in revealing institutional, topical, and thematic alliances (created by the authors).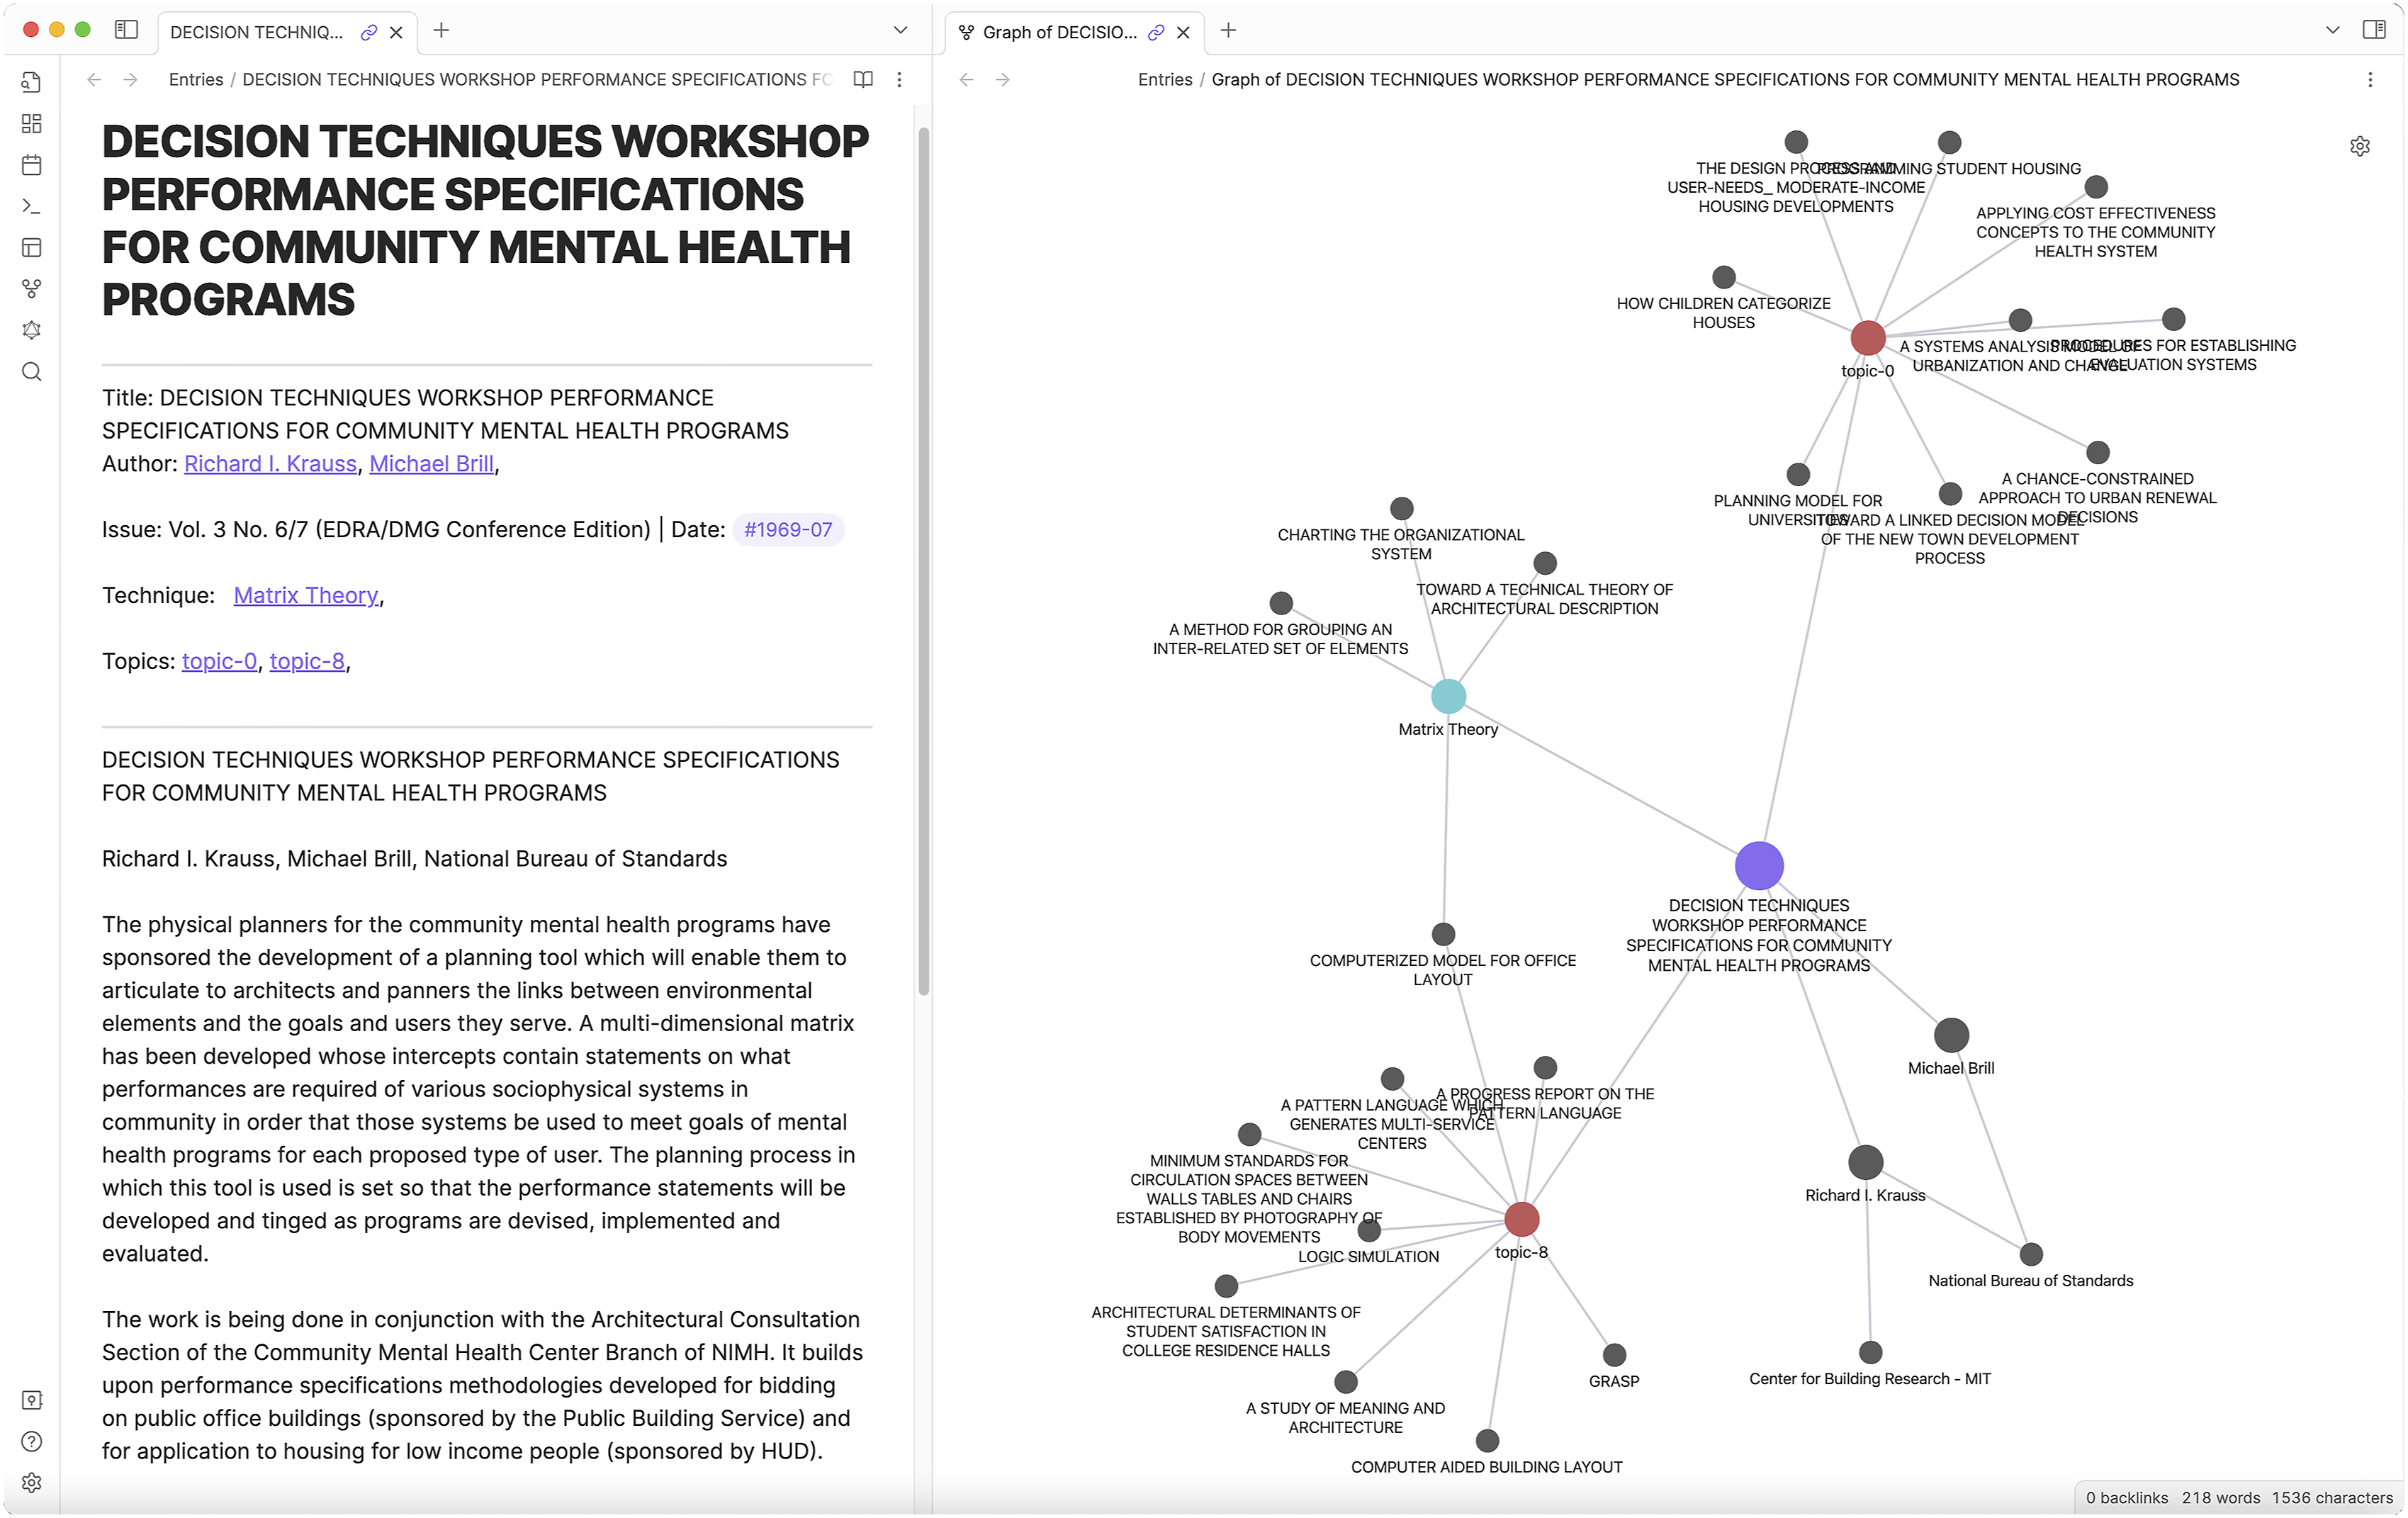
Our approach to querying the database can be summarized as graph visualization and exploration, distinct from language-based queries often employed in DBMS. After structuring the database and creating data sets from collections of entries, we leveraged the structured data to develop a graph visualization of larger aggregations of entries. Obsidian generates local graphs displaying a view of relations centered around a specific node as well as global graphs visualizing the entire network of connections. In the Obsidian “graph view,” the notes are represented as nodes and the links as edges. Through the process of visualizing the database as graph, it became evident that the nodes and links that derive from the entries’ bibliographic data alone (author, institution, and publication issue) did not directly generate a network of intellectual exchanges but rather a sparsely connected graph. On the other hand, the nodes that appeared instrumental in organizing and densifying the graph were the “techniques” and “intentions.” Derived from a qualitative reading of the entry’s textual content, these nodes represent the cultural and intellectual threads that activate connections between the Newsletter’s social network of actors and institutions.
Topic modeling and the meshwork
Initially, the important connective entities of “techniques” and “intentions” were assigned intuitively and manually through a process of reading the entries, noting recurring keywords, and trying to create some key categories from them. Examples of intentions we assigned manually were “economic planning” and “rational problem solving,” and of techniques “algorithmic optimization” and “hierarchical decomposition.” Motivated in part by a desire to compare our qualitative readings with quantitative analyses, we subjected the corpus of the DMG Newsletter entries to a text-mining analysis. Would a statistical analysis of the Newsletter corpus detect similar common threads linking the entries as the techniques and intentions we identified, or would they suggest completely new connections? Adapting a text-mining approach was also driven by questions of scalability of our method. As the research project was concerned with developing a methodology that mobilizes newsletter corpora to examine emerging disciplinary fields, we wanted to explore the potential of applying a distant reading approach to large corpora. 42
Aiming to find common themes across the Newsletter, we introduced topic modeling, a machine learning method that generates clusters of words that co-occur in a set of documents (in this case, the Newsletter corpus).43,44 These word groupings are called “topics” and broadly correspond to “categories of meaning.” 45 They are based on the assumption of distributional semantics—a core assumption of computational linguistics according to which a word’s meaning can be modelled computationally based on how often it occurs with other words in a given context [ 32 pp. 13–14, 66]. Considering this relationship between word location and meaning in the way topics are described computationally, a helpful way to think about topics is as “common places” [ 32 p. 68]. Topic modeling has been applied extensively in digital history to analyze thematic patterns of periodical corpora, among others, such as historical newspapers, professional periodicals, and special interest journals.46–49 Like the Newsletter, these corpora present an underutilized archival resource for historians as their large scale makes them difficult to grapple with. Topic modeling has proven to be particularly relevant for accessing these extensive textual resources.
We used topic modeling as a computational means for exploring emergent themes produced by the Newsletter. The method allowed us to map relations among the Newsletter entries based on word groupings (topics) that co-occur across them, as it assumes that the corpus contains a given set of topics and each entry exhibits multiple of these topics. 44 Topic modeling is a suggestive and open-ended text analysis method, rather than a definitive one, for two reasons. First, the process does not automatically generate labelled topics. Naming and characterizing topics is an interpretive process in its own right, up to the researchers, as topics can mean different things even in the same corpus: from conceptual frameworks (such as “systems theory”) to areas of application (such as “transportation” or “urban planning”) to common concerns (such as questions of design methods in architectural education). Second, as most topic models, the ready-made tool of the Gale Digital Scholar Lab platform based on an API-based implementation of the text analysis software MALLET we used builds on a probabilistic algorithm for topic modeling known as Latent Dirichlet allocation (LDA), first introduced in 2003.50,51 As a probabilistic process, it never produces the same results at each run, even if the document set and the tool settings remain the same. More contemporary approaches to topic modeling combine word embeddings with LDA, involving neural networks to represent words as vectors of other words based on a set of documents. 52 We consider using such approach in future work as we expect that it would produce more definitive groupings and interpretable word proximities compared to the probabilistic algorithm. However, for the pilot stage of our project that aimed to explore the potential of topic modeling as a method we moved forward with the Gale data analysis tool for its immediate accessibility. Ready-to-use data analysis tools are becoming increasingly available, often as extensions of digital libraries such as Gale and HathiTrust, or of bibliographic management software such as Zotero. Their introduction to humanities scholars’ reach has lowered the entry barrier to digital data analysis methods. We find that their increased accessibility makes them apt for the prototyping stages of workflows like ours and compensates for their limited capacity for fine-tuning based on specific project needs.
Our workflow was divided into three discrete steps: entry preparation, analysis, and graph integration (Figure 3). The entry preparation involved using OCR (Optic Character Recognition) software to digitize the newsletter issues, cleaning and saving text files (.txt) and tagging metadata for the author, date of publication, and entry type (e.g., review, research in progress, and abstract) for each file. Subsequently, for the analysis step, we used the Gale Digital Scholar Lab topic modeling tool to analyze the entries.
53
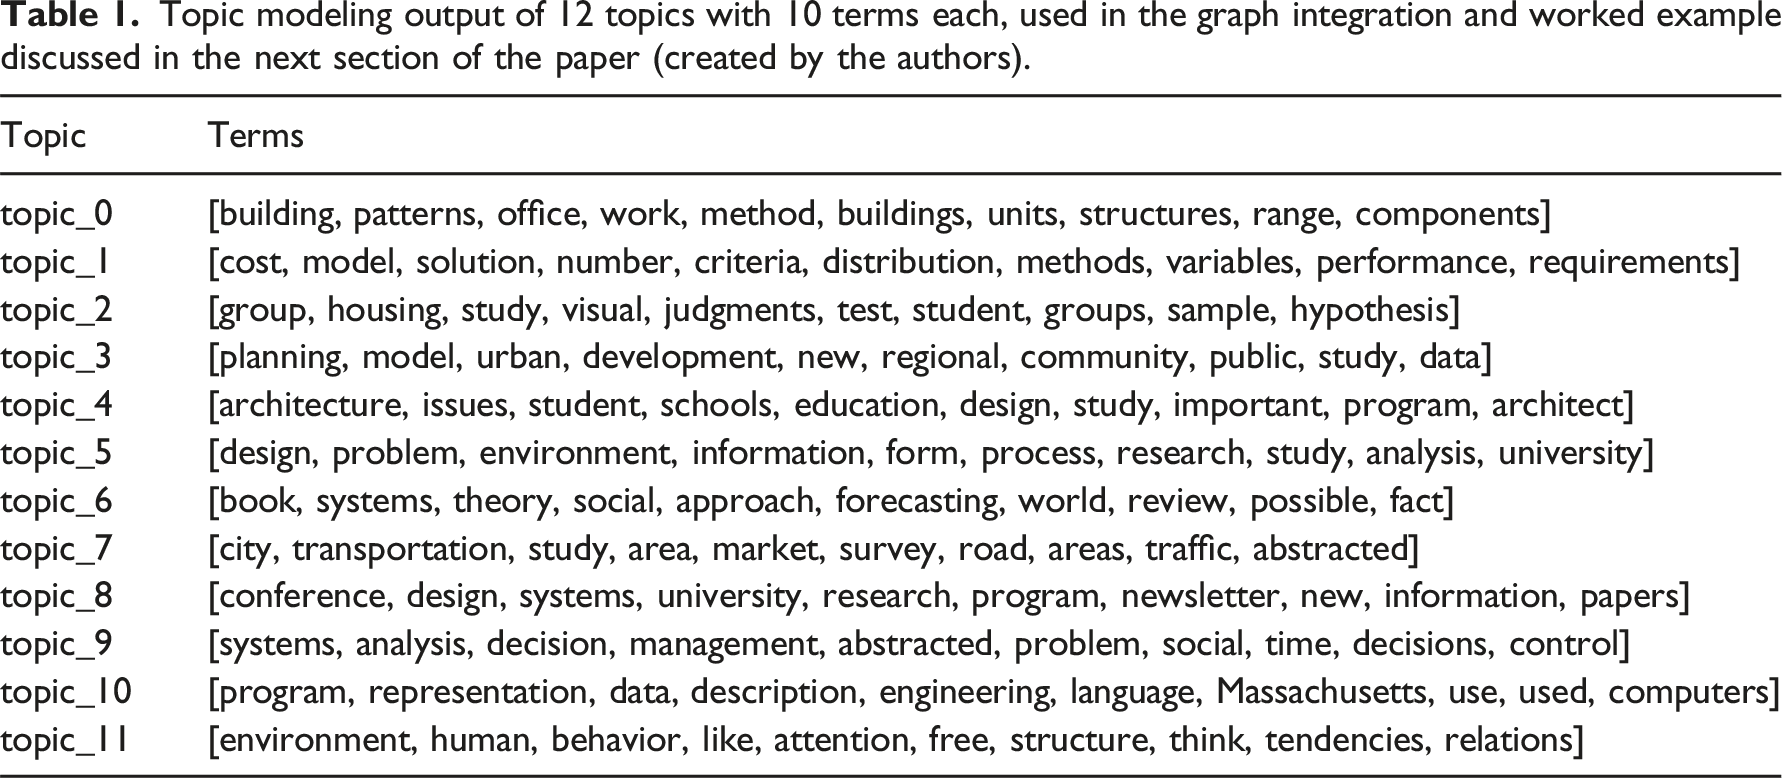
We experimented with different settings of topic generation such as the total number of desired topics and the total number of words per cluster. The larger the number of desired topics was, the more coherent were the terms in the word groupings. However, a large number of topics (e.g., more than 20) resulted to more thematic overlaps among entries with ambiguous distinctions. So, we concluded that 10 to 15 topics were a workable trade-off between a clear organization of the entries to broader thematic threads and coherent word groupings (Table 1). The output of the analysis step was the mapping of topics to each entry. Finally, we integrated the new data categories of topics in the Obsidian graph, by introducing topics as database entities and, in parallel, by introducing an entry-topic relationship, associating each entry with the list of topics it includes. Workflow diagram that illustrates the integration of topic modeling analysis into the database and graph visualization (created by the authors). Topic modeling output of 12 topics with 10 terms each, used in the graph integration and worked example discussed in the next section of the paper (created by the authors).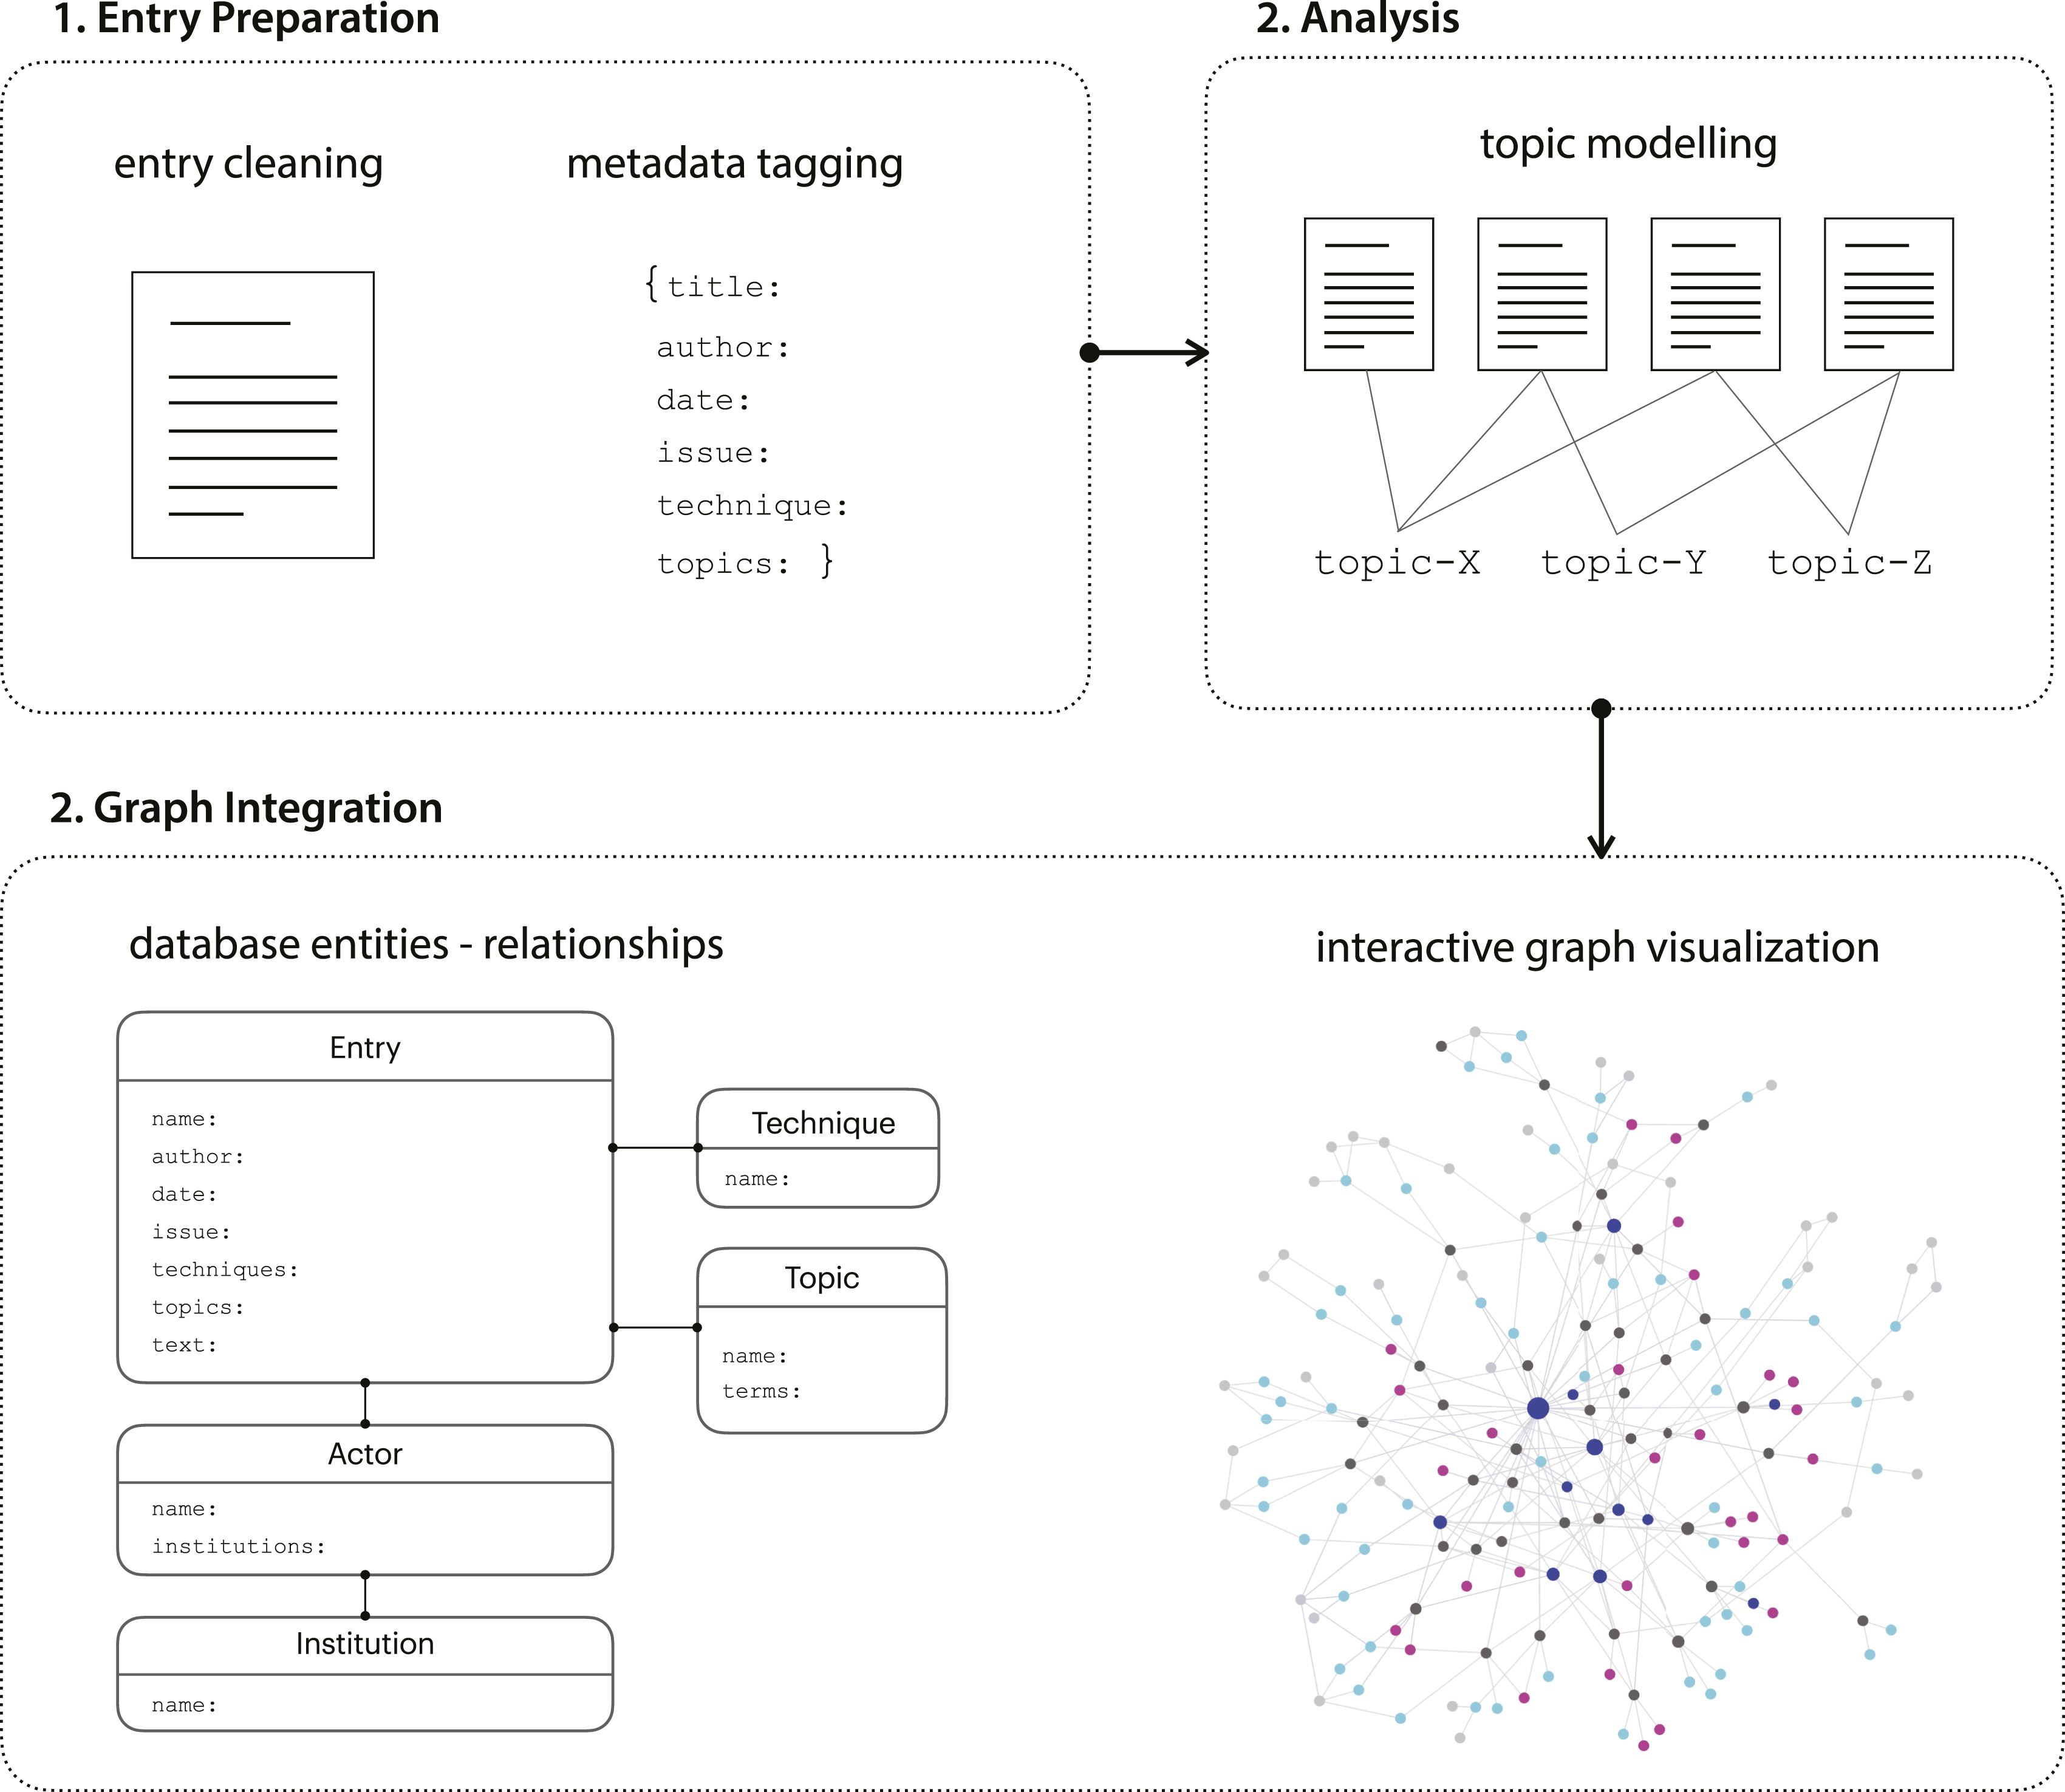
Results & Discussion: Query as emplaced search
The construction of the visual interactive graph in Obsidian allows for a spatial and topological search based on proximities, localities, and relations through manipulating the graph itself rather than through a query language. More than structured or inventorial, the query afforded by the interactive graph is an emplaced exploration at three levels: global, local, and topical.
Levels of exploration
• Global
The global graph view maps entries, actors, and institutions on the space of newsletter topics and techniques. Because each newsletter entry is expressed as a distribution of topics, we can imagine this entry as a point in an n-dimensional space where n is the number of topics and techniques. The mapping of the entries in the topic space allows for explorations of thematic proximities. For example, we see that some topics are in proximity as they have multiple interrelated entities in the corpus, while others with fewer connections remain distant in this document space.
• Local
By centering one entry node, the local graph view reveals its incoming and outgoing links. The potential for discovery of hidden connections captured by the newsletter increases with the depth of connections. While the outgoing links one degree distance from the entry node derive from the entry data structure, the second and third degree of connections reveal institutional, technical, and topical alliances.
• Topical
As much as the topics allow us to organize emergent relationships between entries, the association of entries through a topic permits us to reflect on the topic itself as a disciplinary commonplace. Let’s take, for example, the word grouping of topic 6, which includes the terms book, systems, theory, social, approach, forecasting, world, review, possible, and fact. The aggregation of these terms becomes much more insightful when we relate them back with the entries from which they are drawn (Figure 4). Most of the entries that exhibit topic 6 relate to design decision making, choices, and judgements. This allows us to observe discursive patterns of how systems theory, forecasting, and prediction methods were framed around the goal of assisting design decision-making. Terms of topic 6 examined vis-a-vis its local graph. The related entries provide context for the otherwise abstracted word grouping, allowing for reflection on the topic’s meaning within the corpus (created by the authors).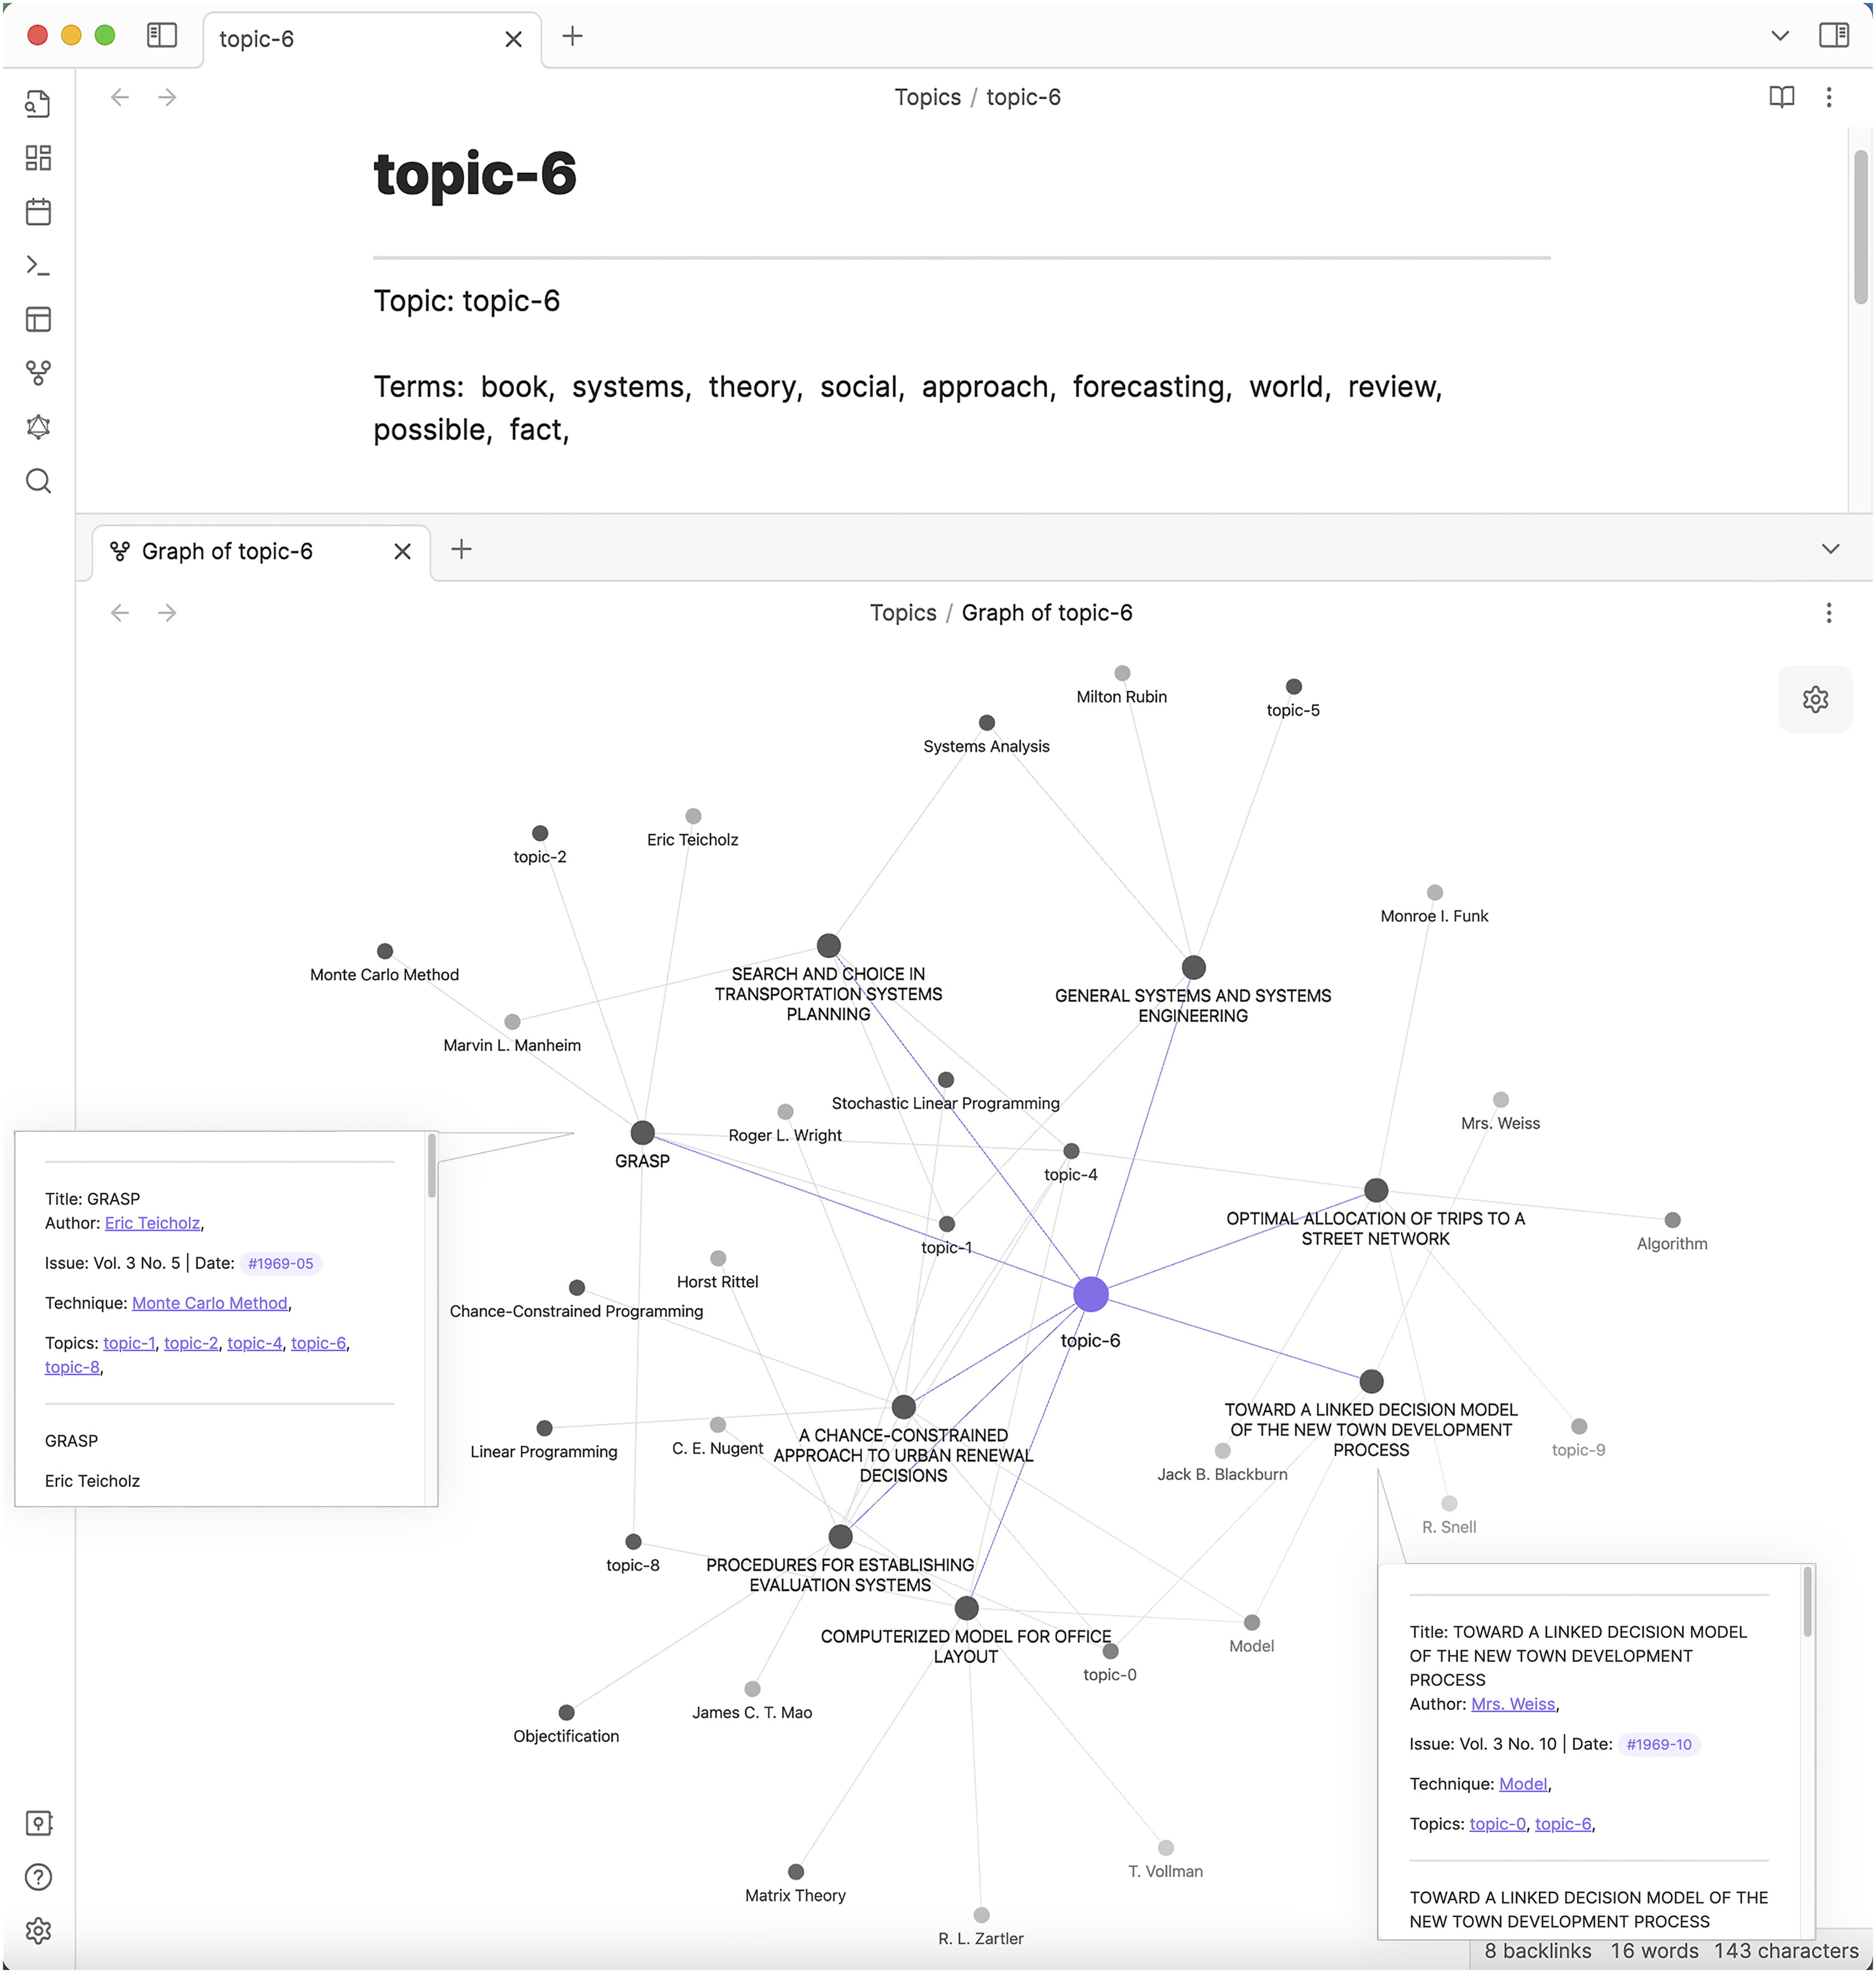
Overall, through the newsletter database construction and the interactive graph visualization, our research contributes an augmented DMG Newsletter as a resource of historical research. The graph and the database do not only document the newsletter corpus as they include the entries’ bibliographic data and textual content in an indexed format, but they also augment it by surfacing and structuring implicit relations among entities—actors, institutions, and techniques. Generated from the individual entries' data and text, the visual interactive graph gives form to the academic research network produced by the newsletter. This network includes not just the social and institutional affiliations of the Design Methods Group members who contributed to the newsletter but also considers intellectual and discursive threads that connect their contributions. In doing so, it allows to navigate the newsletter in ways that were not possible before: through networks of influence of a node (relevant for exploring the influence of techniques within the social and institutional network), relational paths between nodes (relevant for exploring discursive relationships between actors), and arrangements of nodes based on an added attribute (relevant for exploring the temporal aspects of discursive exchanges).
A worked example: Relations and mobilities
To illustrate possible applications of the DMG Newsletter database to historical investigation, we present here a brief example. We used the database and graph visualization to explore adaptations of the historical computer program Hierarchical Decomposition System outside the context of original development by Christopher Alexander and Marvin Manheim in 1962 at the Massachusetts Institute of Technology. In the Obsidian graph, by searching the first-degree links of the program’s underlying algorithmic technique “Hierarchical Decomposition,” we were able to find other entries that talk about the use of the same technique for other applications, and by extension, we revealed a network of actors and institutions that had worked on variations and implementations of the computer program. This includes subroutines such as DECOMP, RECOMP, VTCON2, adaptations to computer languages and systems other than FORTRAN and the IBM 709 for which it had been originally developed, and applications to design in contexts such as the Coventry Community Nursing Home.
This emerging network already serves as a launching pad for further historical research in the adaptation of the technique in other, perhaps lesser-known, settings. Beyond these academic actors and places, in the local graph of the Hierarchical Decomposition technique, one topic in particular (topic_3; terms: planning, model, urban, development, new, regional, community, public, study, and data) emerged as a common theme across all entries (Figure 5). Moving between local and topical queries, we started to reflect on the common incentives and goals of the technique’s applications as captured by the topic’s common terms. Interestingly, key discursive tropes associated with HIDECS within the DMG Newsletter have less to do with technical considerations of hierarchical decomposition, which Alexander himself foregrounded in the HIDECS reports, and more with urban planning models that include community concerns. Local graph view of the technique node “Hierarchical Decomposition,” showing related entries from Volumes 2 and 3 of the Newsletter (1968–1969), and their associated actors and topics. Topic 3 emerges as a common topic across the entries that address this technique (created by the authors).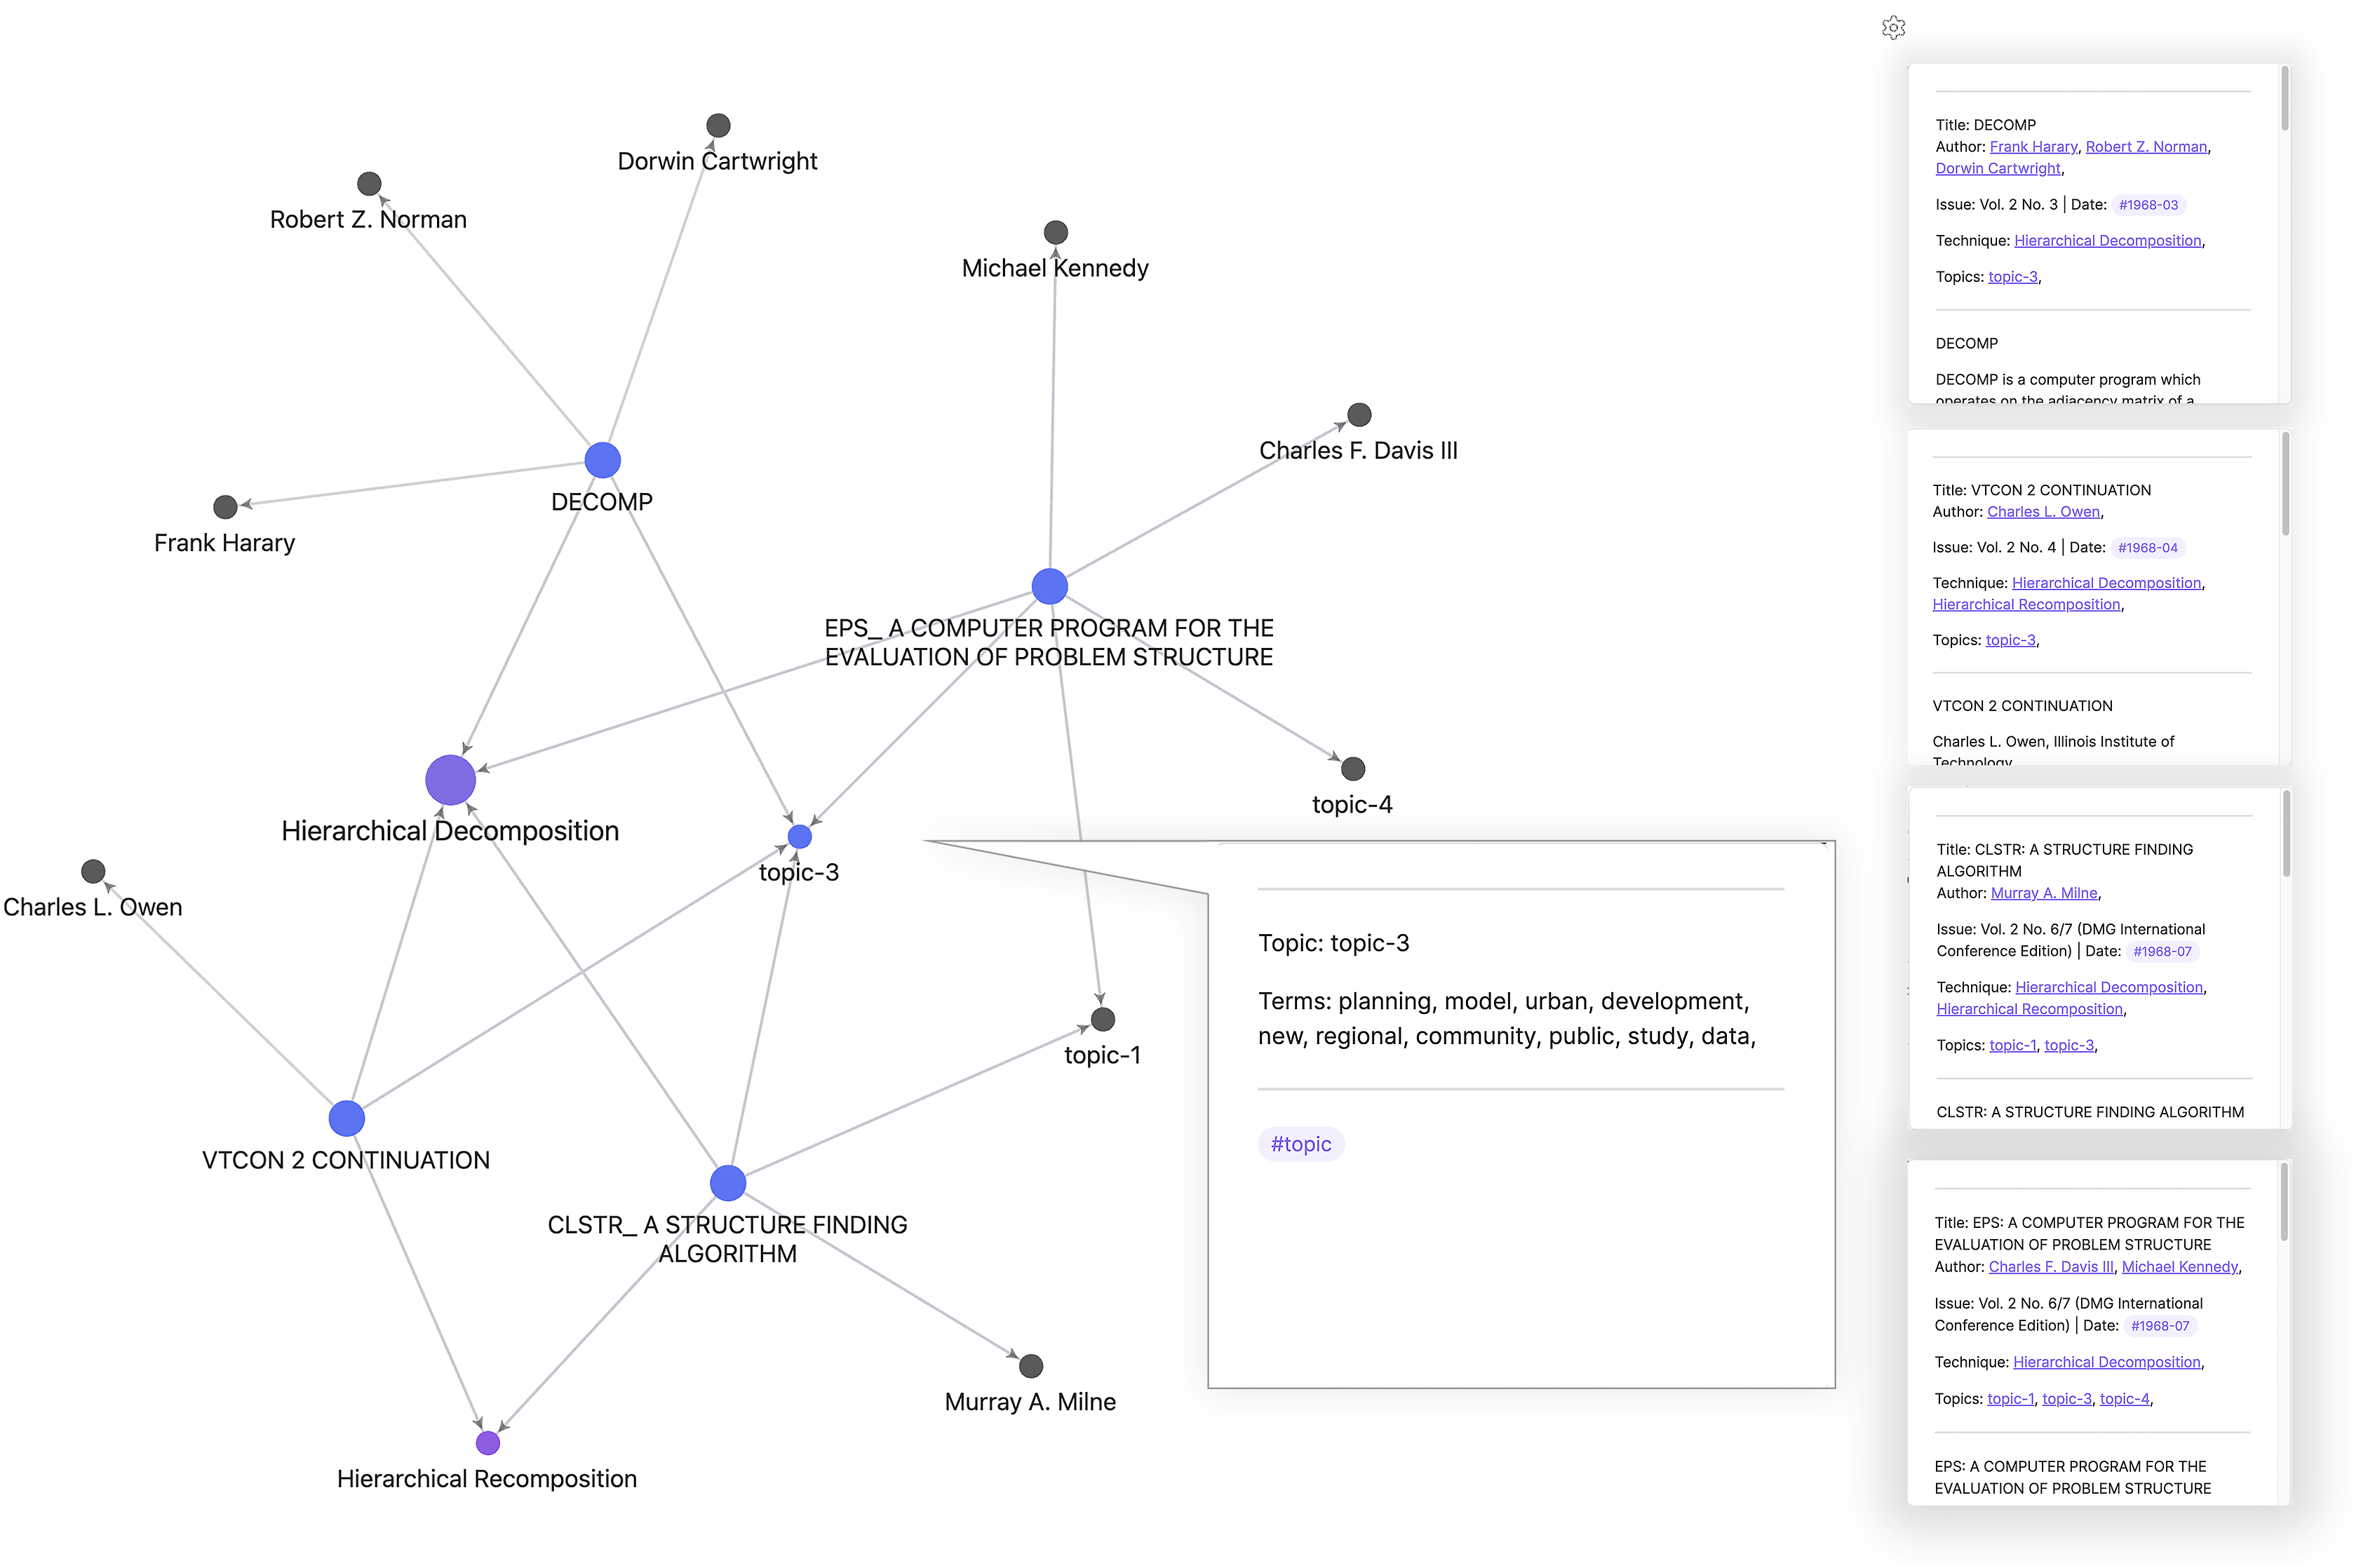
The graph representation allowed us to explore relations between two nodes by finding paths through the graph that connect them. Utilizing the computational potential of the graph structure, we used the Obsidian plugin Path Finder to compute all possible paths between two selected nodes.
54
We found this possibility particularly relevant when exploring relations between two actors, as it allows us to discover connections beyond the most known institutional affiliations, through shared techniques, topics, and even common collaborators (Figure 6). For example, we searched for the paths connecting Christopher Alexander and Horst Rittel. The shortest path was, unsurprisingly, through their common institutional affiliation with the University of California Berkeley. Immediately after this path, the next shortest is through two of their publications, which relate though topic 1 (terms: cost, model, solution, number, criteria, distribution, methods, variables, performance, and requirements) one is the most popular topic among the newsletter entries perhaps because it indicates the use of rational methods—the basic concern of the design methods group—but not a specific area of application. The rest of relations between the two actors are more distant, less direct. On the contrary, Alexander relates with the British architect Francis (Frank) Duffy through several shorter paths in comparison to Rittel, including a connection through entries that both address the technique of Pattern Language. Searching for the graph paths between actors, ranking their length, and analyzing the intermediate links can create a map of intellectual proximities. Graph of all paths connecting the actor node pair Christopher Alexander–Horst Rittel and the pair Christopher Alexander–Francis Duffy for a selection of newsletter entries from Volumes 2 and 3 of the DMG Newsletter (1968–1969) (top and middle); graphs of less than 6 edges that display the shortest paths between the two pairs of actors (bottom) (created by the authors).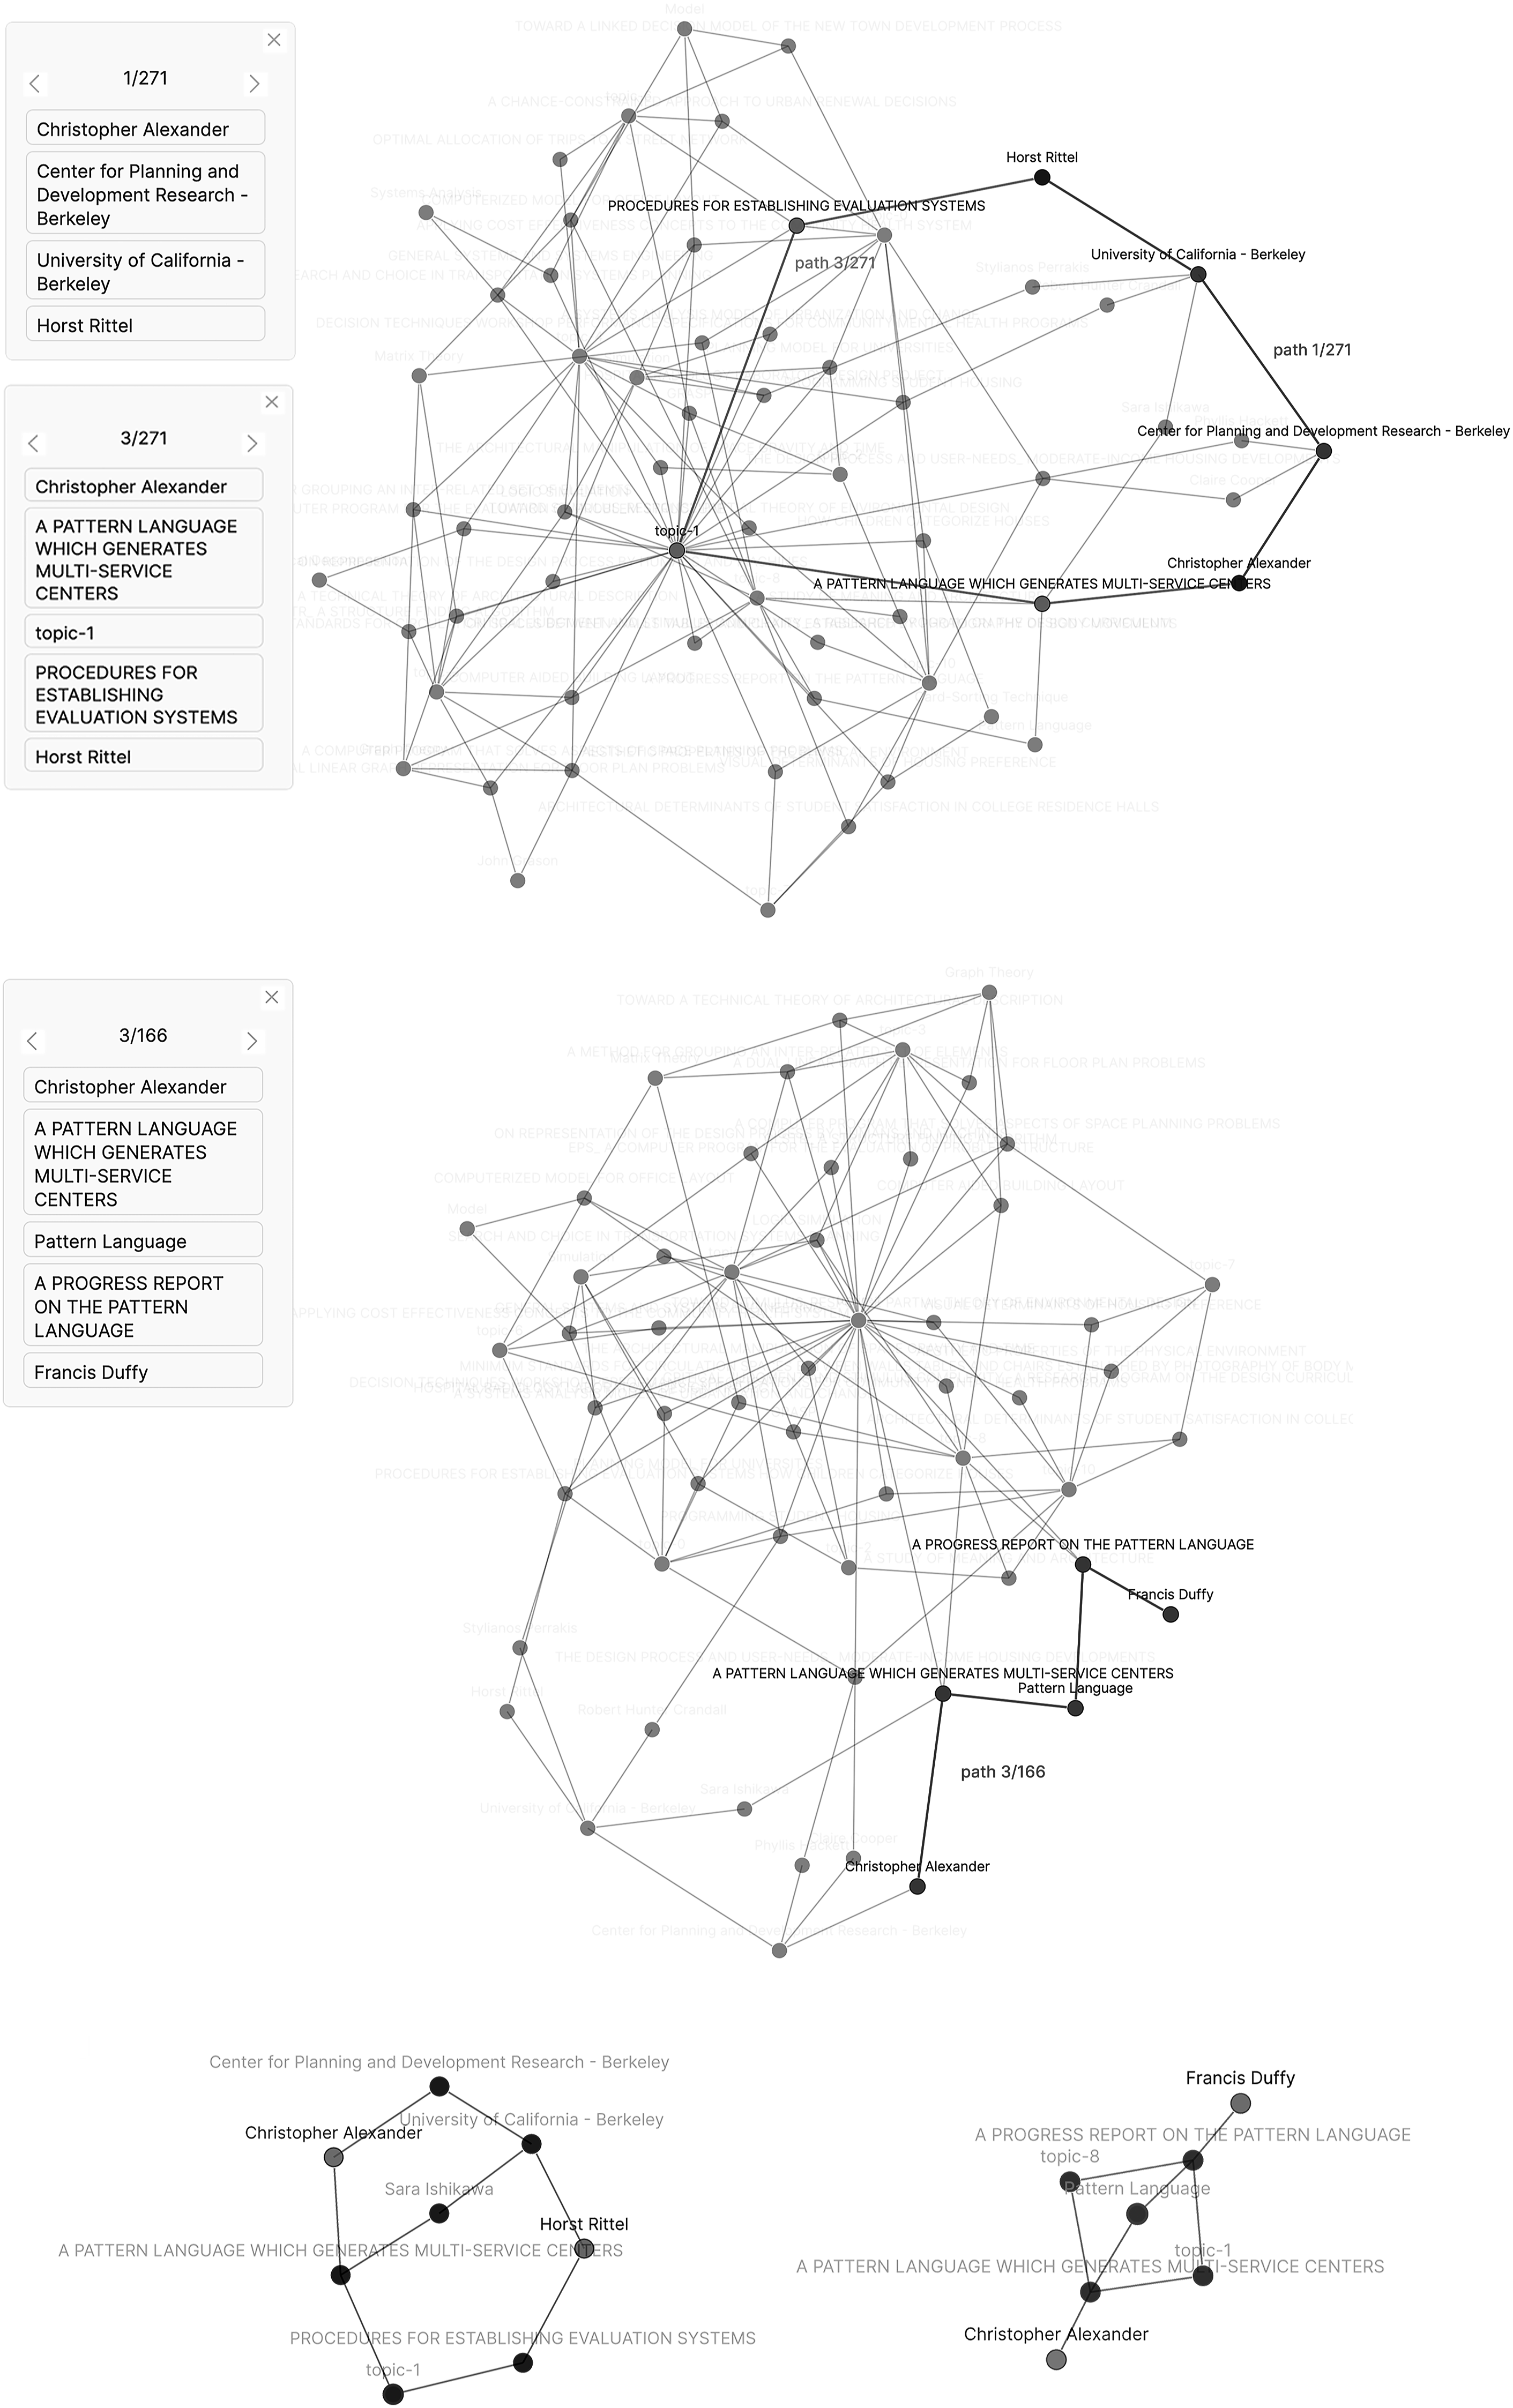
Conclusion: Generative relationships
This article has been motivated by the question of what it means to take an informal document as a window through which to view the dynamic development of a new field of research. In this paper, we have positioned the DMG Newsletter as a valuable repository of historical evidence for examining the institutional, intellectual, and technical context that birthed early systematic and computational approaches to design. The Newsletter allows to expand the inquiry on design methods beyond major research institutions and events and exposes researchers to a rich collection of possibilities for further historical inquiry. Our approach is motivated by views of knowledge production and technology development as practices—situated and constructive activities to be studied in the context of distinctive epistemic cultures and knowledge settings. 55
In our paper, we presented a set of investigations that adopt digital history methods to activate the Newsletter as a relational infrastructure for historical exploration. We presented considerations around the selection of the data and the definition of their relationships and outlined experiments with different available Database Management Systems that culminated in the current form of the DMG Newsletter database. The current form is based on the adaptation of a knowledge base platform that allowed us to associate nodes (data entities) in our relational database structure with notes offering the prospect of added content through the generation of content by users of the database. The note structure offers isomorphic translations into a graph of nodes which allows for local and global explorations of relationships between the Newsletter’s various data entities (nodes). We also presented a quantitative text analysis approach to the extraction of key discursive themes (“topics”) from the Newsletter’s textual corpus and illustrated the potentials of the database for historical investigation through the example of an influential computer-assisted decision-making technique for design methods—the hierarchical decomposition of design “problems.”
This study offers contributions to the history of architectural computing and to digital history. First, we unearth the DMG Newsletter as a rich resource of informal and anecdotal knowledge and approaching it as both a record of a field in formation but also an agent in constructing a research community. Because this research community is directly relevant to the development of architectural computing as a distinctive area of investigation, we believe that our approach can enhance the historical understanding of the sites and discourses in which architectural design started being reimagined as a form of computation. We hope that our approach will motivate other scholars working on the history of architectural computing to experiment with adapting our workflow to other textual corpora or recombining it with other methods in network visualization and quantitative text analysis. Promising applications could be using a version of the workflow to investigate an informal publication of a specific research group, where the research group acts as an explicit “center” in the investigation, or to explore a formal publication, such as a journal, over a formative period for the development of architectural computing. An example of the former is the Architecture Machinations newsletter of the Architecture Machine Group. An example of the latter could be the first 10 volumes of the Computer-Aided Design journal from its foundation in 1968 to 1978. An important next step in our research is to develop our preliminary findings from using the DMG Newsletter database that we present in the “Worked Example” section and articulate, through use, how the workflow that we have created can augment traditional scholarly methods of historical investigation and history writing. While this article focused specifically on the workflow we developed, we are especially interested in exploring, in the future, the relationships of the graph visualizations we produce with historical narrative, that is, how one structures and delivers a story. An open question for us is the relationship of the node (entity) with the line (relationship): balancing the grain and specificity afforded by in-depth, targeted historical investigations, or close readings, on specific nodes with the insights that stem from their consideration within larger networks, from enmeshed readings.
Our second contribution is our translation of the DMG Newsletter as an augmented and relational digital resource that can be populated with additional content on actors, institutions, or other entry categories by other researchers and scholars, activating prospects of collective editing and content development. We are in the process of populating the database with more entries from the DMG Newsletter and, once complete, we plan on sharing the Obsidian vault on GitHub as well as use the web publication capabilities of Obsidian to make the graph available for interactive manipulation online. We are looking forward to other researchers interested in the histories of design methods and architectural computing exploring the graph visualization and populating actors, topics, and institutions with notes and links to archives. From a workflow development standpoint, our next step is also to investigate ways to hybridize the relational approach we have taken to structuring the data with a native graph approach. This would enhance the scalability of our workflow and would allow for more targeted queries of the entities and their relations.
Finally, our article contributes methods for informationally and statistically exploring the content held by the database. An important next step in this research is investigating more computationally robust methods for creating word groupings, such as a combination of word embedding with LDA. These methods require more advanced computational skills as they entail writing custom code but are more tailored to a specific textual corpus and may yield more stable groupings. Regardless of the contingency of the “topics” we identified using a topic model, our investigation highlights a key discovery: the “glue” holding entries together was not a social network of authors or a set of institutions but instead techniques and discursive tropes. This casts the graphs we are presenting not as networks but as multi-dimensional meshworks that overlay and interconnect different strata of entities and information. The meshwork brings discursive tropes, techniques, humans, and institutions in the same plateau of examination and queries their connections and mobilities. In doing so, it moves beyond conventional attributions of agency to humans or institutions and foregrounds new aggregates that can generatively infuse historical investigation. Coming to terms with what it means to write history with an eye on relations, networks, and transactions is an exciting next step for the development of this research project.
Footnotes
Acknowledgments
The authors warmly acknowledge Saumya Gogte and George-Étienne Adam for their work in this research project and are grateful to David Greene for the consultations and advice. The authors also thank the “Architectures of Order” LOEWE research cluster for engaging with the DMG Newsletter database during a workshop at the Technical University of Darmstadt in May 2023.
Declaration of conflicting interests
The author(s) declared no potential conflicts of interest with respect to the research, authorship, and/or publication of this article.
Funding
The author(s) disclosed receipt of the following financial support for the research, authorship, and/or publication of this article: This work was supported by the Summer Undergraduate Research in Engineering (SURE) Program at McGill University and by grants from the Social Sciences and Humanities Research Council of Canada (SSHRC) and the Fonds de Recherche du Quebec - Societe et Culture (FRQSC).