
Abstract
Urban building energy modelling (UBEM) is a prevalent research method to examine the multi-scale building to urban renovation in mitigating global energy-related carbon emissions. However, only a few studies delineate a complete workflow from generation to application using UBEM. In particular, to facilitate the designing of sustainable built environments, existing research needs to emphasize the integration of multi-scale energy performance evaluation within the design development process for architects and urban planners. The key challenges lie in the need for integrated datasets and incompatibility between software tools required for designing, modelling, and evaluation. This paper presents a comprehensive methodological framework to investigate applicable urban decarbonization strategies. A case study of Sheffield in the UK demonstrates the development of an automated and standardized computational workflow. This data-driven workflow aims to evaluate energy demand and supply scenarios at an urban scale to access the potential of decarbonizing built environments. The workflow is designed to be adaptable to various scales of urban regions, given a suitable geographic information system (GIS) dataset.
Keywords
Introduction
Today, the most critical societal challenge arises from global warming caused by greenhouse gas (GHG) emissions. To deal with such a crisis, the United Nations outlines 17 Sustainable Development Goals (SDGs), among which, SDG 11, Sustainable cities and communities, emphasizes the significance of cities and settlements in enhancing living standards and reducing energy consumption. 1 In particular, the building sector alone contributes to more than one-third of total CO2 emissions through its immense energy demand in urban areas. 2 In European Union, buildings account for 40% of the total energy consumption and 36% of the CO2 emissions. 3 These statistics suggest that buildings account for adverse environmental impacts from fossil fuels needed to provide and maintain comfortable built environment. 2 Hence, cities must prioritize better building energy management and investigate built environment design to mitigate excessive energy consumption.4,5
Visualization and prediction of various building adaptation measures’ effects can assist governments and planners in developing a positive environmental impact, while enhancing their consciousness of climate change. 6 An example by Wang et al. demonstrates a water use model for sustainable urban design through codifying parametric measures of environmental impacts at an urban scale. 7 Further investigation into urban building energy models (UBENs) has also been widely adopted to support sustainable design strategies evaluation by estimating energy demand loads considering multiple buildings in an intricate urban context.
Existing studies in renewable city using UBEM tools
Cheng et al. employed a data-driven framework, augmented with a Geographic Information System (GIS)-integrated dataset, to estimate the building Energy Use Intensity (EUI) in urban regions. 8 Devila et al. developed an urban-scale energy model for Boston and assessed photovoltaic (PV) efficiency using two different scenarios. 9 Alhamwi et al. formulated a GIS-based model to analyze the implementation of renewable energy sources at the city level. 10 Li lists a series of plugins of ArcGis for urban energy analysis and renewable strategies. 11 Krietemeyer and El Kontar proposed integrating UBEMs with GIS to enable spatiotemporal visualization and analysis. 6
Existing UBEM tools, such as CitySim, 12 are usually stand-alone modelling platforms. Some others are developed as plugins for proprietary software with mature technology for processing GIS information. 11 For instance, Elk, a plugin for Grasshopper, offers capabilities to generate topographies and city street models using OpenStreetMap (OSM) and can be further developed into a UBEM for large-scale environmental analysis. Given the city models, analysis software tools, such as Umi developed by Reinhart et al. can facilitate neighbourhood-scale simulation of energy demand, daylight, and walk score in the built environment. 13 For most architects and urban planners, unfamiliar software and interface mean extra learning expenses and loss of efficiency in using UBEM for gauging the potential of sustainable strategies. This prompts an urgent need to bridge UBEM and sustainable urban planning and evaluation through a seamlessly integrated workflow.
Another critical barrier to using UBEM is the need for fine-grained and structured datasets. 14 Despite the rich and available GIS data in open domains, interoperability between software tools remains a critical challenge for most urban planners and architects working with various data formats. 15 As such, this paper proposes a comprehensive computational workflow to seamlessly integrate GIS data from different sources to create an urban-scale energy model and facilitate sustainable development planning.
Benchmark and sustainable approaches in building environment
CIBSE-TM46 Energy benchmarks and supplement describes the statutory building energy benchmarks prepared to set energy standards for buildings in England, Wales, and Northern Ireland. This document aims to improve the actual performance of buildings in the UK, thus reducing carbon emissions and public funds for energy consumption. A wider range of building categories (29 categories and 237 subclasses) with different operation schedules are defined clearly. This document is suitable to guide UBEM’s study in the UK when defining archetypes and building templates. 16
For demand modelling, the generation process involves the creation of Building Energy Models (BEMs) for various building archetypes and profiles. Building fabric is essential in energy simulation and can significantly influence energy demand profiles. For this reason, fabric efficiency can be the first renewable to decrease energy demand in the built environment. The EU Commission’s ‘2030 climate and energy framework’ sets up three key targets for 2030: at least a 40% cut in greenhouse gas emissions (from the 1990 level), at least 32% share from renewable energy, and a 32.5% improvement in energy efficiency. 17 For energy efficiency, making buildings more energy efficient will contribute significantly to the EU achieving its energy and climate goals. 18 This paper will explore to what extent building fabric efficiency can contribute to carbon reduction at an urban scale.
For the supply model, the ability of solar PV technology to convert sunlight into electricity directly possesses tremendous untapped potential and represents a popular sustainable solution in the area with high-level energy consumption. 19 Many governments have enacted policies and programs (e.g. feed-in-tariffs, quota obligations, subsidies, and tax incentives) to encourage using renewable energy, especially solar. 20 As the green heart of Great Britain, Sheffield City Region set a series of decarbonization scenarios using renewable energy. The most ambitious is scenarios A, where goals are set as ‘An installed capacity of 0.432 GW by 2025 and 1.312 GW by 2040 for Solar PV, and approximate 23,000 installations of Solar Thermal per year for next 20 years’. 21 Within the existing South Yorkshire context, electricity generated by renewable energy is less than 20% of what is consumed. 21 As such, solar energy will be piloted to evaluate to what extent renewable energy can offset the required energy demand.
Research aim
This paper presents a computational workflow for the urban neighbourhood-scale energy modelling needed to support energy demand and supply scenarios evaluation with decarbonizing strategies. The objective is to resolve the interoperability issues when tackling data requirements and defining archetype for UBEM and, as a result, afford capabilities for architects and urban planners to support sustainable urban development. As shown in Figure 1, the methodological framework of this project includes steps from the implementation using programming and simulation to experimentation with various renewable applications. By examining the effects of proposed sustainable design strategies, this paper delineates the generative procedures that enable carbon emission reduction within the given urban context. Framework of the research and steps of the study.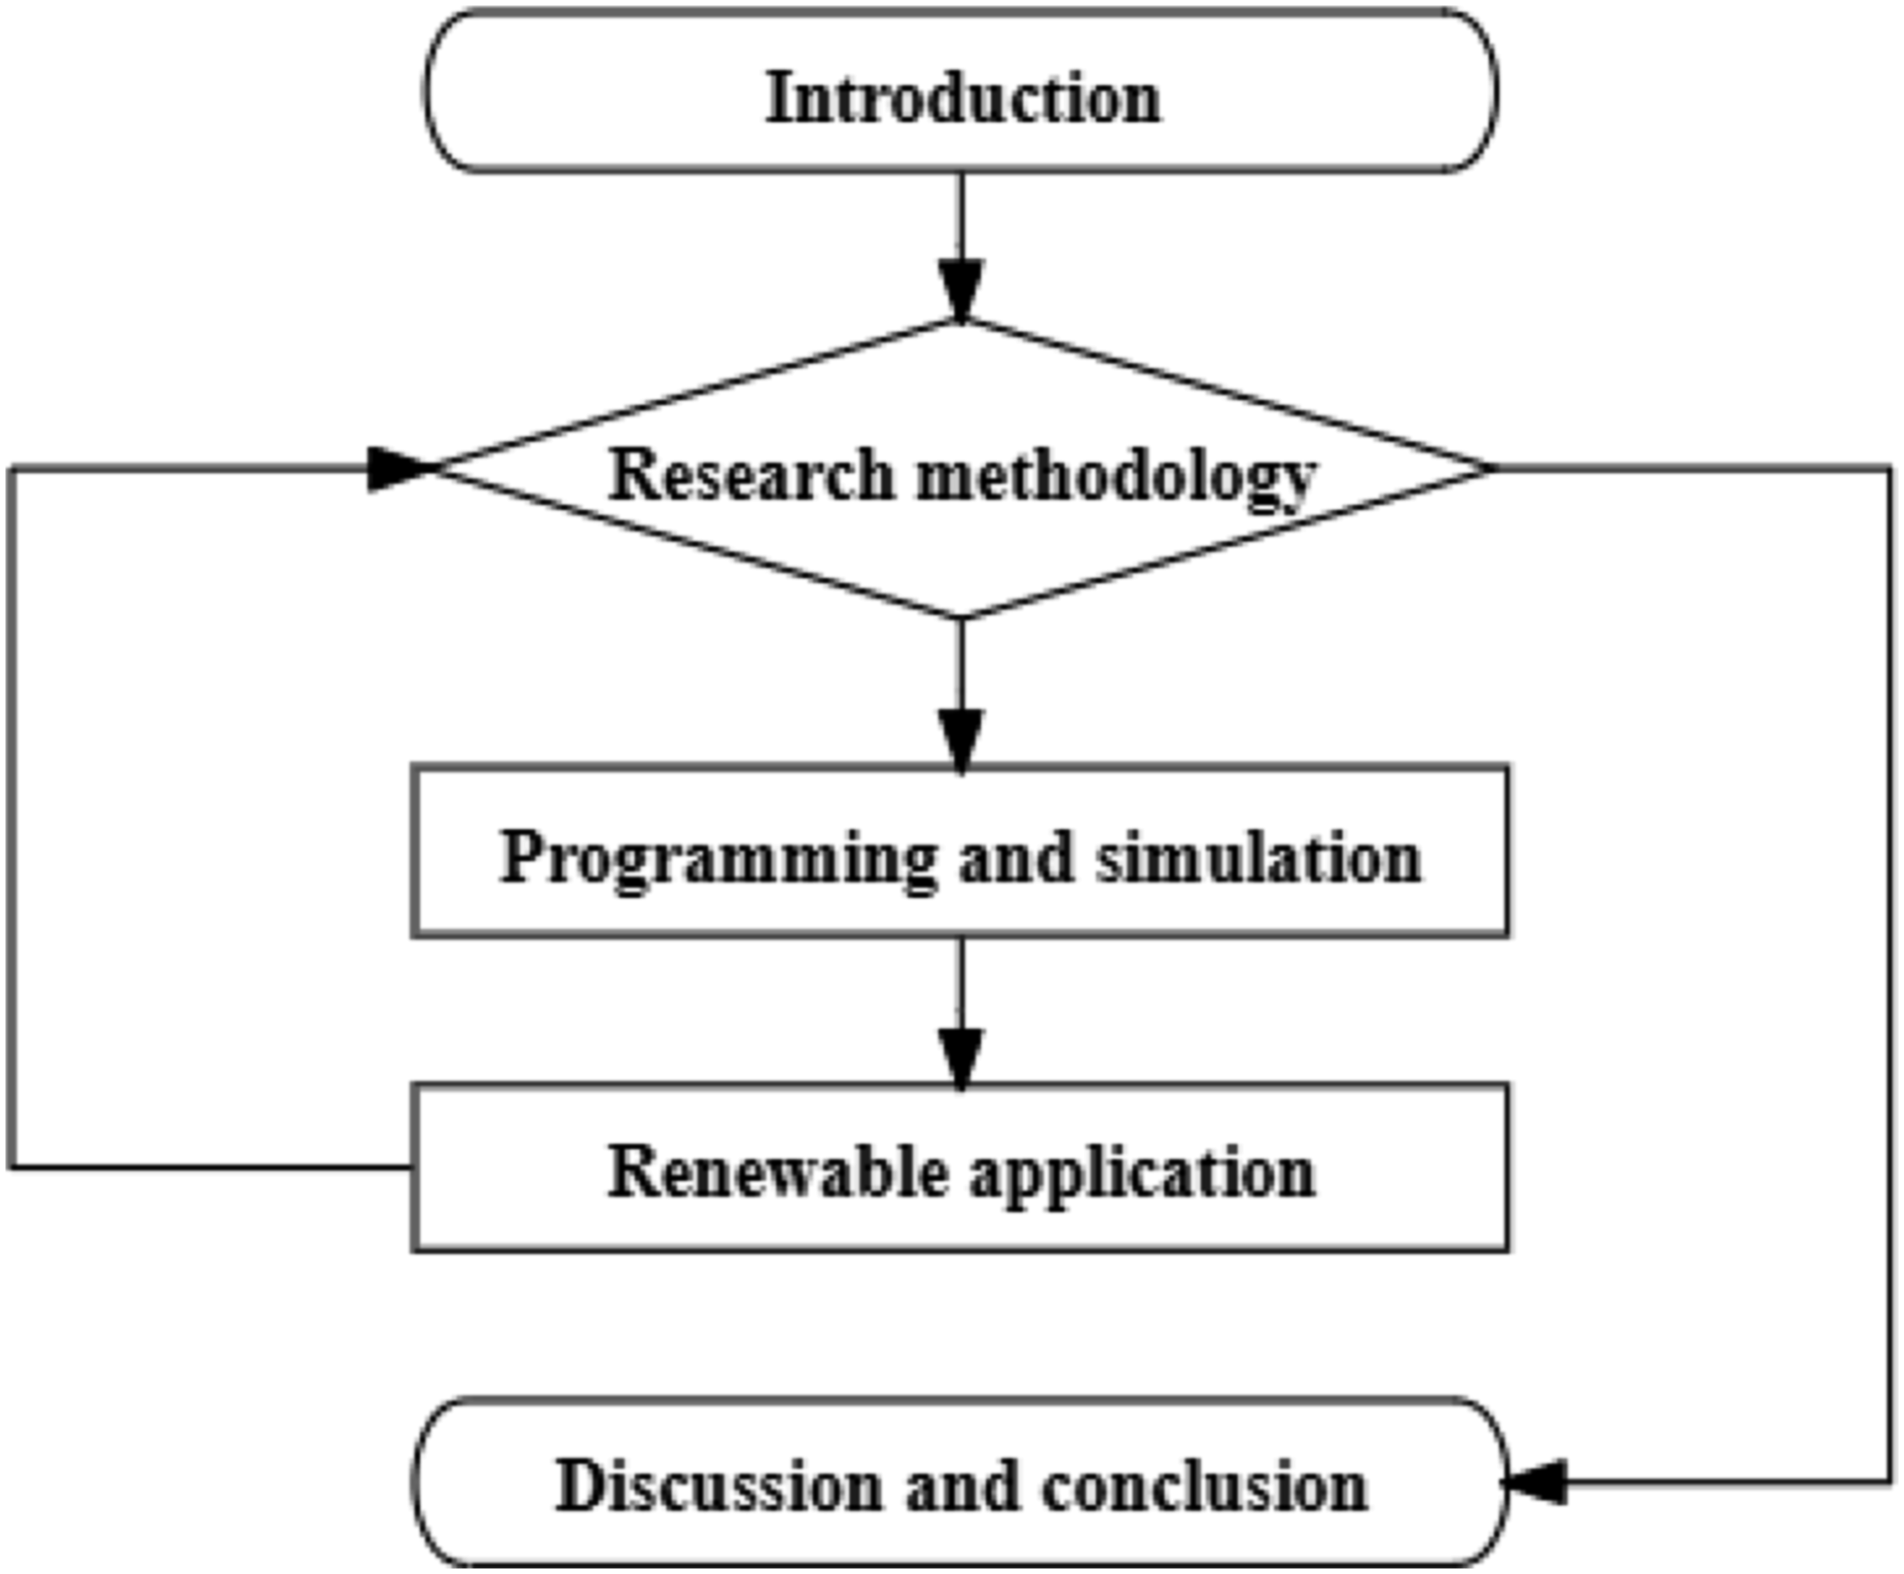
Research method and workflow
Methodology
Creating UBEM depends on the need for the result and the level of detail that influences the accuracy of the result. 22 The traditional bottom-up approach groups buildings with similar usage, age, and size into a representative computing unit (archetype). A database of such archetypes can be created based on local energy-business codes combined with measured or surveyed data. 23 The resulting energy profile details for UBEMs are then generated based on archetypes.
This study uses a customized ‘scale-up’ methodology, where archetype was defined firstly and then scaled up to present city’s characteristics, to balance building details and accuracy for modelling urban energy demand. This workflow enables predicting the energy demand at the urban scale and evaluates the renewable energy potential with the support of the supply model. 24
Workflow
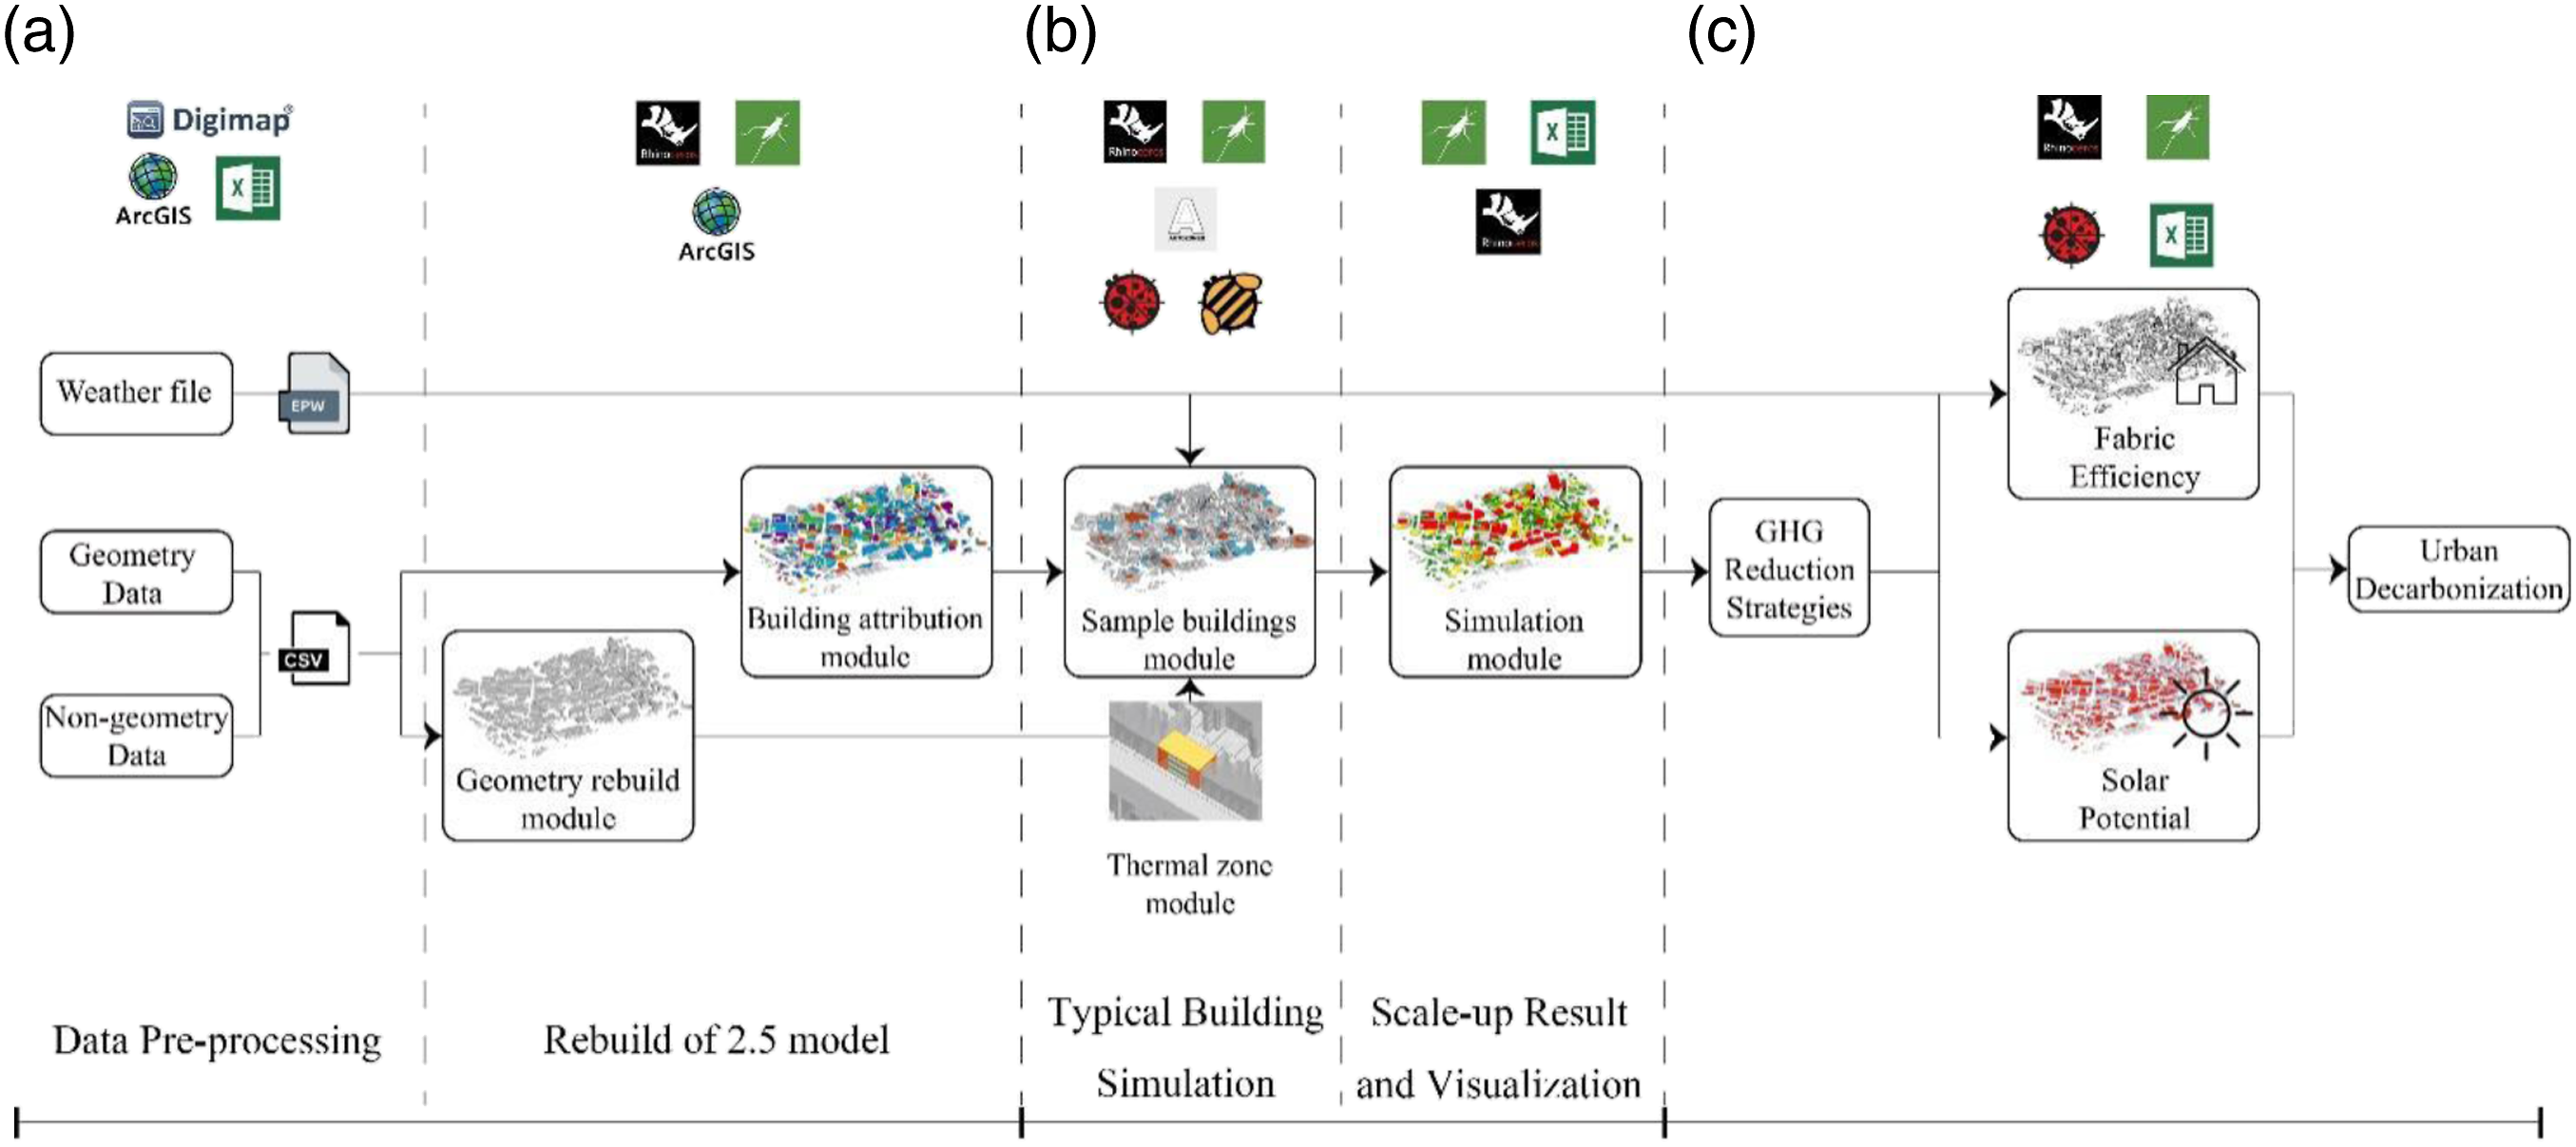
The methodological modules shown in Figure 2 for the computational workflow are summarized as follows: 1. Model generation: This module retrieves geometry and non-geometry data, such as building types of a GIS model for building massing generation. 2. Performance simulation: This module predicts total energy consumption, including energy demand for heating, domestic hot water (DHW), cooling, lighting, and equipment loads, by calculating the average (EUI) of representative buildings. 3. Renewable application: This module aims to decarbonize the Sheffield region through various sustainable design strategies at an urban scale, including fabric efficiency and solar energy. Workflow diagram specifying each role in this project. (a) Model generation, (b) performance simulation, and (c) renewable application.
Programming and simulation
2.5D model generation
Unlike modelling a single building, where all detailed information about the building is available, UBEMs are often usually generated based on existing building stock data. 23 Such building stock data can be further divided into two categories: geometry data and non-geometry data. Geometry data is the essential three-dimensional (3D) information for detailed BEM. Typical building geometry data available for UBEM include the GIS-based building footprint, building height, and the number of stories for each building. 23 Non-geometry data include characteristics information of buildings, such as building type, built year, and building systems, which can be combined with geometry data and further developed into the archetype for simulation. As reviewed in the previous session, access to such data varies significantly from region to region.
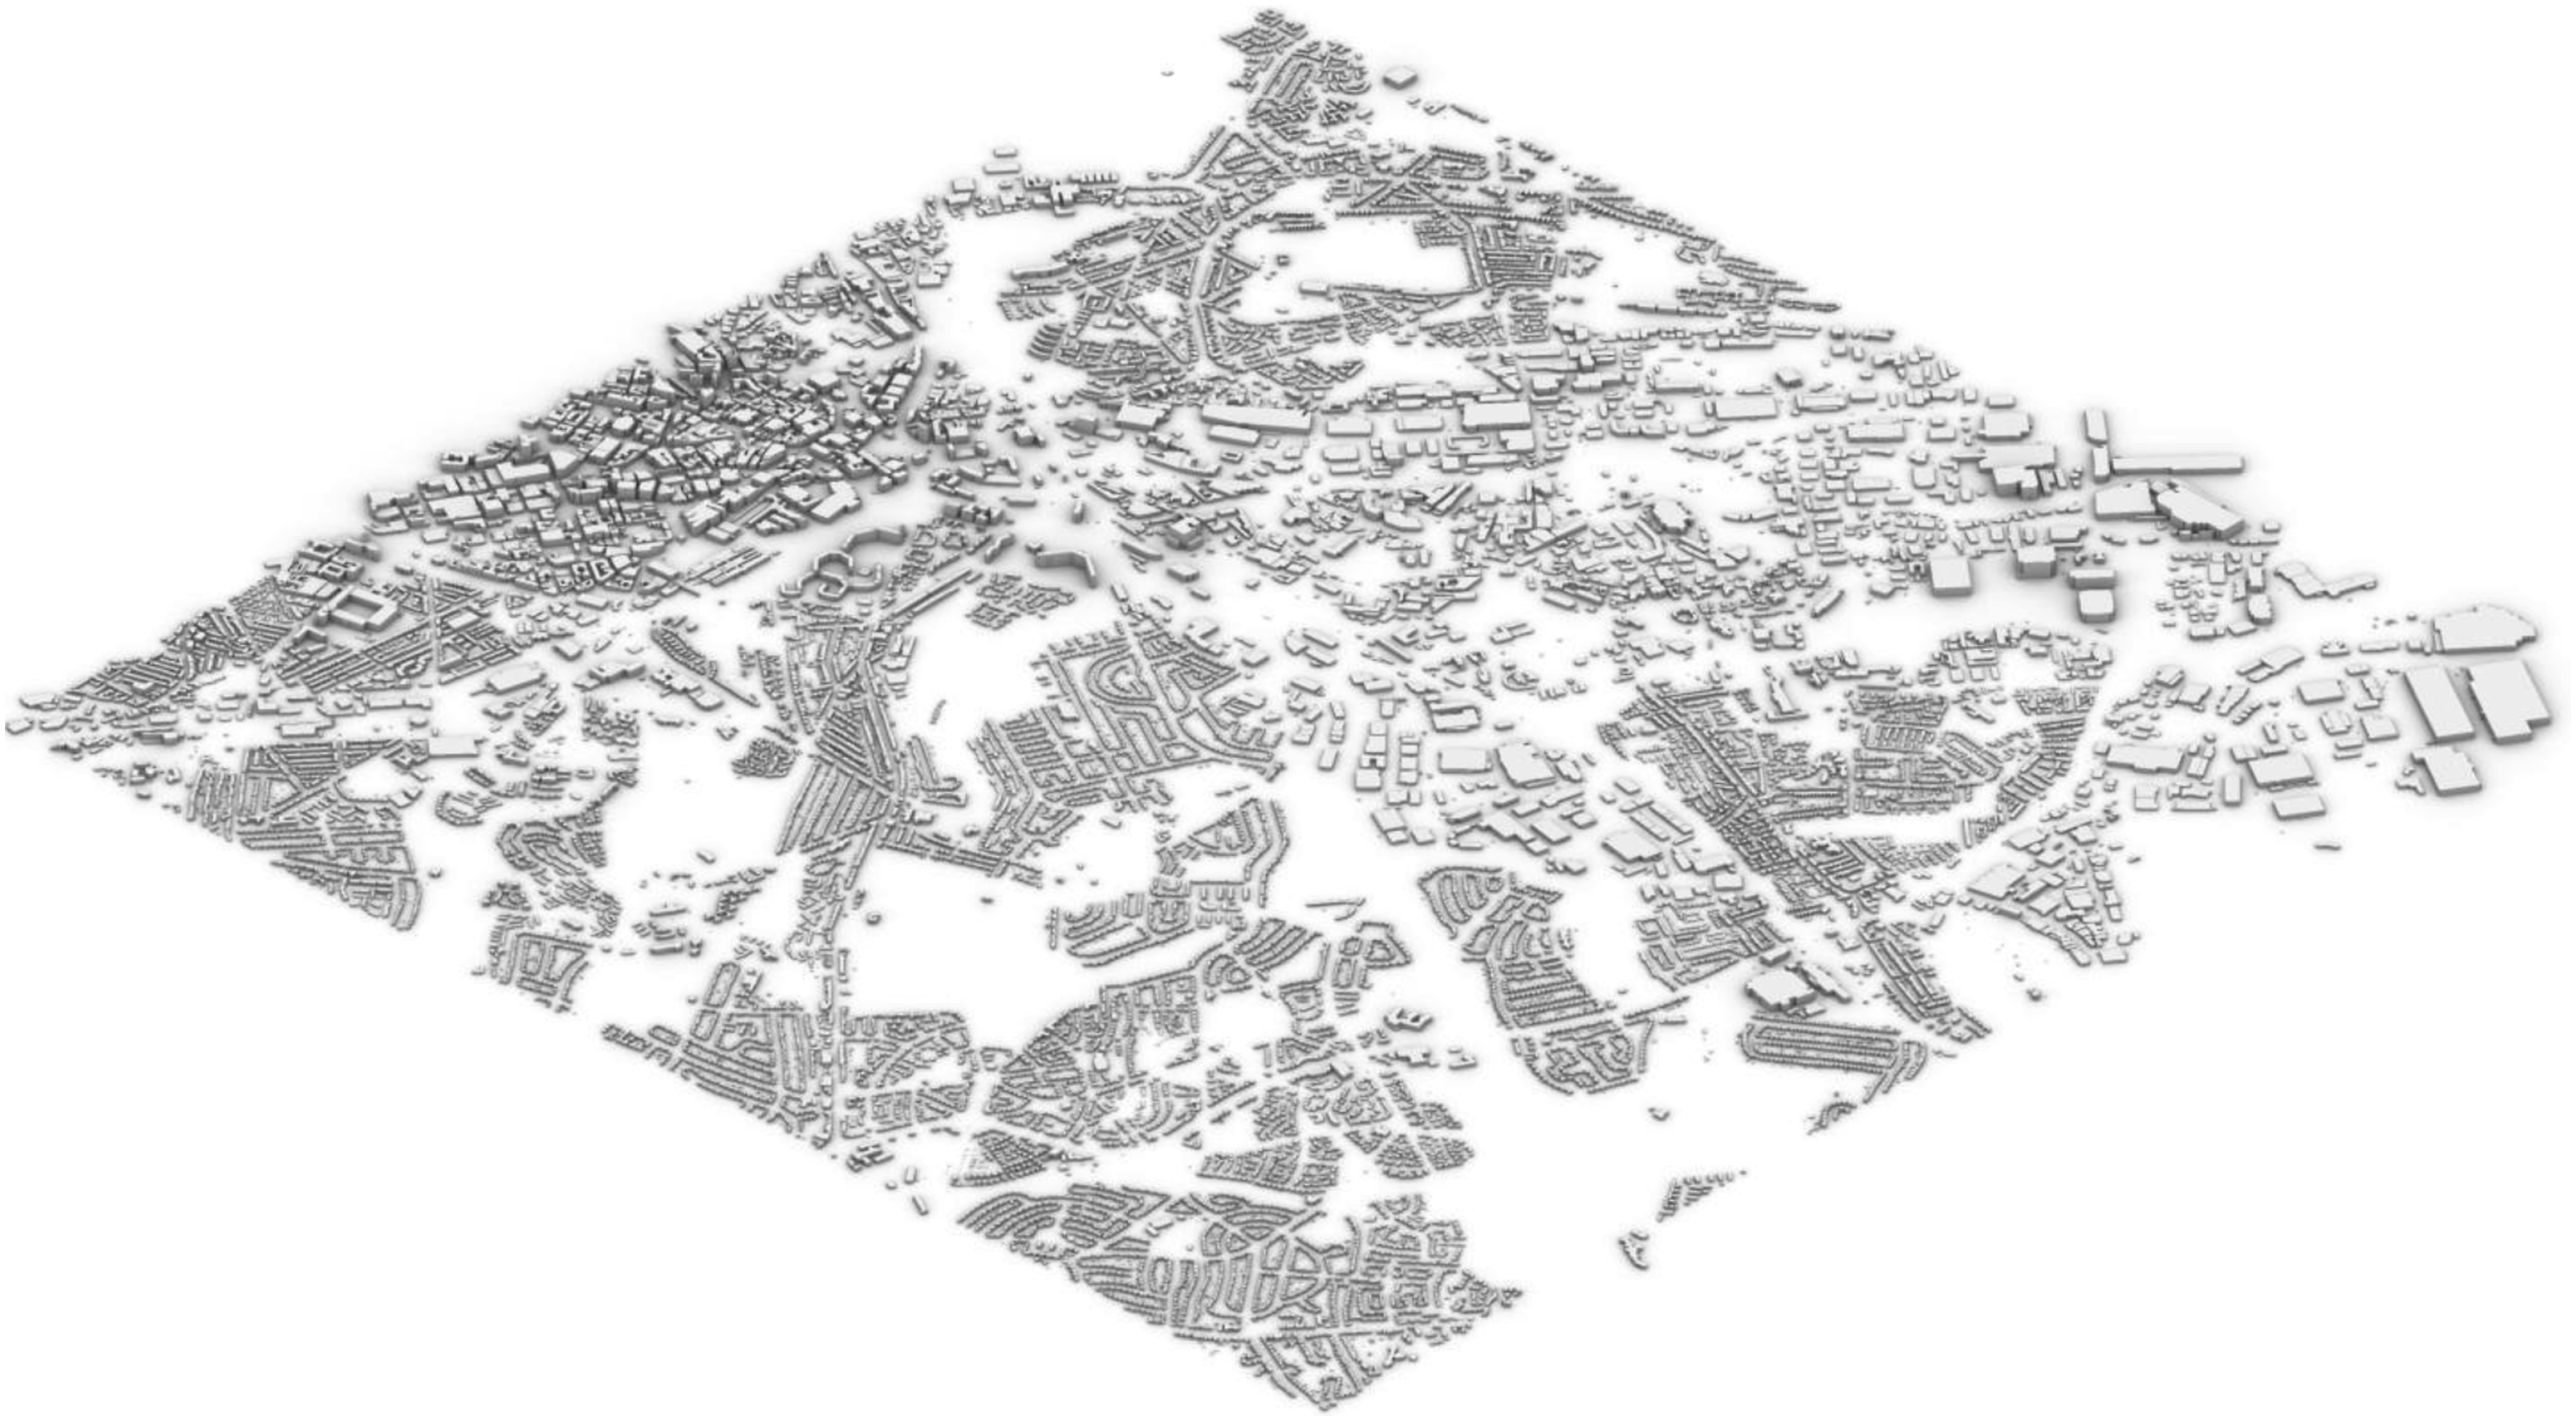
Digimap (Figure 3) is used in this study to retrieve the source of geometry and non-geometry data in this project, including XY coordinate, floor number, and POI (point of interest). The output of this step is the whole 3D geometry of grid SK38NE in the Sheffield region (Figure 4). In total, 44,849 buildings on this map are modelled. Boundary of Sheffield city (left) and ‘grids’ division in Digimap (right). Bird view of all buildings rebuilt in grid SK38NE.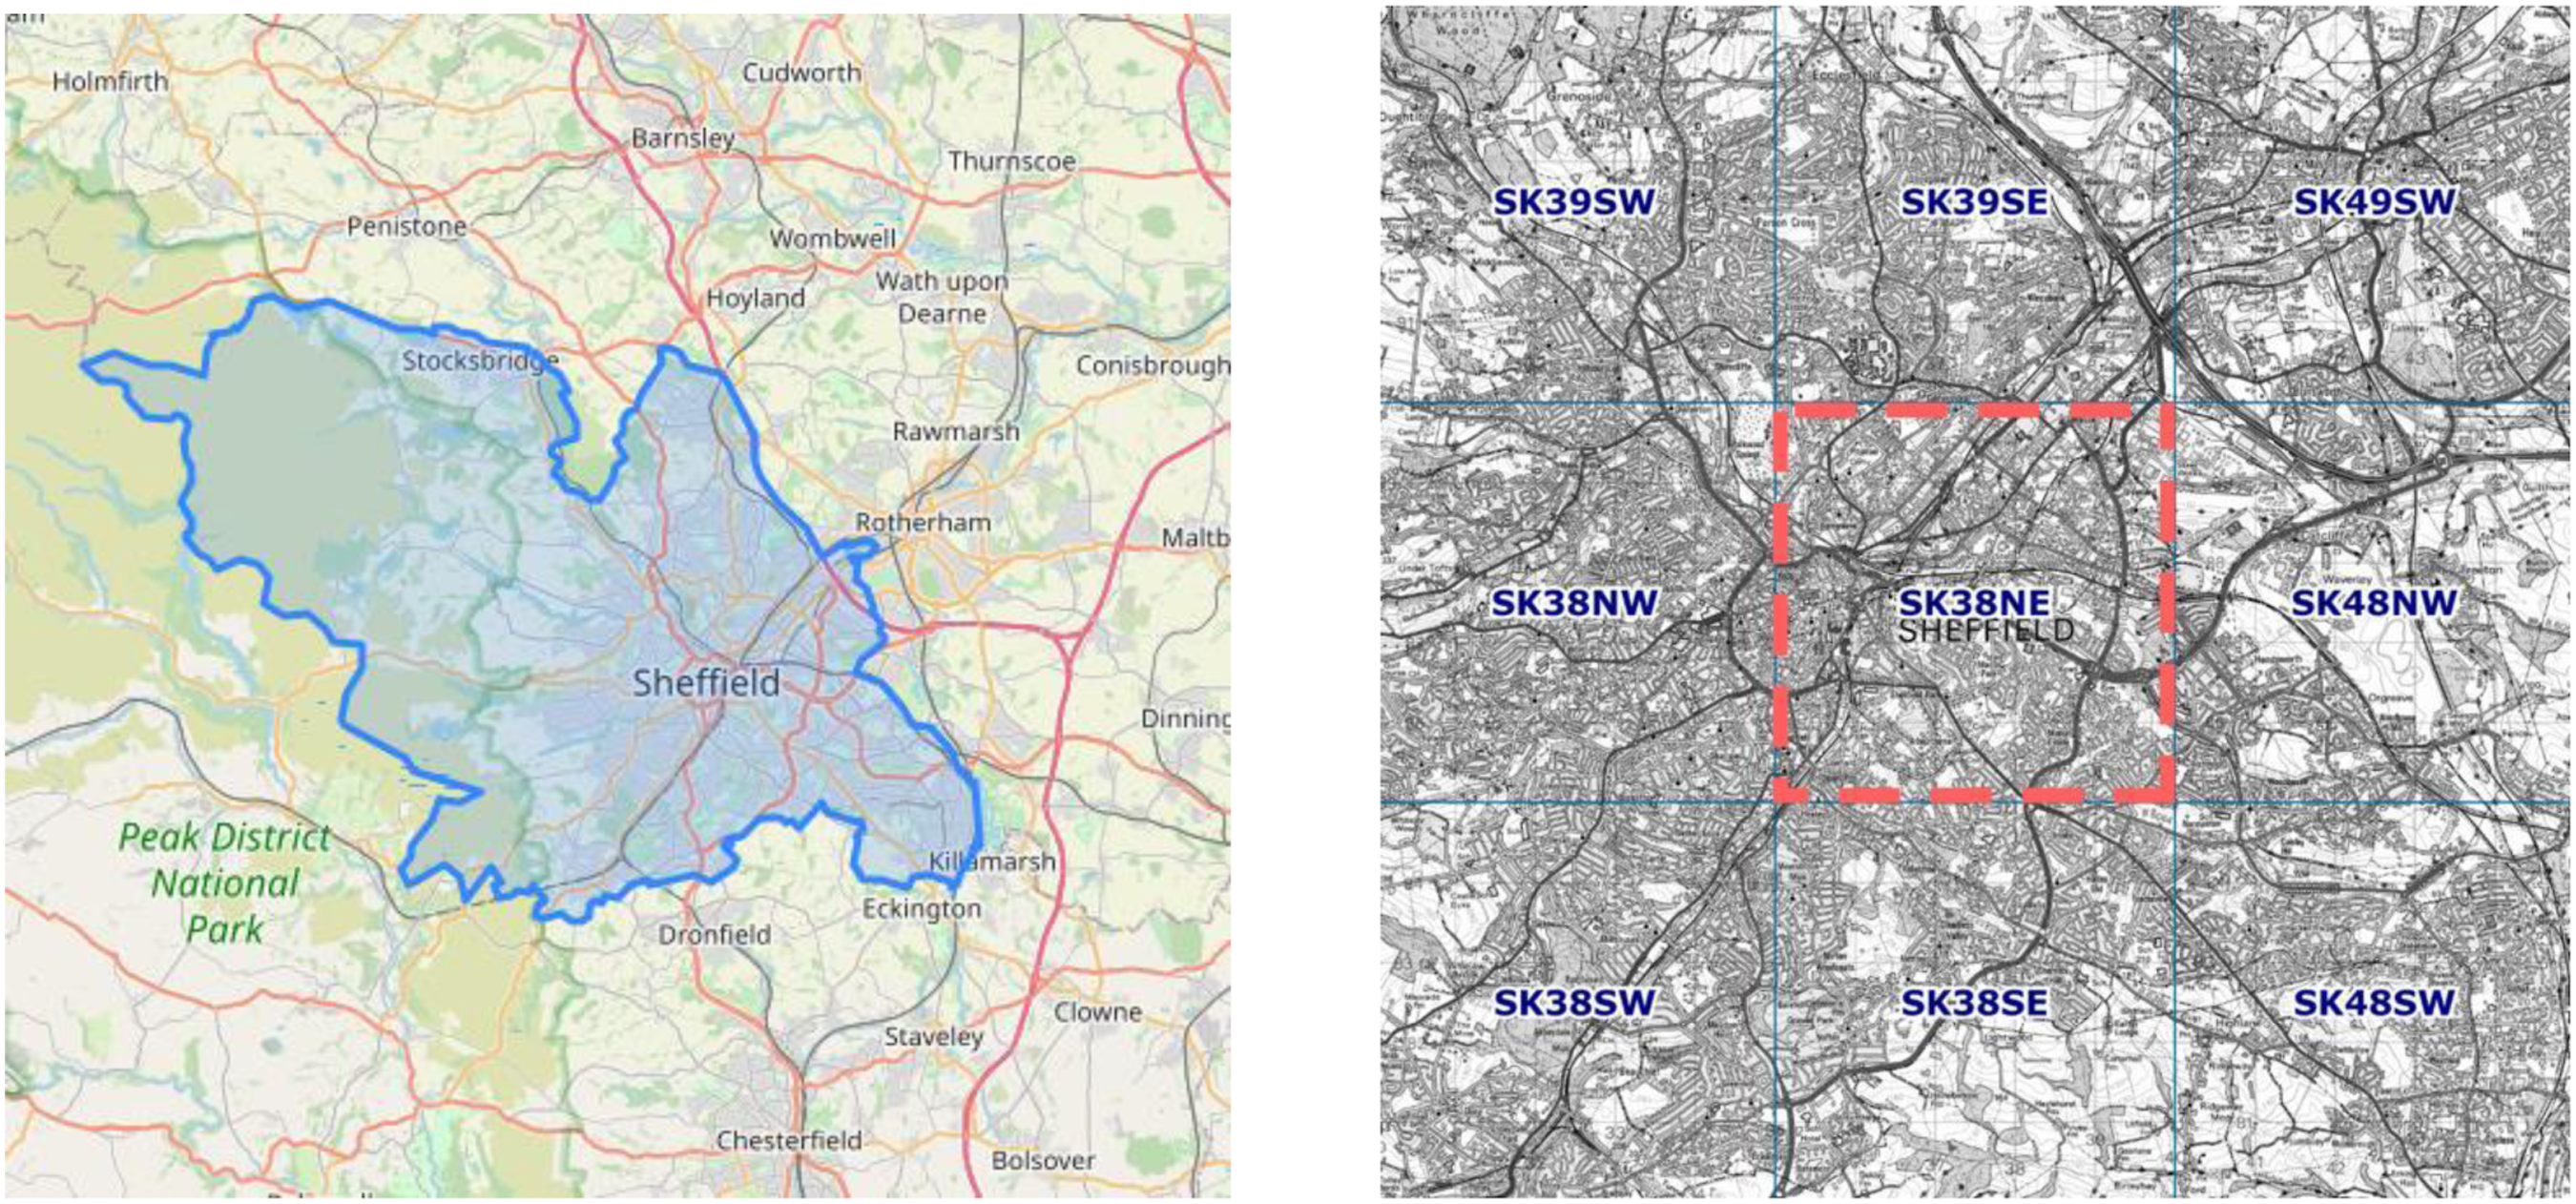
There are nine categories at the first level and 52 sub-categories at the second level for building types, ranging from accommodation to bus transport.
25
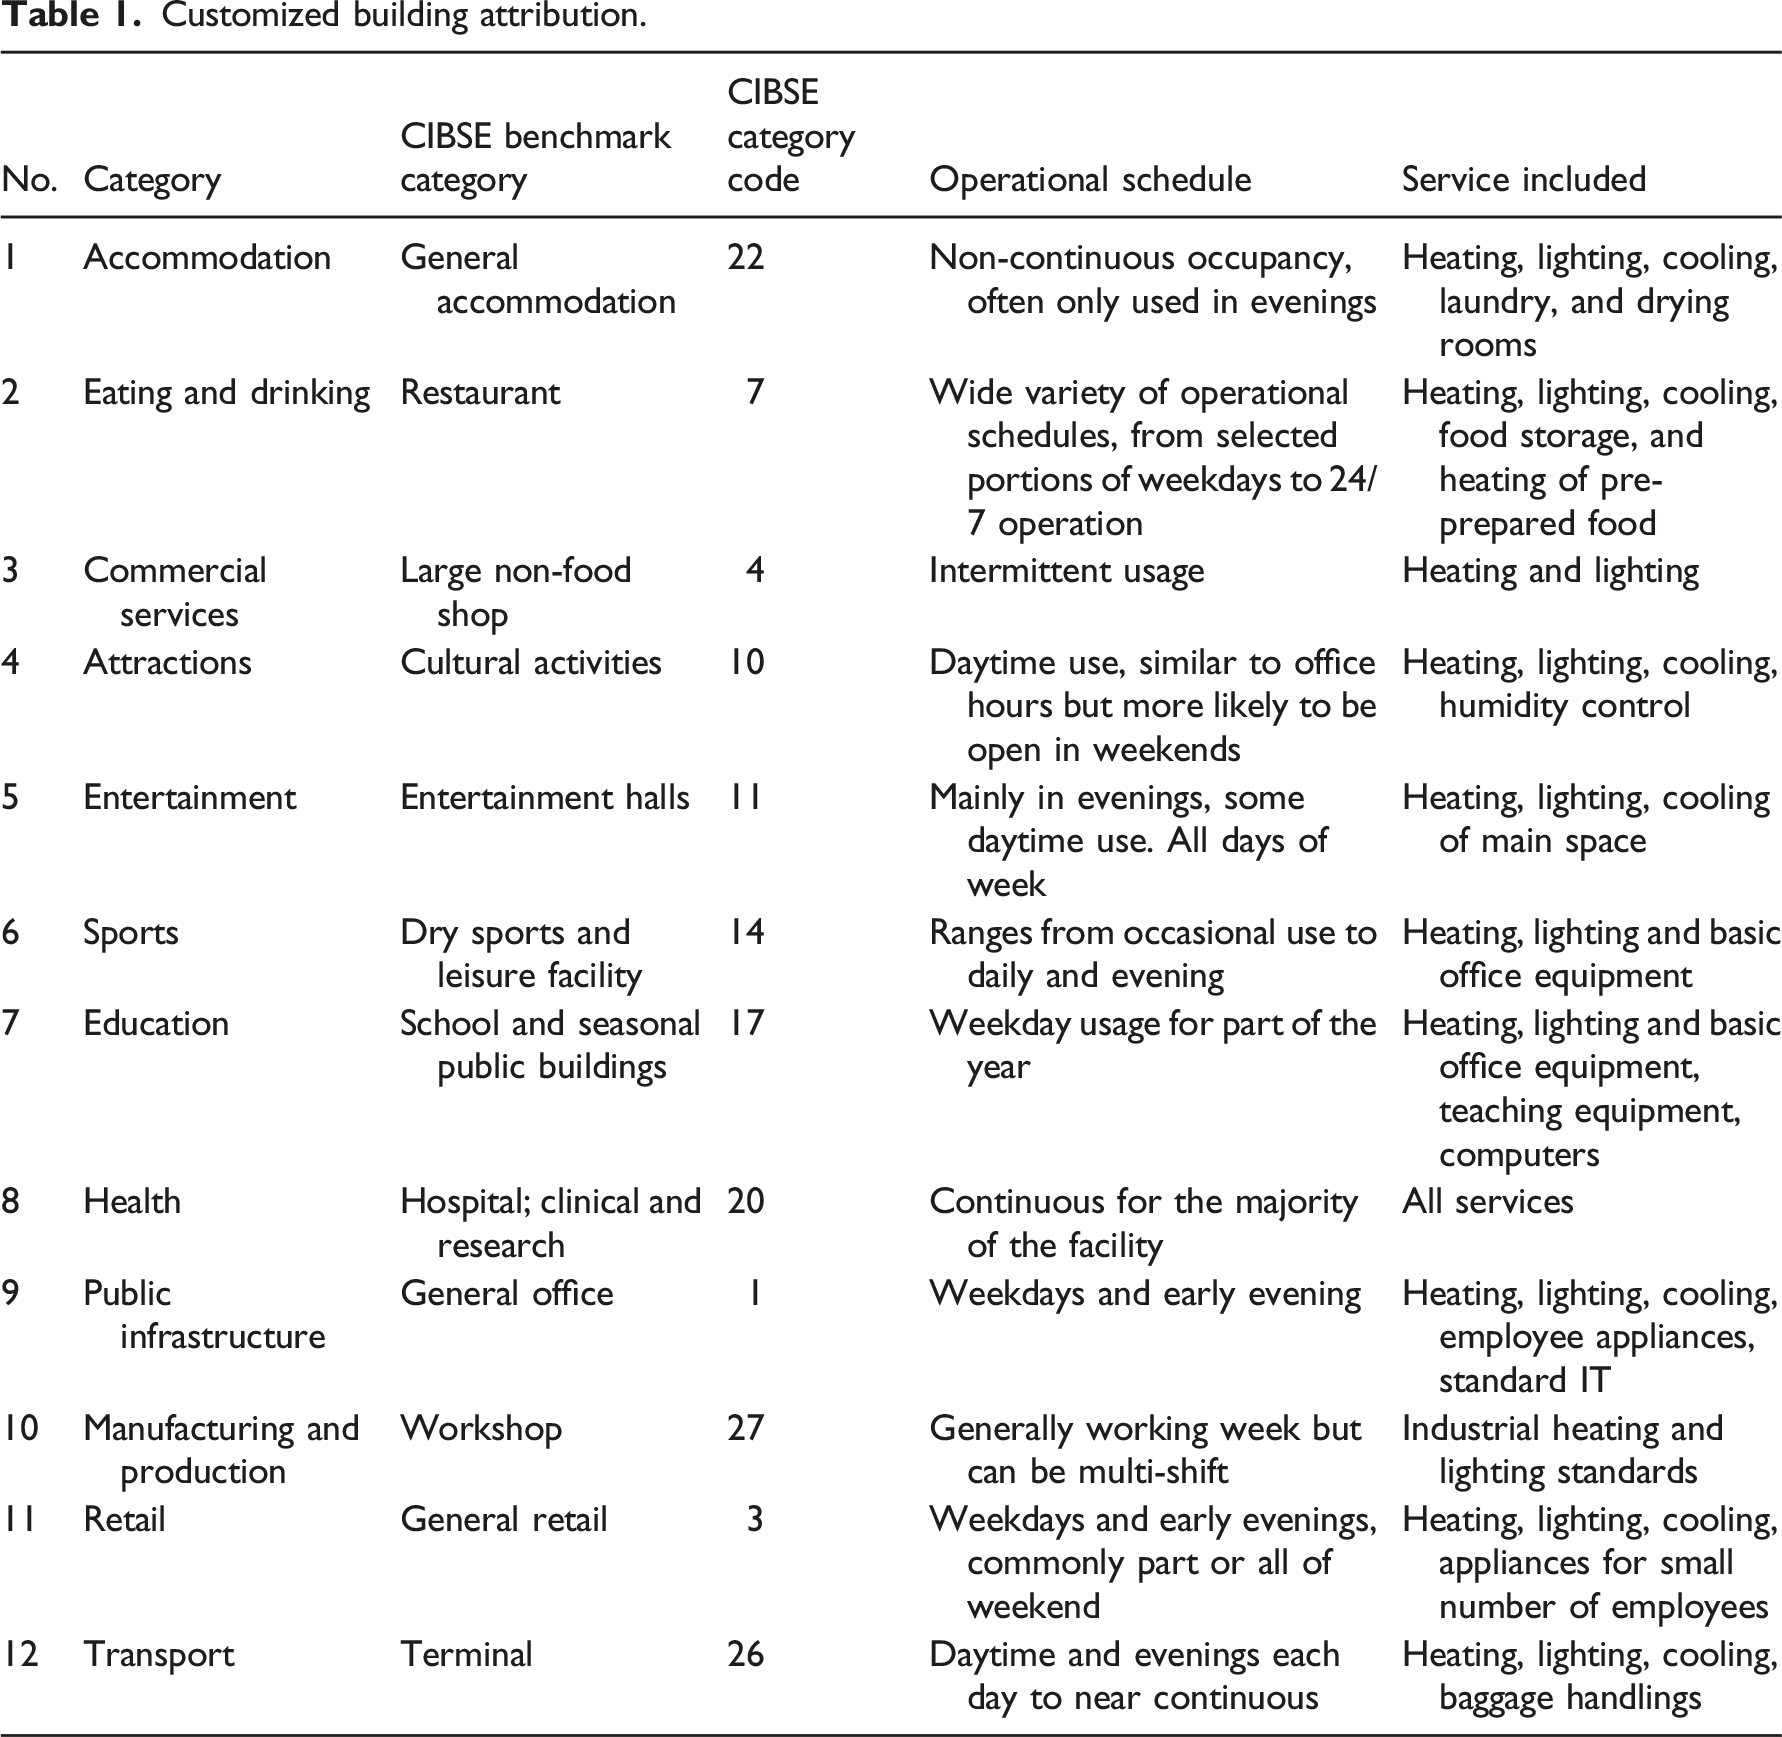
As observed in Figure 5, POI information measured by the Ordnance survey cannot cover all of the buildings in the grid SK38NE. As a result, only 2760 buildings with non-geometry attributions in this region were considered. These buildings were reclassified into 12 new archetypes according to the CIBSE-TM46 Energy Benchmarks (Table 1) for required operational schedules and service types, including energy usage for each building type needed in the simulation. Figure 5(a) shows all 3D geometry of buildings in grid SK38NE. Figure 5(b) illustrates all buildings with 12 selected building types. Figure 5(c) visualizes the total energy demand of selected buildings. (a). Buildings with a GIS database from DigiMap (b); Buildings shaded by selected building types (c); Visualization map of total energy demand of selected buildings. Customized building attribution.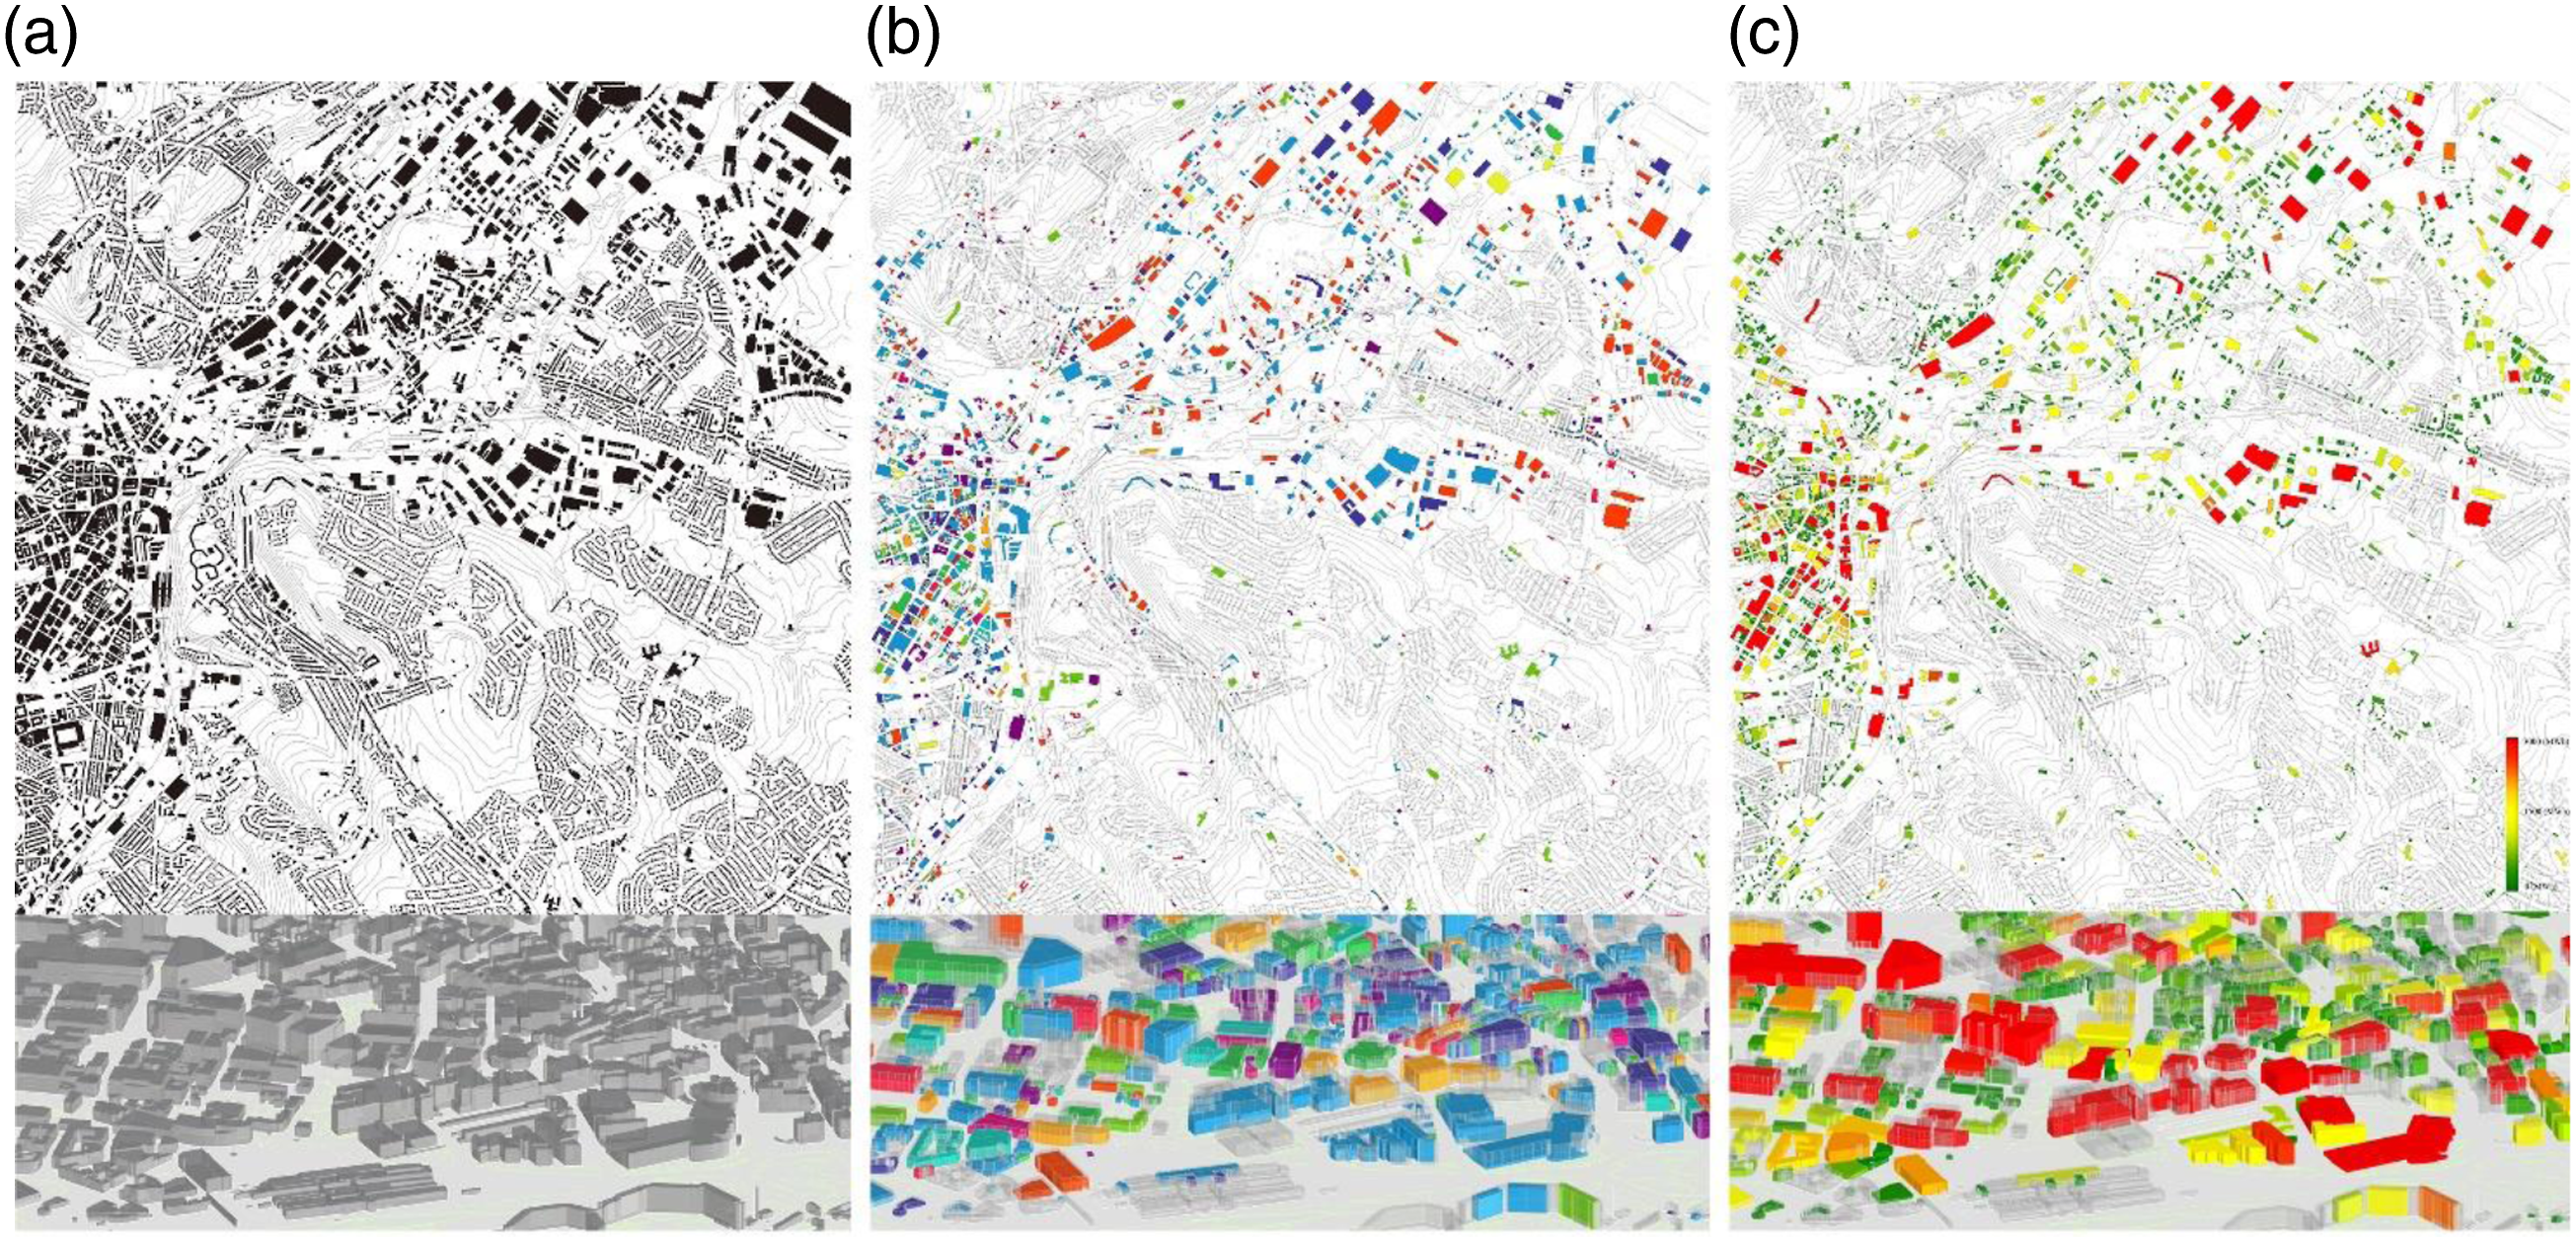
Typical building generation
Three prevailing methods for thermal zoning in large-scale simulation include (1) OneZone, (2) Prototype, and (3) AutoZone. 23 For simplest UBEM, the OneZone model employs a single zone with steady state heat balance model of each building archetype, whereas AutoZone (or multi-zone dynamic thermal models) method can automatically divide the building footprint into one or multiple core zones and perimeter zones to deal with more detailed urban design choice.23,26 By comparing the three methods, Chen and Hong further suggest that for future UBEM studies, the AutoZone method should be used to split the core and perimeter zones to better represent the dynamic performance of urban buildings. 23 In this ‘Scale-up methodology’, the AutoZone method is chosen to simulate energy demand in this region. the advantage of this simulation method is the consideration of more factors, including the geometry of the individual building, orientation, and adjacent buildings, which can significantly influence the simulation result. 27 Ultimately, 120 of 2760 (10 for each type) buildings were selected as representative buildings to calculate EUI for each archetype.
The AutoZone method’s perimeter zone is a 5-m-depth space along the facade. It should be subdivided into multiple spaces with glazed exterior surfaces for different orientations. The remaining floor area surrounded by the perimeter zone forms the ‘core’ zone. Dogan and Reinhur developed an algorithm to automatically determine the perimeter and core zone according to the geometry layout. This algorithm was further developed to a plugin of Grasshopper named ‘Autozoner’ to deal with the complex geometry of floor plans.
28
The limitation of this component is that it only allows calculation on 2D graphics and cannot automatically generate multi-zone thermal models. In this paper, we designed a program combining components of Honeybee with ‘Autozoner’ to generate a multi-zone thermal model for simulation. This module automatically creates a thermal zone after importing the building footprints (Figure 6). The thermal zone for each floor is then divided into a ‘perimeter’ zone and a ‘core’ zone bounded by surface types of wall, interior wall, window, floor, and roof with different U-values. Test for thermal zone module to deal with different sample geometry.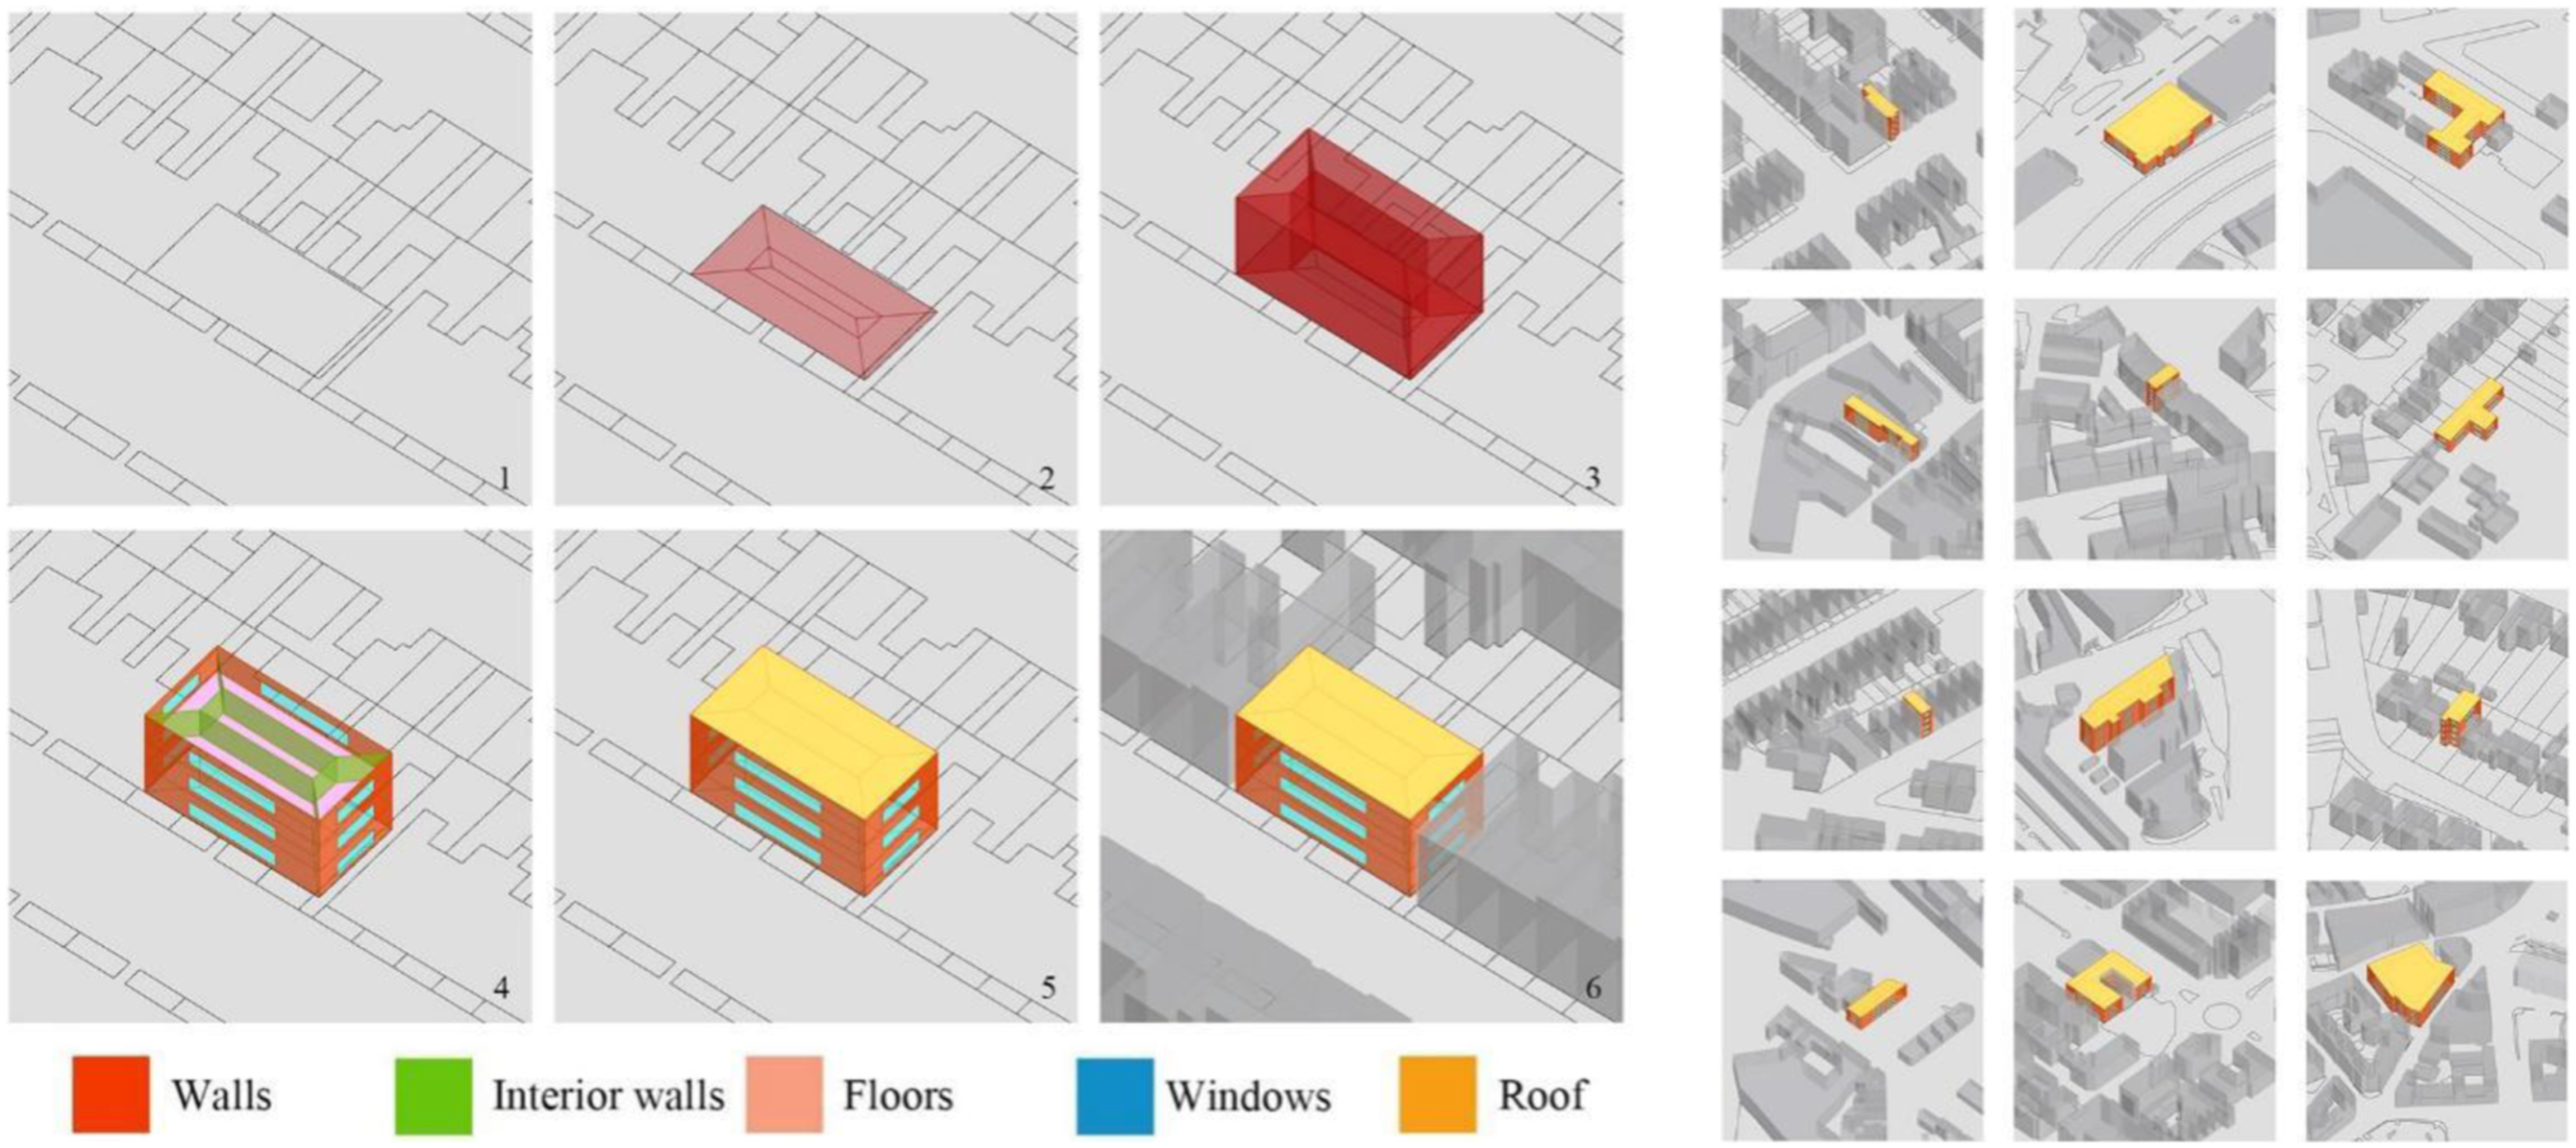
Running simulation
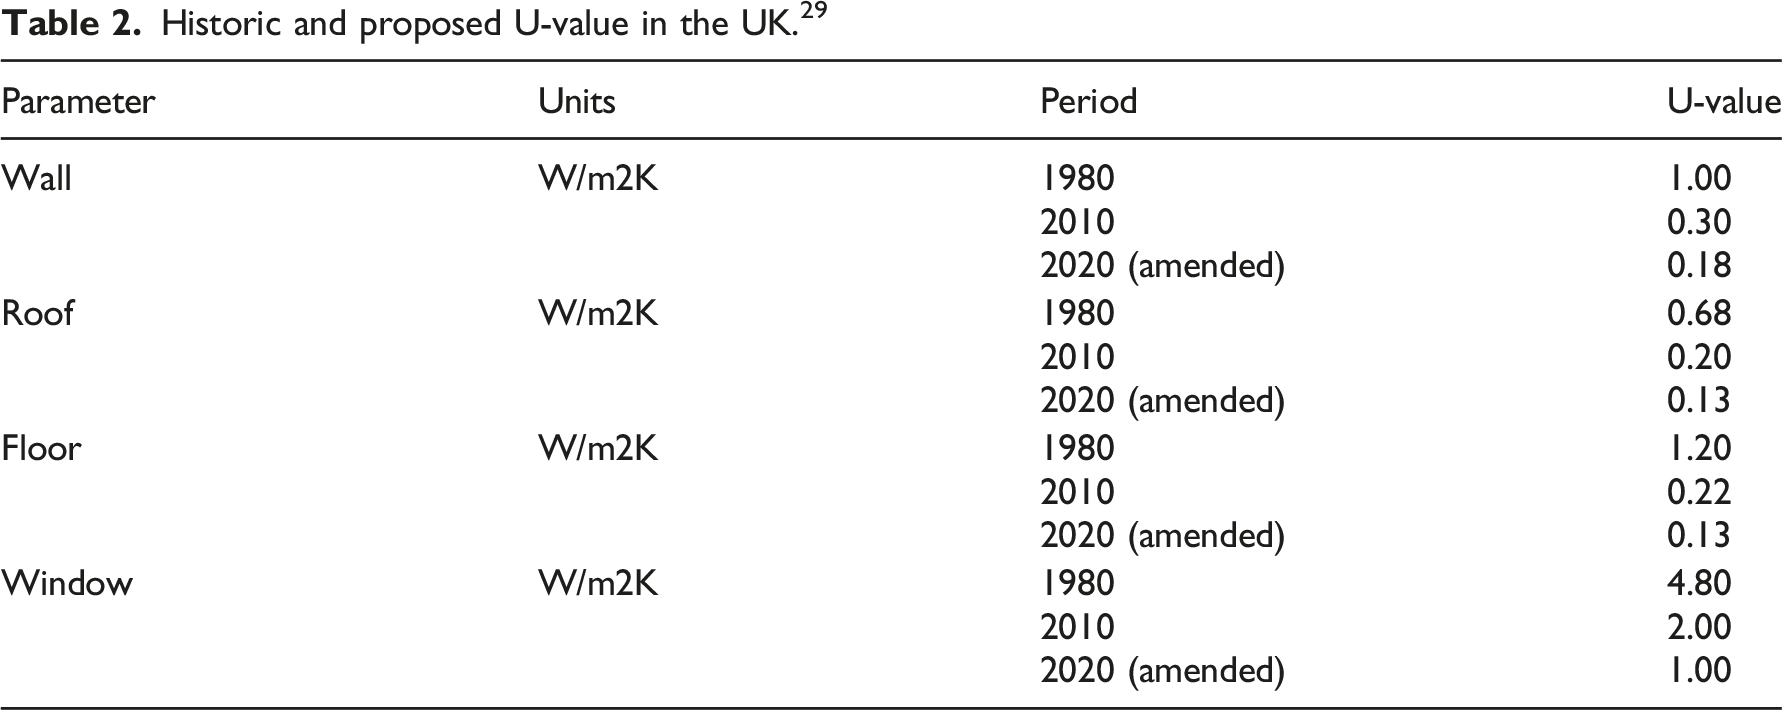
Historic and proposed U-value in the UK. 29
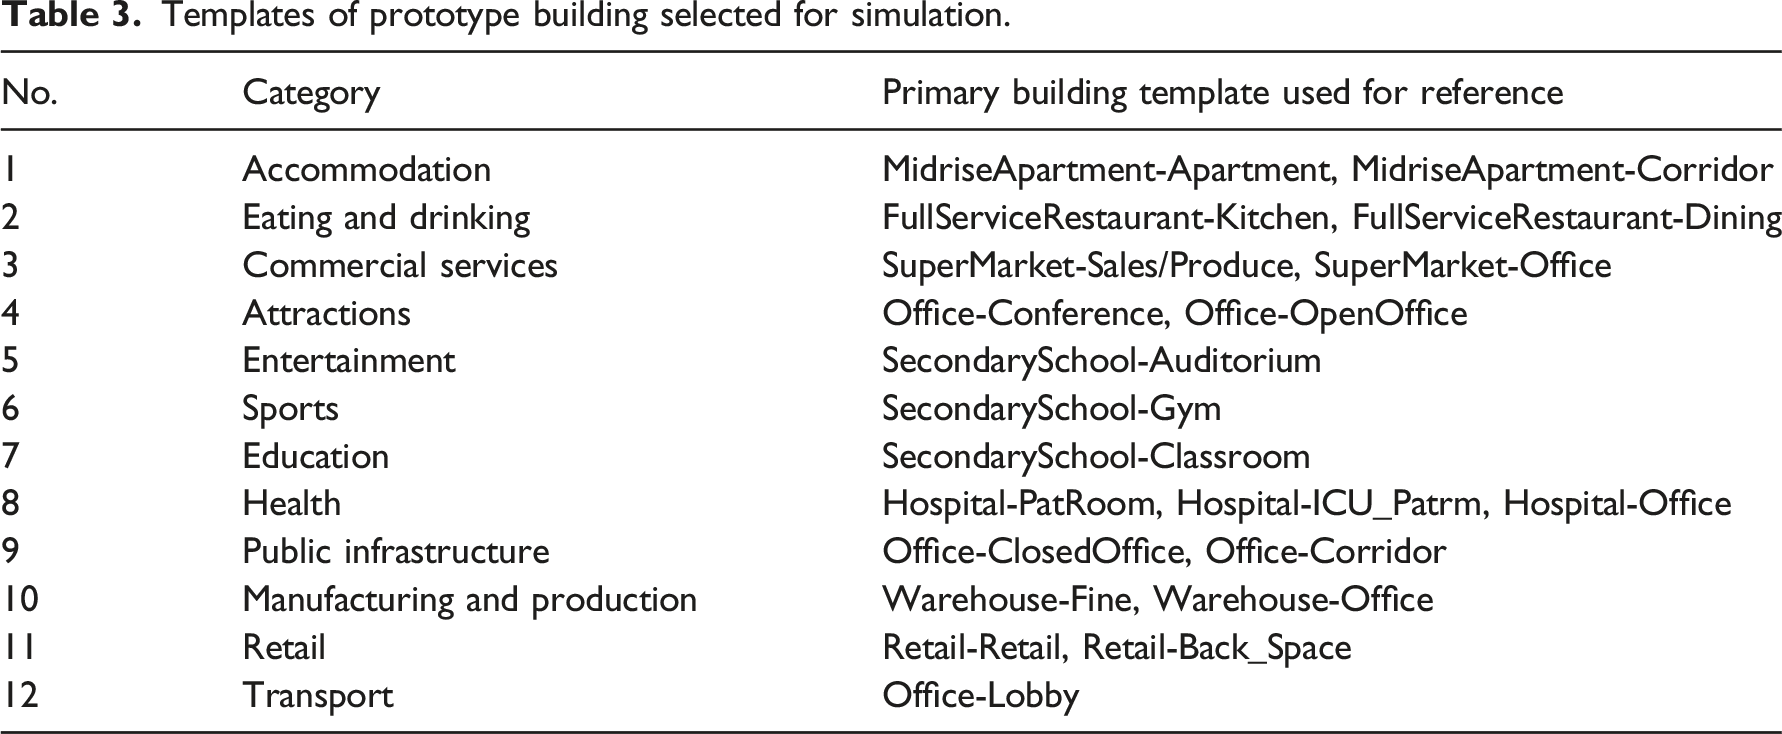
Templates of prototype building selected for simulation.
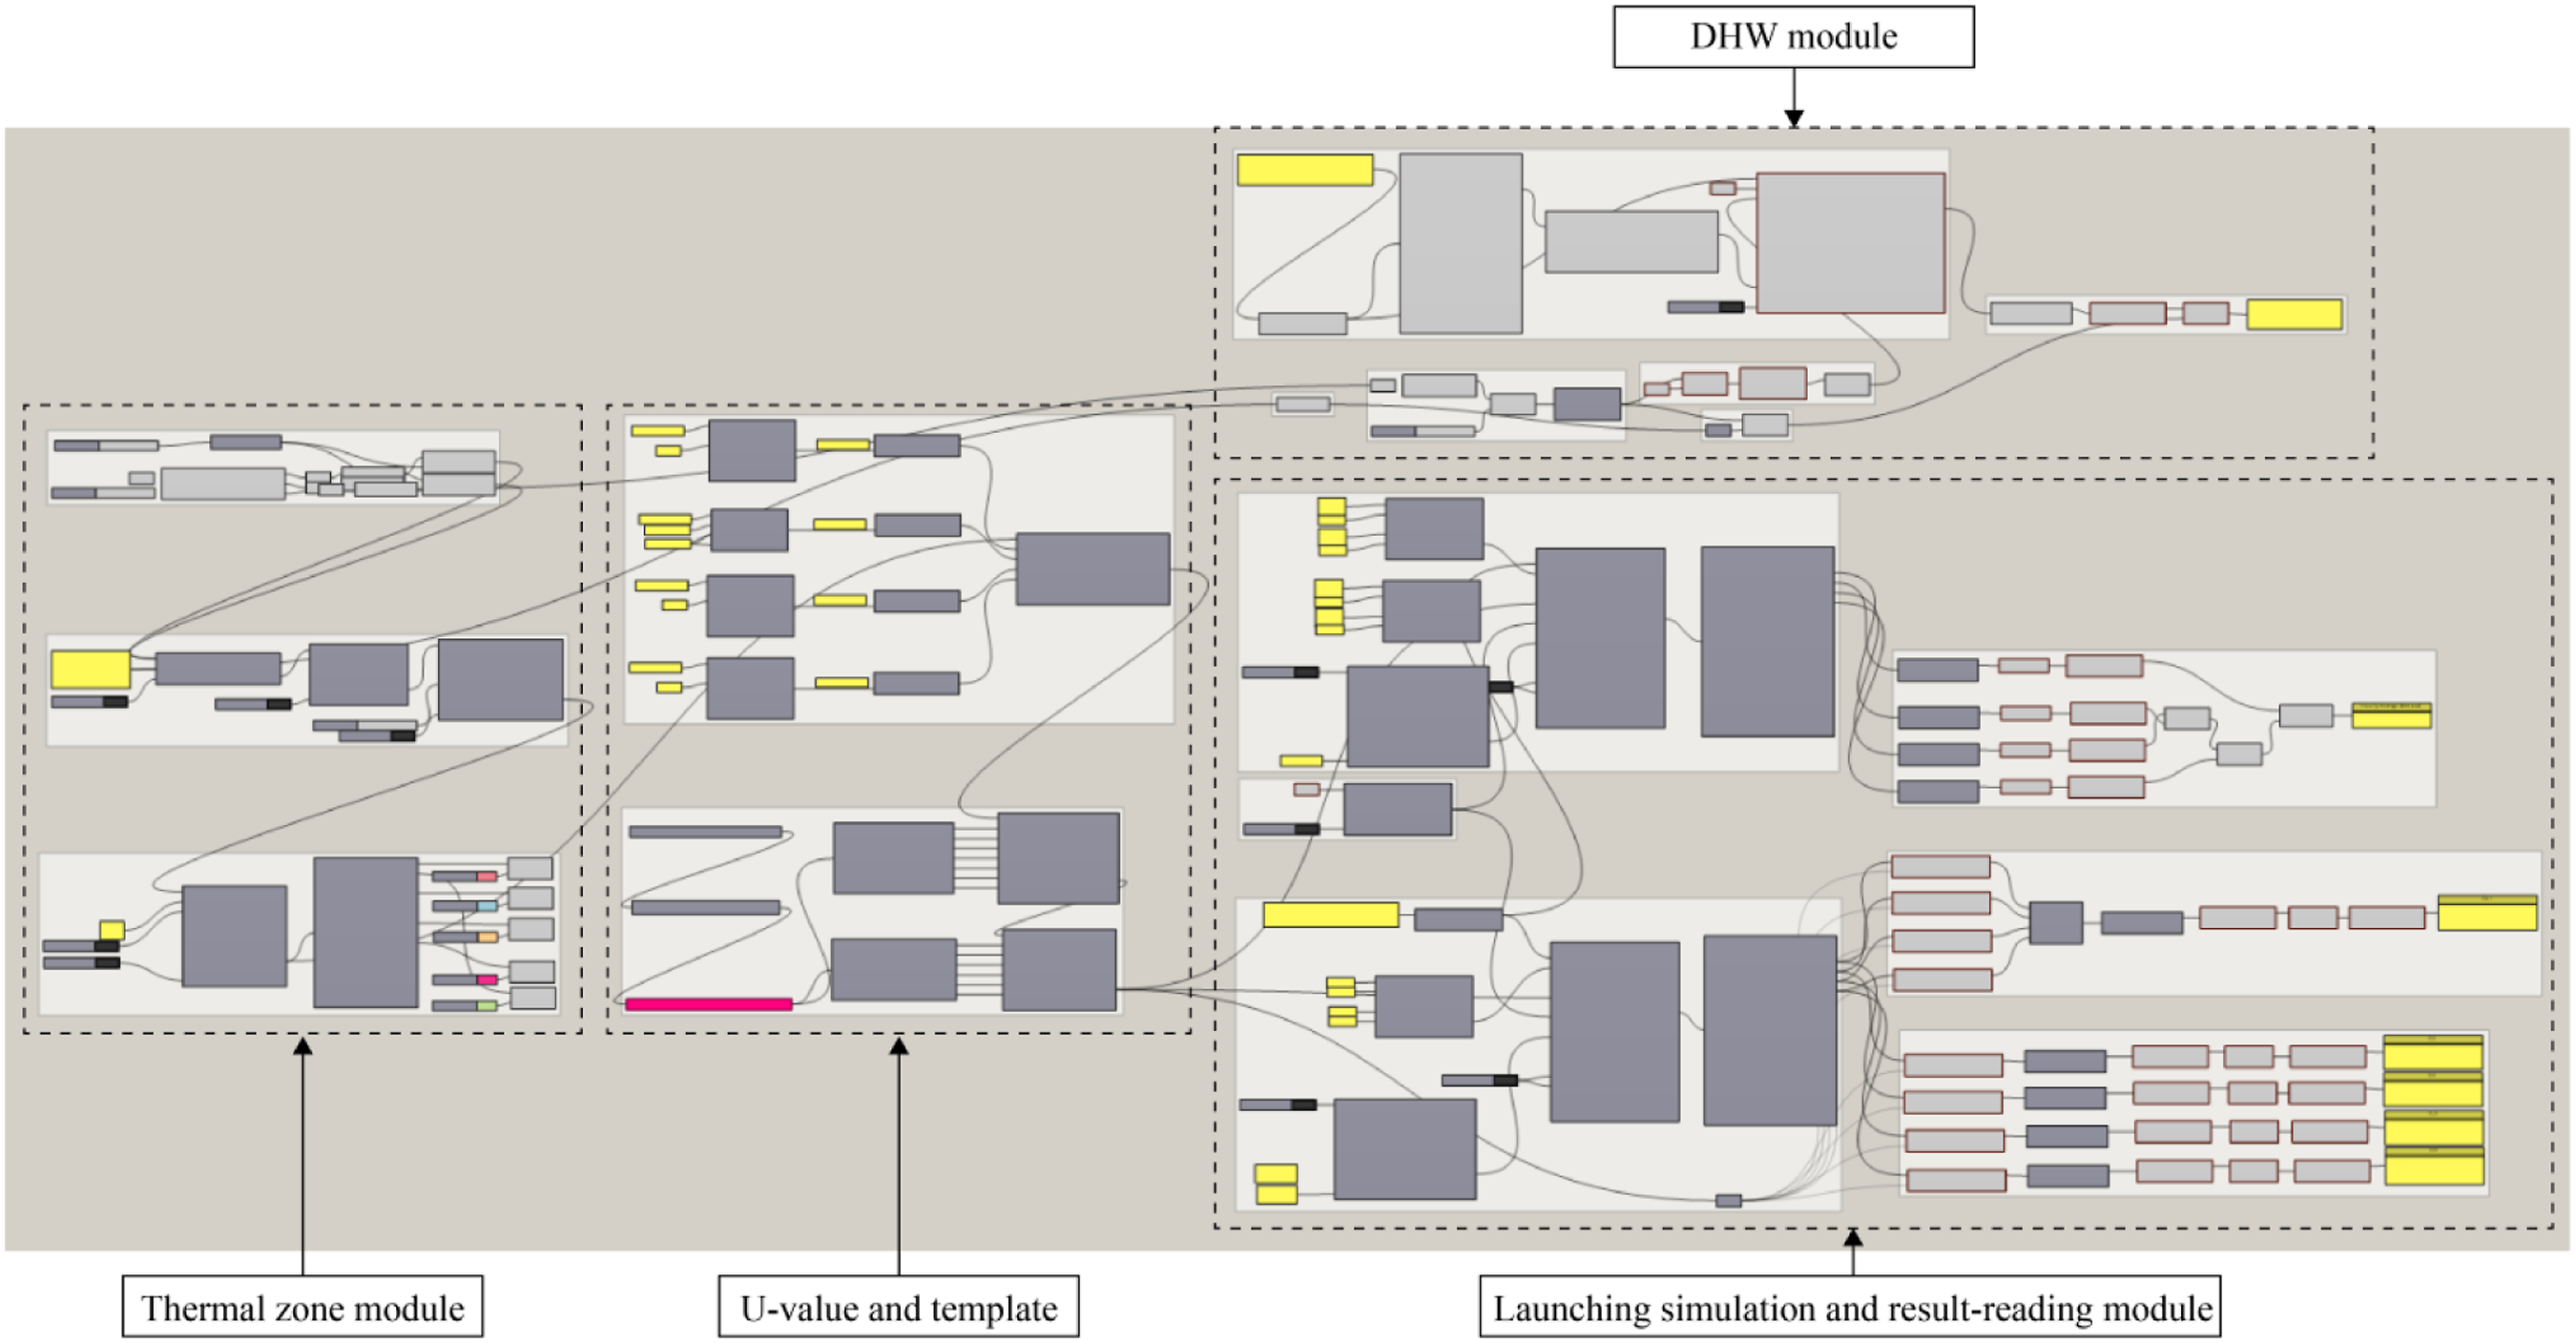
All components integrated for running simulation.
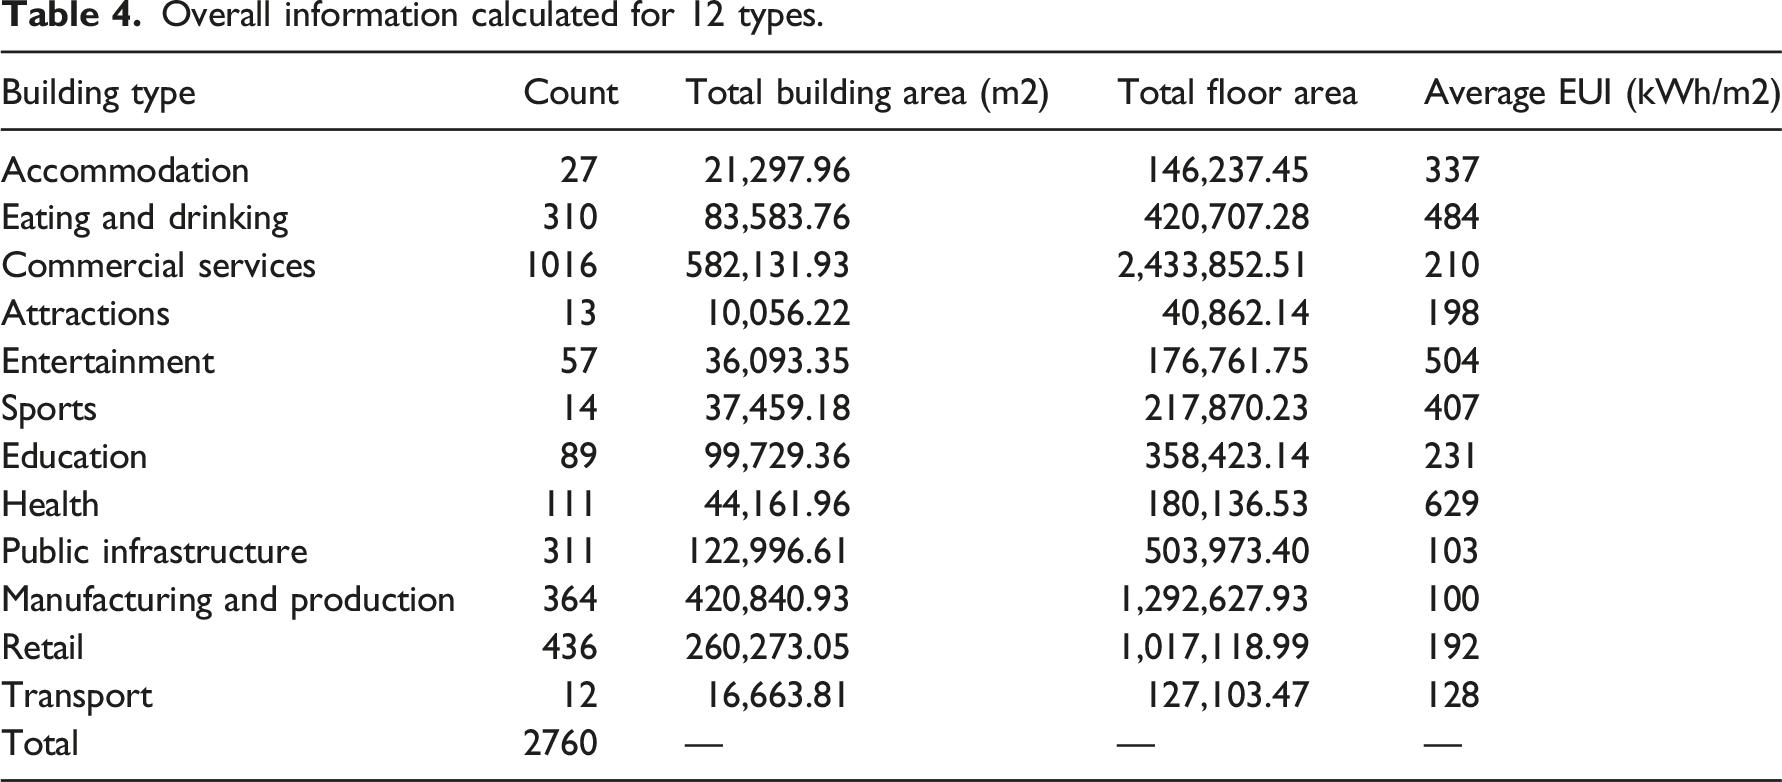
Overall information calculated for 12 types.
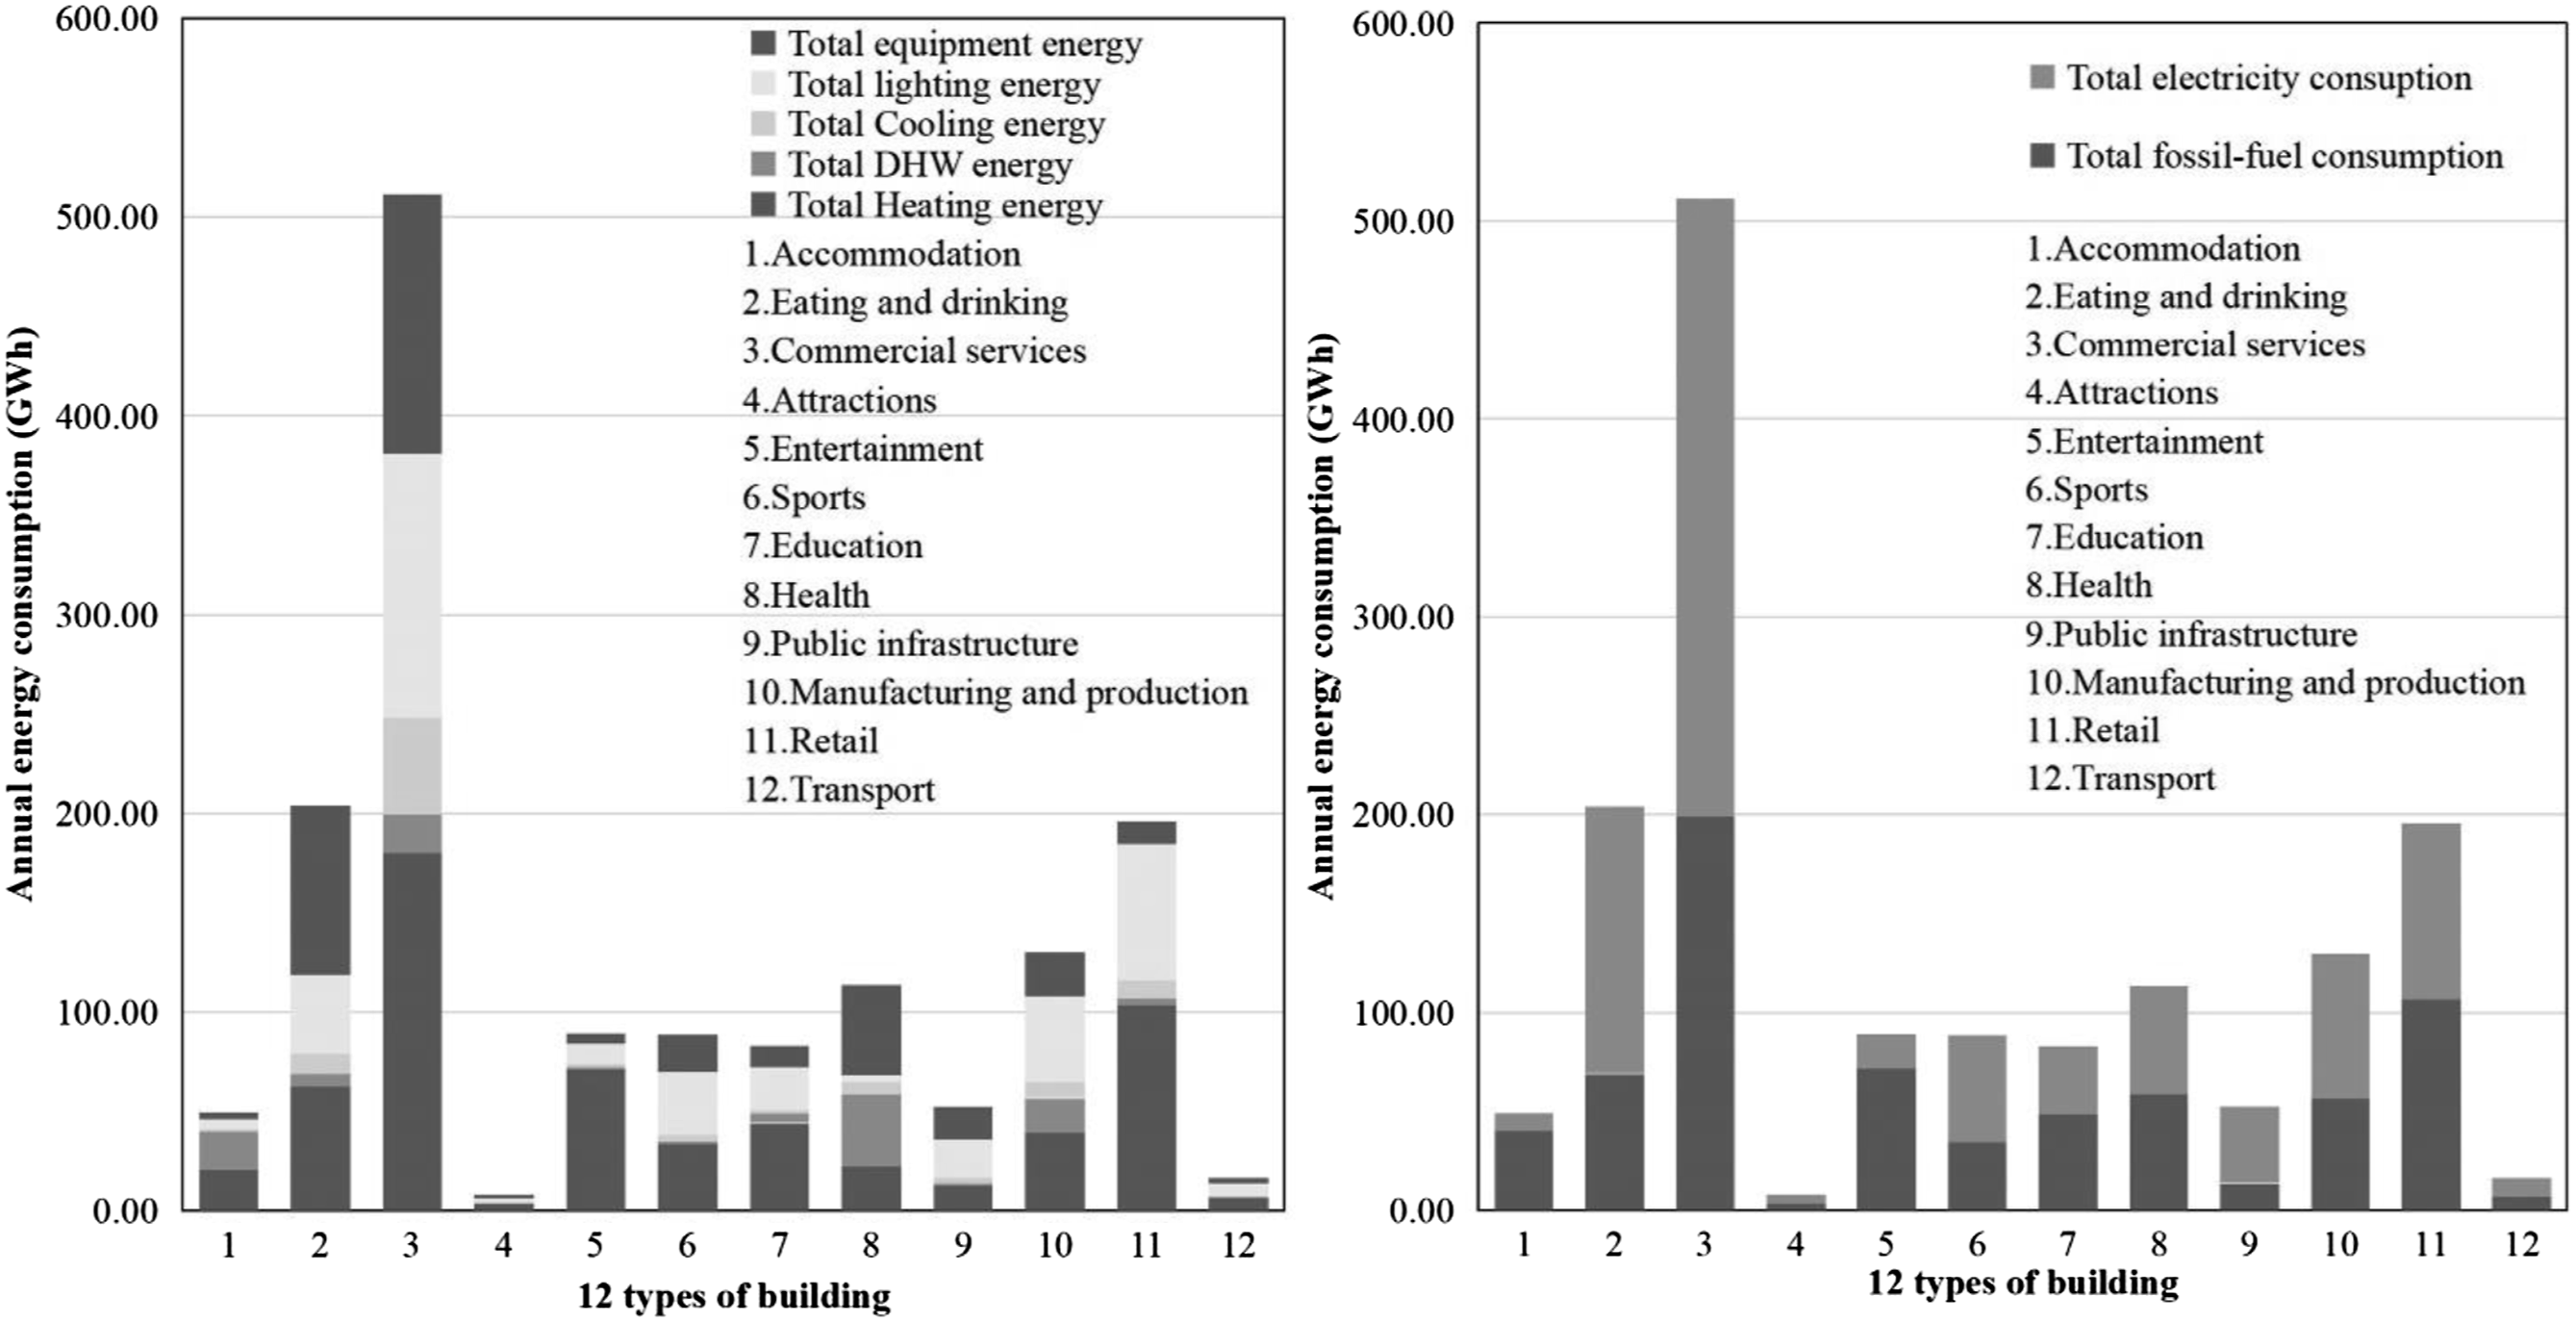
Annual energy demand of 12 types in grid SK38NE.
Summary of the simulation programme
Parametric design is a useful tool for architects and designers in building environments, as it allows them to specify critical parameters of their models and make interactive modifications. 33 The advantage of data-driven workflow in this study is that it fully relies on the integrated dataset, and such dataset about building archetype can highly present the characteristic of urban in built environment. Any changes made to the model will automatically propagate through the rest of the associated components. This study’s streamlined workflow initiates from the required geometry information generated in the Typical Building Generation session. and the local weather conditions to carry out energy demand simulations.
Despite the uncalibrated simulations to have low accuracy in predicting energy use, they can still be valuable for assessing trade-offs between different building or equipment scenarios.
34
Furthermore, errors in simulations for individual buildings can be reduced when scaled up to represent the demand profile of a wider region. Studies have demonstrated that uncalibrated UBEMs can yield results that are close to actual energy use at the building stock level, with errors of less than 20% in energy use intensity.
26
Figure 9 shows the result of the average EUI of 12 building types. According to the Department for Business, Energy and Industrial Strategy, the building use that has the highest energy intensity is Hospitality (mainly consisting of restaurants and hotels) in England and Wales.
35
This trend has also been observed in Sheffield, and the energy demand for eating and drinking is the third highest among 12 building types. Compared with CIBSE-TM46 Energy Benchmarks, the results indicate that 67% of the building can reach the standard of CIBSE with a U-value of 2010 in the Sheffield area, whereas usage for health badly exceeds the standard by 23%. As the approximation of the energy consumption in Sheffield, this result serves as the foundation to investigate further energy performance improvements.
16
Average EUI of 12 types of building in grid SK38NE.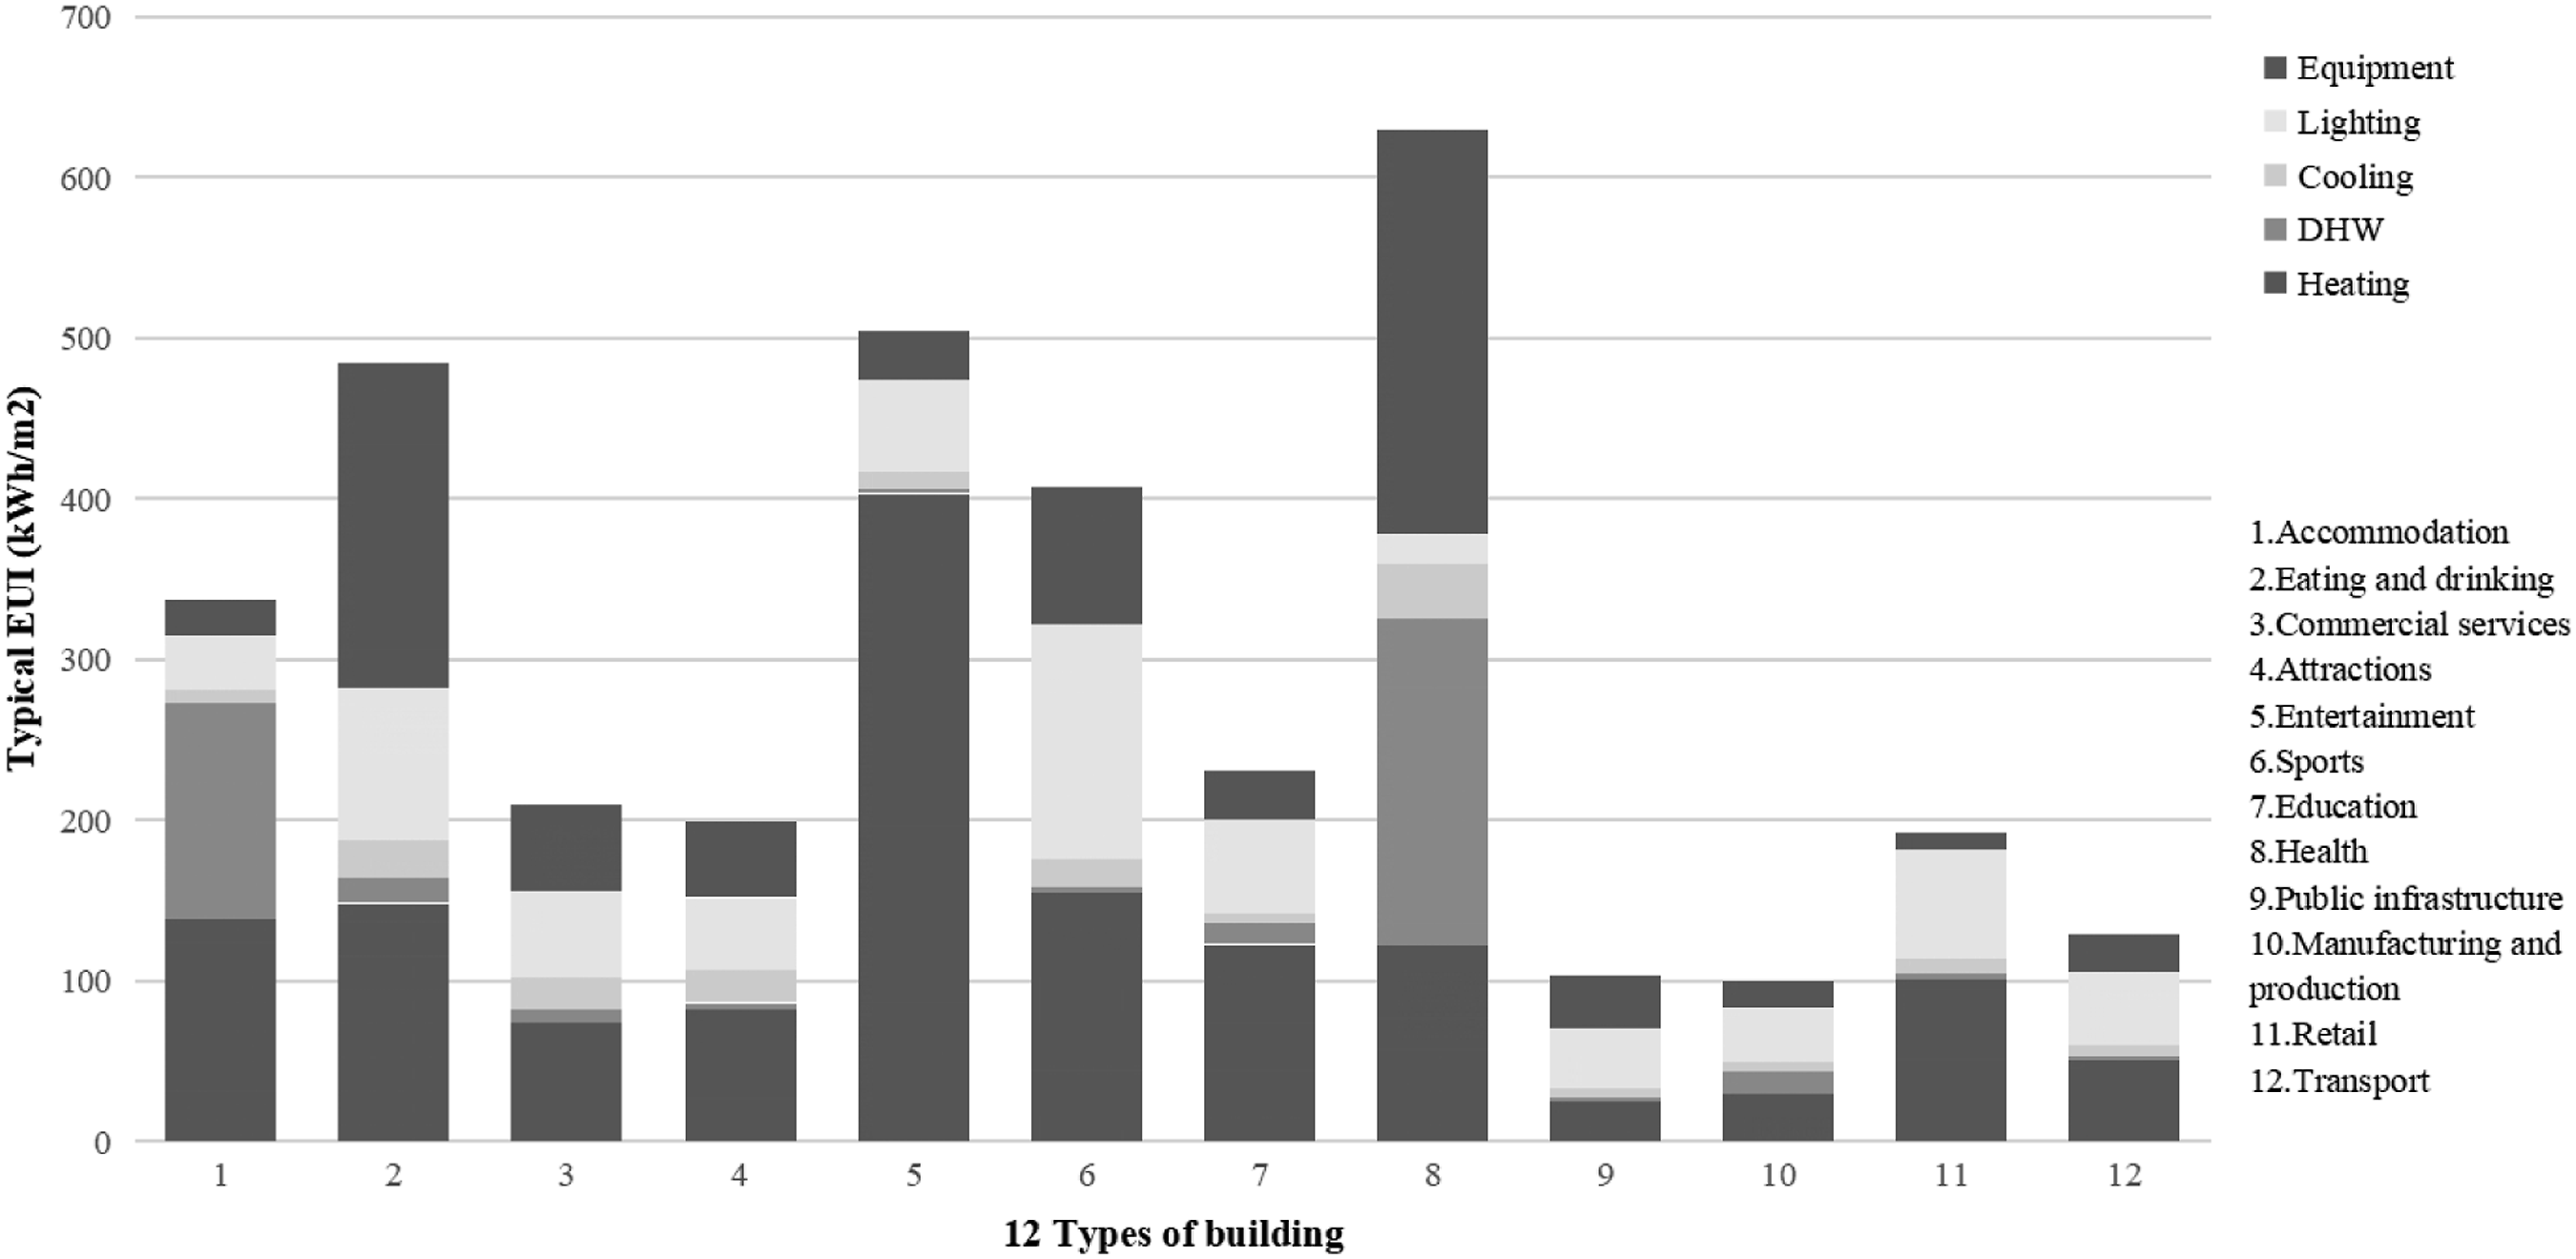
After carrying out 120 iterations (Figure 10), the locations of sample buildings dominate the heating and cooling of the energy demand but have little influence on lighting and equipment loads. This observed phenomenon is due to the orientation of the building and the surrounding context (calculated as ‘shading’) that can significantly affect the simulation of thermal zones. In contrast, the main parameters affecting the demand for lighting and equipment loads are user schedules, energy load settings, and weather.
36
These variables are constant for the same building type, and, therefore, little to no change in the resulting lighting and equipment loads. Frequency of 120 simulation results.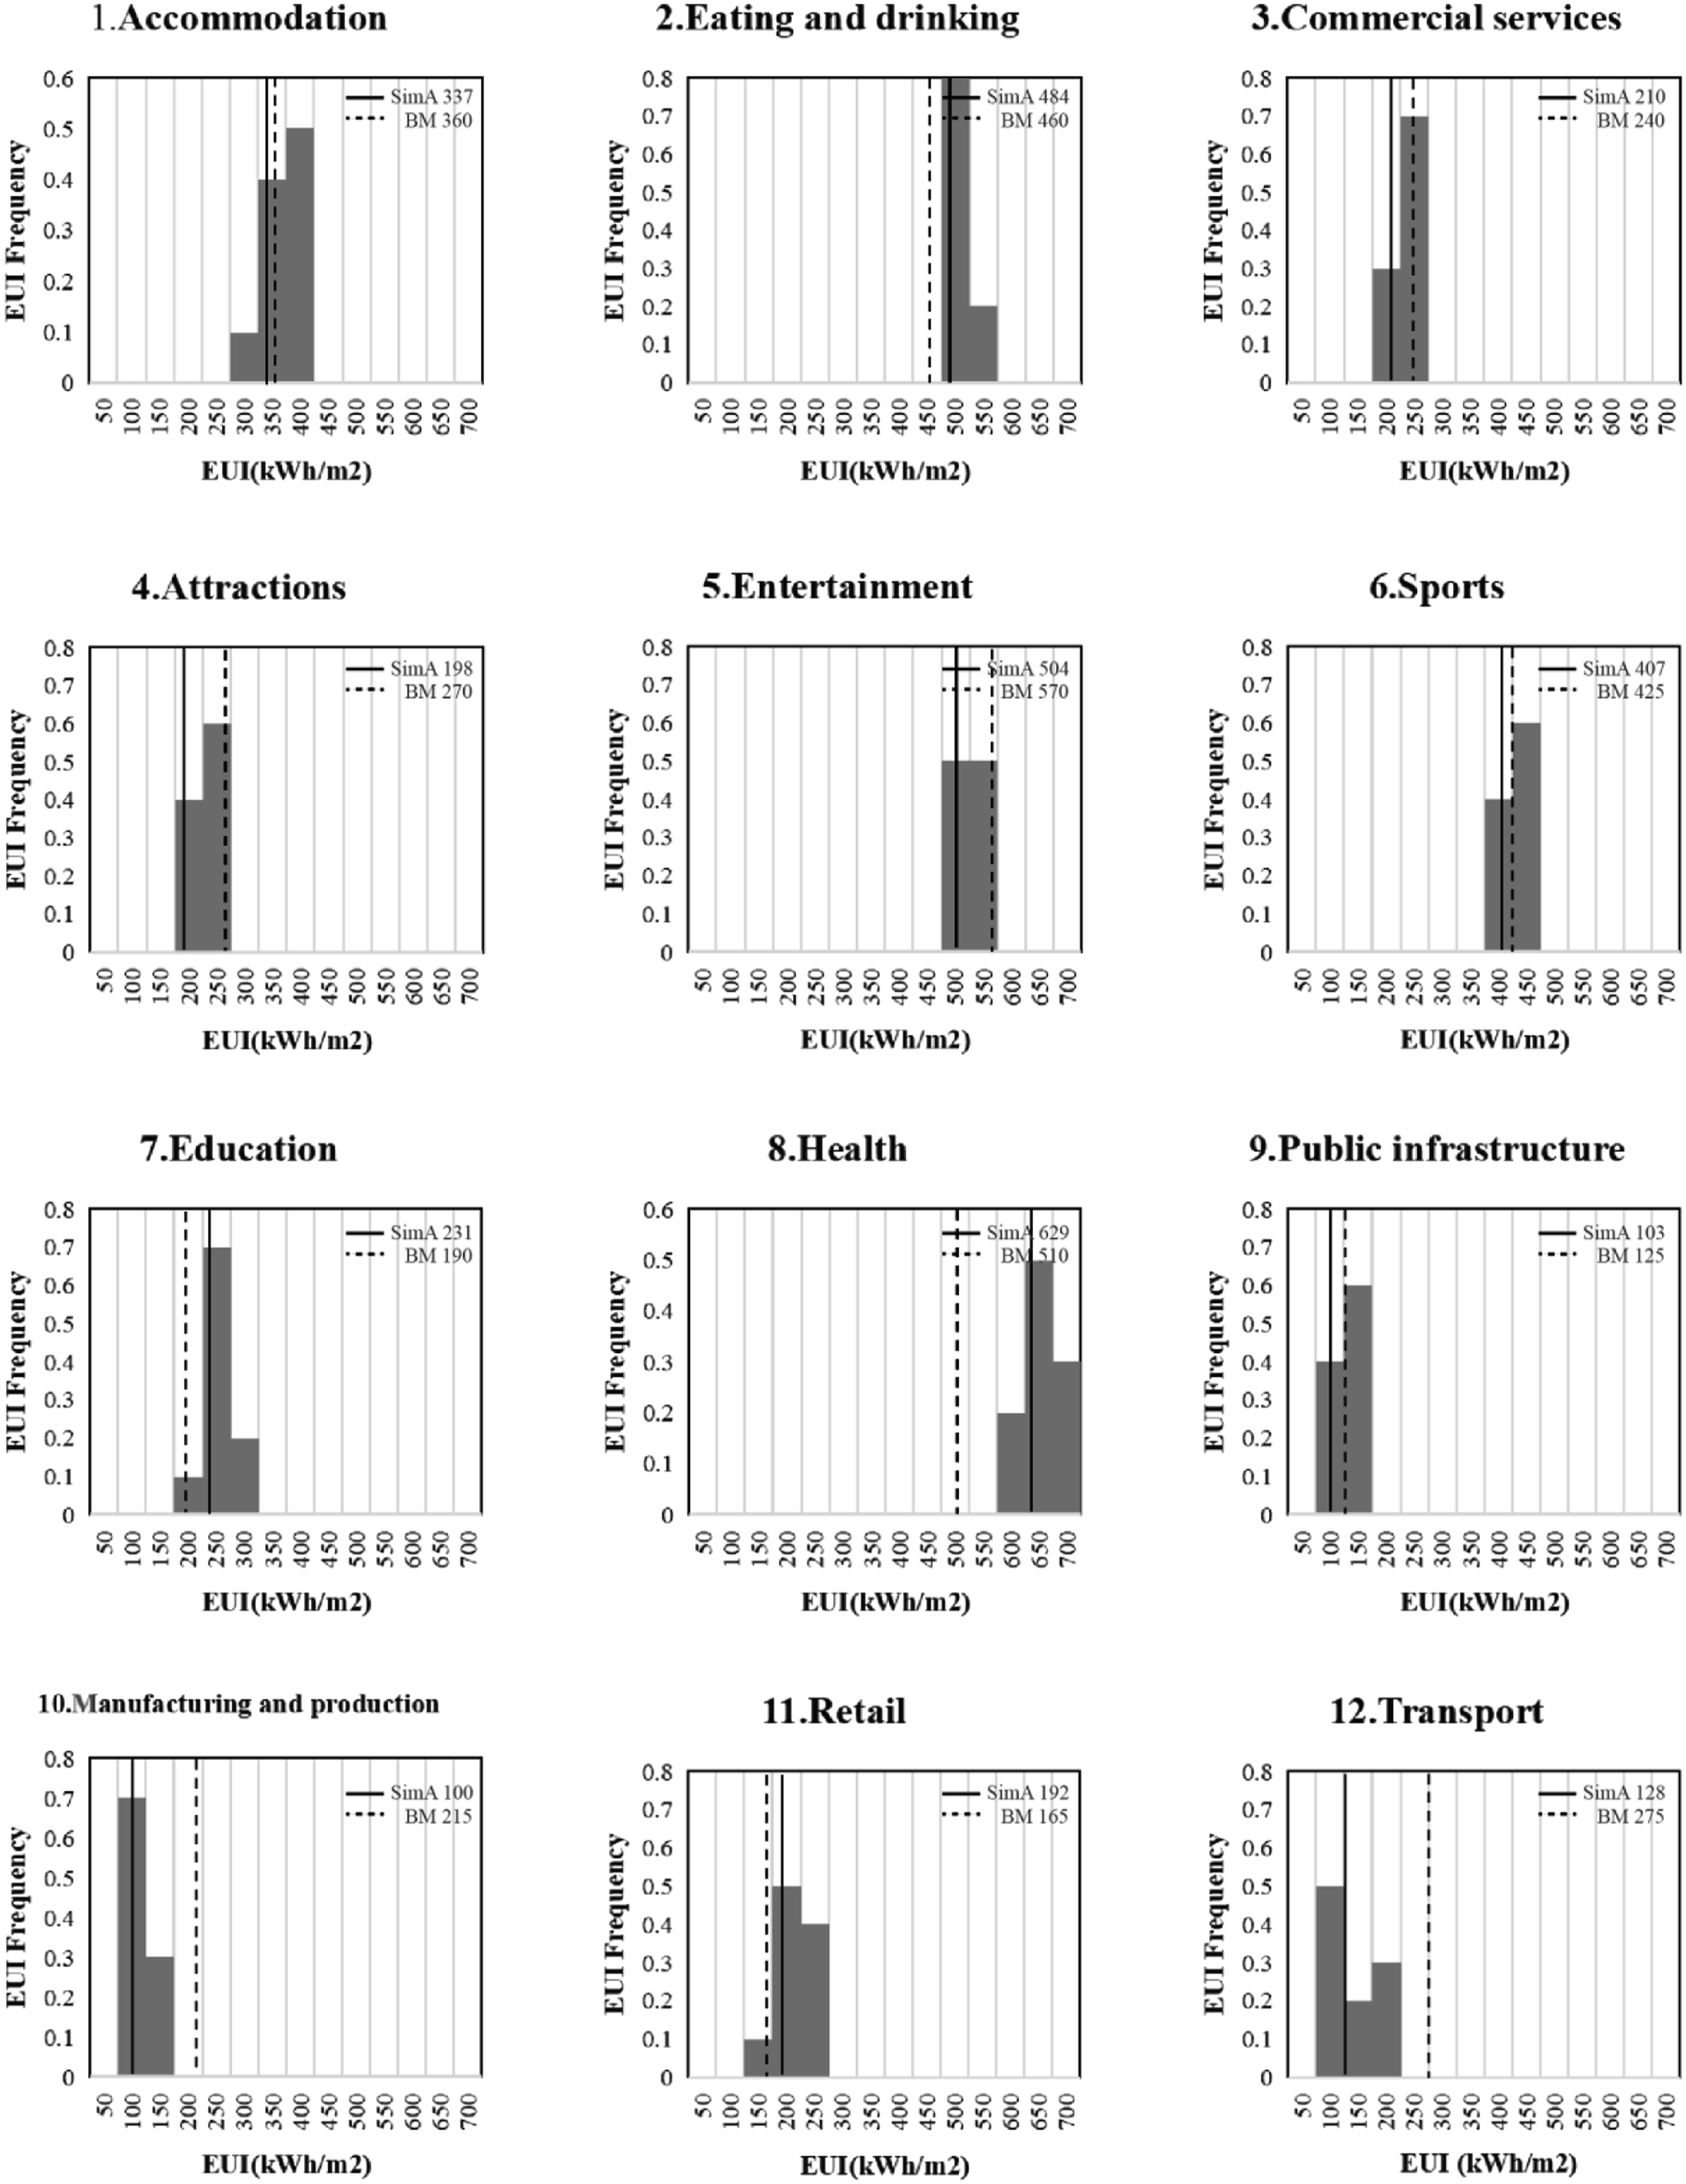
Renewable application
The utilization of UEBM presents a critical opportunity to develop effective strategies for reducing carbon emissions at the building stock level. For instance, software applications such as Umi in Grasshopper enable calculating and visualizing GHG emissions, primarily CO2. 13 To achieve ambitious carbon reduction targets at an urban scale, it is imperative for stakeholders to comprehend the potential energy savings from building upgrades for specific building types when implemented on a broader scale. 15
In this study, CO2 emission was set as an indicator to better evaluate the efficiency of renewable strategies. The weighting factors used for emissions here were 0.19 kg CO2/kWh of delivered fossil fuel (i.e. assuming it is all gas) and 0.55 for electricity19.
37
Figure 11 shows the total CO2 emission of 2760 buildings in grid SK38NE and the proportions of 12 archetypes. In the following sections, the energy demand of the 2760 buildings analyzed in the Sheffield region will be calculated under various renovation scenarios and subsequently translated into corresponding carbon emissions. Annual CO2 emissions of 12 types in grid SK38NE.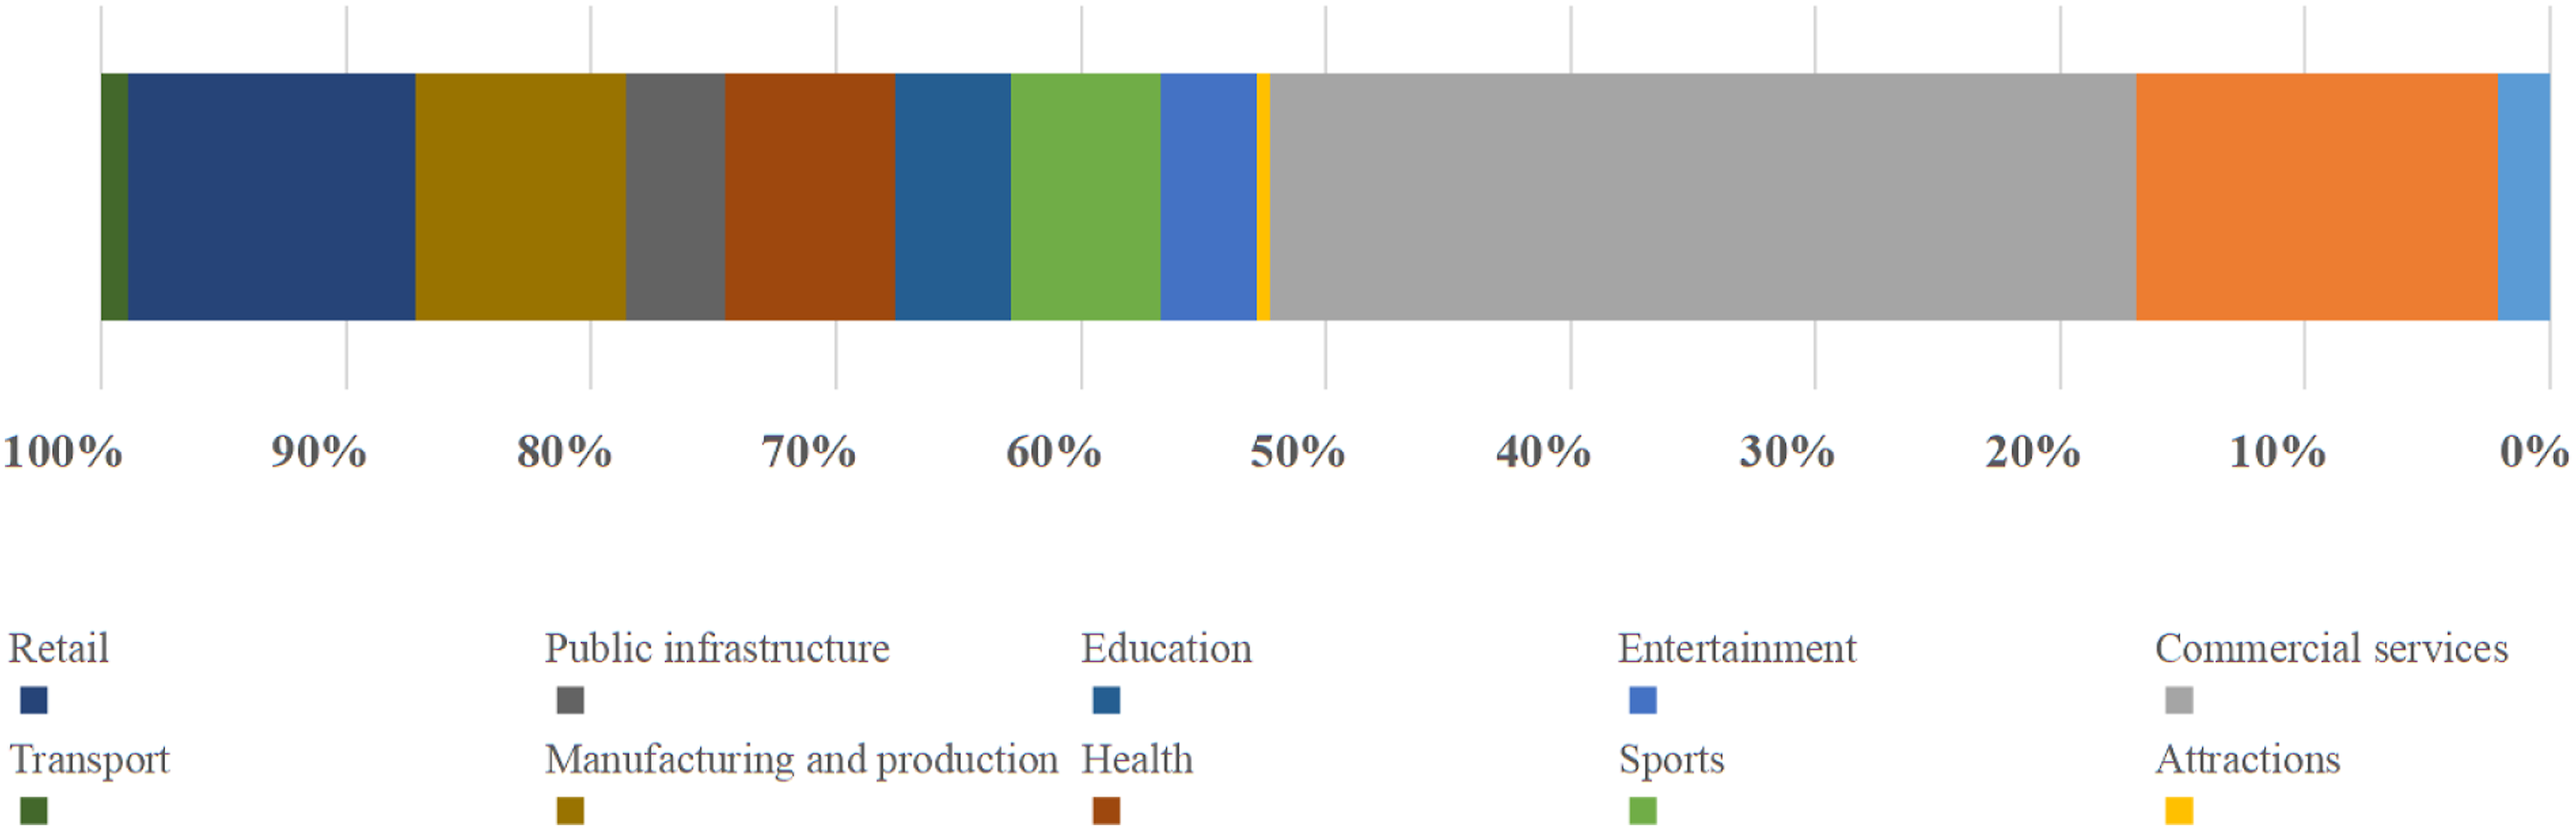
Fabric efficiency
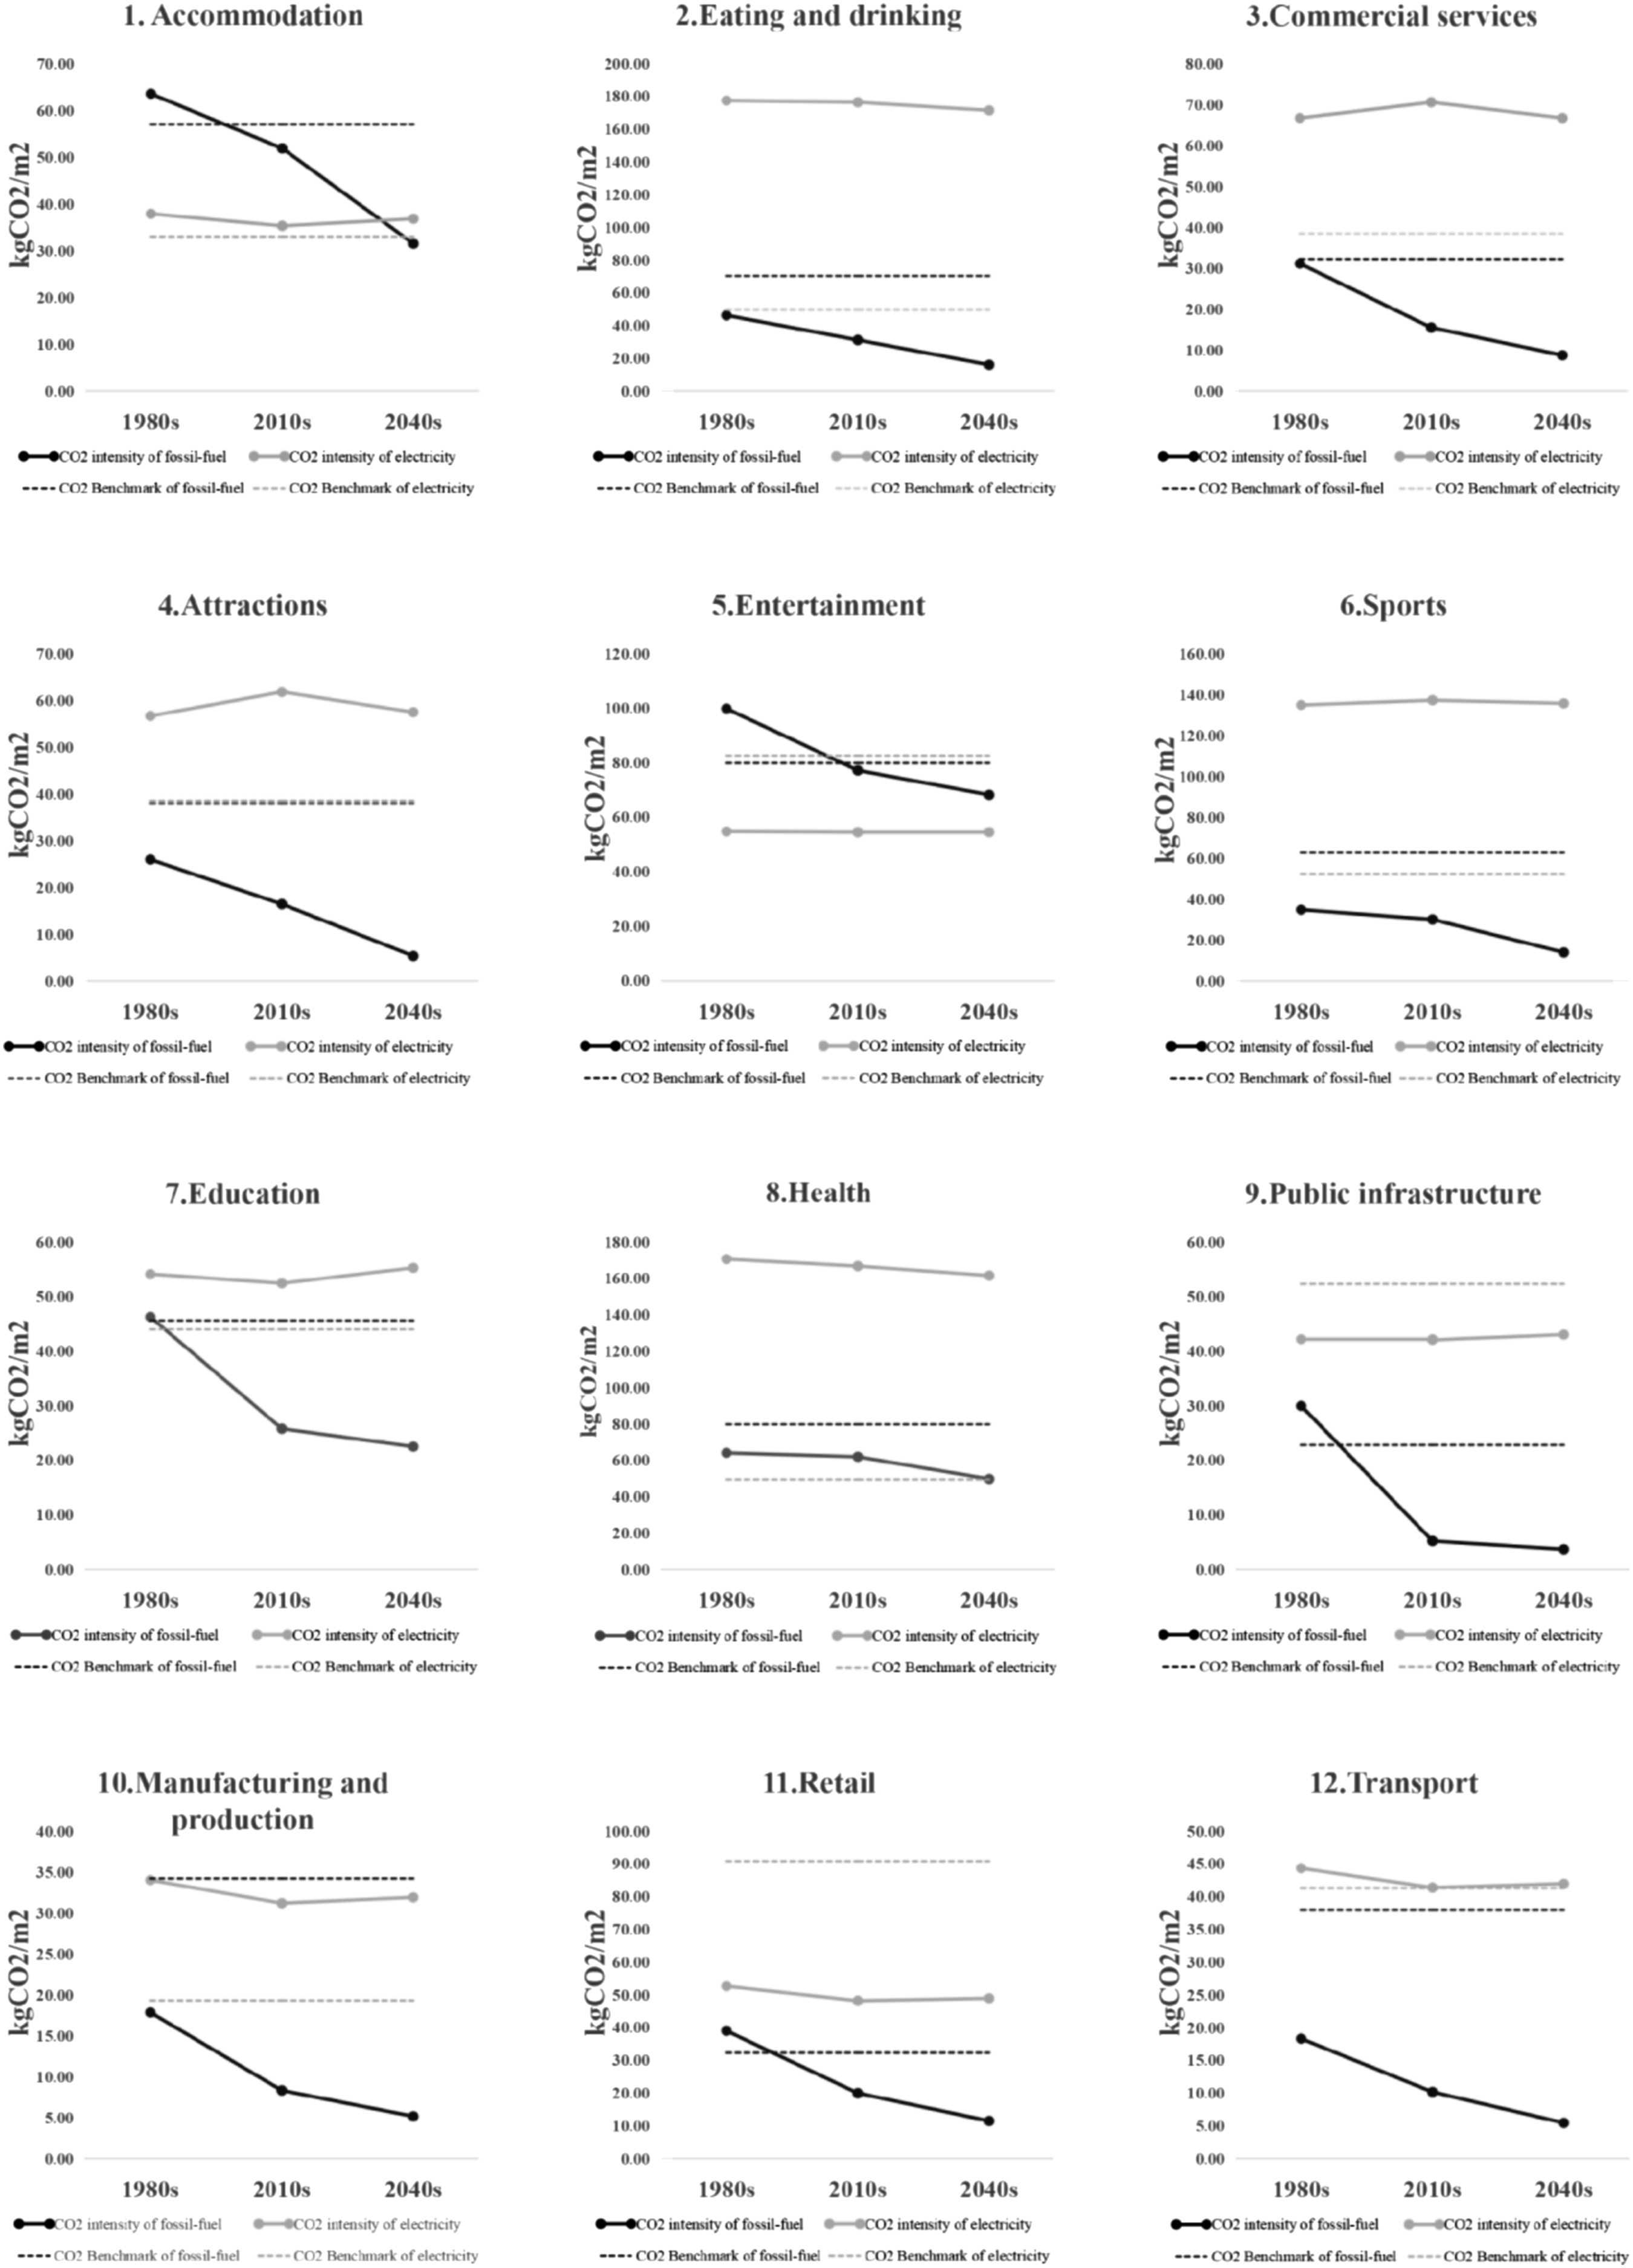
Sheffield city region proposed a target of ‘Net-zero CO2 emission by 2040’, including several goals for the built environment. Among these, quantitative goals are set for building fabric, including 65,000 cavity walls and 119,000 solid walls insulated by 2040. These goals are encoded into three replaceable components in the computational workflow of this study with three specific U-values of different times (the 1980s, 2010s, and 2040s), as shown above in Table 2. An extra 240 simulations were carried out with three alternative U-values to observe the energy demand changes over different decades.
In conclusion, the results indicate that enhancing building fabric efficiency can significantly reduce the CO2 intensity of fossil fuel consumption across all 12 building types. Notably, the ‘Accommodation’ building type is projected to achieve the highest reduction, with a 53% decrease by the 2040s compared to the 1980s, as illustrated in Figure 13. By 2040, all 12 building types can meet the CO2 intensity of fossil-fuel standards set by CIBSE. However, less effect on the CO2 intensity of electricity caused by fabric improvement was observed. The findings confirm that altering the building fabric does not necessarily impact a person’s lighting or equipment usage. However, it can effectively minimize heat loss, reduce the consumption of fossil fuels required for heating, and ultimately contribute to carbon emissions reduction. As illustrated in Figure 12, the EUI for the 12 types exhibit a significant decline from 1980 to 2010, primarily attributed to advancements made in building fabric. However, the EUI decline of most archetypes reached a plateau by 2010, and despite the continuous improvement made after 2010, only a descent reduction rate of EUI was achieved. The total carbon emissions of each building type were reduced to varying degrees from 1980 to 2040, where buildings used for commercial services achieved the most reduction (30% overall, as shown in Figure 13). However, such change still cannot meet the goal for total reduction set by EU Commission (40% from 1990). The findings suggest that mitigating GHG emissions necessitates collective efforts across various fields rather than solely relying on measures within the built environment. (Left) Total CO2 emission changes of 12 building types from 1980 to 2040; (Right) EUI change of 12 types from 1980 to 2040 in grid SK38NE. Simulated CO2 intensity and benchmark of 12 types from 1980 to 2040.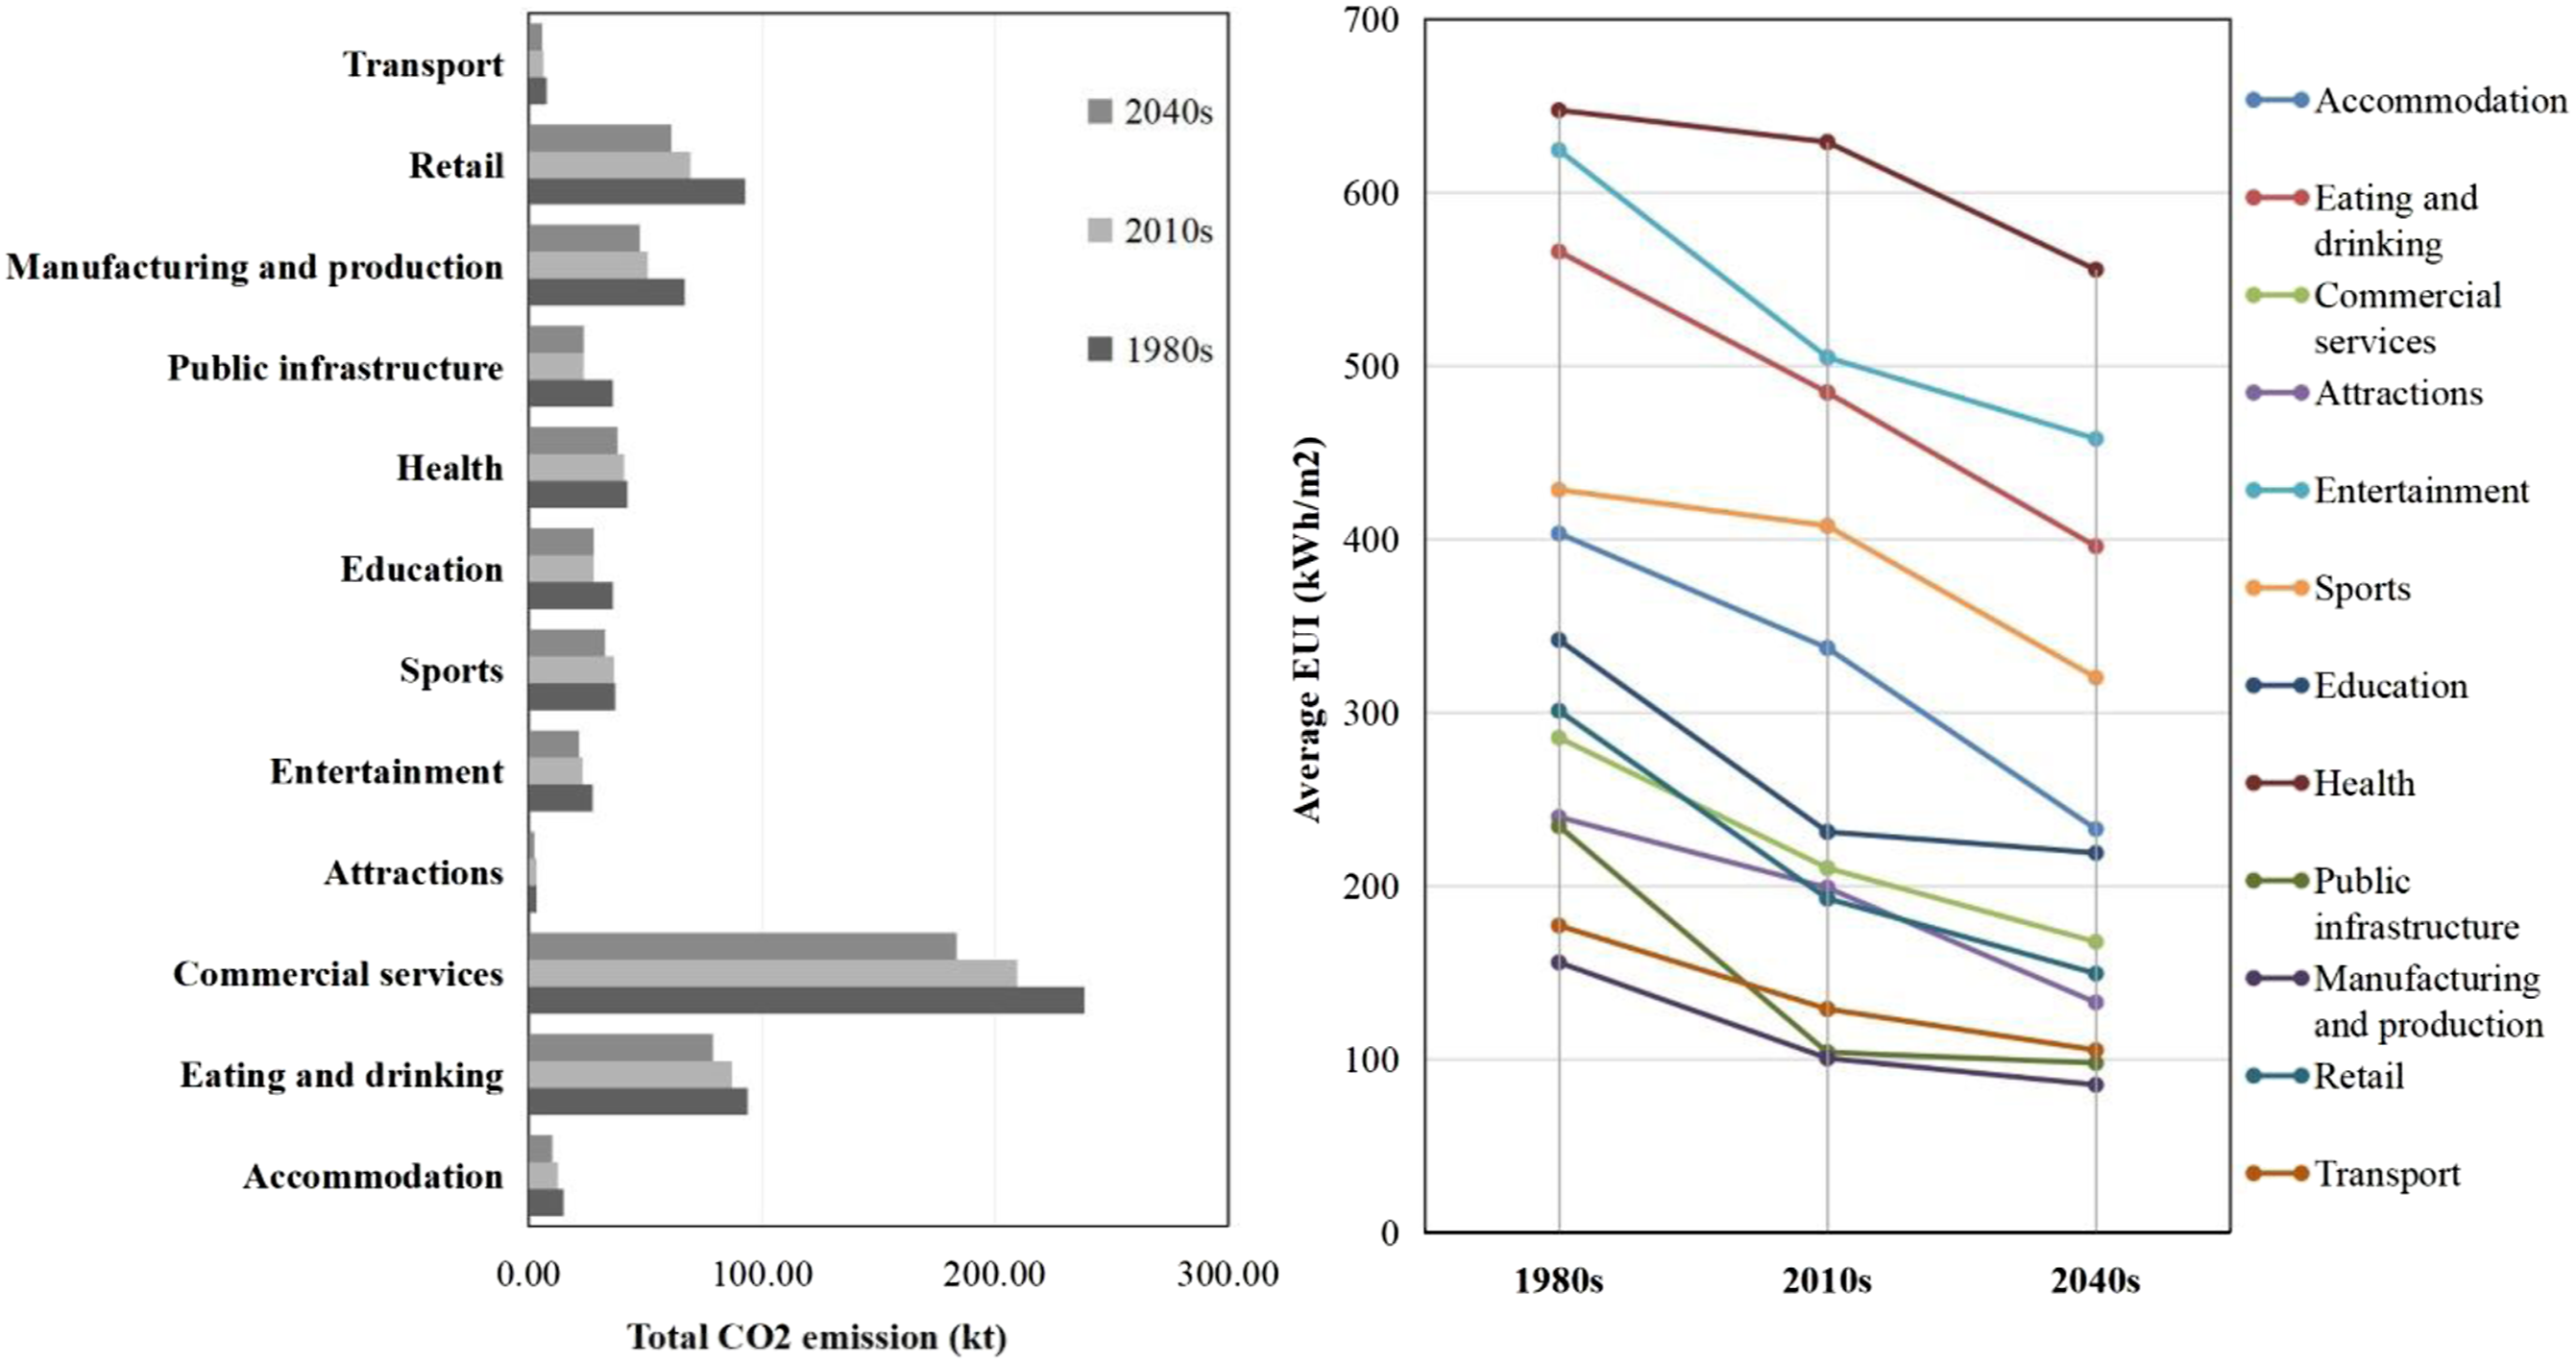
Solar potential
Two typical days (21 July and 31 December) were selected as two scenarios to study the specific energy demand in the Sheffield region. As depicted in Figure 14, an energy consumption peak is evident at 7:00 a.m. during a typical winter day. For a typical summer day, energy demand for all building types tends to be higher in the afternoon, reaching its peak at 5:00 p.m. During the winter, fossil fuel consumption remains consistently high, whereas in summer, there is a notable increase in electricity consumption for cooling purposes (Figure 14). Daily energy demand and equivalent CO2 emission in two scenarios.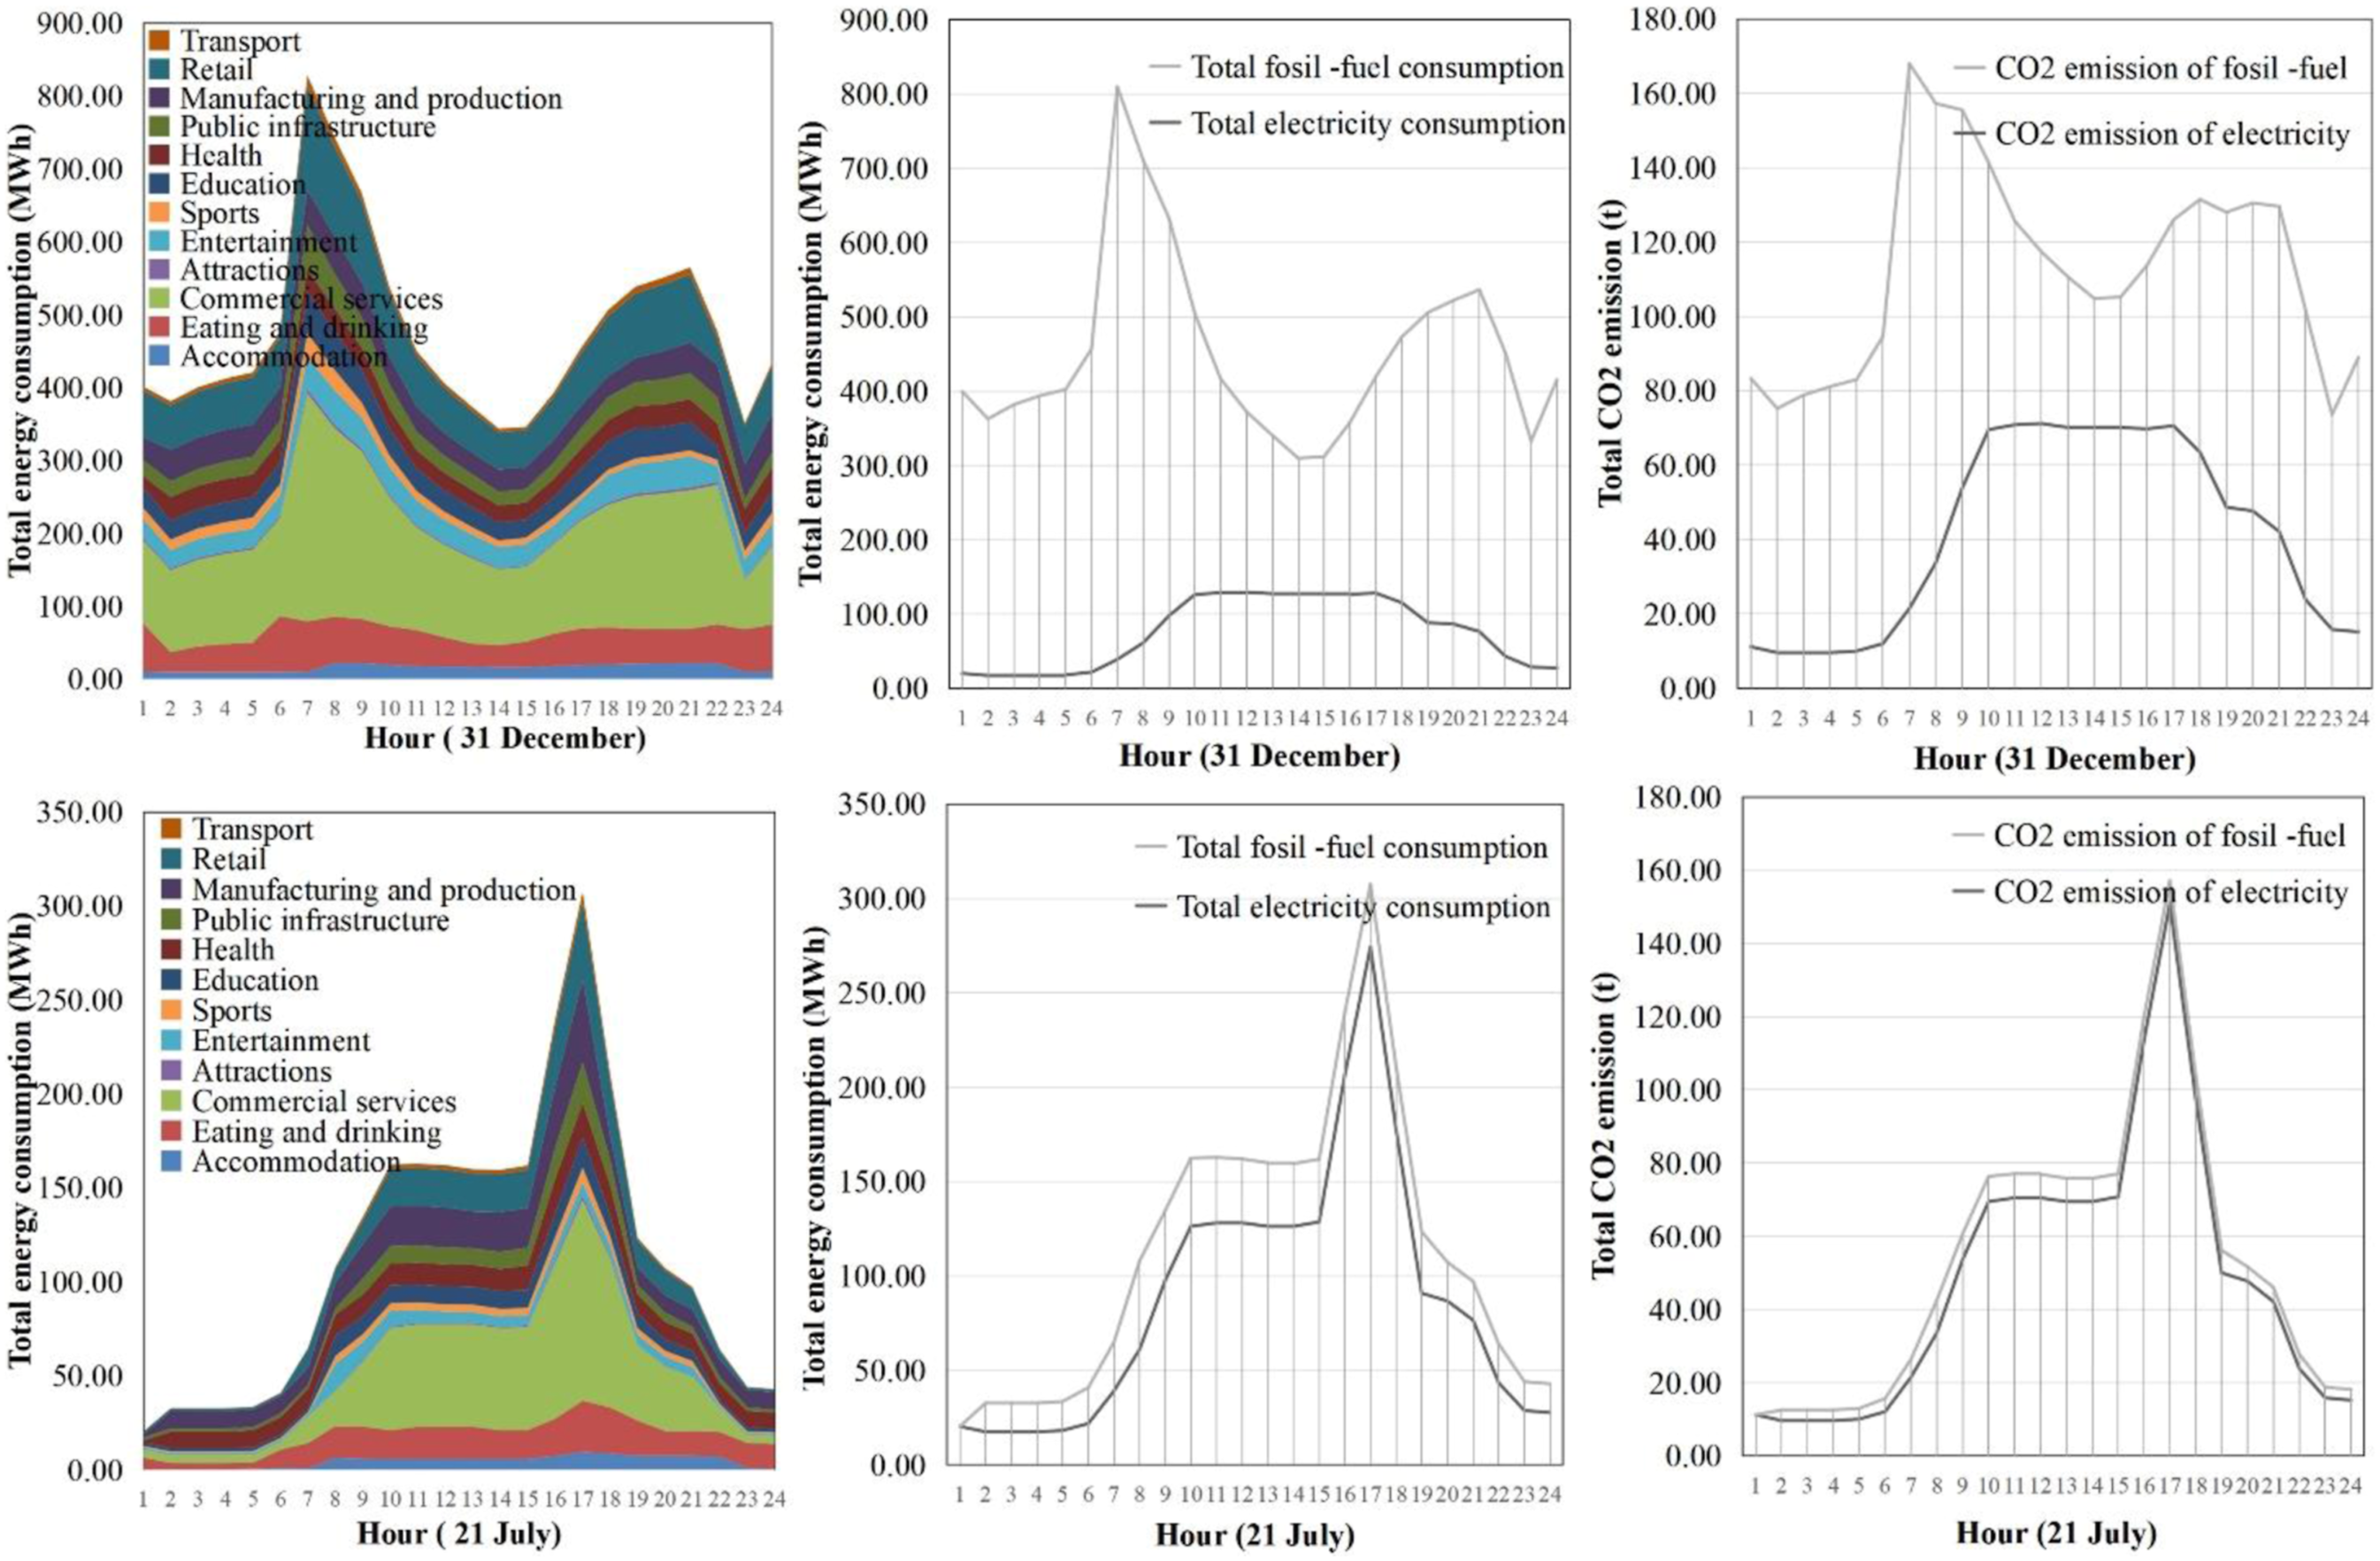
Abdul-Ganiyu et al. suggest that compared with normal PV and solar thermal, PVT is a prospective alternative energy source in off-grid situations for its ability to generate energy for heating and electricity efficiently from solar. 38 For this reason, a solar radiation module is defined to evaluate the potential of PVT implementation. This module calculates 100% of the roof area of all 2700 buildings as a series of surfaces to receive sunlight. In actual practice, certain roof areas may not be conducive to PV installation, and the conversion process of the panels themselves may result in energy loss. Hence, a weighting factor f (o) to correct the areas for PV installment was employed, considering mixed types of buildings with flat and peaked roofs. 39 According to Abdul-Ganiyu et al., the monthly average electrical efficiency values for PV and PVT were 11.6–12.7% and 9.9–11.5%, respectively, and the thermal efficiency of the PVT had a wider variation from 29.44% to 44.84%. 38
To quantitatively evaluate PVT efficiency in the two scenarios, hourly energy generation for heating and electricity is calculated as follows

E (solar) is the hourly result of solar radiation simulation result
Figure 15 shows hourly energy generation by PVT on 31 December and 21 July in grid SK38NE of the Sheffield region. Simulated building loads with and without PV generation in this region are shown in dark and light grey for both scenarios. The analysis of heating demand on 31 December exhibits a similar profile to the overall energy demand, suggesting that the consumption of fossil fuel is predominantly higher during the winter season. At 12:00 a.m. on 31 December, heating provided by PVT can reduce almost half of the fuel demand at that time, whereas a bit less for electricity, with a decrease of 25%. By comparison, PVT can provide more energy in summer for more solar radiation received. During a typical summer day, the heating generated by the system surpasses the demand, resulting in zero fuel demand between 5:00 a.m. and 5:00 p.m. Additionally, Photovoltaic-Thermal (PVT) systems exhibit excellent performance in electricity generation during summer, with a remarkable reduction in electricity demand by 92% at 3:00 p.m. and slightly less than 30% during peak hours. In terms of equivalent CO2 emissions, a reduction of approximately 50% is observed at 12:00 a.m. on 31 December, while a more pronounced reduction is evident on 21 July, with a maximum decrease of 87% at 3:00 p.m. PVT’s contribution for decarbonizing and energy demand reduction in two scenarios.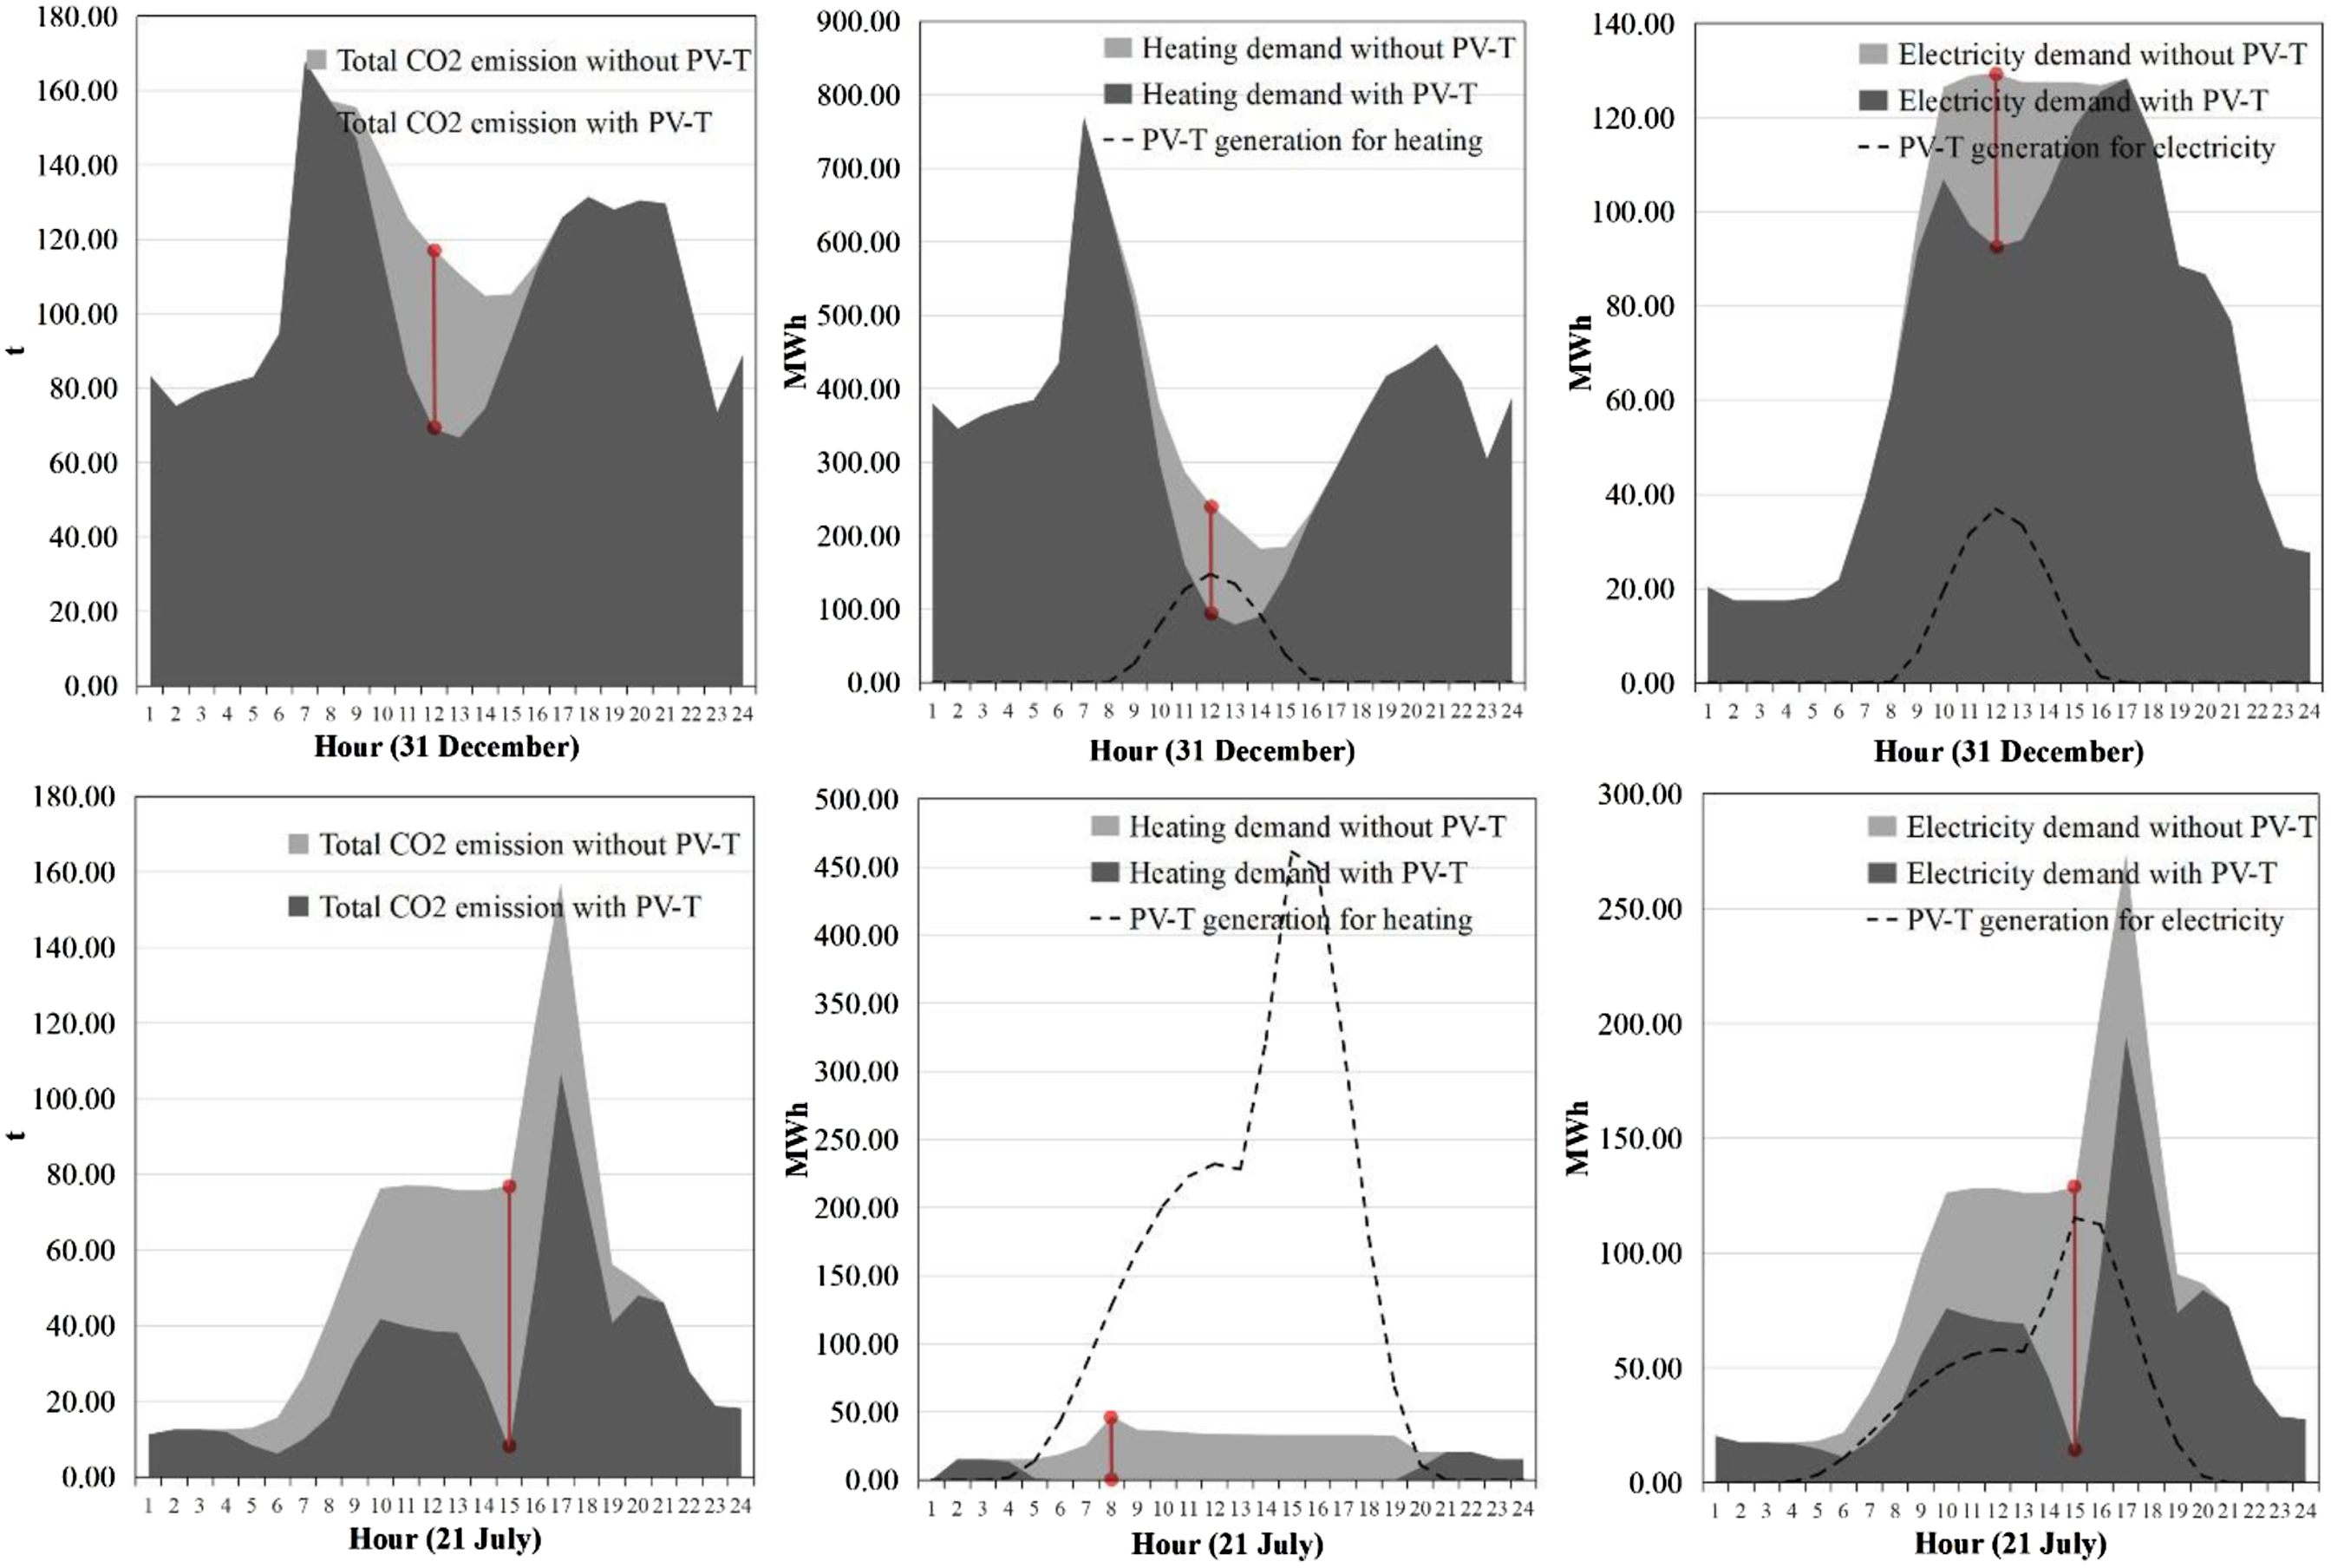
The results obtained from both scenarios demonstrate that equipping all 2700 buildings with PVT technology would significantly improve the current energy generation capacity in Sheffield. A significant surge in renewable energy generation and carbon reduction is observed during the time of day when solar radiation is at its peak. Furthermore, it should be noted that PVT technology exhibits higher efficiency during summer compared to winter. Although the results suggest that renewable energy sources such as solar power can significantly contribute to decarbonization efforts in the Sheffield region, it is important to acknowledge that such sources are subject to seasonal and weather-related fluctuations and may not be capable of meeting users’ energy demands at all times.
Discussion and conclusion
The uncertainty for UBEM applications is closely related to the archetype definition that reliably represents a local building stock. With the implementation of the AutoZone method mentioned in the Typical Building Generation session, the energy profile of an archetype can be calculated. In particular, we present an integrated computational workflow to employ such archetypes for the energy demand simulation of the chosen urban region (Figure 16). Three key data processing and modelling modules were developed in this study: (1) rebuilding the 2.5D model using GIS data and building characteristics, (2) customizing archetypes for existing building stock, and (3) dividing building massing into multi-thermal zones. This computational workflow demonstrates how to tackle the information interoperation challenges to facilitate sustainable decarbonization strategy development. All components and integrated modules in the project.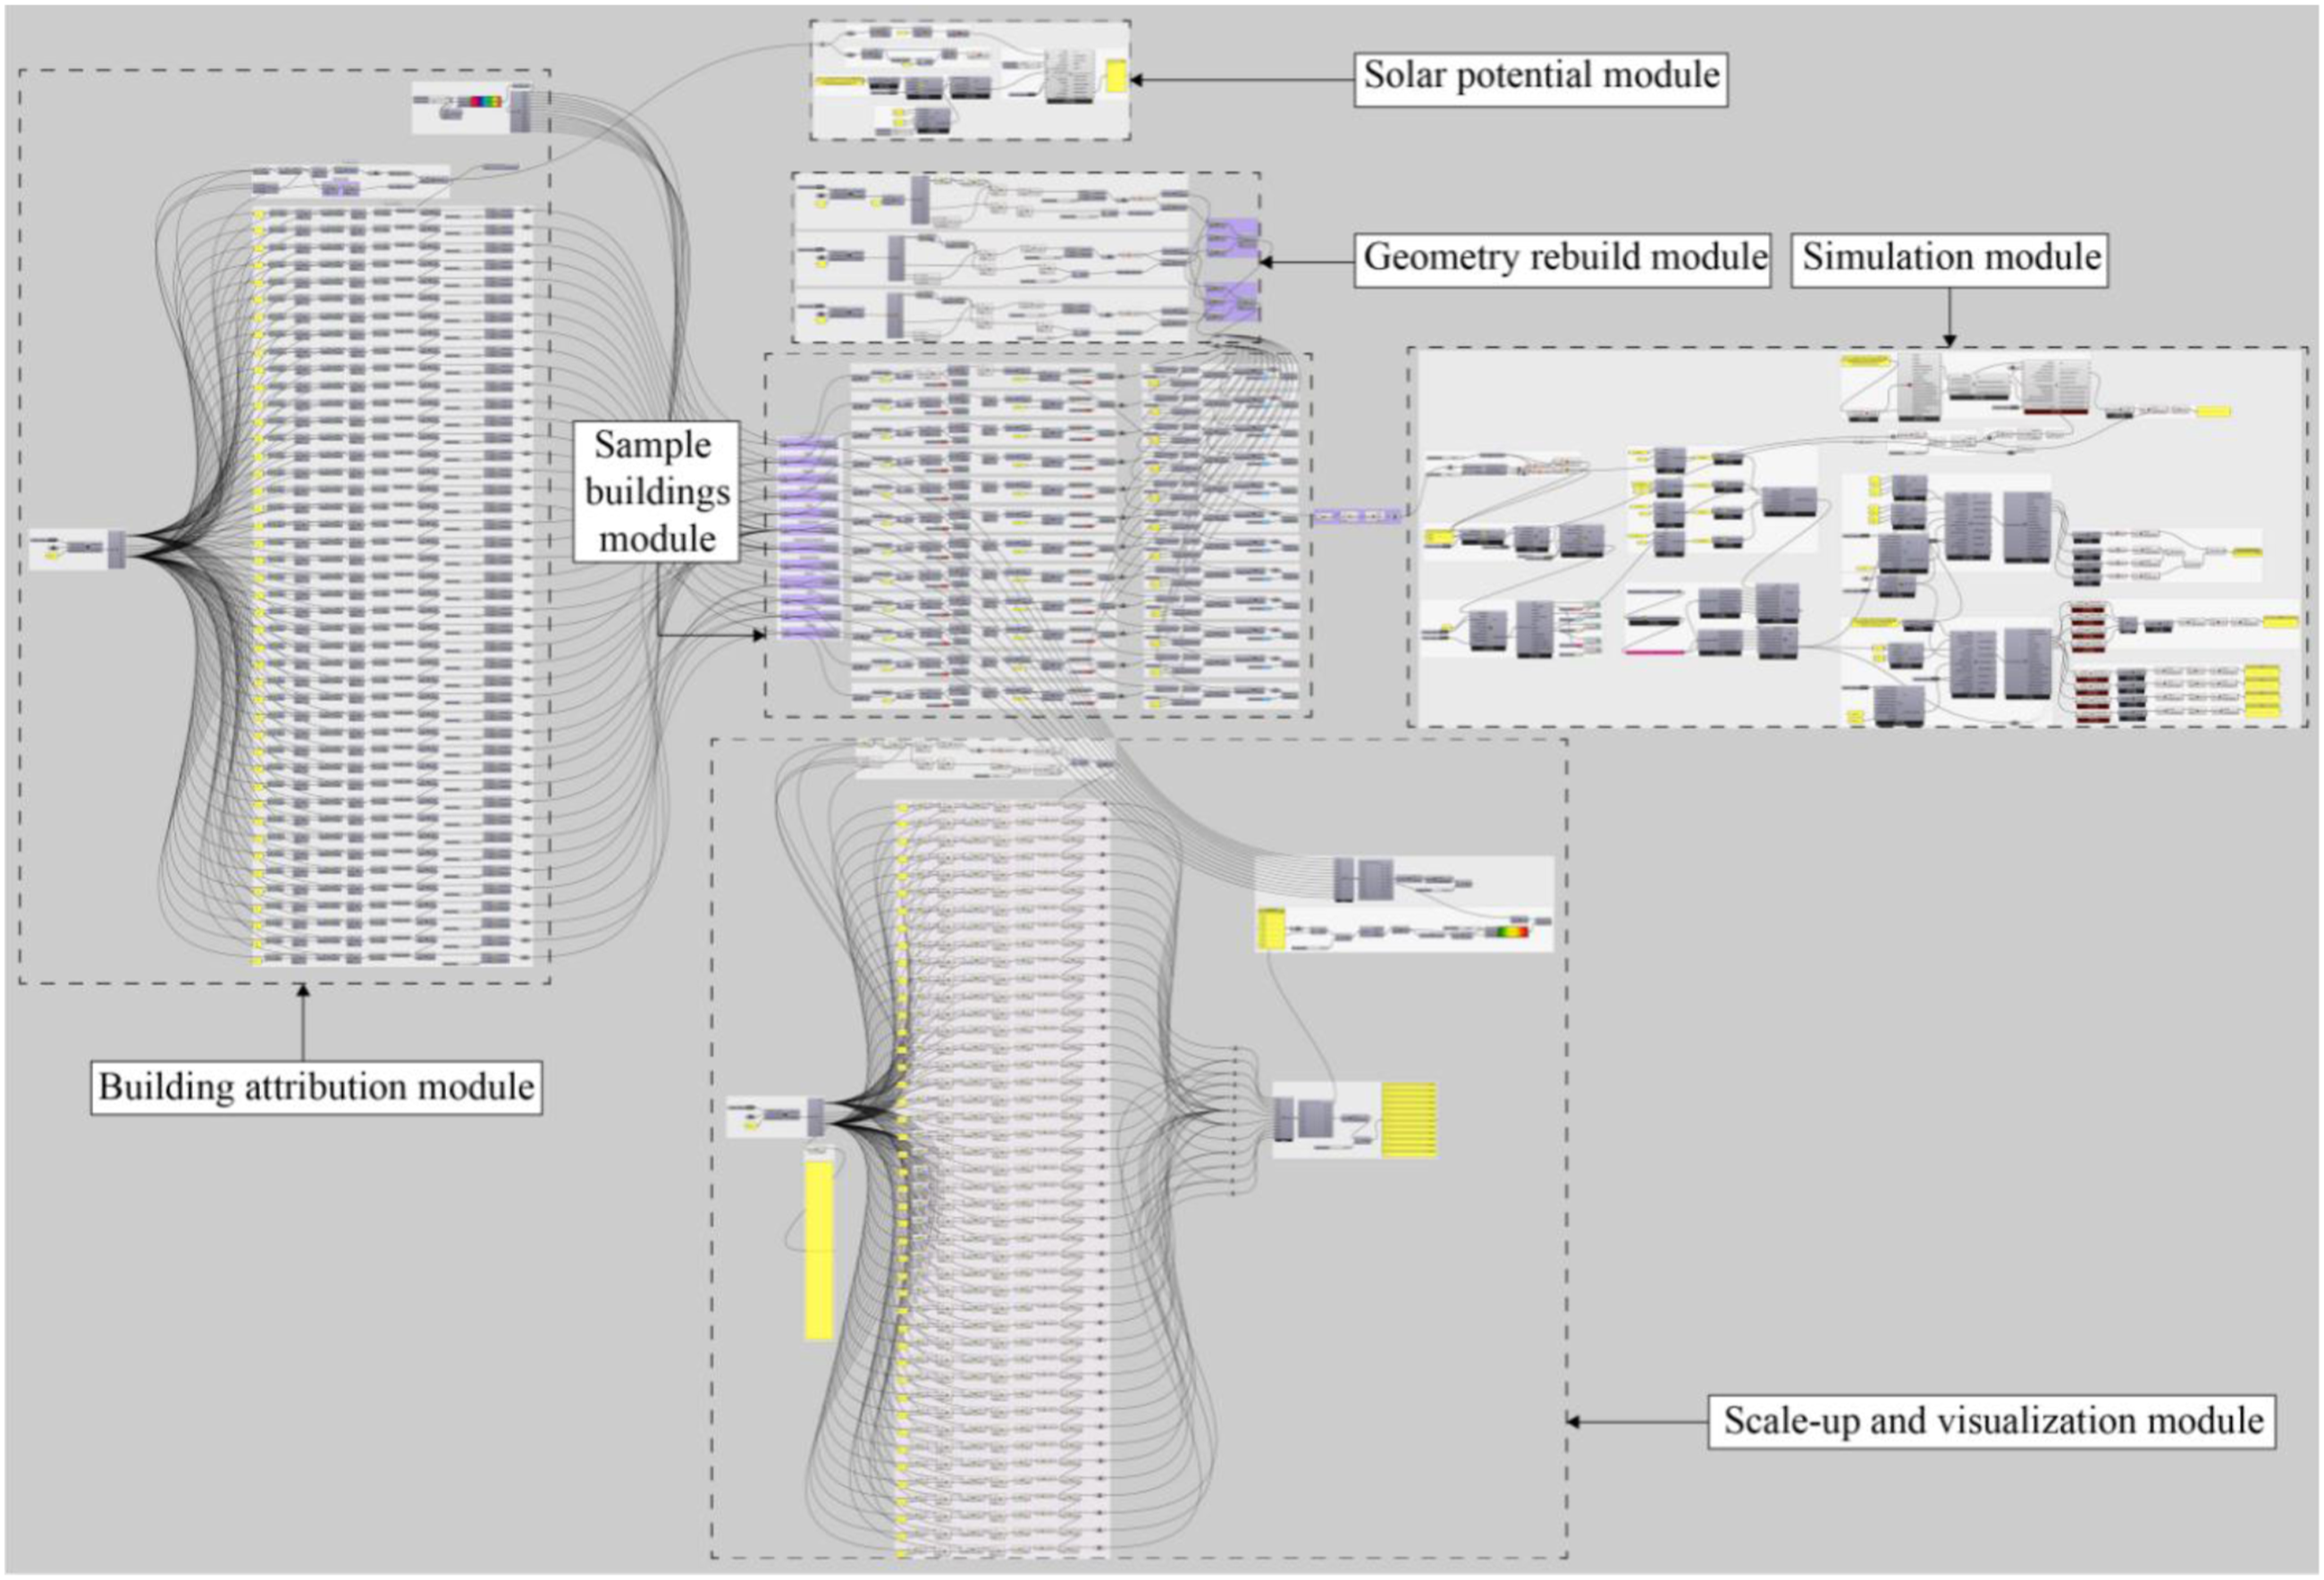
Compared with other UBEMs, the advantage of the presented workflow is its flexibility and adaptability to resolve modelling problems through interoperating GIS data and building characteristics. This workflow can be applied to any scale, and any region given the input data are pre-processed appropriately. Figure 17 illustrates the application of the same workflow to four grids (SK38NE, SK38NW, SK39SE, SK39SW) for a larger geographical region. (Left) Building attribution of four grids and (Right) energy demand map of four grids.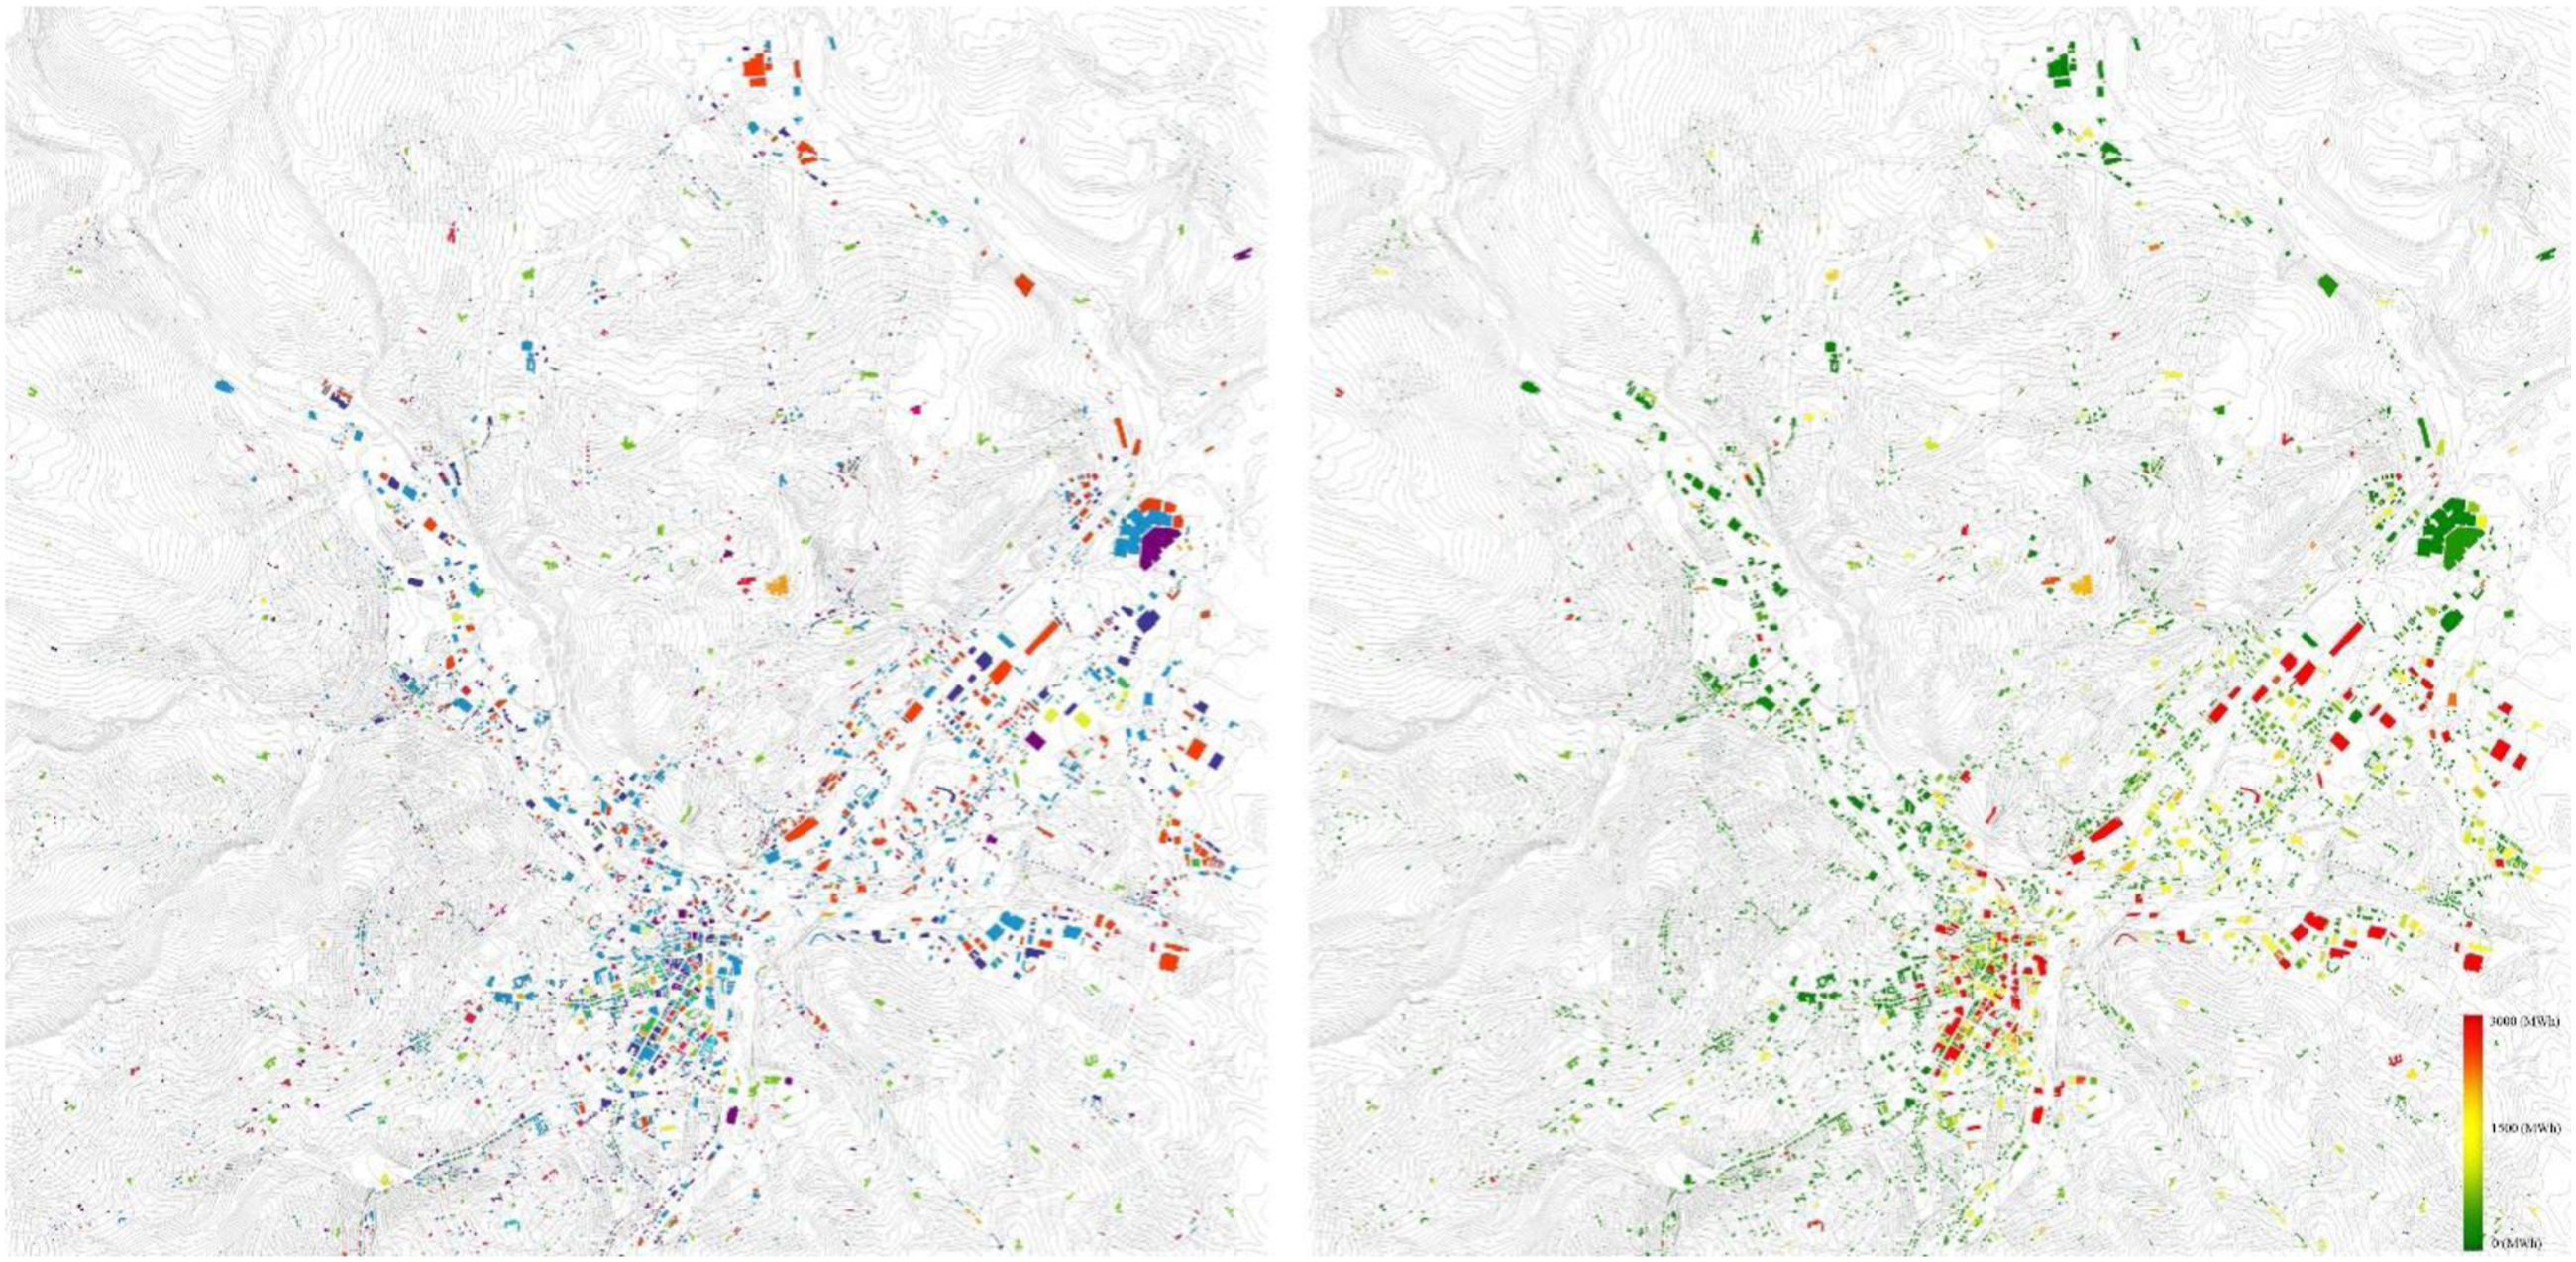
When conducting energy simulation for a citywide energy model, archetypes should be classified according to the specific research purpose to examine the demand and supply models with practical benchmarks or development goals. It is, therefore, highly recommended to involve much larger sample buildings to construct a more representative statistical base for archetypes. Standardization of data formats, terminologies, and modelling approaches, accompanied by cities’ increasing willingness to establish open GIS and building stock data, can also benefit UBEM studies. Future studies should continue smooth integration and expansion with versatile renewable strategies to pursue a more equitable and sustainable built environment at various spatiotemporal scales.
Footnotes
Declaration of conflicting interests
The author(s) declared no potential conflicts of interest with respect to the research, authorship, and/or publication of this article.
Funding
The author(s) received no financial support for the research, authorship, and/or publication of this article.