
Abstract
In Portugal, in the 1960s and 1970s, there was research concerning a system of the architectural design of housing for economically less favored populations, which related sociological information with analogical computational methods and culminated with its application in the Local Ambulatory Support Service (SAAL). This article presents the digitization process of these methods for the development of an architectural design system for social housing. The main goal is to improve methodological procedures for the original research and, specifically, to adapt them to computational design and modeling processes. To this end, this research transposed the aforementioned methodology into an algorithmic model that matches sociological information acquired from an online form with a database of social housing floor plan images to generate a building information modeling (BIM) directly from the selected image source. The result is an algorithmic model informed by sociological data linked with a BIM model to enable further rationalization of architectural design.
Keywords
Introduction
In Portugal, research on developing an architectural design system of housing for economically disadvantaged populations began in the 1960s. Following his graduation in 1959, Portuguese architect Nuno Portas concentrated on the systematization of social housing. Portas focused on developing a method, with the support of the National Laboratory of Civil Engineering (LNEC) in Lisbon, to help reduce construction times and material costs while also producing rationalized housing types that meet the demands of the inhabitants more efficiently. Together with a multidisciplinary team, Portas combined sociological information about hypothetical inhabitants with analogical computational methods to analyze social housing projects. This process was applied in the Local Ambulatory Support Service (SAAL), a social housing program that responded to the post-dictatorship housing shortage in Portugal. The present article addresses this historic research as a starting point to develop an algorithmic model to assist in social housing design.
The broader aim of the research project is to develop methods to systematize housing design through computational techniques, considering that this was one of the goals of the LNEC research. Hence, this work focuses on developing the methodological procedures of the original research and their adaptation to computational design and modeling processes. By doing so, the authors intend to improve the way architects design social housing by digitally including the information acquired by the hypothetical inhabitant and by directly connecting it to a BIM model, a broad modeling system accessible to general architectural practice.
The LNEC system was not adopted as a design instrument at the time, because of a lack of technological resources to implement it in this way. Instead, it was used as a framework that helped in the analysis of housing functions and helped develop what would become the evolutive housing system. In this sense, it was not applied directly in the process of building houses, but it is known that the SAAL operation, which is an expression of the Portuguese evolutive housing system, built more than two thousand houses from 1974 to 1976.
“The challenge of social evolution” 1 is perhaps the main definition of what the term evolution means to Portas, in the sense of social changes and how housing could respond and adapt to them. The Portuguese architect was in search of a spatial resolution that would guarantee minimum conditions for its inhabitants, keeping the focus on the attending populations. Published as an evolutive housing system, in 1971, together with Francisco da Silva Dias, Portas understood how to apply the sociological inquiry method to architecture, in a progressive manner and introduced the notion of process, or the time factor, to compose an economic distribution of income from the families with the building evolution of the houses. 2
After that, Portas created the SAAL operation, and one of the main concerns was attending to the specific needs of the assisted families. Even though the SAAL operation existed for only 2 years, between 1974 and 1976, it resulted in the participation of the inhabitants in the process of designing their own houses. 3
More than a decade of LNEC reports on housing research have proven the concept of evolutive housing. This article analyses two reports that consider computational procedures. The LNEC reports section examines the LNEC 1966 report prepared by Nuno Portas and Alexandre Alves Costa and the LNEC 1972 report prepared by Luís Moniz Pereira and Luís Fernando Lopes Monteiro. The digitization method section describes the algorithmic model developed in this study, and evaluates the digitization process outcomes.
This study employs a two-fold method. The first fold is to use Rhinoceros computer-aided design (CAD) software and the Grasshopper visual scripting environment (VSE) to convert the mathematical information contained in the LNEC 1966 report into an algorithmic model. The second fold, based on the first, is to generate a BIM model from a housing floor plan database by converting a sociological questionnaire about the inhabitants’ functional expectations into a spreadsheet corresponding to the most suitable house type from the database. Then, the algorithm recognizes a previously done RGB color codification from the raster image that shows the type plan and converts the raster file into vector lines for the production of walls, doors, and windows in a BIM model. Instead of 2D drawing architectural representations as achieved in the LNEC 1972 report, BIM modeling allows further steps of architectural rationalization to occur digitally by simulations of sunlight, temperature, and ventilation, for example.
The LNEC Reports
Nuno Portas and Alexandre Alves Costa reported the first action towards the application of a computational system to aid in the design of social housing in 1966. 4 The process was a turning point towards evolutive housing systematization as it directly related to inhabitants' needs through a computational method. The report is significant since Portas scientifically proved his method through the study developed by Alves Costa. Following, there is an overview of the two parts of the report.
LNEC 1966 report—Part 1
Synthesis table of the LNEC 1966 report.
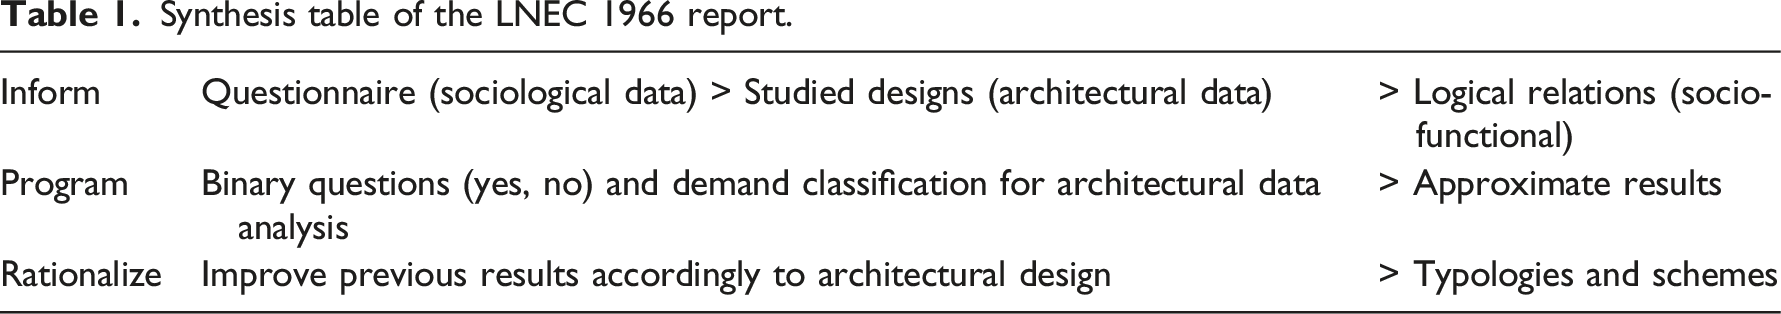
In the LNEC 1966 report, “inform” refers to the sociological surveys about the inhabitants’ expectations and requirements for their own houses, in other words, the collecting of anthropometric data and the use of space, thinking on the interaction with governmental social housing programs. As another step of the method, “program” corresponds to the computational phase that provides the most suitable architectural solution (house type) according to the answers taken from the sociological inquiry. The “program” phase is applied to the housing type’s database as an analytical instrument to assist in the visualization of information related to the 117 housing floor plans that were drawn by Alves Costa. Finally, “rationalize” through a process of analysis based on graphs and schemes that could inform a better housing solution, applying systematic methods to achieve housing design solutions.
As the second subsection of the LNEC report, the questionnaire describes the characteristics required to analyze the housing cell or assigns a qualification code to a chosen group of social housing types. The idea was that it would integrate a system for measuring the inhabitants’ satisfaction with selected dwellings developed at the time, for example, INA-Casa in Italy, HLM in France, and ICESA in Portugal. The goal was to have a prospecting process of housing types through a process of comparative analysis, so it is clear that the purpose of the research was to convert dwelling descriptions into questions that would classify the typology and, consequently, make it possible to program the information into an accessible database for analysis. Four groups divide the questions: typological classification; functional analysis; inter-relationships, communication, functional separation; and exterior relationship.
The information processing subsection provides a comprehensive explanation of Boole’s algebra and its application for the construction of matrices. Explains the intersection and addition of matrices and how each question from the questionnaire provides a multiple choice answer: negative, positive, and neutral, basic binary code, mathematically understood as 0, 1, and 2, respectively, in the case of neutral answer that attributes differential characteristics for each type. The sociological inquiry gathered 259 binary questions. The levels of the demands were classified as strictly necessary, necessary, and desirable. Even if the original questionnaire contained 259 questions, the authors considered only 224 questions for typology analysis, because the last 35 questions were improbable to achieve information since their description was of exterior characteristics of the dwellings. The questions were organized into 26 groups divided into themes such as the area of the house, number of bedrooms, functional program, relationship between functional areas, and others. In essence, the questions describe each floor plan with a binary code resulting in a simple but efficient computational procedure.
The application subsection presents an architectural design evaluation that transforms an initial and broader proposition into a better-defined solution, adequate to various constraints, such as functional interior composition and relationship between areas. As shown in Figure 1, type 52 was selected to illustrate a process of analysis through schemes from circulation between spaces, the connection between spaces, areas of spaces, and respective hierarchical relations, until reaching a synthesis that can express similarities between types. Typology analysis and schemes by Alves Costa
4
(developed by the authors).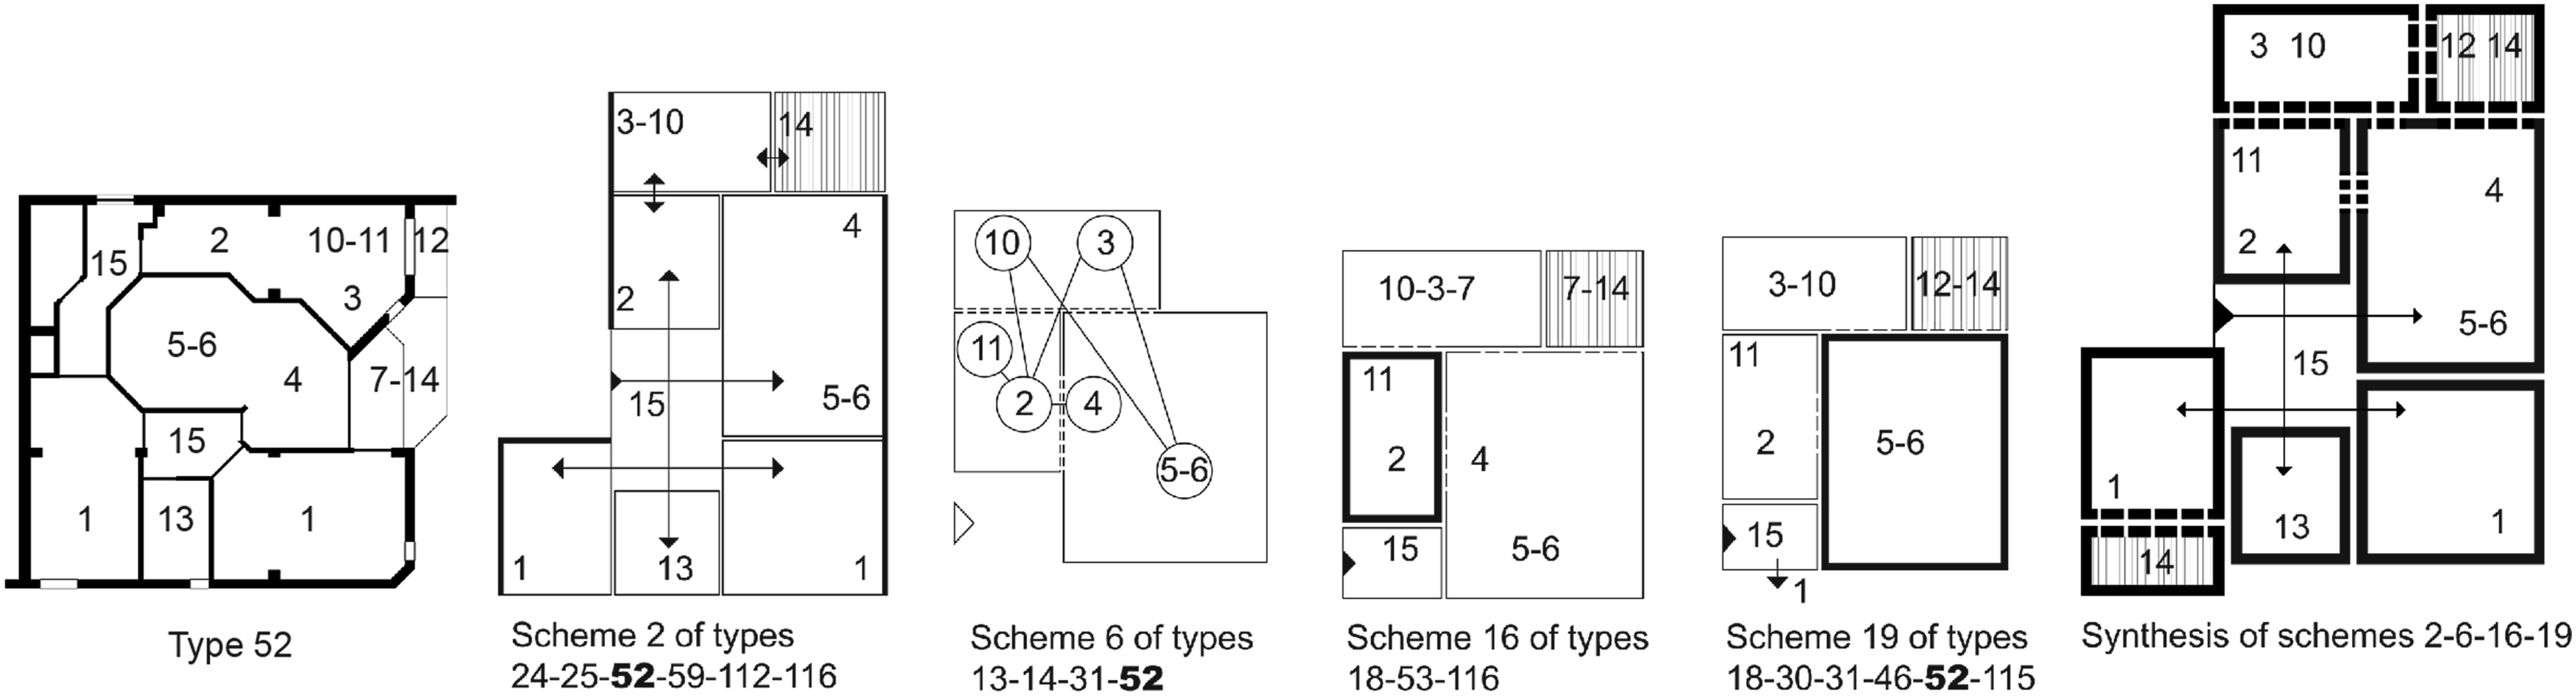
Fifteen functions complete the housing cell: 1 - sleeping area; 2 - food preparing; 3 - ordinary dining; 4 - special dining; 5 - general living area; 6 - living area for guests; 7 - recreational area for children; 8 - study room for young people; 9 - workplace for adults; 10a - cloth ironing; 10b - cloth sewing; 11 - cloth washing; 12 - cloth drying; 13 - personal hygiene space; 14 - exterior living space; 15a - separation or communication zone between interior and exterior; 15b - separation or communication zone within the interior.
Alves Costa presented the tests that made possible the architectural rationalization of the most adequate types, given the gathered database, through graphs and schemes that facilitate the visualization of the housing floor plan. The architect rationalized six schemes that would better synthesize architectural solutions into well-defined types (Figure 2). Rationalized types
4
(developed by the authors).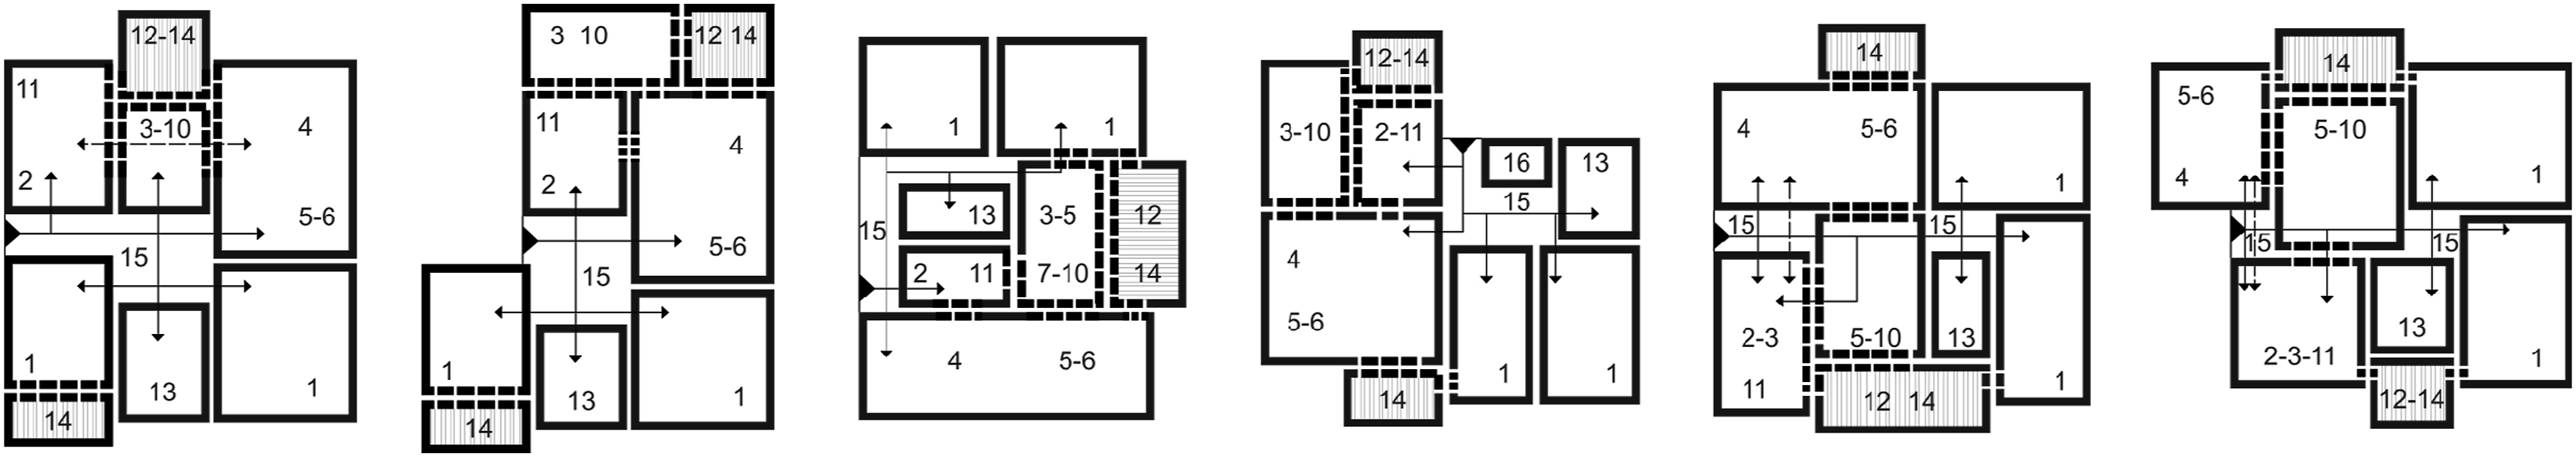
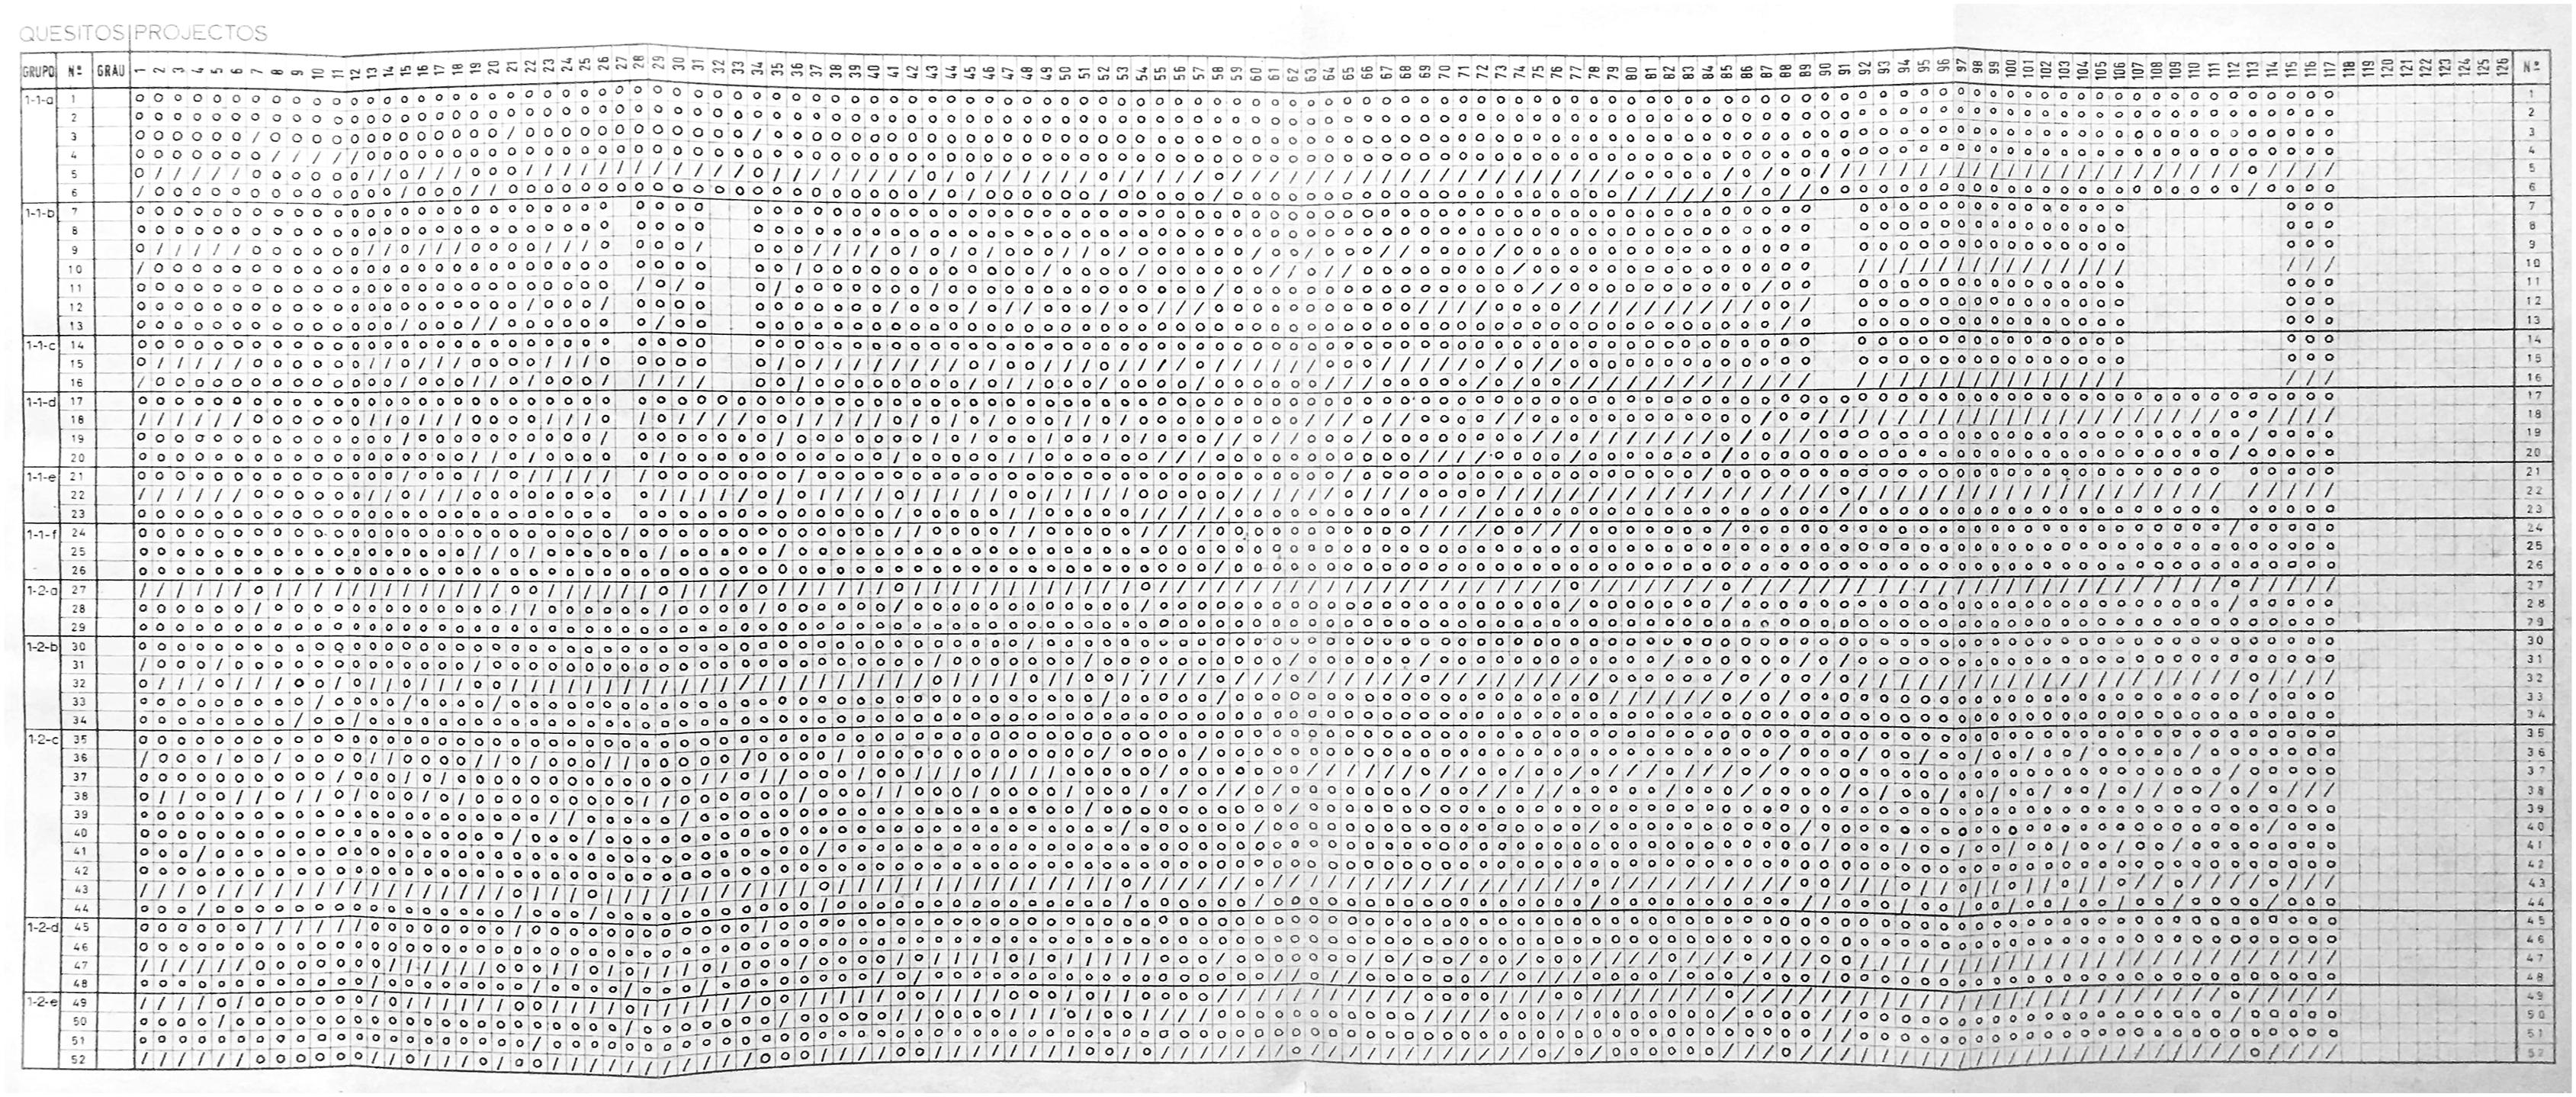
Alves Costa correlated the possible answers gathered from the sociological inquiry with a database of 117 housing floor plans through a handmade matrix containing binary information distributed in 259 lines from the questionnaire (sociological data) and 117 columns from the housing floor plan database (architectural data). This content was handmade originally in 5 extended A4 format matrices, the first of which is presented in Figure 3, and composed the annex of the LNEC 1966 report’s first part, together with additional information for further understanding of its contents. Handmade matrix with binary information of each type (columns) according to the questionnaire (lines).
4
LNEC 1966 report—Part 2
The second part of the report presents a series of schemes, drawn by Alexandre Alves Costa, to better visualize functional relationships within the housing cell. The intention was the development of a design method through graphs that could facilitate architectural analysis following the concepts already described in the LNEC 1966 report—Part 1. Four groups analyzed spatial relationships: compatibility between functions, the grouping of functions into unit spaces, organization of functions by groups, and inter-relationships between functional communication and separation.
Given the analyses of the program's needs and the designs of one hundred and seventeen housing units, the LNEC team identified results that were not satisfactory, accordingly to the requirements. Thus, they observed discrepancies in the analysis program, in the design program, and in the impossibility of reconciling family demands, which may have occurred given economic, constructive, and other factors. Since the 1966 method was not tested as a social housing design instrument because of a lack of technological resources, reconciling family demands through mathematical or computational means became a task that was attempted in the present research by connecting the participation of the hypothetical inhabitant and the design program with the conversion of the questionnaire to an online form. These results indicate that even today there is a demand for systematizing and rationalizing the sociological information of inhabitants to ground social housing design.
LNEC 1972 report
In 1972, Luís Moniz Pereira, Luís Fernando Lopes Monteiro, and Nuno Portas reported the second action towards the application of a computational system to aid in social housing design, which consisted of programming the computerized design of layout schemes based on graphs of household functions and relations between themselves. 5 The study continued the research Portas and Alves Costa had previously developed to identify functional relations within the dwelling through graphical schemes of the behavioral patterns investigated.
The main idea was to use a graph-based computational design method that could generate housing layouts through geometrical information derived from functional graphs. The scope of the research was the representation of spaces in horizontal projections and orthogonal geometries, verifying adjacency prescriptions between compartments. The aim was to bring the computer closer to manipulating and representing arrangements of space and to bring the designer closer to making explicit his methods of solving space problems.
The derivation process was based on a mathematical procedure that superimposes a functional graph of a housing type and an adjacency prescription to be coded with orthogonality information (Figure 4(a)). The functional graph contains numbers related to the housing spaces connected by lines that are marked with “H” for those lines that will be printed horizontally in the derivation graph and “V” for those that will be printed vertically (Figure 4(b)). The adjacency prescription is achieved by the selection of centroids from the polygons of the functional graph to connect lines in between them that will be programmed with the previous orthogonal marking (Figure 4(c)). Finally, the procedures derive a layout scheme by printing the lines of the adjacency graph accordingly to their respective orthogonal information (Figure 4(d)). Layout scheme derivation process
5
(developed by the authors).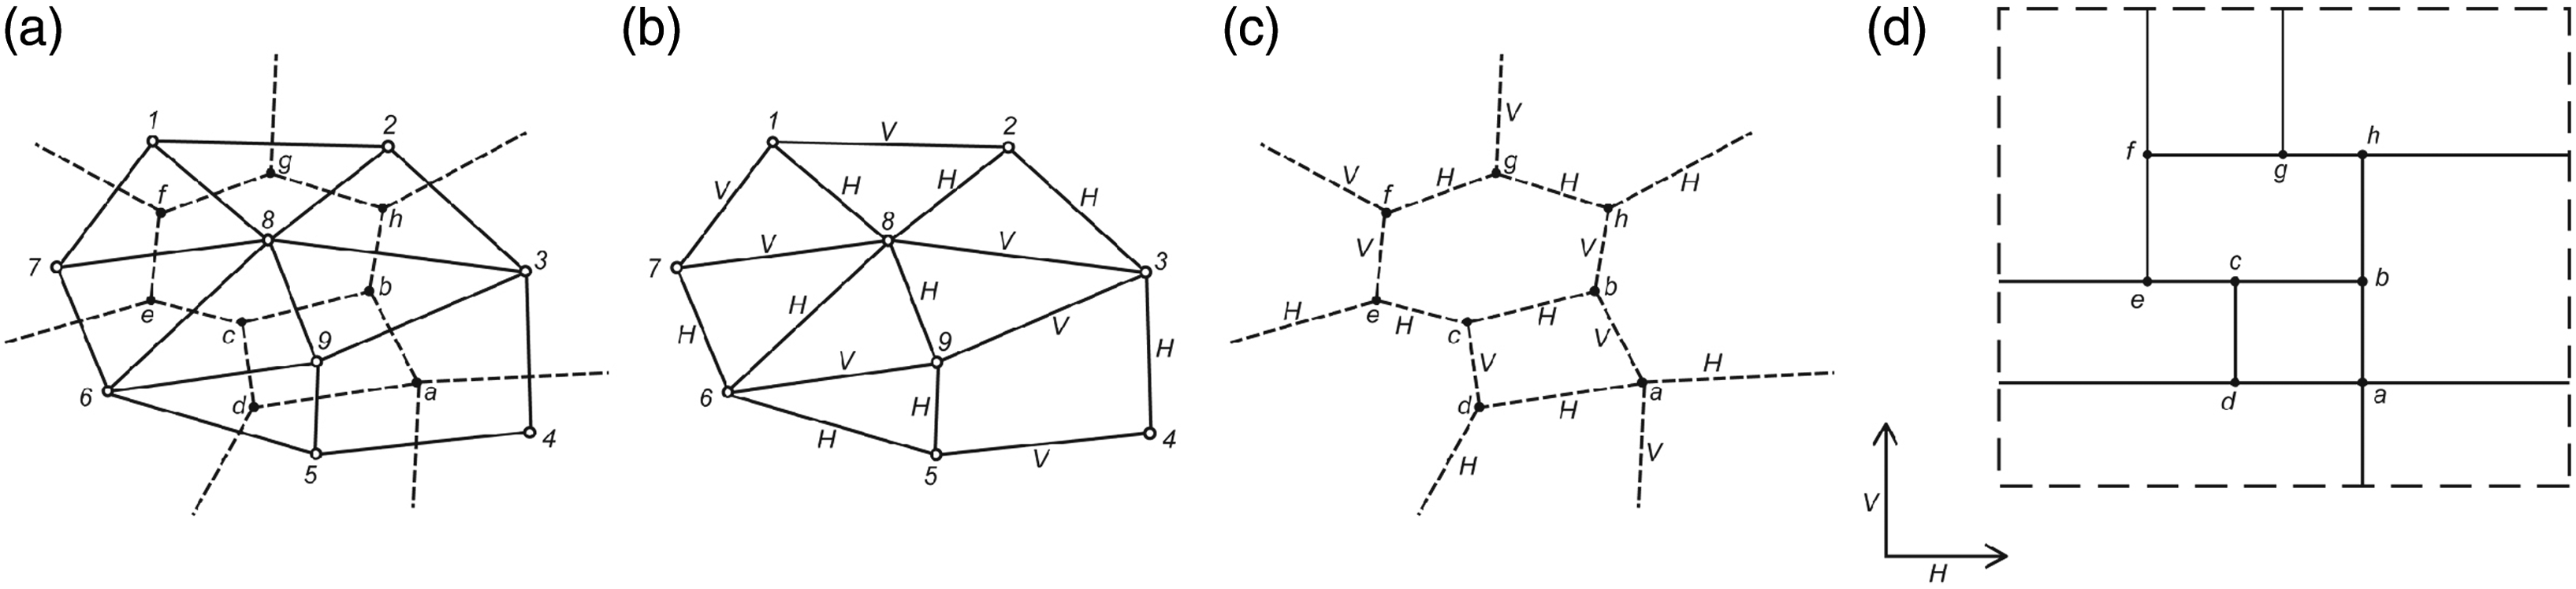
The LNEC 1972 report gives a comprehensive definition of the types of graphs and their organizations and explains that the process of deriving the orthogonal projections occurs from the abstract relations of adjacencies between spaces and that they do not take into account the areas and dimensions of the environments considered. The programming refers to two steps, the recognition of the geometries of the graphs for the derivation of the spatial layout that occurred by processing magnetic tapes and the printing of these solutions, first by plotter programming and later by line-printer programming (Figure 5) which was considered more efficient. The authors made clear the alignment with artificial intelligence (AI) research as a possible development. Results from layout scheme derivation process through line-printer programming
5
(developed by the authors).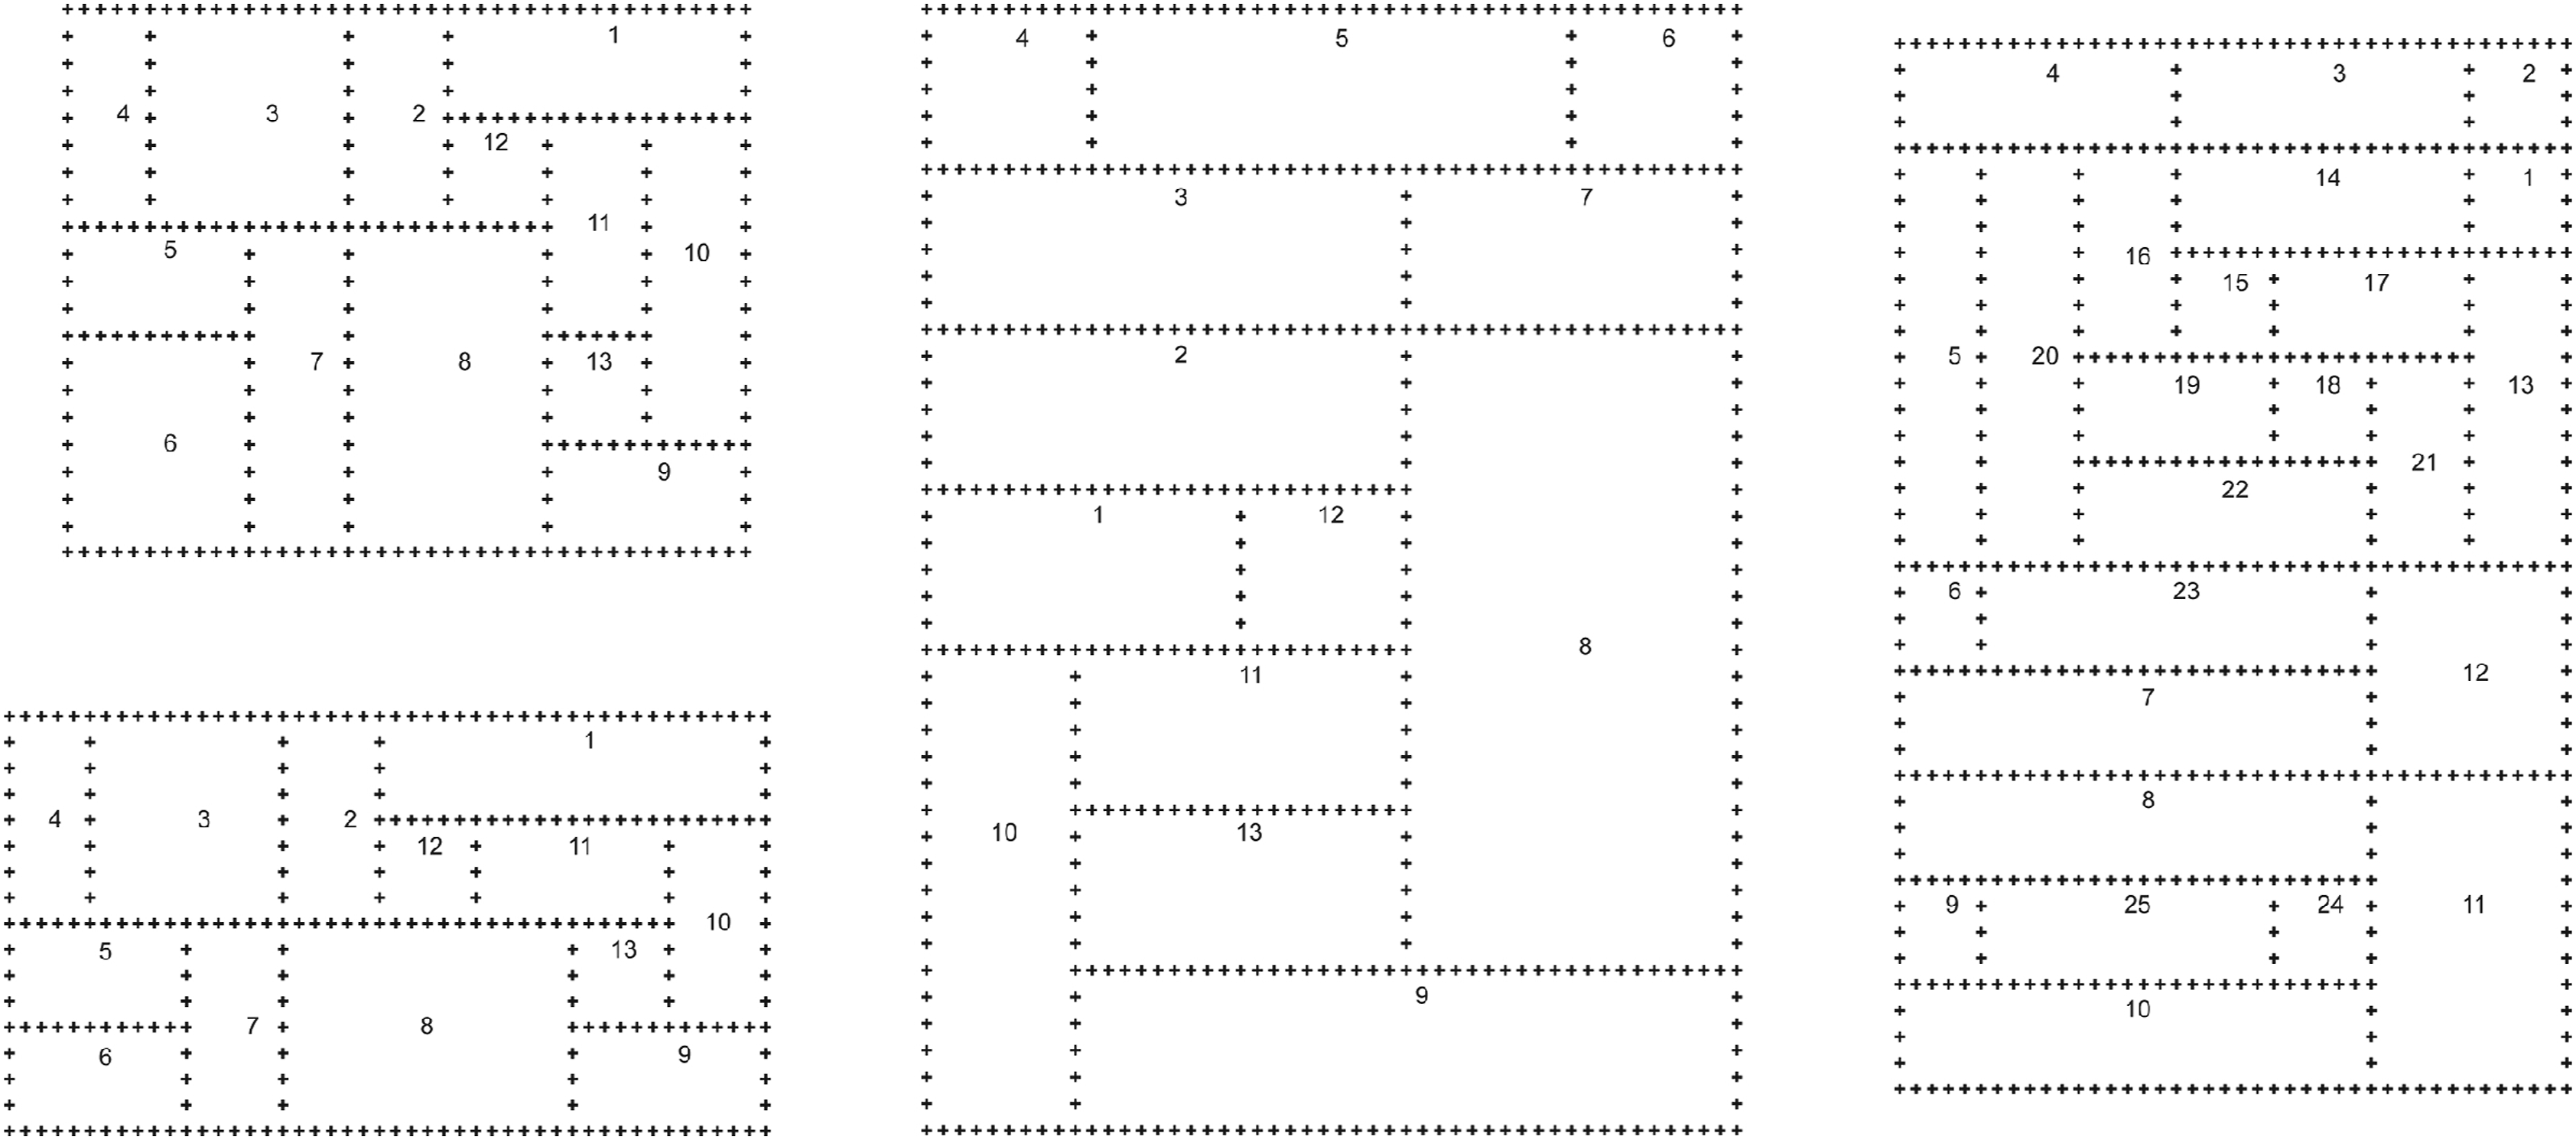
In this sense, the LNEC 1972 report attempted to continue the previous research by computationally drawing layout schemes from functional graphs already obtained in the LNEC 1966 report by using analogical computational techniques that were available at the moment. The current study presents a method that integrates the aims of both reports through the use of digital techniques available nowadays.
Digitization Method
This section presents the data collection and digitization of the material presented in the LNEC 1966 report. The first step was to digitize both the handmade matrix and the set of 117 housing floor plan drawings. The second step was to convert the questionnaire into an online form to be filled out by the hypothetical inhabitant. The third step was to create the algorithmic model in Grasshopper for matching the spreadsheet with answers from the online form. The fourth step was the parsing of the house floor plan image to an RGB code. The fifth was the vectorizing of the RGB code to BIM modeling. The sixth step of architectural rationalization is open for the architect or designer to proceed according to his or her preferences. Figure 6 illustrates the steps of the methodological procedures. This work continues a dialog with contemporary research in the housing field first with the problem of mass customizing houses for the different needs of the assisted families,6–9 and second with the problem of participatory design in architecture.10–12 Steps of methodological procedures.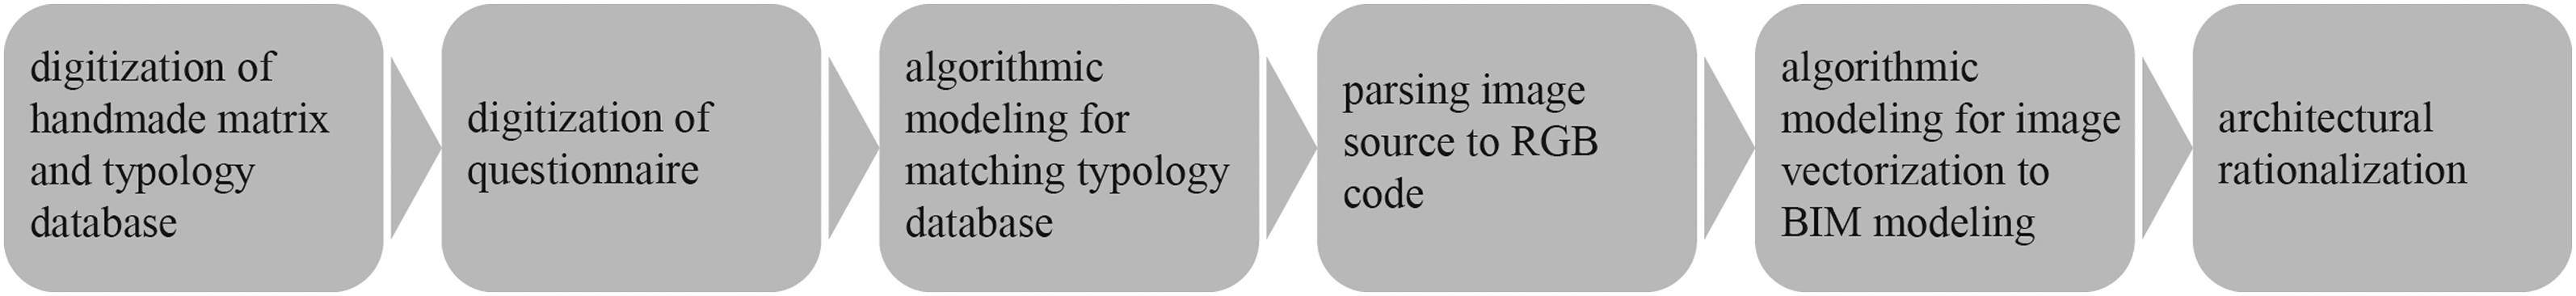
Data collection
The method development phase was supported by a collection of documents including five reports, two interviews, panels with drawings of 117 different housing types, five books, and photographs of built projects. Except for the LNEC 1966 report—Part 2 shared by Alves Costa, all other reports were obtained from the libraries of the Faculty of Architecture of the University of Porto (FAUP), Faculty of Engineering of the University of Porto (FEUP), and New University of Lisbon (UNL). The corresponding author completed two interviews with Alves Costa, one recorded and the other informal. The panels contain drawings of various housing types collected from the LNEC 1966 report. Aside from the five books, there are photographs taken by Alves Costa and shared by the architectural firm Atelier 15.
Digitizing the LNEC 1966 report
The work of Portas and Alves Costa was digitized by converting it into a spreadsheet for query and selection of the most appropriate housing type, utilizing Microsoft Excel, web-based software, Rhinoceros, Grasshopper, and simple image processors.
The initial step was to digitize both the sociological and architectural databases. The sociological database is composed of a handmade matrix that was transformed into a Microsoft Excel spreadsheet containing binary code corresponding to the original information. This binary code contains the typology database or the code that describes all 117 house types from different sources. The architectural database is a set of 117 housing floor plan drawings in 1:200 scale that were scanned into JPG image format.
The second step was to transform the questionnaire into an online form for public interaction using Google Forms. The transcription of 224 questions into Google Sheets and the sequential creation of 224 questions with multiple choice responses, using the add-on Form Maker, and according to the three standards provided in the report, yes, no, and not applied for the neutral answer. Once filled by the hypothetical inhabitant, the online form generates a Google Sheet for each public interaction, which may be used to match the typology database.
The third step was to create a matching algorithm in Grasshopper to analyze and select the best types based on the preferences of the inhabitant. The algorithm can find the best options in the spreadsheet from the first step using the answers from the second step and select their images from the housing typology database. It works by retrieving separately the information of the three components, the set of images, the spreadsheet, and the online form answer in Grasshopper (Figure 7(a)). The spreadsheet and the online form answer are retrieved with the Excel Reader add-on. Then the algorithm proceeds with a Boolean match between the spreadsheet and the online form answer, transforming positive interactions into true values and negative interactions into false values for every column of the spreadsheet (Figure 7(b)). It proceeds with a Boolean mass addition of every column to find the nearest types that better correspond to the hypothetical inhabitants’ needs, then it sorts the list for the most answered types and reduces decimals to match the numbering of the set of images (Figure 7(c)). Finally, the algorithm selects the nearest type by member index according to the set of images (Figure 7(d)). Grasshopper algorithm for selecting housing types based on the online form answers.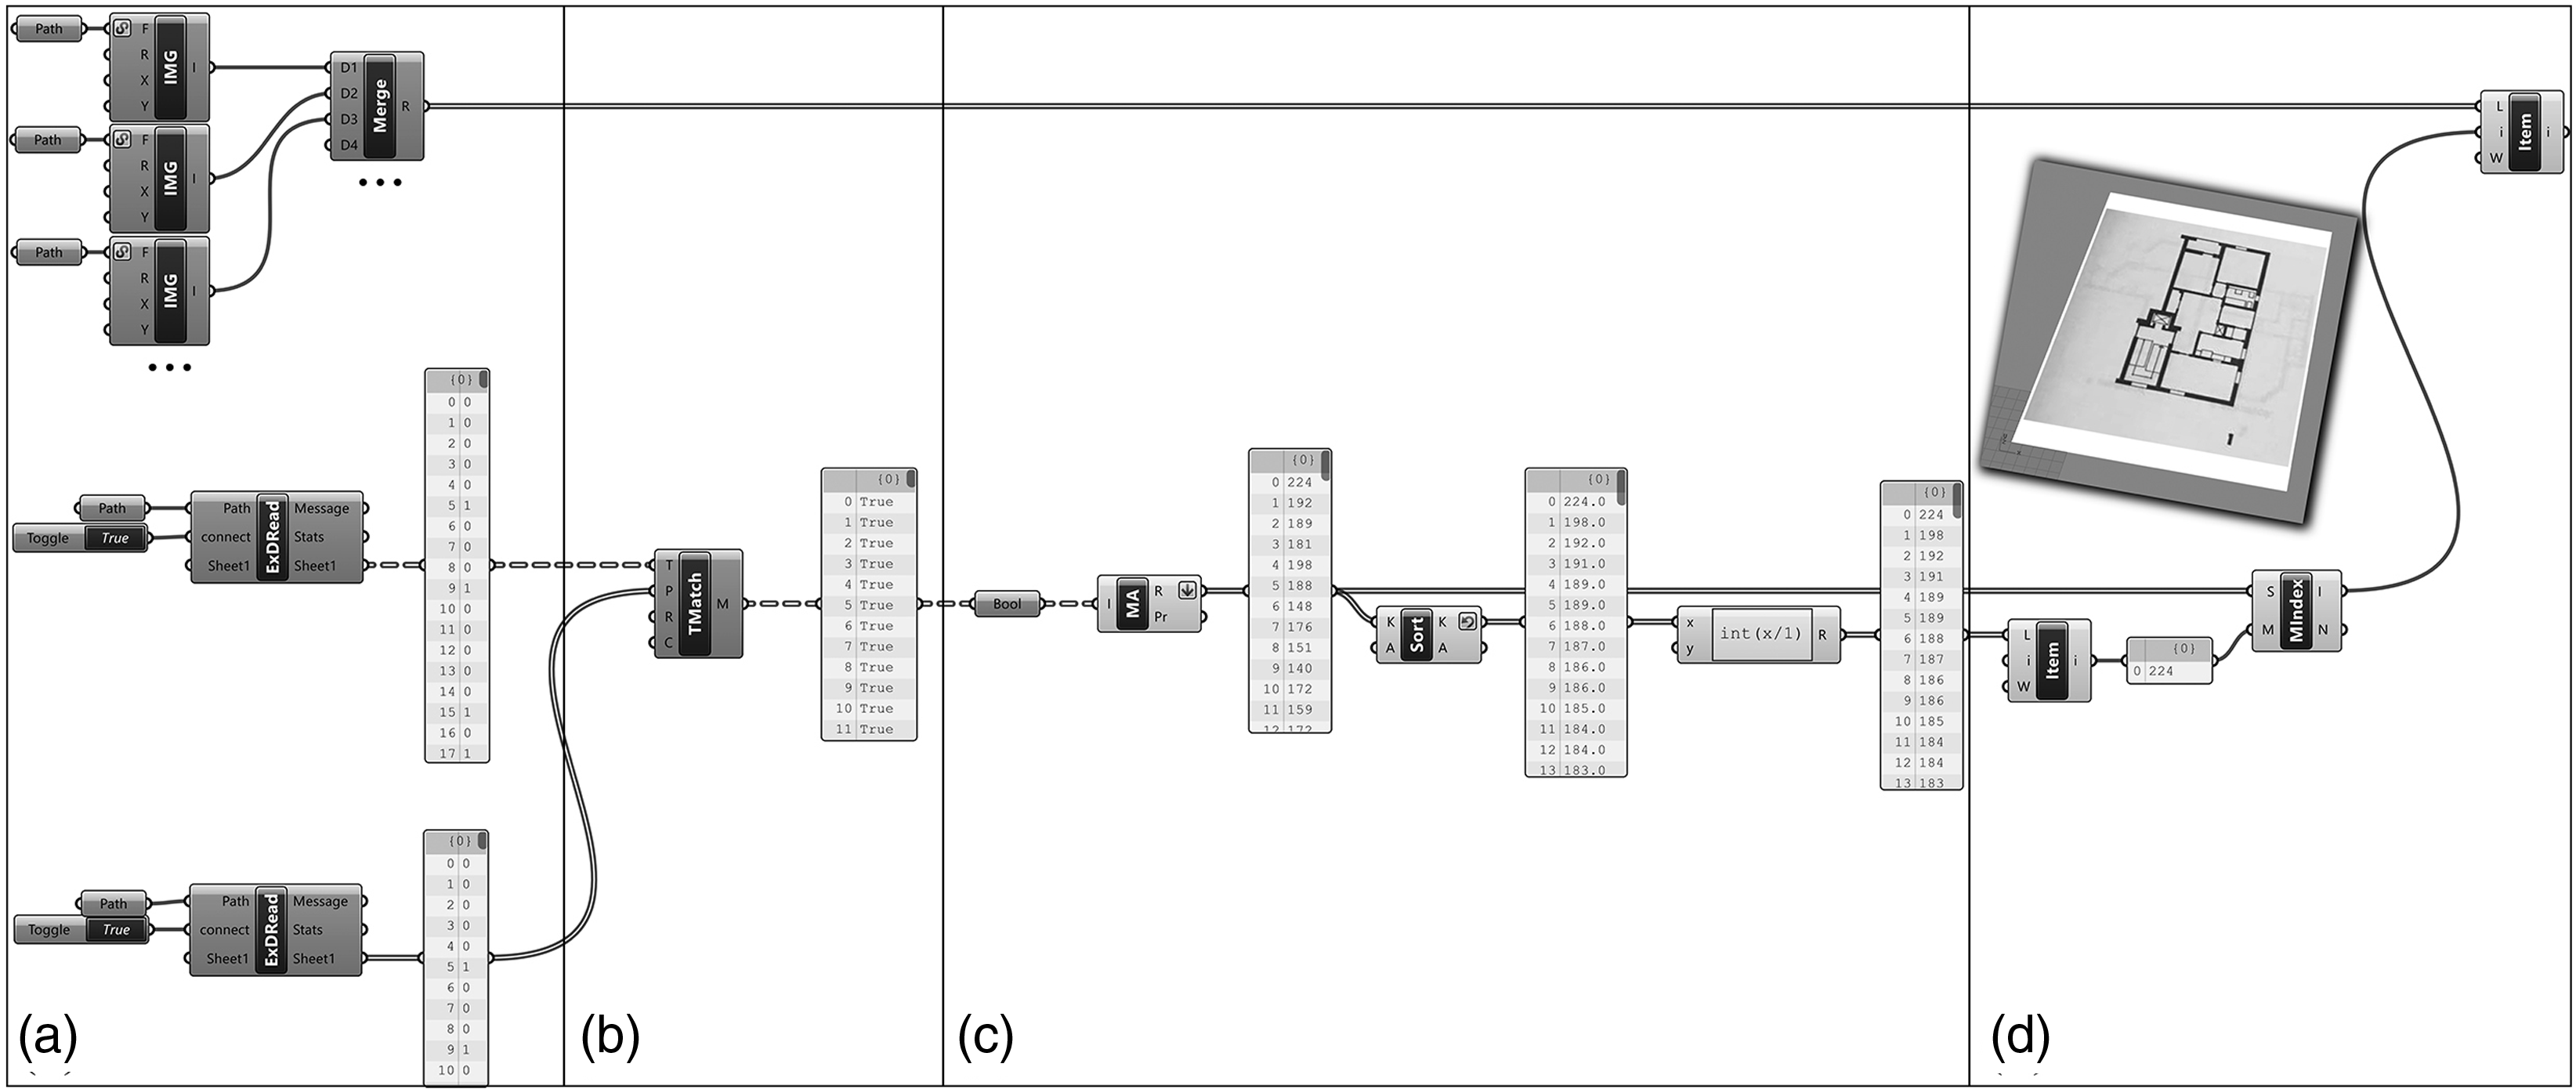
The algorithm selects the best housing types according to the answers from the online form, it lists all the possible types, from the most answered to the less answered, so it does not give a final solution, it gives better options from a list of types. The criteria are the questionnaire itself because it provides questions that are related to the needs of the inhabitants. The questionnaire converted to the online form asks about the area needed for the house, the number of bedrooms required, and the kinds of connections between the housing spaces, so by answering all 224 questions the inhabitant creates the criteria to select the most suitable type. Depending on the inhabitants’ responses, the algorithmic model is expected to support the selection of the house type that suits the inhabitant’s needs.
The fourth step was to parse the image for the subsequent vectorization process. The floor plan was coded with the necessary information as points and lines in RGB format, to 3D model the base geometry of walls, doors, and windows in BIM. In image processing software, such as Adobe Illustrator, red dots on the corners of the walls, green lines on the doors, and blue lines on the windows were marked, creating a parsing framework for the housing-type image (Figure 8). (Left) Image of house type 52
4
(developed by the authors); (Right) parsing of the house type with RGB code.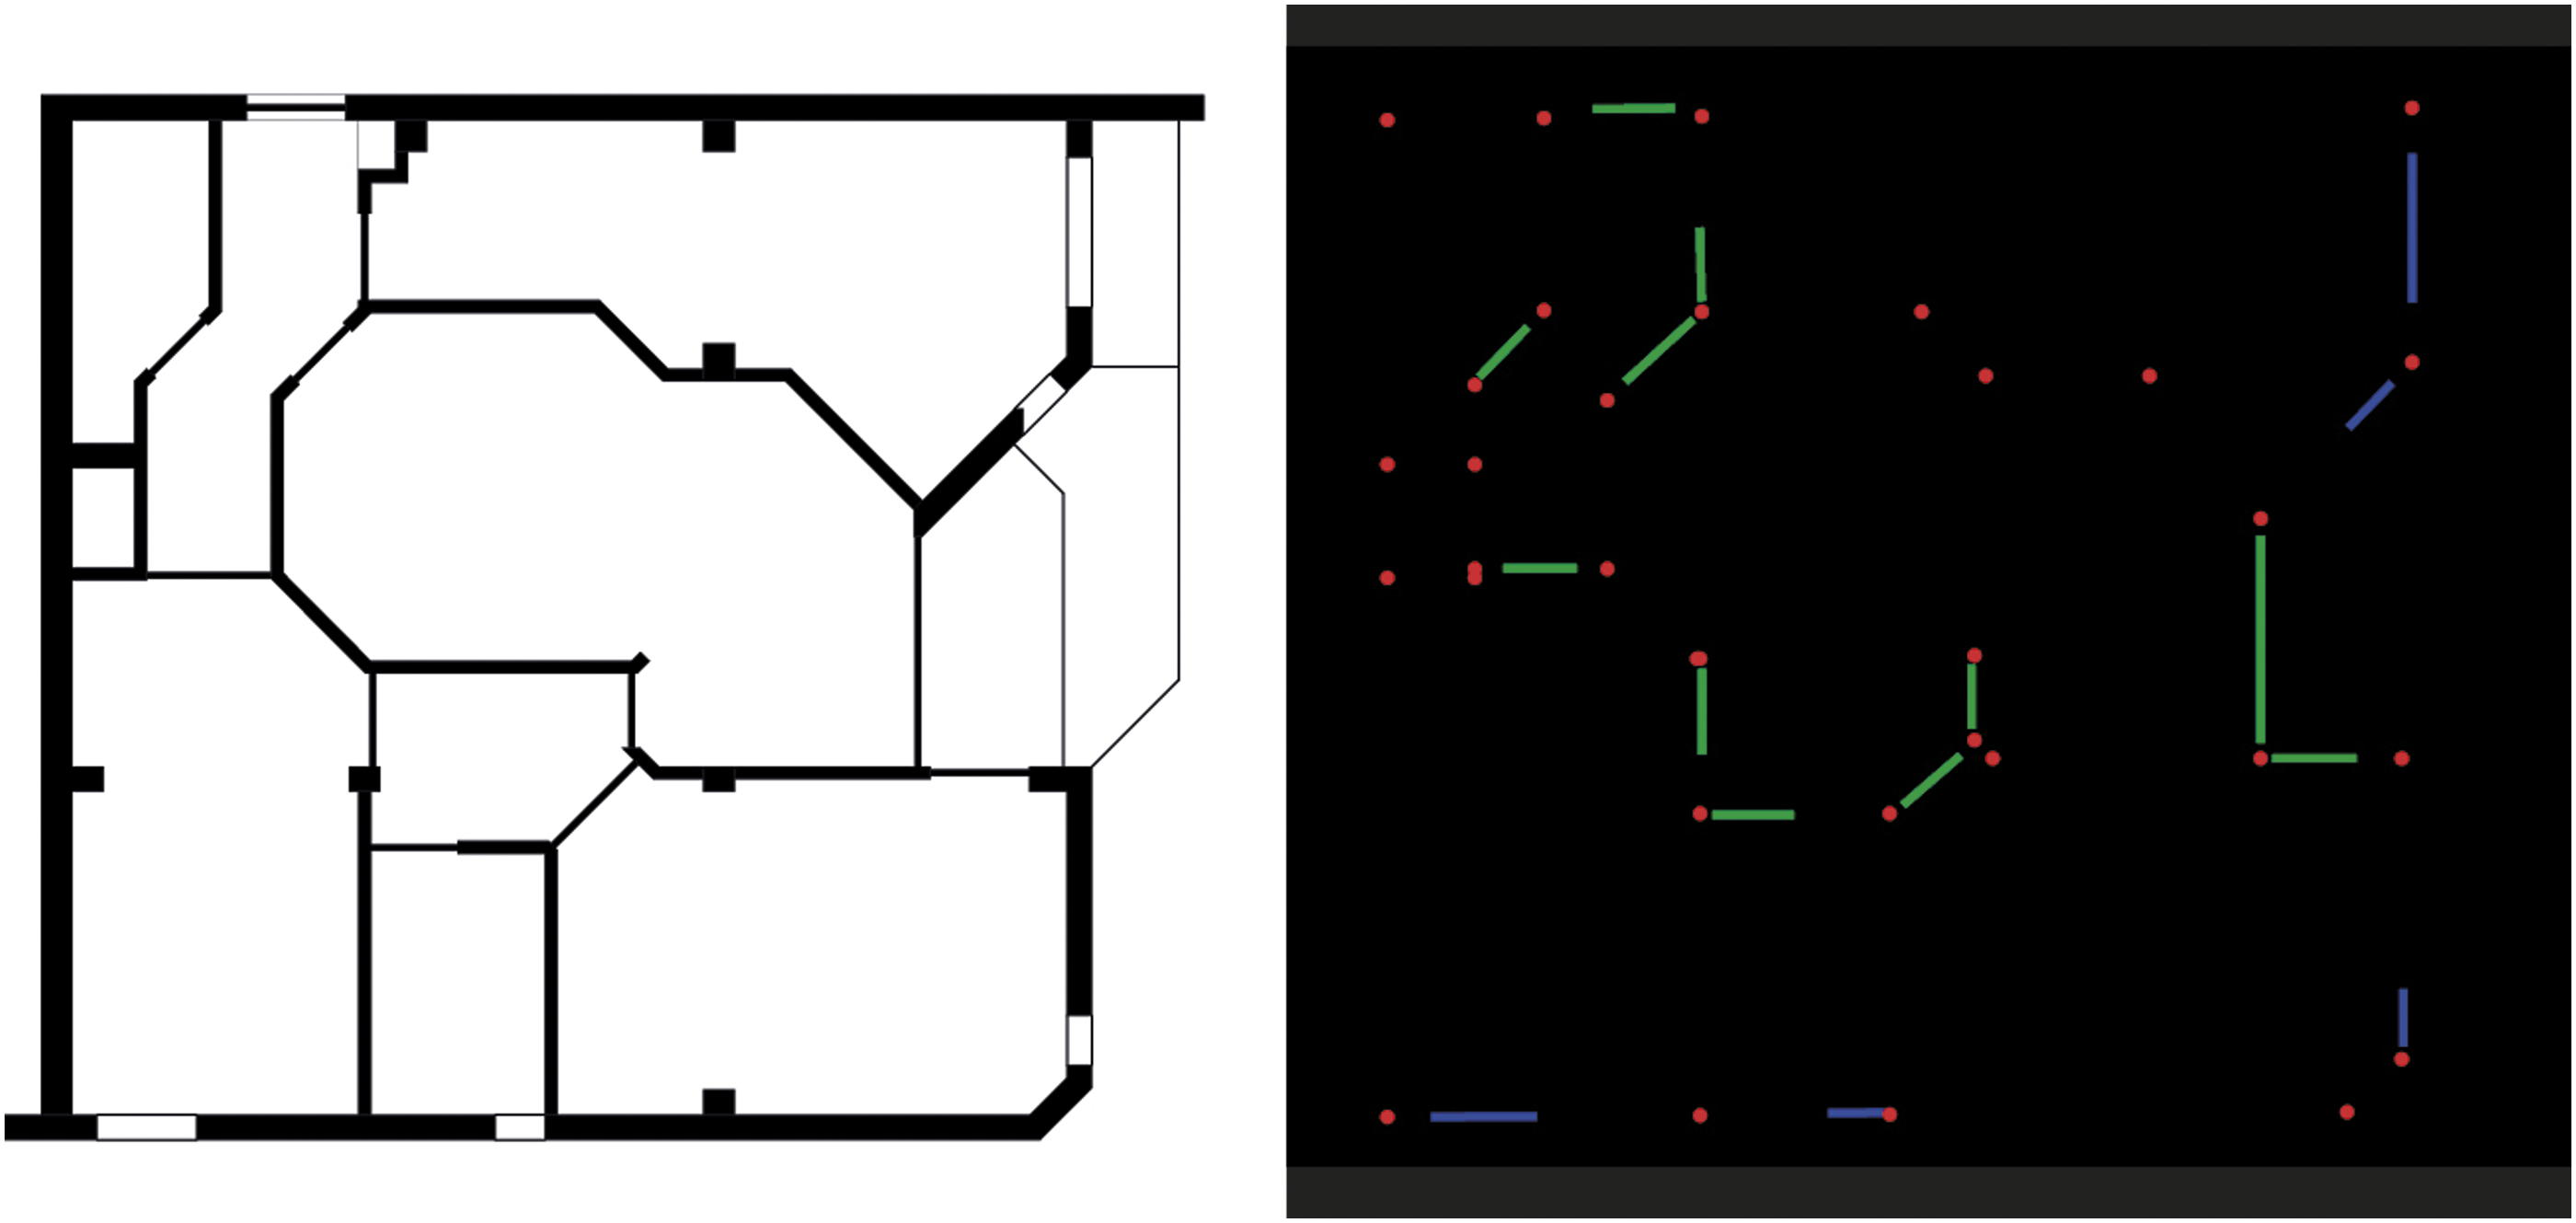
The fifth step was to vectorize the parsed image directly for BIM in ArchiCAD from a Grasshopper algorithm using the Live Connection add-on. The algorithm recognizes the RGB code, creating lines with red points for the modeling of the walls, and lines with green and blue information for the modeling of the doors and windows, respectively (Figure 9). Grasshopper—ArchiCAD live connection.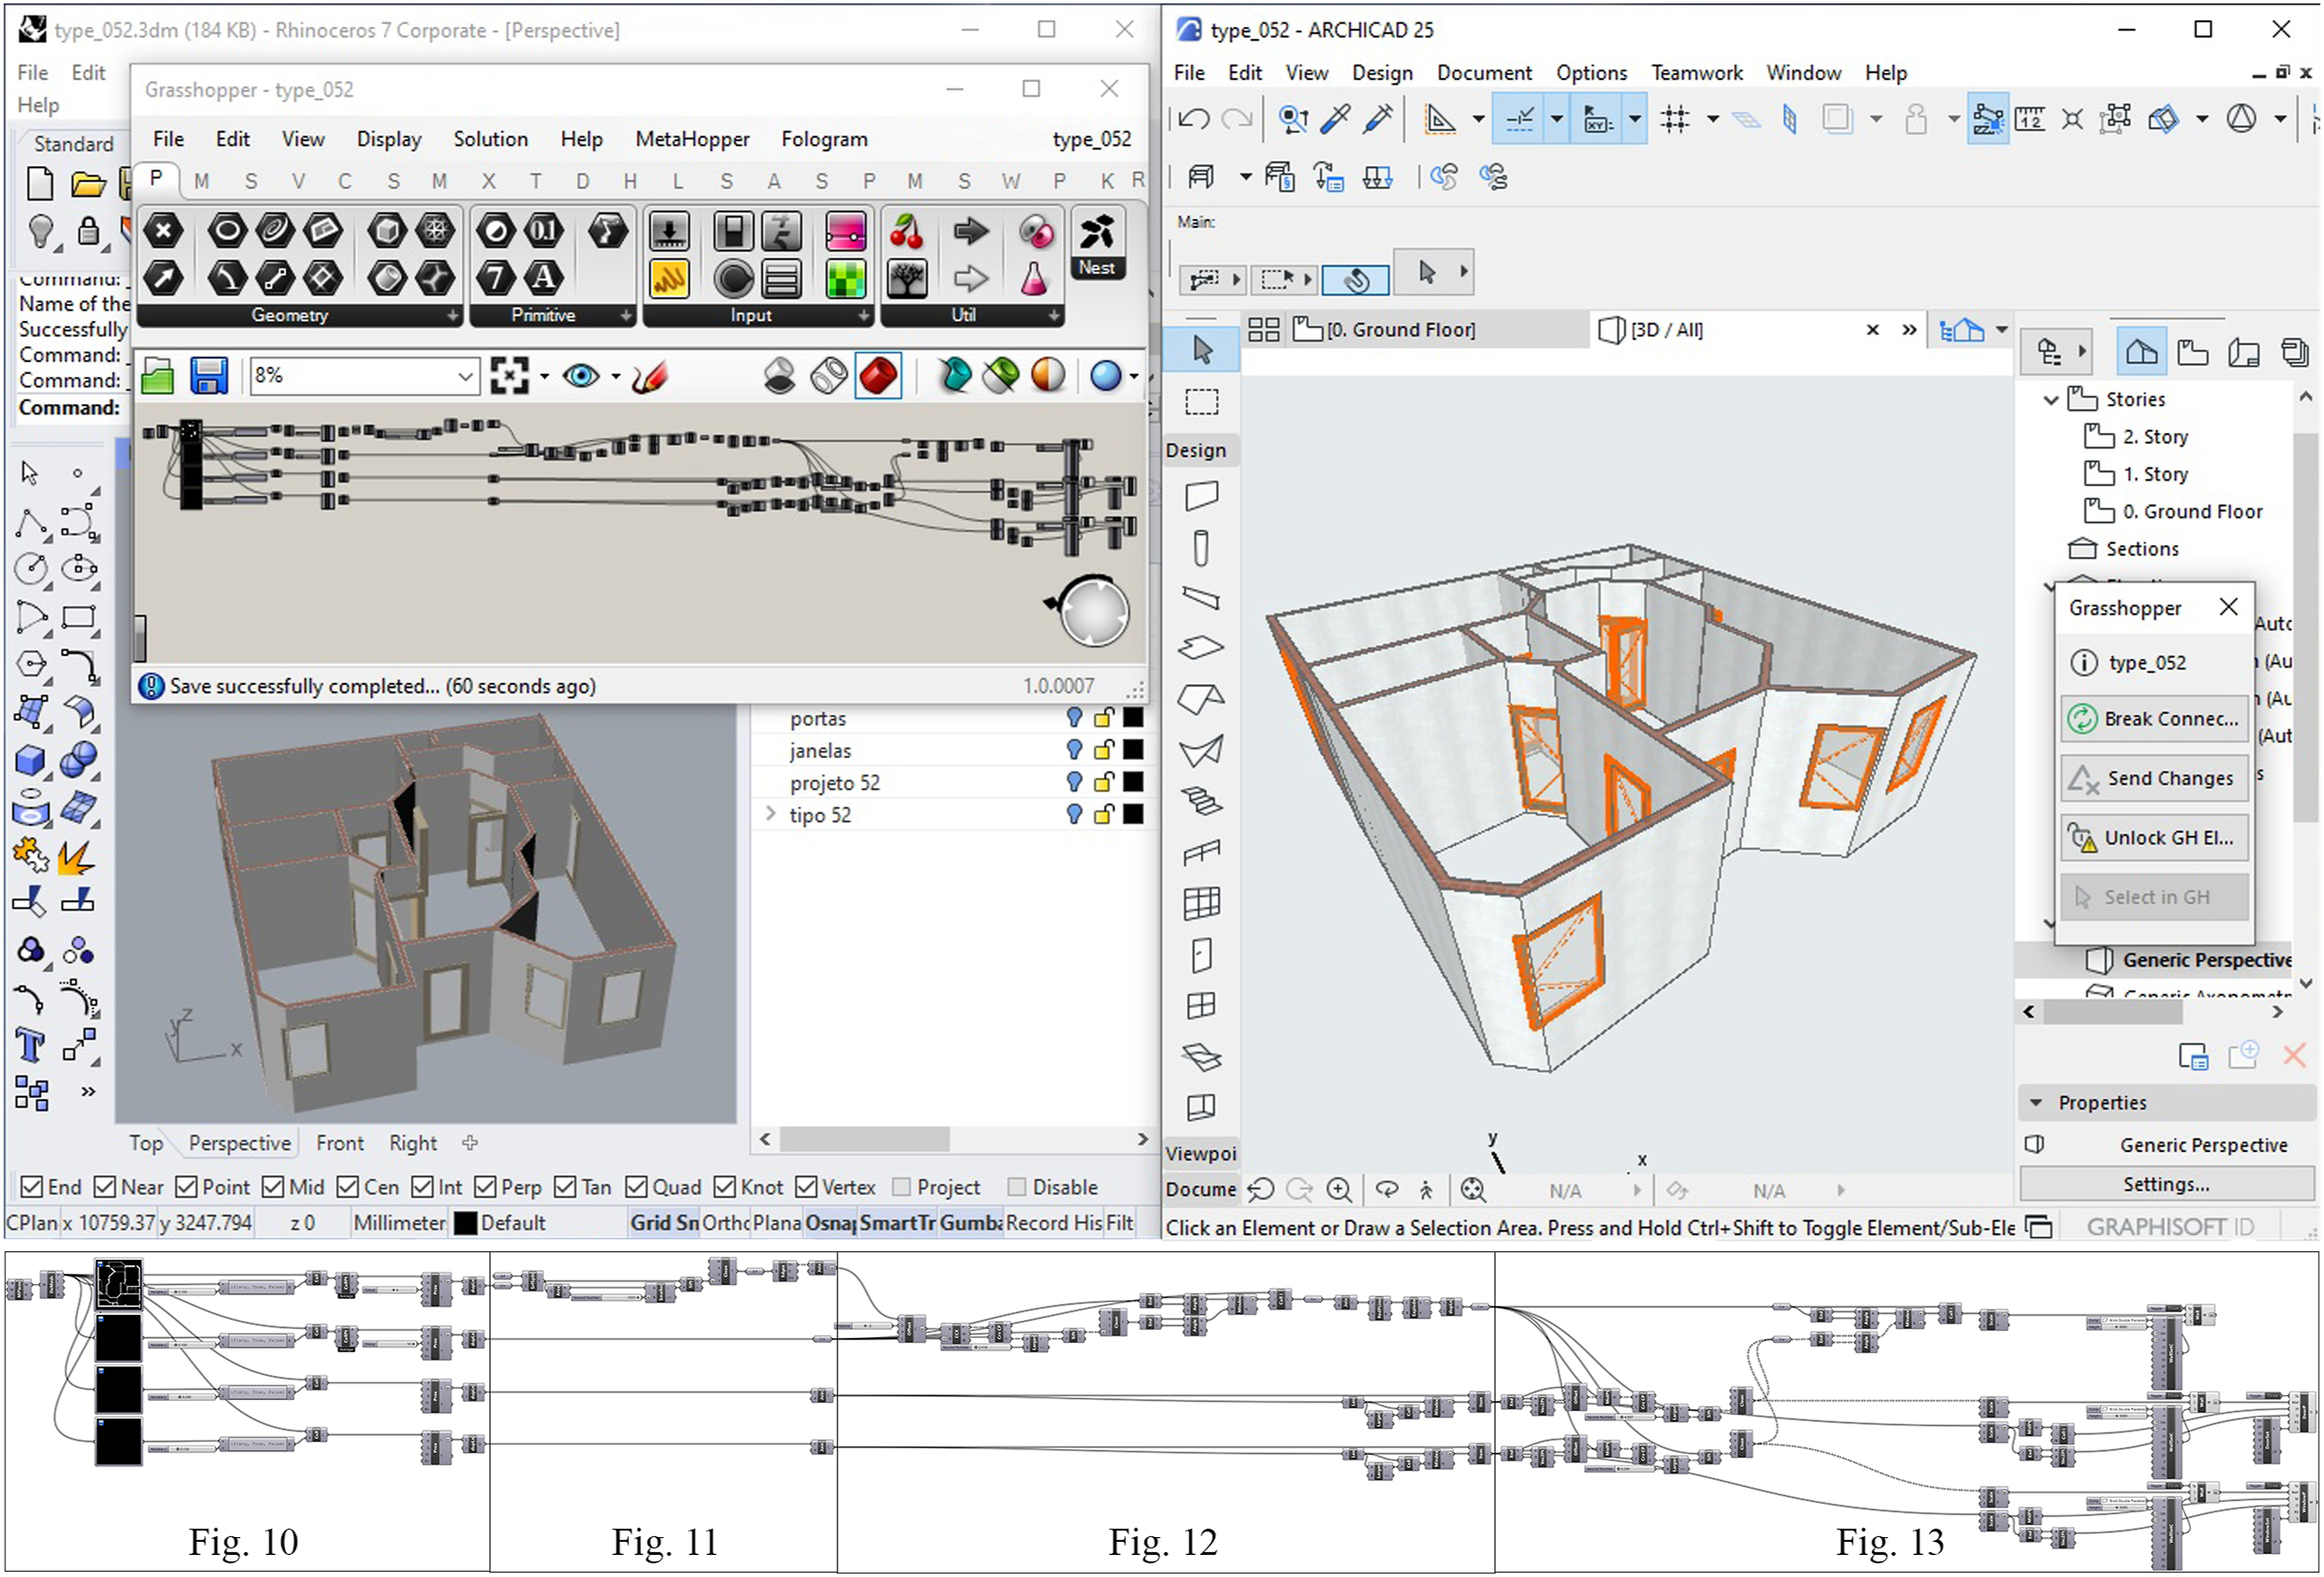
The inputs of the vectorization algorithm are four channels of the image acquired from the algorithmic model for selecting housing types based on online form answers. The image is in JPG format with 568 × 651 pixels. The first channel is the inverted color brightness channel to retrieve pixel information from the outlines of the spaces of the floor plan. The other three channels are the RGB codes acquired from the parsing of the floor plan image, separately these channels will provide the information for BIM modeling of walls, doors, and windows, respectively. The inputs are listed with the image sampler component of Grasshopper (Figure 10(a)). The algorithm proceeds with converting pixel information of the previous image channels into points in Grasshopper (Figure 10(b)). Then it connects the points with the proximity component and removes duplicate lines (Figure 10(c)). After that, the algorithm performs four sifting operations, one for each of the four image channels to acquire and organize the necessary information for the BIM modeling. Inputs of the image vectorization to BIM modeling algorithmic model.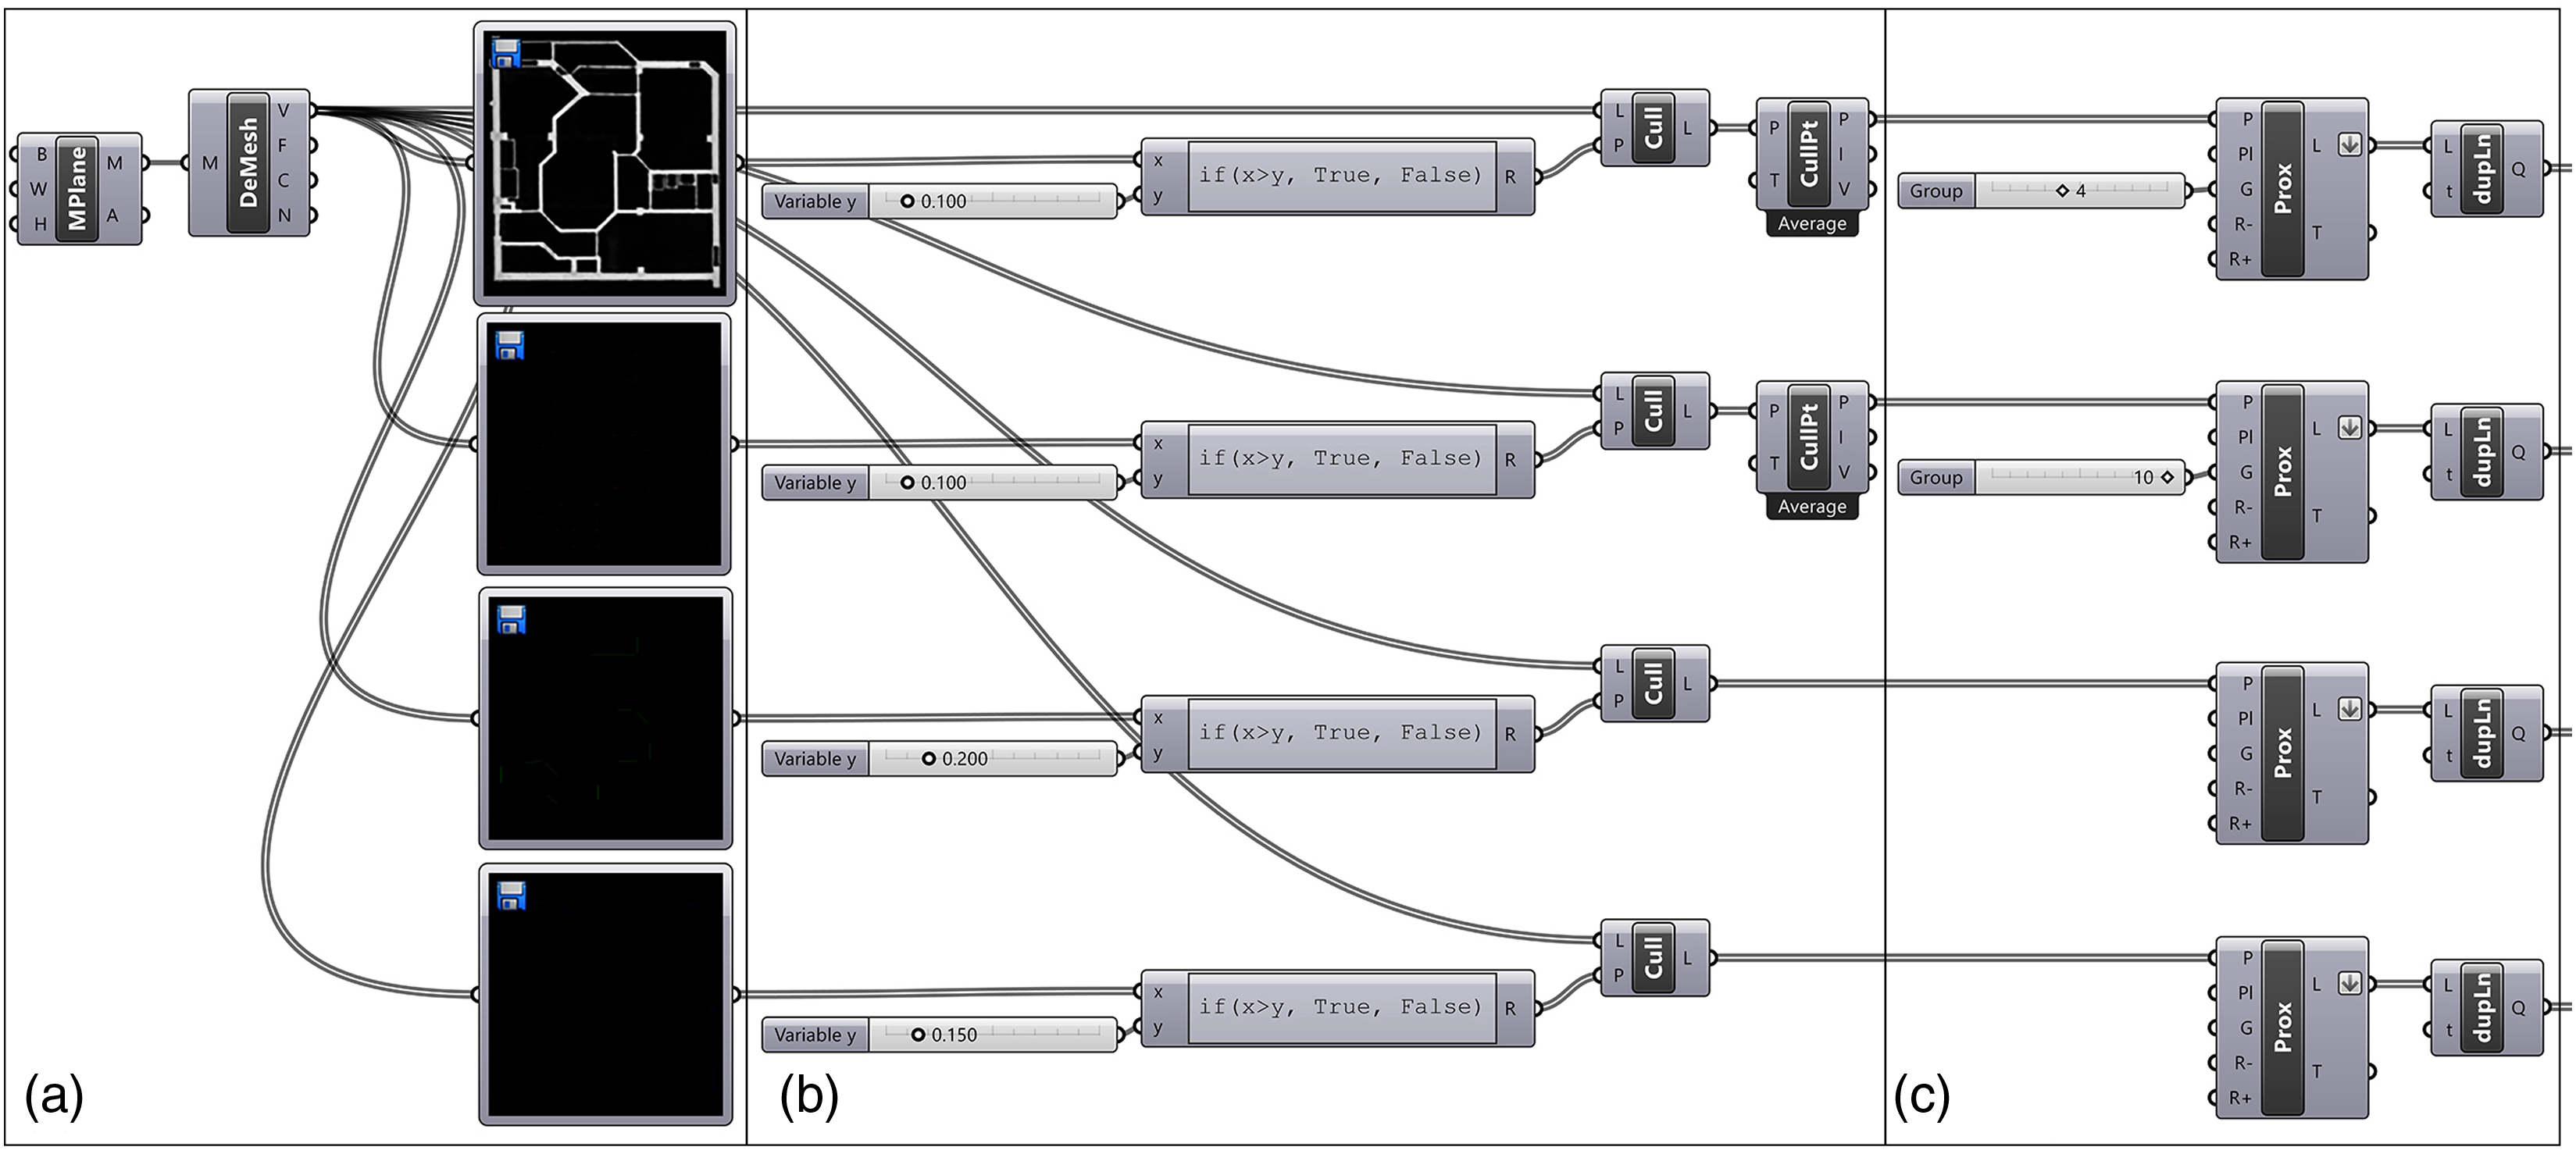
The vectorizing process continues with the selection of the housing space outlines from the brightness channel by the sift list component of Grasshopper to only select those outlines with the largest areas (Figure 11), in other words, the outlines of the housing spaces. These outlines are achieved by splitting a plane surface with the lines acquired from the proximity component, then retrieving the edges of the selected surfaces and joining them. The first sifting procedure for the selection of housing space outlines with largest areas.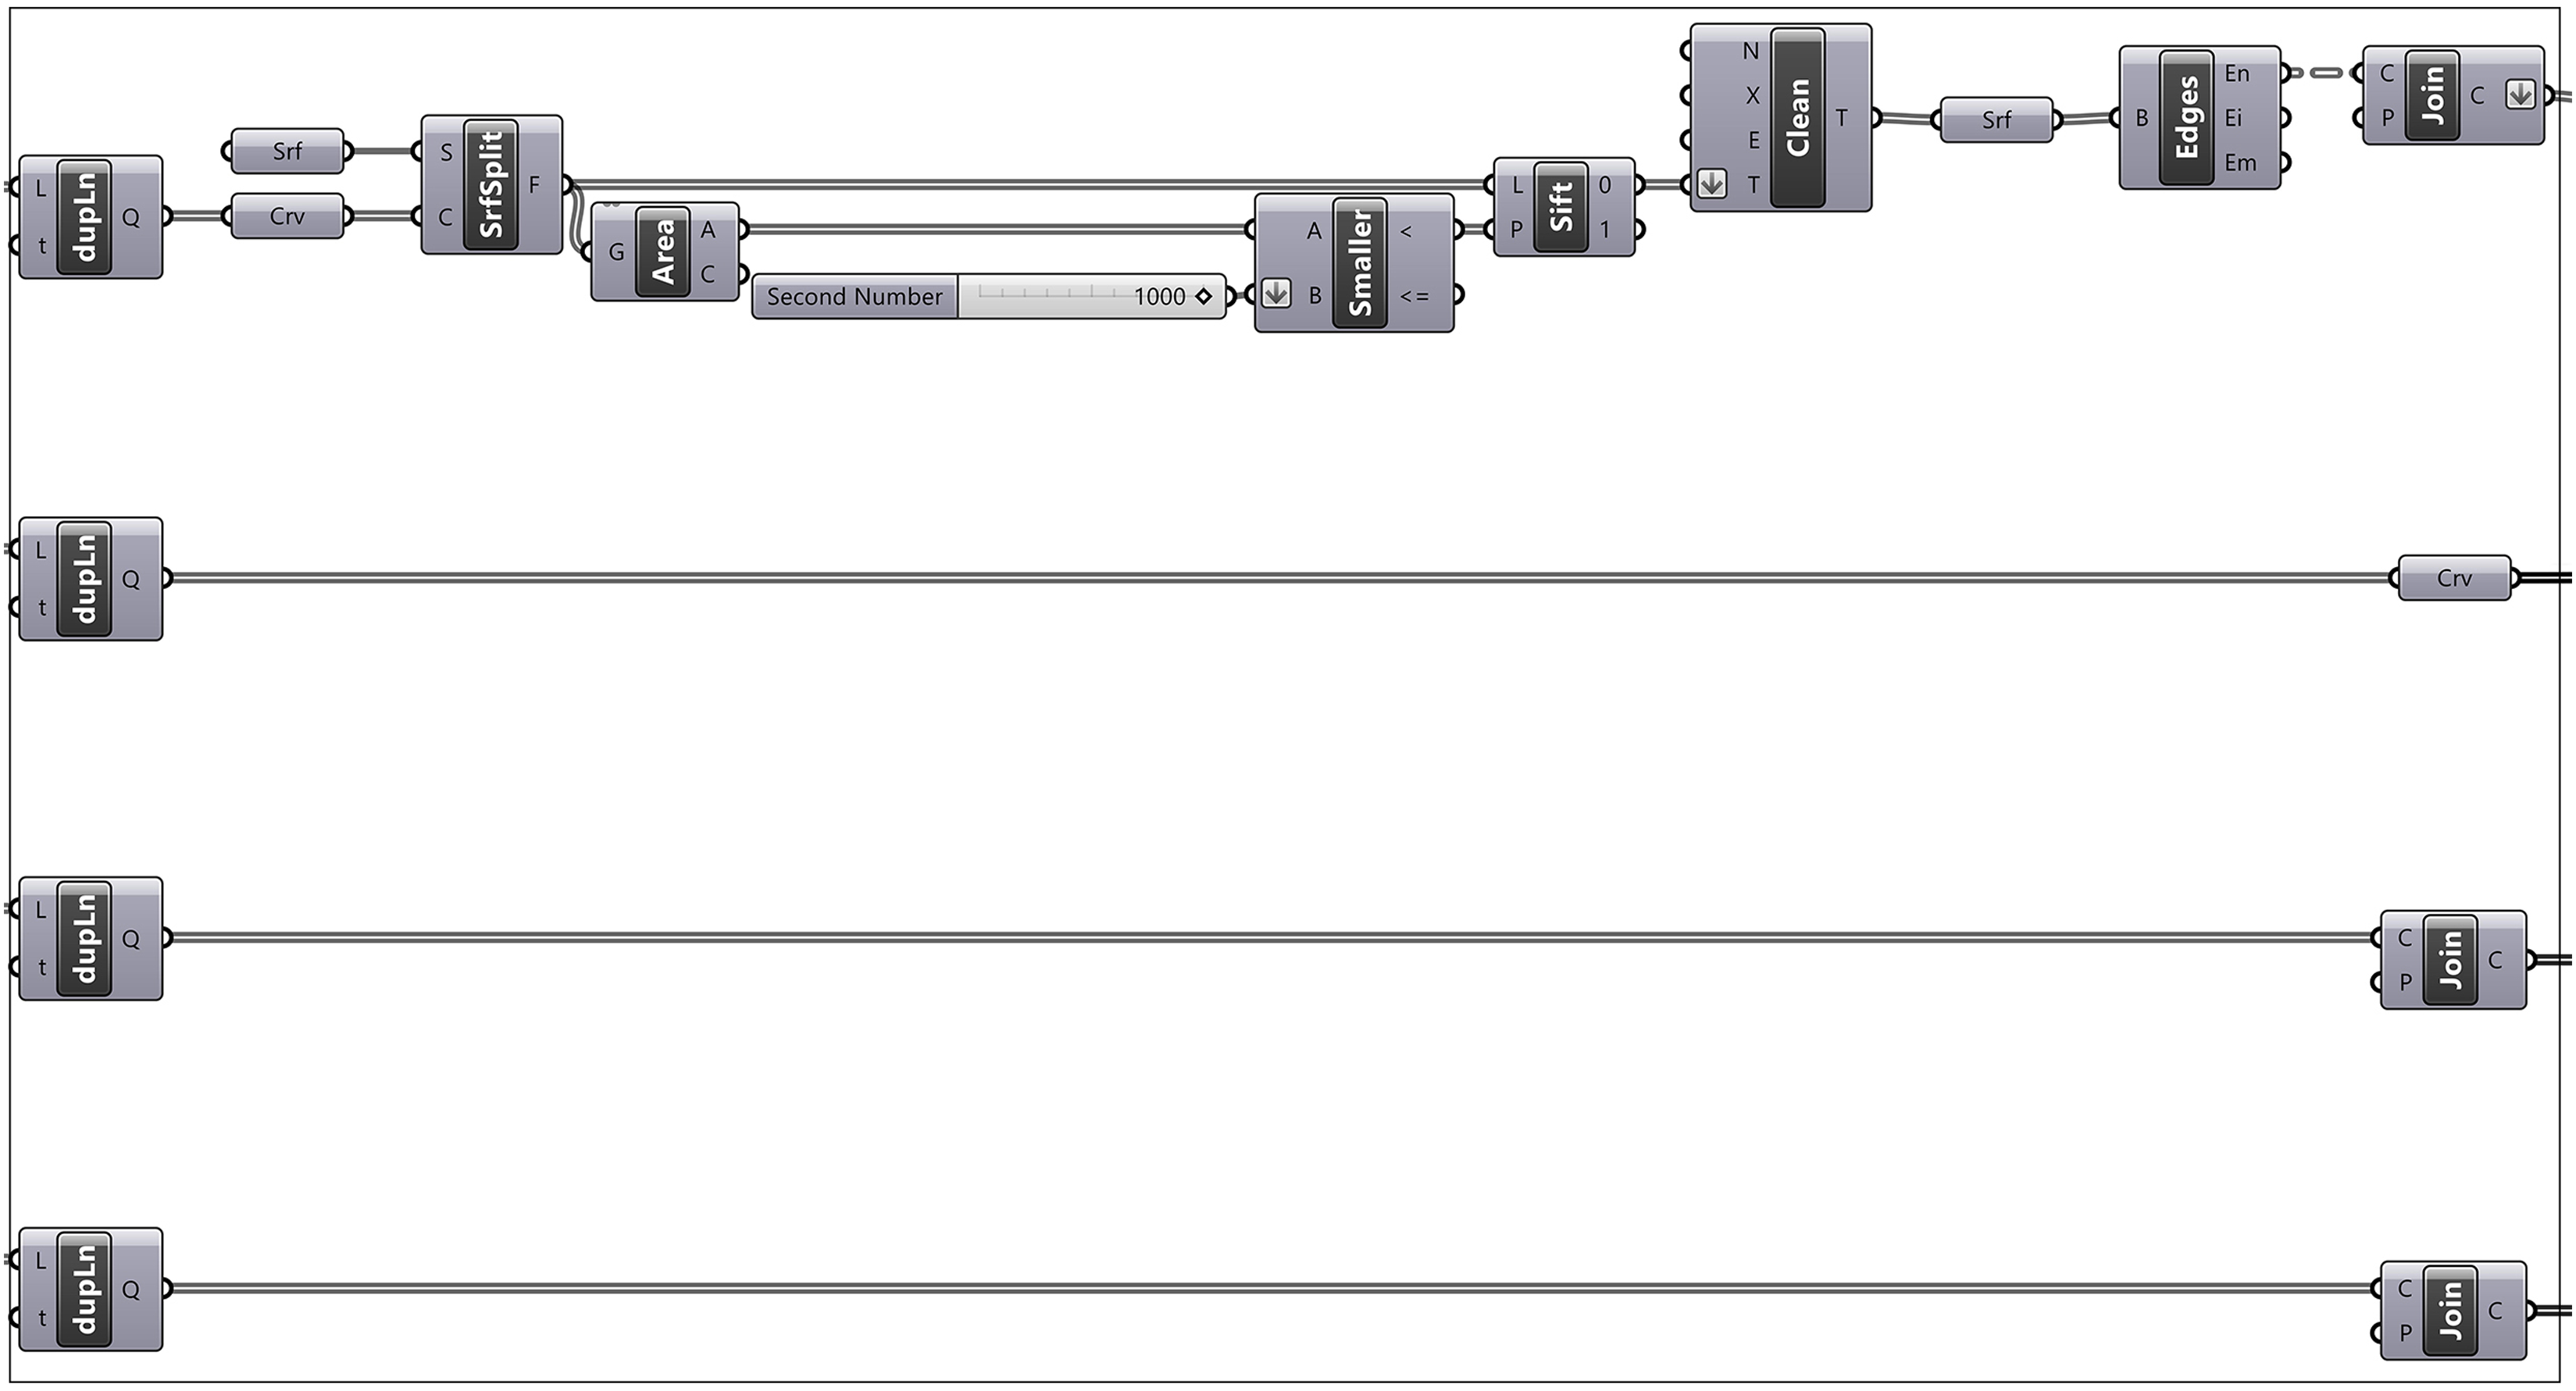
The previously mentioned outlines can be offset as needed to help remove all unnecessary lines generated by the previous proximity component. For the BIM modeling of walls, the vectorizing algorithm sifts the unnecessary proximity lines by intersecting them with the housing spaces outlines, to select only those lines that correspond to the walls of the floor plan image (Figure 12(a)). In parallel, the algorithm selects lines for doors from the green channel, and windows from the blue channel (Figure 12(b)). Second sifting procedure for selecting wall lines accordingly to the image source (a), and parallel selection of door and window lines (b).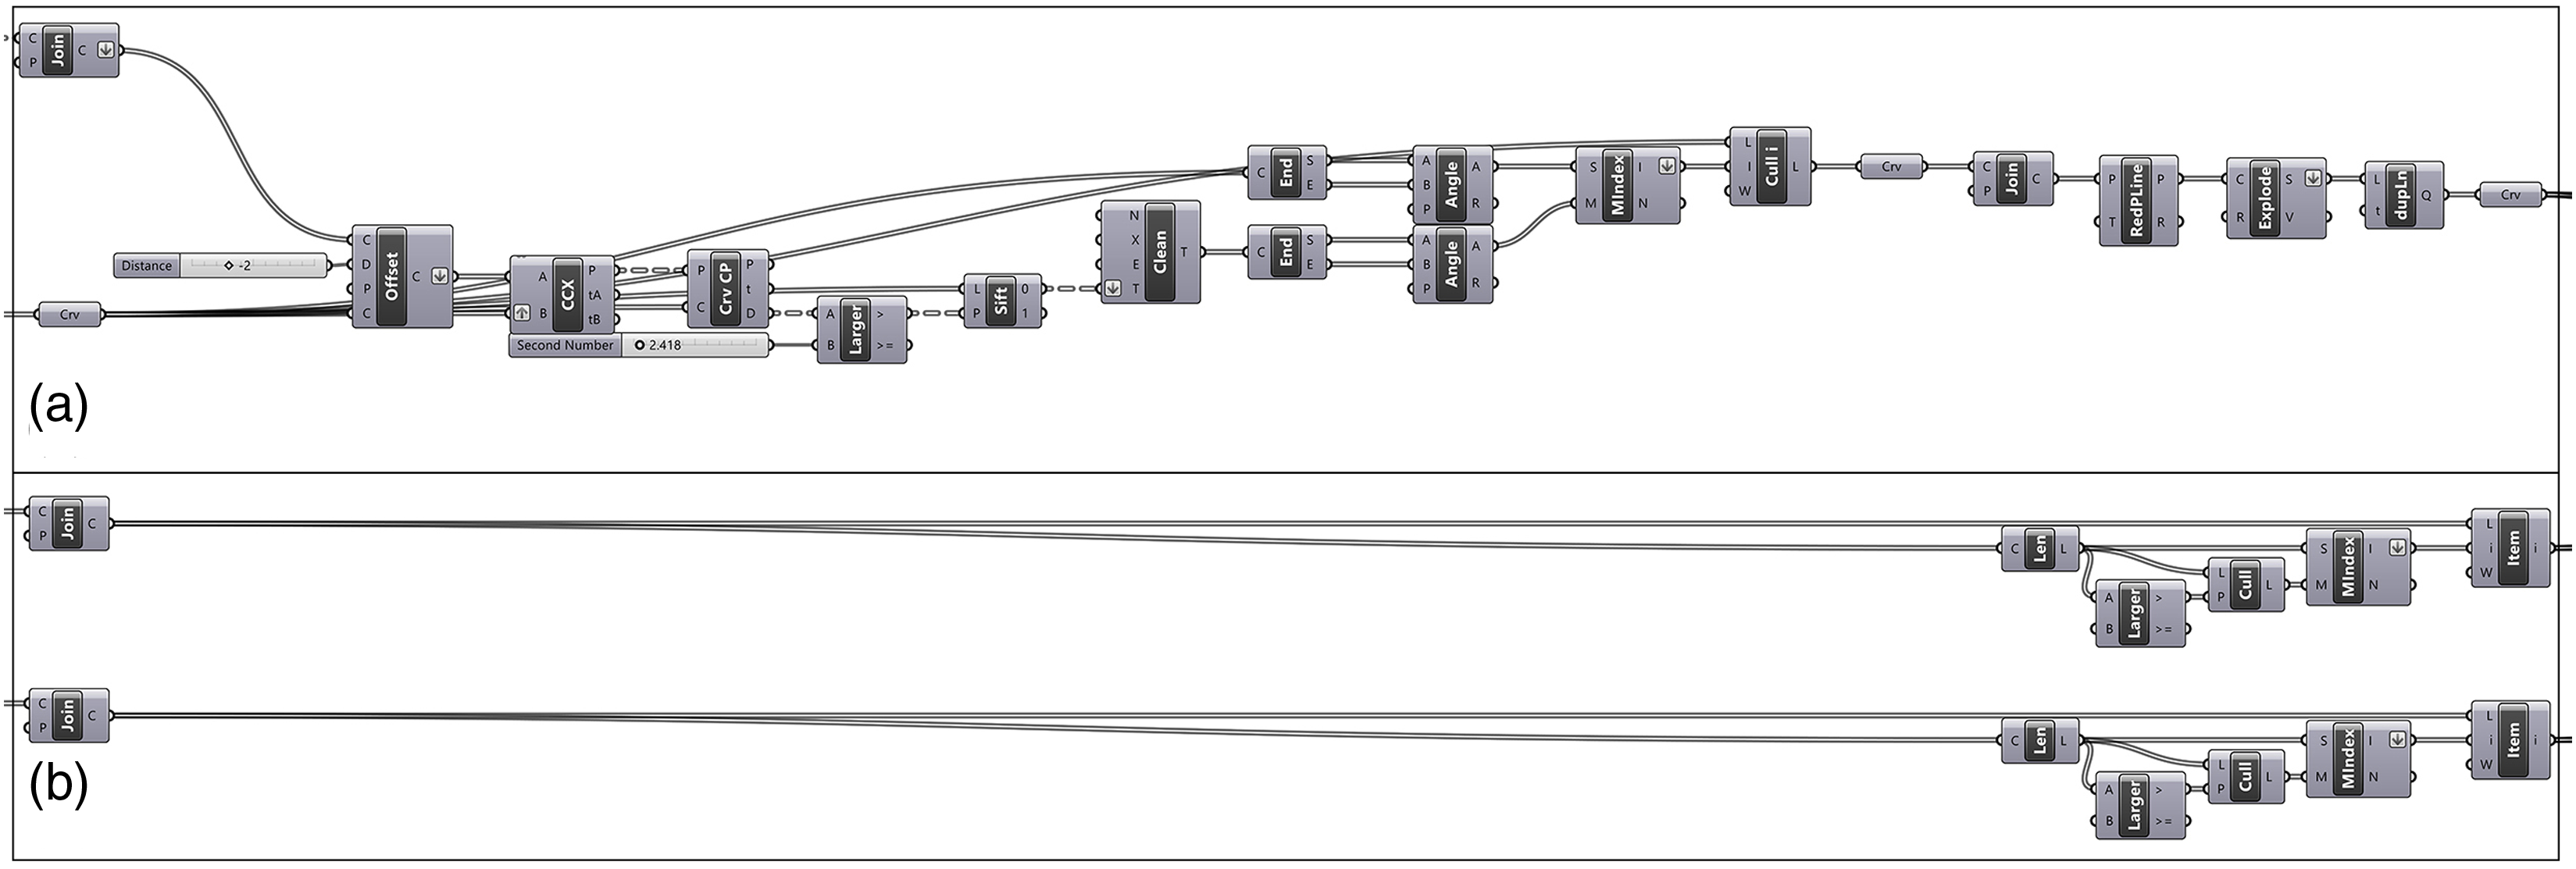
Then, the algorithm sifts and scales the lines to BIM model three kinds of walls, those that have no door or window, those that have doors, and those that have windows (Figure 13(a)). Finally, it creates walls, doors, and windows with the ArchiCAD Live Connection add-on (Figure 13(b)). The outputs of the algorithm are the BIM elements in both Grasshopper and ArchiCAD simultaneously. In this sense, it creates a modeling process directly from the pixel information of the image source. Then, from the handmade drawing by Alves Costa, the digital model is achieved through software interoperability. Third and fourth sifting procedures to organize and scale information (a) for subsequent BIM modeling (b).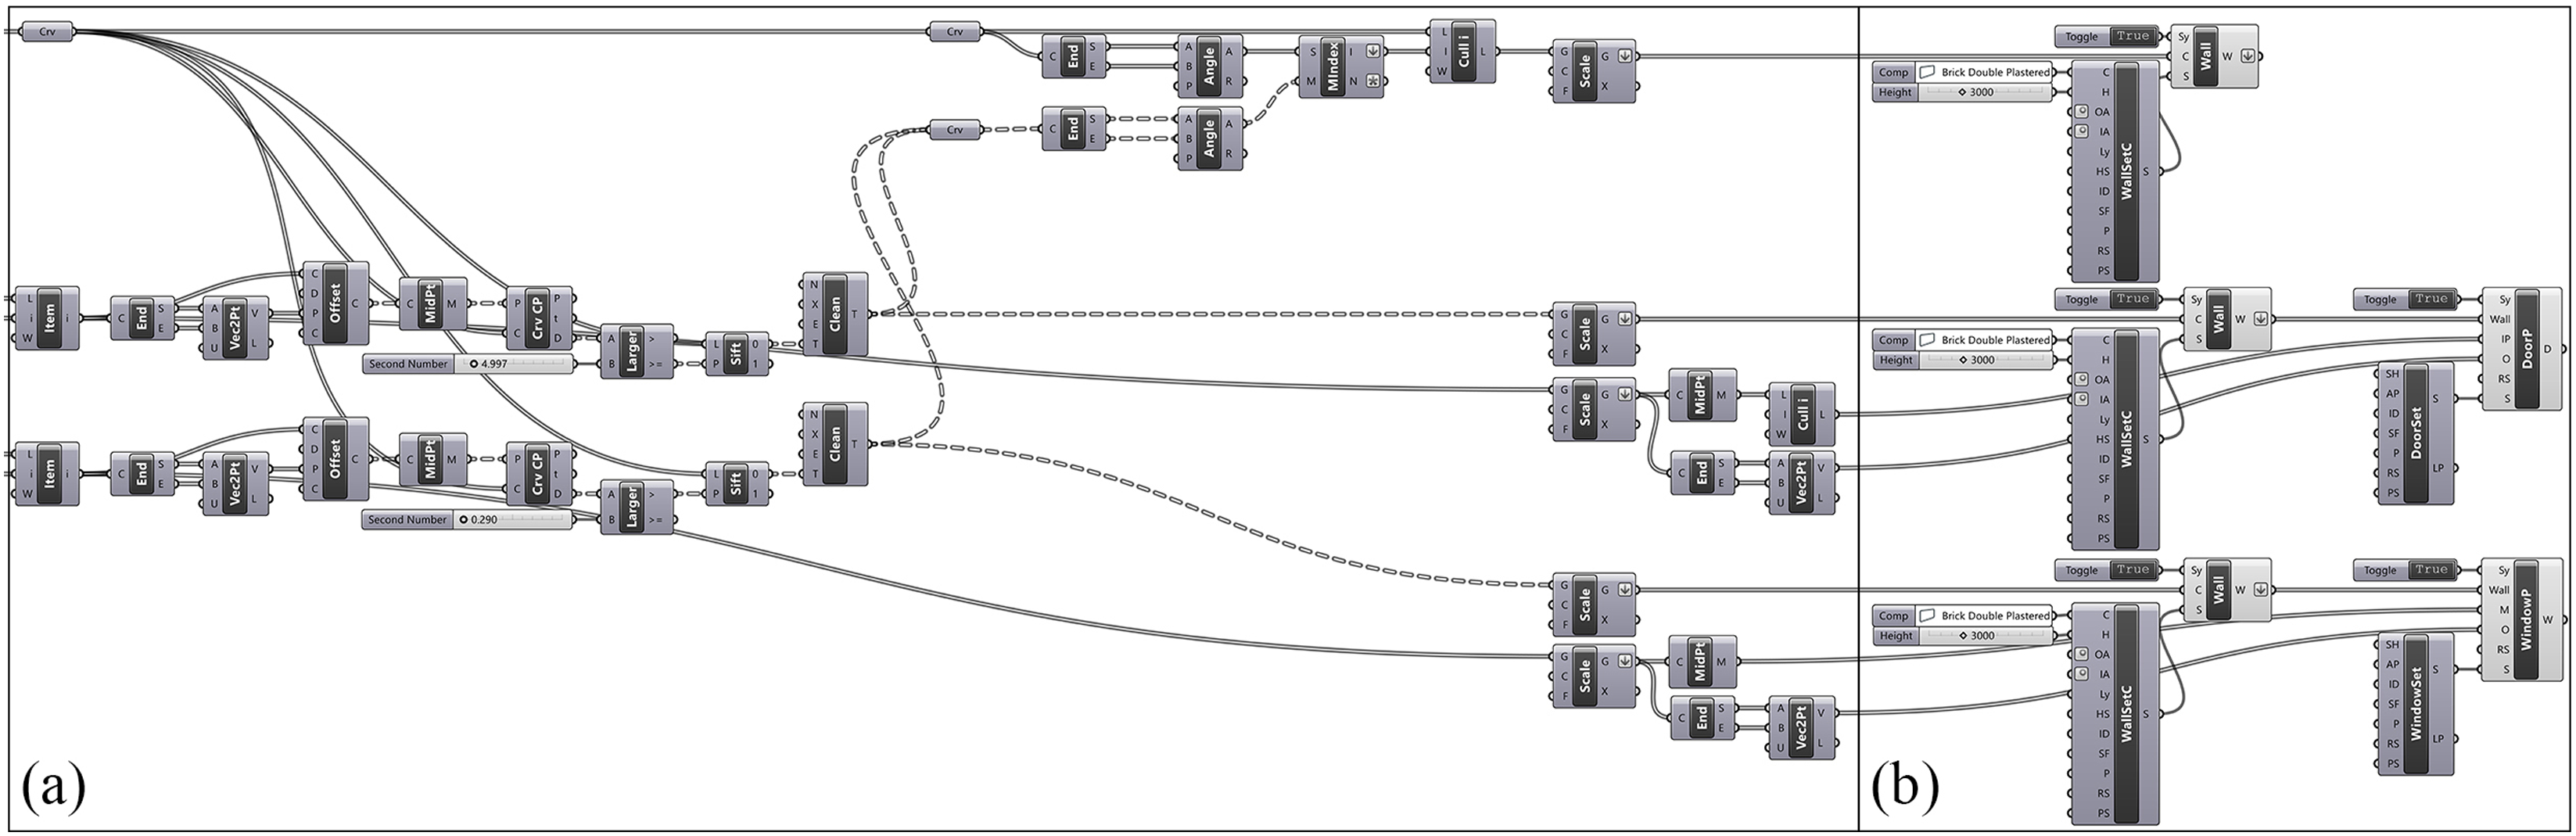
With this instrument for a sociological survey and BIM modeling, the architect would be given a design that has already been modeled with an automatic documentation system for the rationalization process based on the specific needs of each case. The sixth and final step can occur based on the preferences of the architect or designer, and the BIM model allows many digital simulations that can help in the decision-making process afterward.
Evaluation of the digitization method
The only analogical material that was digitized was from the LNEC 1966 report. The questionnaire was digitized into an online form, the handmade matrix was digitized into a spreadsheet, and the architectural database of 117 floor plan drawings was scanned. With this material, the first algorithmic model in Grasshopper connects them all and results in an image selected by the answers of a hypothetical inhabitant.
The methodologies outlined in the LNEC 1972 report were not reproduced in this study due to a lack of information about the computational programming processes. On the other hand, it should be noted that research on the design of architectural floor plans founded on housing functional graphs is promising. 13 From the LNEC 1972 report, we learned a method to convert functional graphs acquired from the 1966 report into layout schemes for architecture. This method was understood as a principle of what was housing research at LNEC during the period and was assumed in the present digitization process considering today’s techniques, such as BIM. So, the digitized material from the 1966 report was used to test what the LNEC 1972 report pretended, working directly with the images of the floor plan drawings to create 3D models, in a second algorithmic model, something that was not achievable in the 1970s.
This sociological and architectural database is outdated since it is from the 1960s to 70s and requires updating if to be used for contemporary practice. However, the presented algorithmic models work with any database. For the example of this article, we used the database and principle found in the LNEC reports with respect to the historic research but most importantly to present its potential for becoming a design instrument independently of the database. The digitization method is open to different kinds of questionnaires related to different sets of floor plans. In this sense, the algorithmic models could work for different programs besides social housing, it only depends if the questions match the architectural typology. Building information modeling and architectural design are achieved as a direct result of filling out the online form, since the result of the form is an image to be converted into a BIM model.
The digitization of the LNEC 1966 report via algorithmic modeling allowed for an application via BIM, which proved useful as an instrument for architectural design. The initial test provided valuable feedback for future method improvements, such as configuring the default model setup inherited from the Grasshopper algorithm and the necessity to share the ArchiCAD file with its library. The link between algorithmic modeling and BIM has been experimented with previously 14 and through this research study, it is connected to social housing design.
This study has the potential to aid in one of the most difficult tasks to achieve mass customization of housing which is the relationship with the inhabitants. Recent research can design millions of different housing solutions, 8 but if this sociological approach is not completed, the problem persists because the job of attending to the needs of the families is challenging since the amount of information is hard to process. The purpose of such assistance is to give the architect feedback to start the design with an instrument that saves production time in a process where quantity defies the practice since the expectation is to attend to hundreds of families assisted by housing programs in a short period.
The interaction with the user can be improved by constantly updating and modifying the system database according to other inhabitants’ functional and behavioral needs. Of course, there is much work until the end user could use this preliminary result, nonetheless, this digitization process was essential for creating a participatory design environment because it involved first the comprehension of an architectural theory and historical context, and second, the conversion of data that revealed the potential for becoming an instrument of social housing design that allows optimization and scientific reliability for the architect or designer’s job.
Another challenge was making the parsing process more automated. One possibility was to employ an online parsing system 15 that generates an image codified similarly for further vectorization. However, due to its constraint of only working with orthogonal floor plans, the same constraint of the LNEC 1972 report, the online parsing system was not preferred. For this research, the RGB code parsing framework with points and lines was developed for BIM modeling to interact better with the Grasshopper image sampler component and to be parsed by a deep learning process of object detection with Tensorflow.
Previous research on the conversion of pixel images to vectors 16 has revealed that deep learning can be highly effective for object detection. Detected patterns in floor plans can be architectural elements such as wall corners, doors, and windows, as well as spaces such as kitchens, bedrooms, and living rooms. Consequently, the object detection method can provide geometric information to program parsing processes of floor plans.
Although the vectorization process was not completely automatic, once the architect or designer still has to check for interior space areas and respective CAD outlines for every vectorization, it has enough level of automation to accomplish the digitization process in a faster way than 2D CAD drawing or 3D BIM modeling. The lack of precision in the orthogonality of the wall lines was something to deal with, but most of the time it was about the images; if drawings were properly scanned without distortion, or if they were already from digital sources, orthogonality was most likely to be achieved.
Conclusion
Nuno Portas experimented with computational methods applied to architecture, and this process resulted in architectural practice with the SAAL program. Alexandre Alves Costa developed the prototype of a computational system that used a sociological method to systematize the approach with hypothetical inhabitants. The laboratory test was conducted to an analysis system but not converted into a design system. A second experiment, mainly conducted by Luís Moniz Pereira, advanced in this direction, but with the technology available in the 1970s. Both works belonged to the same line of research but they were disconnected in procedural terms and remained without testing for 55 years. Therefore, the challenge was to digitize this knowledge and consequentially facilitate the practice of evolutive housing nowadays.
The digitization process proposed here could introduce the aforementioned methodology in a production process assisted by digital technologies that would allow better performance in several stages of housing design. As well as to aid the method of informational analysis of the housing functional program for a better achievement of the proposed goal. In the 1960s, the LNEC team could not directly apply the method to architectural design; their result was only applied to architectural floor plan analysis. So, the present research fills this gap by creating an instrument to apply the 60s method to architectural practice, aiding the architect first to acquire sociological information, second to find the best example floor plan from the database, and third to start the architectural rationalization process from a solid typological reference.
In the case of this study, a connection between the evolutive housing system, created in Portugal, with a BIM operative base was accomplished through algorithmic modeling, to further the development of architectural design from the needs and expectations of the inhabitants. This approach proved to be efficient to handle a difficult stage of interaction with the inhabitant, which is to prepare the form for completion of the algorithm that will choose the best types for each case. The study continues the LNEC research in a digital context, recognizing that it was a fundamental scientific reference for the SAAL operation as a framework for the relationship with the inhabitants. With the digital instrument proposed here, the job of the architect could be faster and more responsible for the assistance of multiple families simultaneously.
By examining, translating, and improving an analog computational method from the 1960s to an algorithmic digital model, this study contributes to the field of architectural computing in the sense that it relates contemporary computational design techniques with scientifically proven sociological theories. Another contribution is the development of new algorithms for transferring data to the BIM model since the study directly links architectural design with sociological data as if the social housing digital model could be achieved by filling an online form with information about the needs of the inhabitants. Finally, the collection, analysis, and presentation of written sources from private archives, interviews with an architect involved, and documents from the same line of research that were spread throughout different institutions, demonstrate the gaps that still exist for a broader understanding of its relevance to contemporary application. Nonetheless, future research pretends to update the sociological and architectural databases of the 1960s–70s to suit contemporary needs.
There is still much to be done in terms of user experience optimization, for the potential inhabitant who needs architectural information for social housing construction or renovation, especially a greater integration between the different systems, Excel, matching algorithm in Grasshopper, vectorizer in Grasshopper, ArchiCAD Live Connection. There is interoperability given mainly by Grasshopper, but there is still a need to integrate the systems into an online platform, i.e. in a programming language that can stitch the software together.
Aligned with the LNEC team, in future studies, AI-based deep learning algorithms can be used to support the tasks that need to be more automated such as image parsing. Machine learning models can be trained with new datasets while keeping the same digitization workflow. In this sense, the next step of the research will be to connect the method with AI techniques to keep its database evolving during the update process.
The expected result for future research will be a prototype of a computational system that organizes a design process for social housing, having as its foundation the participation of the inhabitant, for its subsequent architectural rationalization within the technical advisory process, regardless of whether the purpose is housing construction or renovation. The research will seek to insert the developed prototype into an interactive system to facilitate dialogue with the inhabitants.
Footnotes
Acknowledgement
We would like to thank Professor Alexandre Alves Costa for sharing with us the original documents of the LNEC 1966 report, and for the interview that cleared many questions about his work.
Declaration of conflicting interests
The author(s) declared no potential conflicts of interest with respect to the research, authorship, and/or publication of this article.
Funding
The author(s) disclosed receipt of the following financial support for the research, authorship, and/or publication of this article: This work was supported by the FCT - Fundação para a Ciência e a Tecnologia (UIDB/00145/2020).