
Abstract
We developed a suite of procedural algorithms for space planning in commercial offices. These algorithms were benchmarked against 13,000 actual offices designed by human architects. The algorithm performed as well as an architect on 77% of offices, and achieved a higher capacity in an additional 6%, all while following a set of space standards. If the algorithm used the space standards the same way as an architect (a more relaxed interpretation), the algorithm achieved a 97% match rate, which means that the algorithm completed this design task as well as a designer and in a shorter time. The benchmarking of a layout algorithm against thousands of existing designs is a novel contribution of this article, and we argue that it might be a first step toward a more comprehensive method to automate parts of the office layout process.
Introduction
Automation takes hold
Driven by machine learning and faster computers, automation and artificial intelligence (AI) will have far-reaching consequences across many industries. From self-driving trucks (Tesla), personal assistants that will manage your schedule (X.ai), to financial management apps that replace the personal accountant (Mint), service professions are some of the first to see widespread automation take hold. 1
Automation offers the possibility of increased cost savings, reliability, and productivity by systematizing repetitive tasks. At the same time, it allows humans to focus on more high-value and complex tasks. As we demonstrate below, automation can also be used to augment human decision making during the design process.
Some predict that one of the last professions to be automated will be that of design, arguing that tasks involving “applying expertise to decision making, planning, and creativity” are far beyond the capabilities of AI technologies today. 2 However, the same report states that 18% of designers’ tasks could be automated by currently demonstrated technology. This raises the question: what specific aspects of that work could be accomplished by an algorithm?
Space planning, such as the layout of desks within offices, is a task that encompasses all of the above complex decision-making activities with varying layers of difficulty. Functional and experiential considerations, building code requirements, and client expectations are all factors that architects must weigh as they design the spaces of a building. This article explores the partial automation of an office layout by automatically placing desks in private offices, as well or better than human designers.
We constrained our study to the discrete problem of desk layouts in private offices rather than attempting to automate the entire space planning process. As such, this study aims to augment the architect’s decision-making process and enable a parallelization of tasks. The algorithm’s ability to layout desks was benchmarked against existing office layouts created by architects at WeWork. We suggest that the methods demonstrated in this article lay the foundations for automation across other aspects of floor layouts and perhaps other building typologies beyond offices.
WeWork
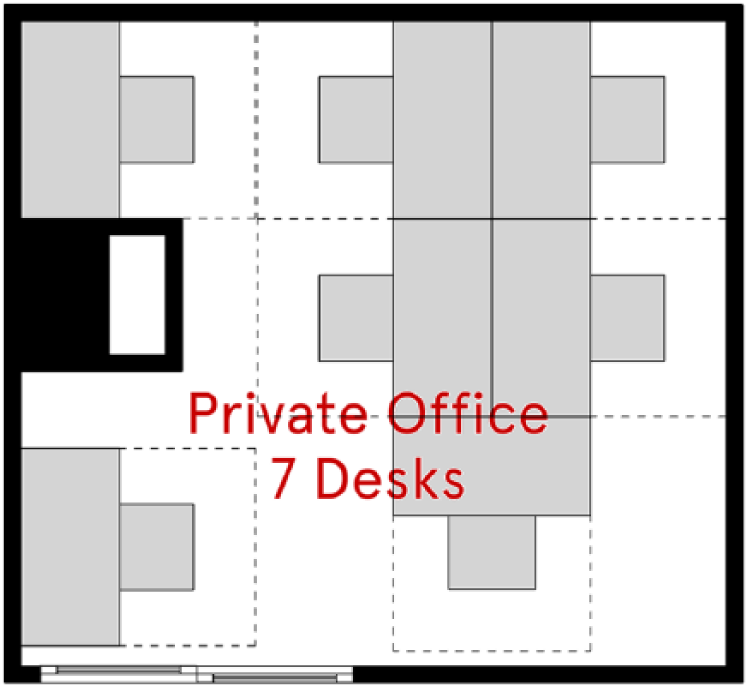
WeWork designs, constructs, operates, and leases offices around the world. In a typical building designed by WeWork, private offices are the main space type (Figure 1).
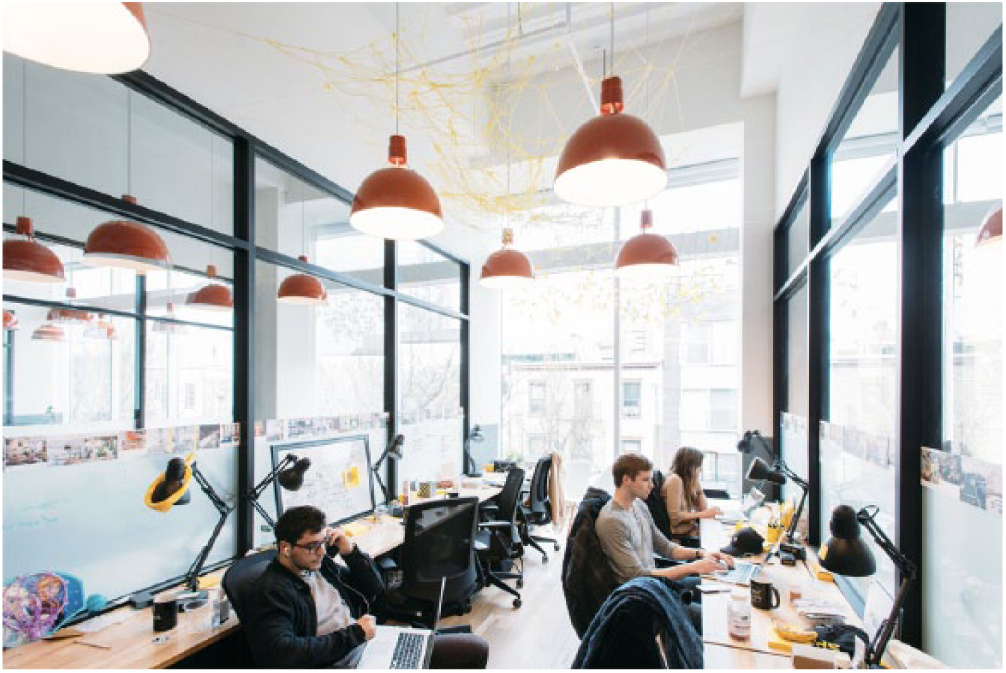
An office in WeWork’s Williamsburg, New York location.
To arrange desks in these spaces is to navigate the dual requirements of creating a satisfactory experience for the people using the office and achieving optimal revenue. Designers need to maximize the number of desks in a space while adhering to a set of space standards that include minimum space requirements per desk. In this article, we measure a layout’s performance as its “efficiency,” which refers to the ratio between desk count and area of the office.
At WeWork, desk layouts are performed manually by architects, using tacit knowledge of what makes an efficient space. For example, designers typically orientate desks along the principle axis of a room because this tends to maximize circulation space, but they also intuitively recognize when the room’s shape or doorways inhibit such a layout strategy. This process is time consuming and tedious as it involves the planning of similar, but not quite identical, offices that follow a consistent design logic. Each office has its own set of unique constraints such as room shape, door location, and columns; a cookie-cutter strategy will not work in this situation (Figure 2). However, its repetitive nature makes it a great candidate for automation, thereby allowing designers to focus on higher-value work. In this article, we focused on the laying out of small- to medium-sized offices (1–20 person), validated against a random sample of 13,211 offices across 120 WeWork locations.
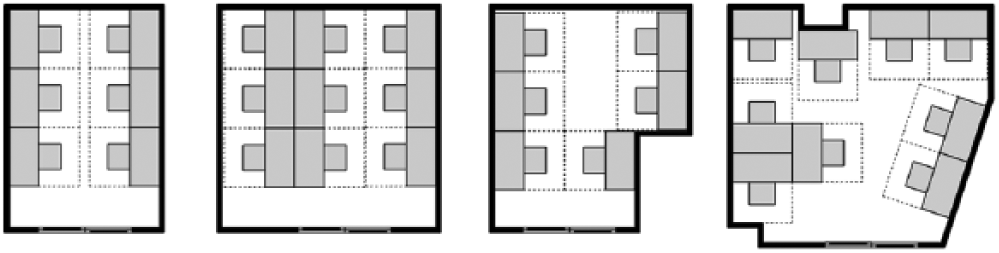
A selection of similar, but not quite identical offices in WeWork’s portfolio.
Related work
Since the early 1960s, there have been a number of algorithms developed for automated space planning. The objectives and scale of these problems have varied widely, from the assignment of activities to sites or campuses, to the location of equipment and personnel groups on a single floor of a building. Furthermore, researchers in this area hail from domains spanning computer science, engineering, and game design, to architects and interior designers.3–7 There are a number of precedents for automated approaches to floor plan layout problems that can loosely be broken down into two categories, search and exploration. Search is a process for locating values of variables in a defined state space while exploration is a process for producing state spaces. 8 A non-exhaustive list of precedents that touch on both follows. Buffa et al.’s 9 “CRAFT” program considered manufacturing facility layouts, optimizing for the cost of transporting products between departments; Flemming and Woodbury’s 10 “SEED” performed early-stage layouts to satisfy constraints of light, privacy, and access; and more recently, Peng et al. 11 developed network design and floor layouts from high-level constraints of travel time, space density, and destinations. Outside of space planning, Keough and Benjamin 12 use search algorithms and evolutionary computation to automate the design of architectural elements.
Our work differs from previous studies in the following ways:
Our research concerns the layout of desks within private offices situated within a larger collaborative workspace, which is a fairly new typology in workplace design. Furthermore, WeWork has explicit design standards that govern the geometry, desk size, chair depth, and other constraints that influence implementation of any automation tool. Unlike the majority of previous automation tools in space planning, our algorithm focuses solely on furniture and office layouts.
Our research involves the optimization of a single criterion, efficiency, that requires the algorithm to either match or beat the efficiency achieved by human designers. To evaluate whether this criterion was met, we benchmarked our algorithm against thousands of layouts from human designers. The typical method of validating an algorithm against other algorithms or a theoretical maximum did not make sense in a business context where we were trying to perform as well as a human designer, thus necessitating our novel approach to the development and benchmarking of the algorithm.
Our research extends the application of search algorithms in architecture using an n-stage constructive procedure approach. 3 Metaheuristics for the algorithm were derived from detailed historical data on office layouts, where we were able to study past patterns and automate a set of “rules of thumb” for making intelligent decisions at each stage of the layout, essentially modeling the thought process of human designers.
Layout algorithms
In this section, we detail the logic of the various implemented algorithms.
Given the boundary polygon of an office, the position of the door(s), and a list of any internal obstacles (such as columns and American with Disabilities Act entryway maneuvering clearance zones), a set of algorithms lays out desks maximizing their number while adhering to our design standard. It is able to handle irregularly shaped offices, difficult edge conditions, and account for columns and other obstacles within the space.
Architects at WeWork tend to begin laying out an office by placing desks along the perimeter of the office facing the walls. Thus, our core algorithms tend to mimic that behavior. The default behavior is to run several simple, related, and computationally cheap algorithms. Then, if the layout density is above some threshold, it will run a more complex and computationally expensive brute force approach. The exact threshold is purely a business decision about the point at which an office is no longer profitable, so would likely vary based on the company using the algorithm. The brute force algorithm is roughly two orders of magnitude slower than the other algorithms but can still calculate a 20 desk layout in less than a second when running on a consumer laptop, which is a task that would typically take a human designer around 2 min. These algorithms are also inherently parallelizable, so a number of rooms can be solved in parallel and shared among multiple cores on a machine or on a cluster of instances (both of which we’ve tested).
Rotation layout algorithm
The first of the algorithms is called the “rotation layout algorithm.” The idea is simple: traverse the edges of the office’s perimeter. If the edge is shorter than the width of a desk, ignore it—a constraint relaxed in some of our other algorithms (see Figure 3). If it is sufficiently long to place a desk, start from one end of the edge and lay down as many desks as possible along that edge.
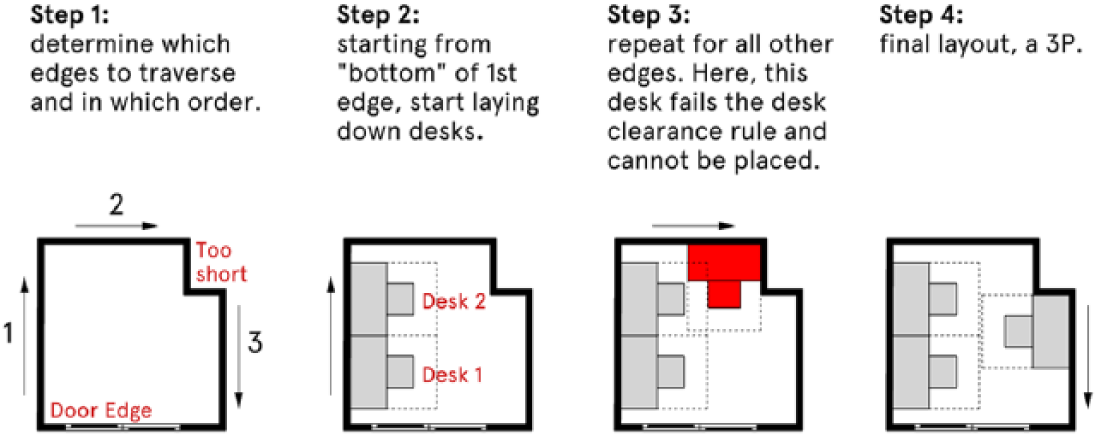
The rotational layout algorithm traverses the edges of the office attempting to lay down desks that adhere to the design standard. Here, it generates a layout for three people.
This algorithm is run three times with the only difference being the order in which the edges are traversed:
Clockwise: start from the edge left of the main door and run clockwise along the perimeter.
Counterclockwise: start from the edge right of the main door and run counter-clockwise along the perimeter.
Sort by length: sort the edges by length and process them from longest to shortest.
Layout constraints
As the algorithm attempts to place desks along the edges, it must satisfy a number of constraints based on our design standard including:
Minimum distance from the desk to door.
Sufficient space around the chair for a person to get in and out of their chair comfortably. We model this is as a desk clearance zone extending from the desk (Figure 4).
Minimum distance from end of desk to other desks (excepting desks in the same bank of desks). This ensures sufficient circulation between groups of desks.
A desk and its clearance zone must not overlap any obstacles.
If a desk placement fails any of these constraints, we slide the desk 1 in (2.5 cm) along the edge and apply the same logic and constraints.
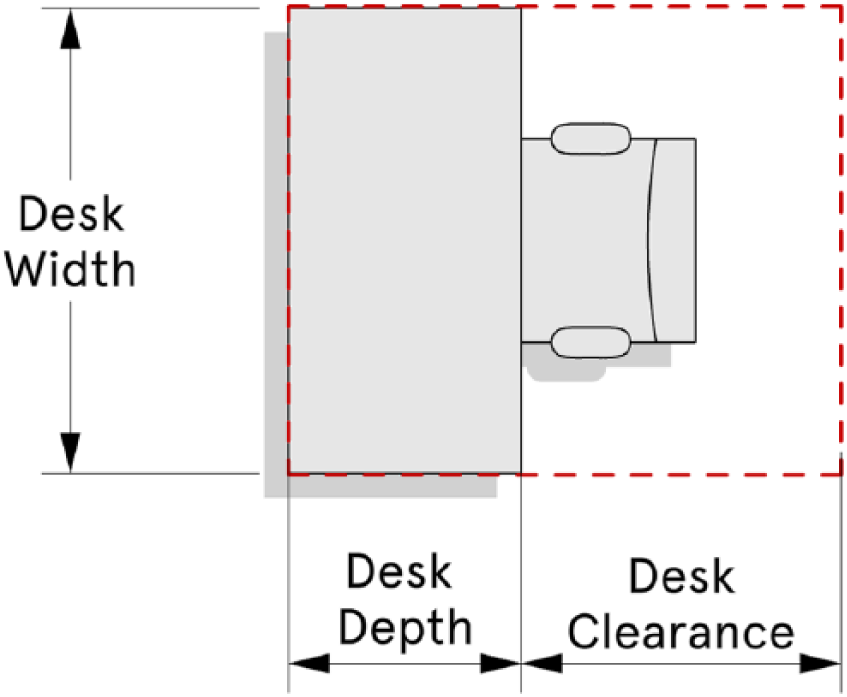
A chair contains a desk clearance zone, sufficient space for the occupant to get in and out of the chair easily.
Left right layout algorithm
The left right layout algorithm is very similar to the rotation algorithm. However, there are two key differences. First, it traverses all the sufficiently long edges to the left of the door edge first and then the edges to the right of the door; left and right are determined by taking a line perpendicular to the door edge, running through its center (see Figure 5). Second, when laying down desks, it always works from the bottom up so that the resulting layout tends to be more symmetrical and closer to how our architects tend to lay out desks.
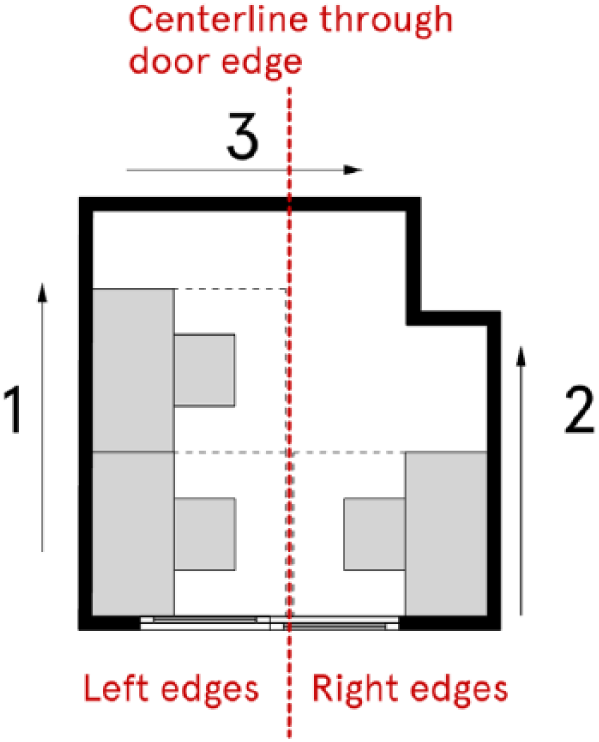
The left right layout algorithm: layout desks left (from bottom) of center line, right (from bottom) of center line, then across the top.
The left right layout algorithm is run twice. The first time we enforce that desks must be completely touching the wall and cannot hang off a short wall such as a mullion. That is, we ignore all walls that are less than desk width long (as described above). However, many of our offices have indentations, columns, and other awkward edge conditions resulting in walls less than desk width length. Consequently, we run the algorithm again but this time we attempt to lay down desks on all edges, irrespective of their length, and we allow a desk to overhang an edge. That is, rather than starting at the bottom of the edge with the desk completely touching the wall, we start with just 1.5 feet (46 cm) of desk touching the wall and we lay down, and slide up desks, not to the other end but until there is 1.5 feet overlapping (Figure 6).
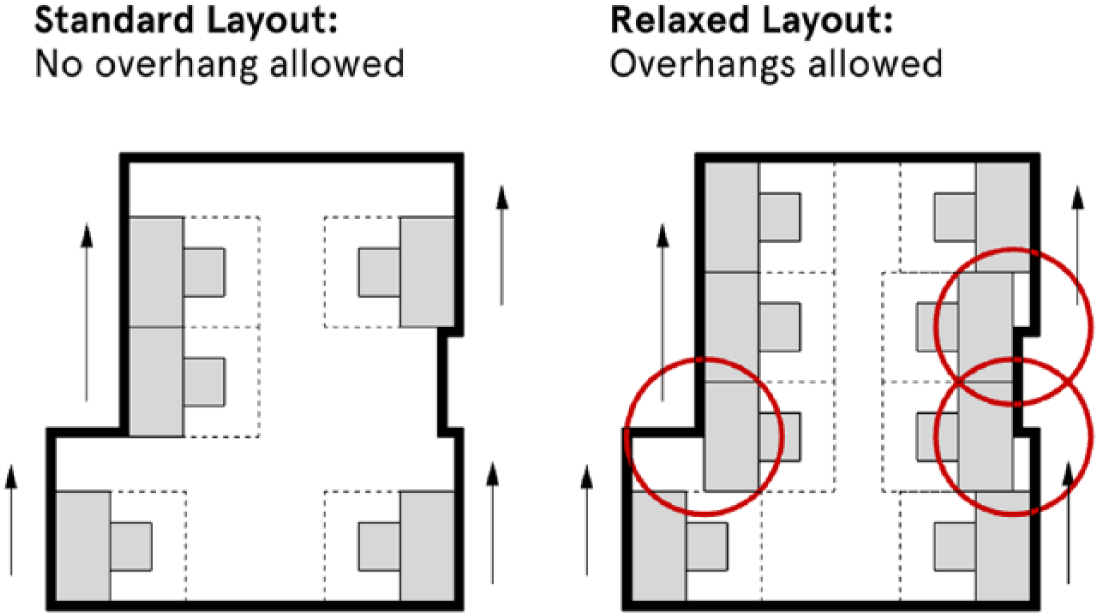
In the standard layout (left), desks may not overhang corners. However, with relaxed rules (right), they may do so (up to 1.5 feet) resulting in greater office capacity.
After all the algorithms have been run, the code determines the highest capacity found.
Brute force layout algorithm
The brute force layout algorithm is roughly two orders of magnitude more computationally expensive and so is only run when the above perimeter-based algorithms do not sufficiently fill the space.
This algorithm assumes that for each edge, desks are either placed in a line facing the wall (FW) or they exist as a set of back-to-back bank of desks extending into the space (Figure 7). There are examples of back-to-back desks in Figure 2.
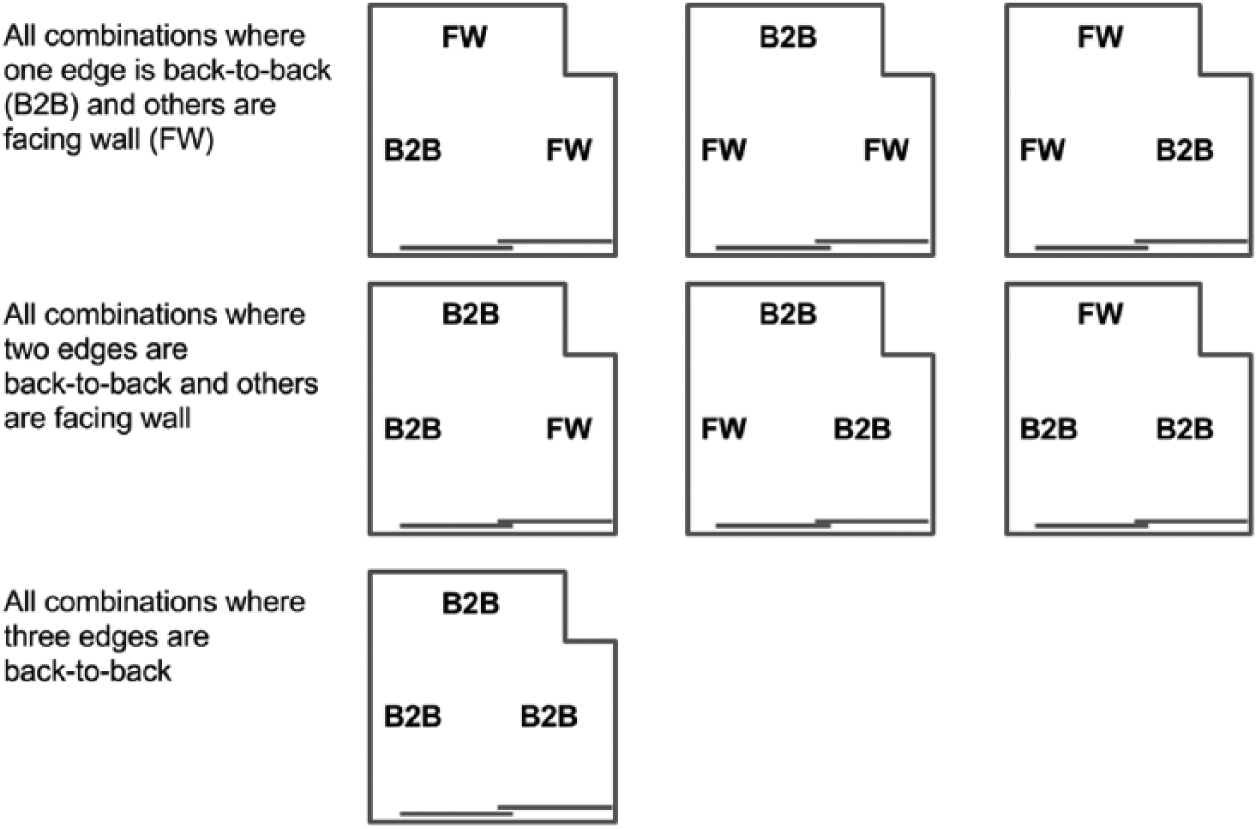
The brute force layout algorithm generates a set of combinations where the desk on an edge either face the wall (FW) or are back-to-back (B2B). The final combination of all FW is covered in the earlier rotation layout algorithm.
The question is which edges should be set as back-to-back? As there are no obvious heuristics, we take a brute force approach, trying all possible combinations with one, two, or three edges designated as back-to-back and the remaining edges wall-facing.
We also try a variant where, for each edge that is longer than desk width, we consider three options: no desks, face wall, and back to back.
The “no desks” option can be useful to allow a bank of desks on other walls to grow. For instance, in Figure 8, the lack of desks on the right and lower walls allows room for a 5-desk bank extending from the top wall which leads to higher capacity than having desks on the right wall.
A wall with no desks (right) can allow a bank of desks (top), plus optional end cap, to occupy the space more efficiently, maximizing desk count.
Unfortunately, having three options per wall leads to a combinatorial explosion in which the number of combinations to try grows very quickly with the number of walls. Thus, we only use this option if the number of walls longer than desk width is 4 or less because 34 = 81, which is manageable, and 35 = 243 which is too many for current computational resources.
In summary, we determine whether we can run the three-option variant. If so, run that set of layouts both clockwise and anti-clockwise. If not, run the standard two-option variant, both clockwise and anti-clockwise.
Growing desk banks and end caps
For each of these combinations in brute force, a rotation layout algorithm is used, either clockwise or counterclockwise, to lay out perimeter desks either facing the wall or setting out back-to-back desks. It then takes each set of back-to-back desks and attempts to grow them toward the center of the space one layer at a time.
As it grows the banks of desks, they must obey all of the layout constraints listed above. An additional constraint is that banks of desks must not be more than 5 desks deep.
Finally, when a bank of desks cannot be grown any more by desks perpendicular to the edge, it will attempt to lay down an additional end cap desk, or rotate any existing single end desks to be an end cap (e.g. Figure 8).
Layout validation
Technical implementation
We obtained a sample of 13,211 WeWork offices. The smallest offices in the sample had space for one person (a single desk) and the largest offices had space for 20 people. All of these offices had been laid out by human designers and goal was for the algorithm to re-layout the offices, matching or producing better efficiencies on 99% of these offices. (The algorithm is only useful as a design tool for our architects if it is reliable and consistent, which is why we set a goal of 99%.) Once the logic of the various algorithms were in place, we began analyzing their performance to see if it met our original targets. Figure 9 shows the initial performance of the algorithm across the sample. Here, we ran the algorithm following the WeWork design standards exactly. Overall, the algorithm performs extremely well on 1–4 person offices, producing desk counts that match or are higher than human designs. However, as the size of the office increases, the algorithm struggles to match the efficiencies produced by our architects. There are diminishing returns as the capacity of offices increases, as most of our current layouts consist of small offices. In all, the algorithm matched the efficiency of the architects 77% and achieved a higher efficiency 6% of the time, while following the design standards.
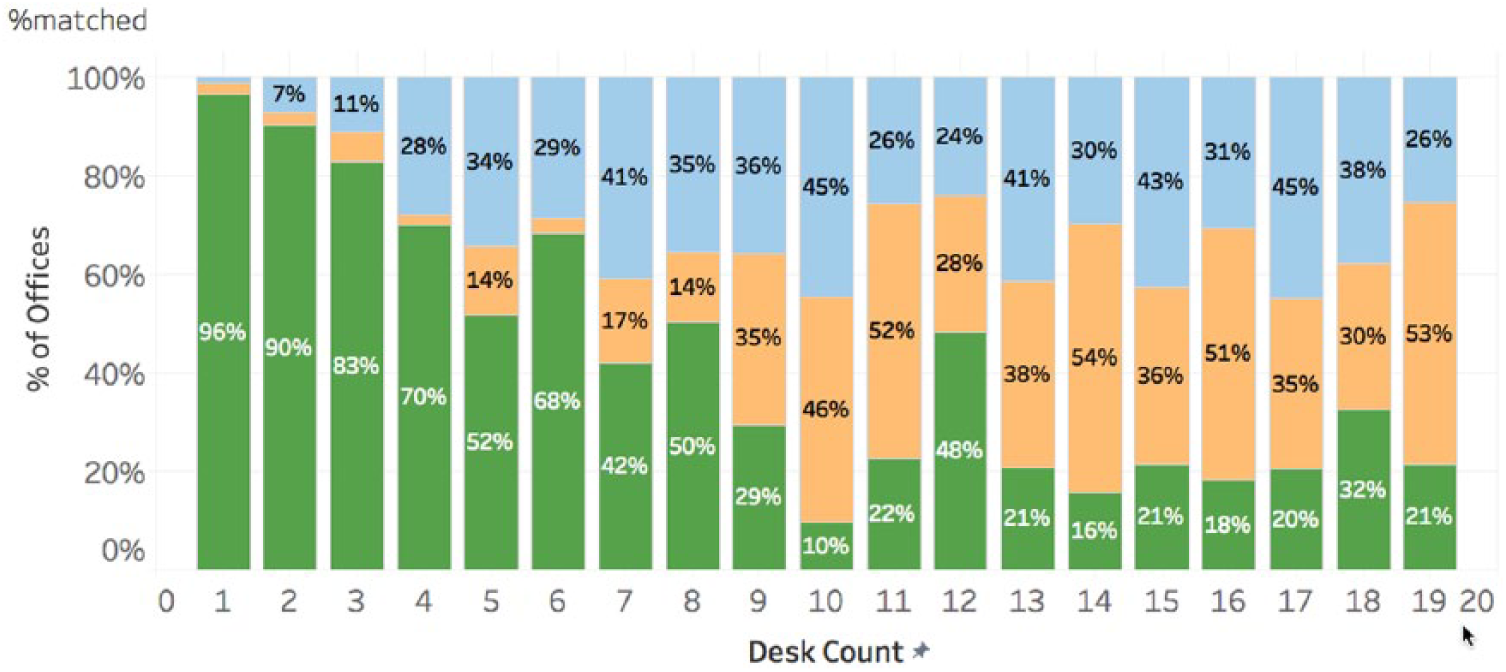
Percentage of offices where the algorithms matched (green; lower), had higher capacity (orange; middle), or lower capacity (blue; upper) than human architects against actual office desk count.
Factors influencing algorithms’ performance
As the performance in the initial results was below our 99% target, we decided to investigate additional factors hindering the algorithm’s performance. Early in the development of the tool, we found that designers tend to break the rules set out in the design standards document. To check the rate at which the design standards were being followed, we studied a random sample of 100 WeWork offices, filtering out offices that had been designed prior to 2016 (as this was when WeWork’s current design standards were first implemented). We noted whether the rules were being followed, and the reason why if they were not. We found that in most cases the rules on desk clearance zones were not being followed strictly. Our designers would allow desks to overlap one or two inches if it meant they could get a few more desks in. The rules were broken 28.4% of the time (95% confidence interval (CI): 18.6%–38.2%).
Bending the rules
We attempted to “bend” the rules ourselves in order to get the match rate closer to the 99% target. We initiated two design standards, one that followed the existing rules and one that relaxed the rules with a desk clearance zone of 2 feet (61 cm). Whenever the algorithm had an efficiency that was lower than existing, we went with the relaxed rules to increase performance. Figure 10 shows the results and indicates that this method increases the performance by +12%, with the algorithm only breaking the rules 17% of the time, which is less than the rate of designers. Overall, we achieved a match rate of 97%, with significant improvements across larger offices.
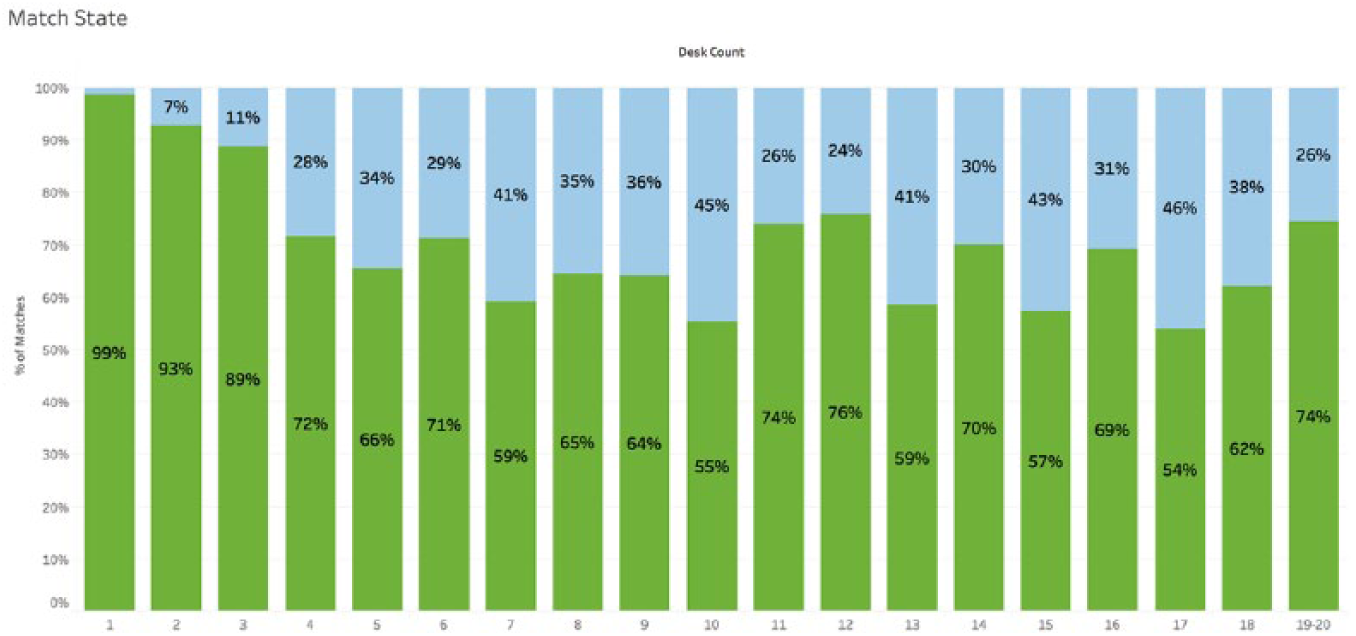
Using relaxed rules, percentage of offices where the algorithms matched or had higher capacity (green; lower) and lower capacity (blue; upper) than human architects against actual office desk count.
Algorithmic logic and usage
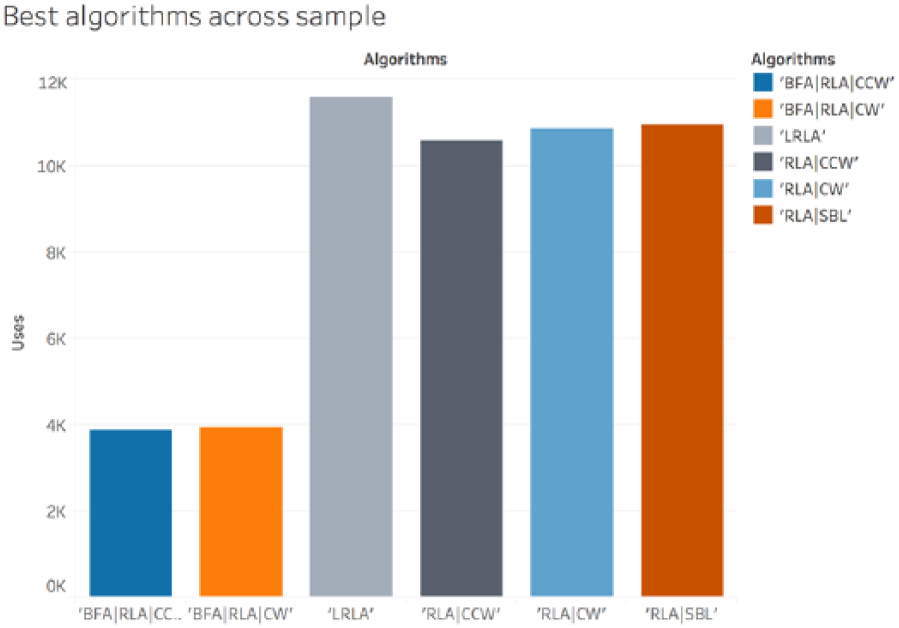
The office layout algorithm has six different sub-algorithms it uses to layout desks in an office. For the most part, they are relatively simple and somewhat related. In order to understand what algorithms/logic performed the best across the sample, we recorded the algorithms that had the best efficiency at each run. Figure 11 shows the frequency at which each algorithm had the highest desk count. The left right layout algorithm performed the best; however, this could be a reflection of the distribution of office sizes as the Left to Right performs best on small (1–8 person) offices. Figure 12 shows how the algorithms performed over various office sizes. The two variations of the brute force algorithm perform best on >8 person offices.
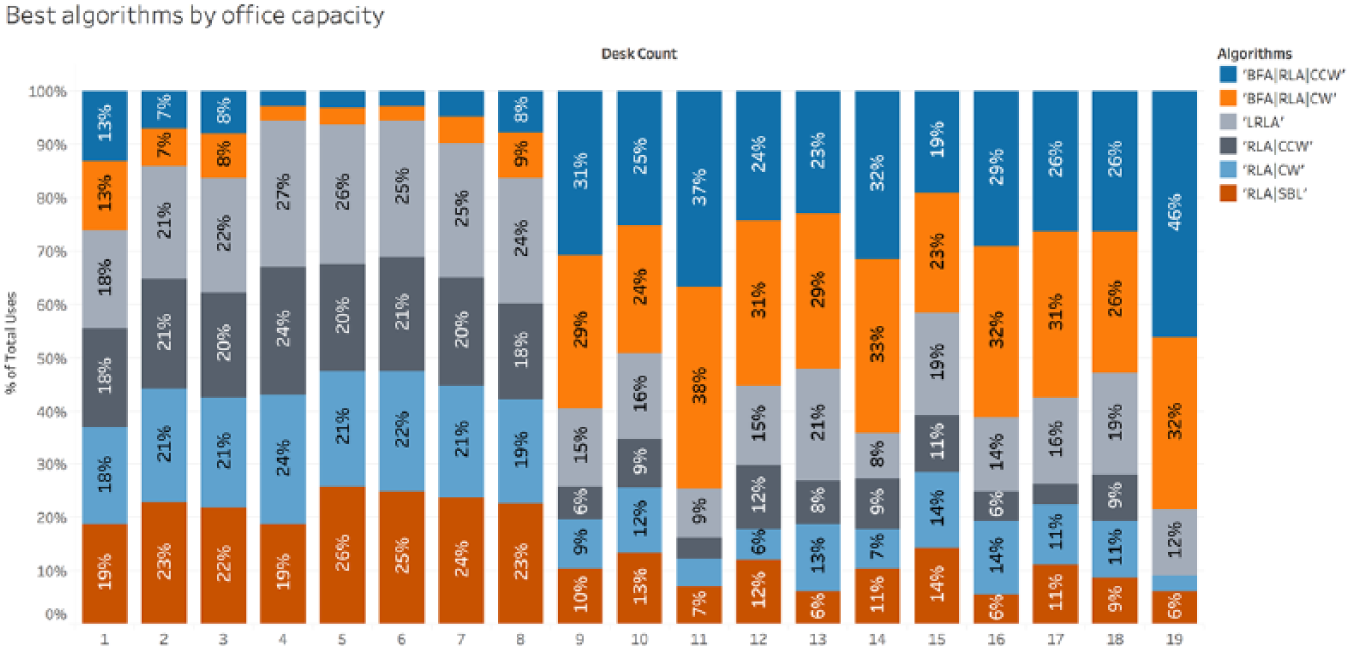
Percentage each algorithm achieved the highest desk count against actual office capacity. BFA: brute force algorithm; RLA: rotation layout algorithm; LRA: left right algorithm; SBL: sort by length; (C)CW: (counter) clockwise.
The relative performance of the algorithms.
Interaction and interface
Technical implementation
For the office layout algorithm to be of practical use, it had to be made easily accessible to architects and designers, and integrated into existing workflows as seamlessly as possible.
Several possible paradigms exist for injecting new, specialist software tools into an existing workflow. Some of the most popular include the following:
In-platform plug-ins that interface directly with the design software’s geometry libraries and APIs (e.g. ElumTools).
Stand-alone desktop software with file-based import/export (e.g. MassMotion Flow).
Web-based APIs performing calculation on a server and interacting with a lightweight platform-integrated interface.
We opted for the third of these options. The layout algorithm itself was implemented in Python, leveraging the Shapely geometry library, and hosted on a server with a REST API served by the Flask web framework. This approach permitted interaction with the layout algorithm from multiple platforms during development and user testing and allows future platform integrations with limited additional effort.
The primary design and documentation platform in use by designers at WeWork is Autodesk Revit, a popular BIM package. Our initial designer-facing prototype client for the layout API was therefore built as a Revit add-in. At the time of this writing, we have just begun user testing this add-in. Designers at WeWork are attempting to utilize this tool in their workflows.
User interaction in Revit
The Revit interface to the desk layout algorithm allows a user to lay out desks automatically in multiple offices simultaneously and choose from among a number of algorithmically generated options. In cases where the generated solution is acceptable, no further work is required; however, in practice, a designer may desire to tweak or adjust the resulting layouts. Even in this case, the algorithm is likely to save time by automatically introducing the proper model elements and producing a rough count of the possible desks that the office can support.
The mechanism for interacting with the algorithm in Revit is as follows:
The user selects a room or a series of rooms, typically in a two-dimensional (2D) plan view.
The user initiates either the “Desk Automation” command or the “Desk Automation Advanced” command, which enables more detailed specification of solution parameters, like desk sizes and required clearances.
For each selected room, the user is presented with a graphical preview of the unique layouts generated by the algorithm (see Figure 13).
The user selects one option for each room and confirms completion.
The specified layouts are then implemented in the Revit model: “Family” model elements representing both a desk and a chair are automatically placed according to the positions and orientations returned by the API.
If necessary, a user may then proceed to adjust and finesse the generated layouts as they would any other Revit model content.
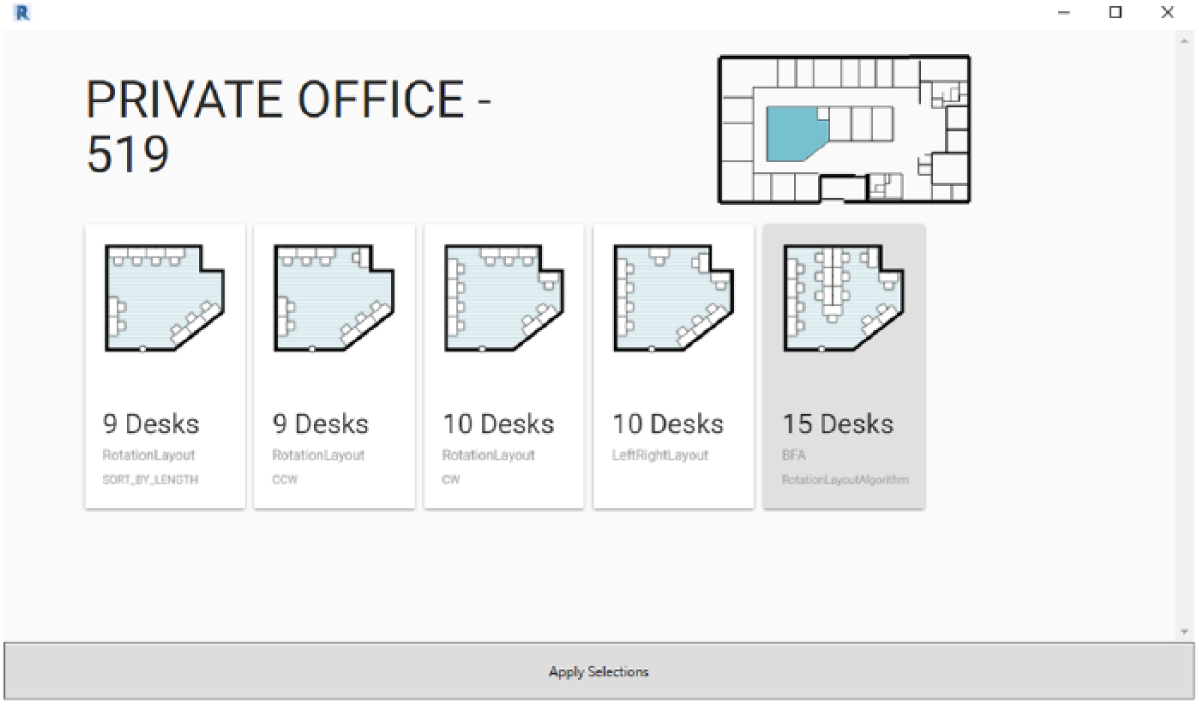
A screenshot of the layout selection interface, showing a key plan locating the room, and the algorithm’s unique layout options for one room, labeled with their desk counts.
The augmented interface
As procedural design tools—which make consequential design and layout decisions on behalf of a designer—become more commonplace in design workflows, we believe that certain best practice guidelines should be followed in order to create a productive and flexible design environment. Together, these guidelines privilege “augmented” interfaces, as opposed to those that are fully autonomous, automated, or automatic. In our opinion, an augmented interface should
Present a number of options to a designer, in any case where there is not a single, well-defined optimum (such as most categories of design problems).
Be transparent about the algorithms and procedures at work, wherever possible, by providing and linking to open, human-readable documentation.
Enable manual overrides of both input parameters and design outputs.
Together, these guidelines leave ultimate agency and decision-making in the hands of experienced designers, while augmenting their capabilities with faster iteration.
Conclusion
A procedural mechanism for laying out desks in office spaces has been proposed in this article as a means to streamline and accelerate the design process of office spaces such as those WeWork provides to members. This represents a useful step in both the algorithmic techniques for procedural/autonomous layouts and the development of infrastructure and designer-facing interfaces for those algorithms. By leveraging the vast amounts of existing building design data available to WeWork, we are able to perform validation studies comparing algorithmic performance to human designers. These studies indicate that our algorithm succeeds in 83% of cases at the task of packing the maximum possible desks in a given office polygon while complying with code- and company-dictated standards. The introduction of these tools into designers’ workflows stands to make them faster, more efficient, permit more cycles of iteration, and improve the overall efficiency of desks per square foot in layouts.
In future work, we propose several developments that will further validate the success of this approach and improve its functioning:
Through observational studies, evaluate the impact of the introduction of this procedural tool into designer workflows, to understand its effect on both speed and quality of design iterations.
Introduce a “lookup” mechanism for recognizing established past best solutions from user input rather than calculating them anew each time.
Introduce a mechanism to record the history of designer choice from among the provided layout options, allowing the algorithm to evaluate which option is most likely to be selected.
Discussion
Architects have long sought to automate various aspects of the design process—from automated construction drawings to environmental analysis and batch rendering techniques. Although automation has been tested in the field for a long time, we believe that we remain at the infancy of its potential. If we compare automation in architecture to its evolution in the automotive industry, then this study could be viewed as a sort of early “cruise control” for designers: assisting the “driver,” (the architect) in her decision making, but a long way from full automation.
Even partial automation allows a greater parallelization of designer tasks. Instead of focusing on one project for a full week, an architect augmented with algorithmic tools might tackle two projects simultaneously in a week, thus scaling output without necessarily increasing workload. These algorithms also offer the potential to improve the quality of design decisions according to specific metrics, such as the efficiency of desk layouts described in this article.
We believe that automated design tools are well suited for further development with machine learning techniques. As our previous research has shown, 13 it is possible to have a machine learn complex design patterns for the evaluation of design, and now potentially for the laying out of furniture. However, using algorithms to layout and evaluate designs requires vast amounts of data with which to train models: a resource unavailable to many architects. Firms do not often treat their collective work as queryable data, and typical contractual models in the architecture, engineering, and construction industry rarely permit the design team to monitor or evaluate post-construction design performance. This is why we believe this type of research is currently best suited to certain architectural types, such as retail, offices, and healthcare: spaces where the designs are consistent, the success metrics clear, and the layouts somewhat repeatable.
Footnotes
Acknowledgements
We would like to thank members of WeWork’s Research and BIM teams, especially Josh Emig, Tyson Cadorette, Libo Li, Gui Talarico, Corey Green, and Nathan Lowe.
Declaration of conflicting interests
The author(s) declared no potential conflicts of interest with respect to the research, authorship, and/or publication of this article.
Funding
The author(s) disclosed receipt of the following financial support for the research, authorship, and/or publication of this article: This research was funded by WeWork Companies Inc.