
Abstract
This research aims to develop a novel domestic abuse risk assessment tool, called Lizzy, for predicting the repeat victimisation of German female victims of physical intimate partner violence. Our approach includes actuarial and machine learning techniques based on data from a longitudinal online survey with a nationally representative sample of 3878 respondents (July to November 2023). Four algorithms were employed: CatBoost, XGBoost, Logistic Regression, and Random Forest. Logistic regression performed best with an accuracy of 0.82 and Area Under the Curve of 0.85. We find that predictors covering multiple dimensions of abuse, including physical abuse as well as economic, digital, and emotional abuse, contribute to model performance.
Introduction
Intimate partner violence (IPV) is categorised by the World Health Organisation (WHO) as a ‘major public health problem’, as globally, 27% of women aged 15–49 have experienced IPV at least once in their lifetime (WHO, 2024). Its severity is evident from 38% of global femicides being committed by intimate partners. The lifetime prevalence of physical and/or sexual IPV amongst women in Europe is ∼22%, with Germany being close to the EU average at 21% (OECD, 2017; WHO, 2024). In Germany, cases rose by 39% from 120,758 in 2012, when data on IPV were first officially collected, to 167,865 in 2023 (BKA, 2024). Reflecting global rates, most victims in Germany are female (around 80%) (Trafford and Le, 2024; WHO, 2024), with 132,966 women (79.2%) reporting IPV to the police in Germany during 2023 (BKA, 2024).
Structured risk assessments have been developed as tools to help improve criminal justice responses to domestic abuse (DA) (Myhill et al., 2023; Robinson, 2011). Using a question-and-answer format, victim responses to risk assessments can help safeguard survivors from re-victimisation, determine appropriate interventions and enable resource prioritisation. The development of tools to predict future IPV, including recidivism and lethality, has grown extensively over the last two decades following a growth in predictive policing. Recently, Van der Put et al. (2019) identified over 39 DA risk assessment tools in their review. Replacing or supporting practitioner judgement, they are intended to work as a standard measurement for determining the risk of future and current harm to victims and have come to be relied on internationally in responding to IPV (EIGE, 2019). Their primary utility in violence reduction lies in identifying cases with an elevated risk of harm to the victim and aligning interventions with the assessed risk level to mitigate further harm (Lauria, 2020). This makes it crucial to ensure accurate and reliable risk measurements for recidivism to protect victims from future and potentially lethal consequences (Graham et al., 2021; Van der Put et al., 2019). That being said, researchers believe that the evolution of accurate DA risk assessment tools is still in its ‘infancy’ (Van der Put et al., 2019).
Despite the widespread use of risk assessment tools, evidence of their effectiveness in reducing or preventing violence is mixed, often due to methodological limitations. In a systematic review, Viljoen et al. (2018) noted common issues in intervention studies, including sample representativeness, lack of comparison groups, and adherence to protocols. However, there is evidence that risk assessments can reduce violence, particularly when they go beyond simple risk prediction to inform evidence-based interventions. For example, a study in Rheinland-Pfalz, Germany, conducted by Weis et al. (2016) used a parallel group design to test a new IPV risk management procedure with tools including Ontario Domestic Assault Risk Assessment (ODARA) (an actuarial tool that calculates risk based on information available in police records with a follow-up period of five years) (Hilton et al., 2004) and Danger Assessment (a structured professional tool administered to victims with a follow-up period of one year) (Campbell, 1986), and multiagency risk assessment conferences (Weis et al., 2016). Across three police forces, the treatment group saw a total reduction in recidivism, dropping from 42% to 20% over one year, demonstrating the potential of comprehensive risk management strategies to reduce reoffending.
This study seeks to develop a novel DA risk assessment tool called Lizzy by utilising machine learning techniques to predict victimisation amongst female victims of physical IPV in the German context. The tool is based on data from a nationally representative longitudinal online survey, which included physical and non-physical predictors of IPV.
Literature review
Types of DA risk assessments
DA risk assessment tools can generally be categorised into three major types, distinguished by the methods used to weigh and combine information to generate a risk output (Kebbell, 2019). Unstructured clinical judgement or ‘“gut” approaches’ (Kebbell, 2019: 4) rely on the professional's training and experience, and tend to be less reliable and accurate compared to actuarial tools (Seewald et al., 2017). Actuarial approaches like ODARA rely on statistical models to identify risk factors and apply standardised, weighted risk items to assess the likelihood of repeat or severe IPV (Hilton, 2021). Structured professional judgement approaches like the Spousal Assault Risk Assessment combine these two approaches (Kropp, 2008). They guide professionals in evaluating risk factors based on predefined criteria, while also allowing for clinical discretion in individual cases. Germany's approach to DA risk assessment is defined by a patchwork of methods, including ODARA and Danger Assessment, along with local adaptations and adjustments derived from these tools, as well as other regionally developed structured professional instruments (Weißer Ring, 2021).
Evaluation metrics for DA risk assessments
To compare and validate risk assessments, the Receiver Operating Characteristic Area Under the Curve (AUC) has been used as the most important measurement of efficacy due to the metric's reliability. This reliability stems from its resistance to changes across base rates, selection ratios and truncated distribution (Messing, 2019; Rice and Harris, 2005; Swets et al., 2000; Van der Put et al., 2019). Generally, values between 0.556 and 0.639 represent a small effect size, while values between 0.639 and 0.714 represent a moderate effect size, and values > 0.714 have a large effect size (Van der Put et al., 2019). Others have proposed more stringent criteria, suggesting that AUC scores below 0.7 are poor and can be considered no better than chance (Lamb et al., 2022). Van Der Put et al. (2019) found that most risk assessments used in the context of IPV had a small-to-average effect. Their extensive review of 39 predictive risk assessment tools produced an average AUC score of 0.643. When adjusted to account for missing effect sizes, the average AUC fell to 0.599. Messing and Thaller (2013) similarly found that risk assessments (weighted by sample size) had a small effect size, ranging from 0.537 to 0.628. ODARA was the exception, with a 0.67 chance of correctly identifying recidivism. Still, the moderate predictive accuracy of these scores demonstrates that the efficacy of these tools remains low.
Solely relying on AUC as a measure of the predictive ability of risk assessment tools is, however, not recommended as it might mask variations in performance at specific thresholds (Lobo et al., 2008). To analyse the diagnostic performance of a risk assessment tool, Dhamnetiya et al. (2022) recommend considering additional metrics such as sensitivity (true positive rate/precision) and specificity (true negative rate). Sensitivity measures how often a test correctly predicts re-victimisation, while specificity measures how often a test correctly predicts that victims will not re-experience IPV. For instance, while having an AUC of 0.628 for predicting severe violence, the Danger Assessment reported sensitivity values of 0.494–0.921, specificity values of 0.201–0.666 and positive predictive values of 0.255–0.306 (Roehl et al., 2005). This indicates that while the Danger Assessment tool has a moderate AUC score, it struggles with specificity and positive predictive power, showing a tendency to produce ‘too many false positives’ in its predictions (Lamb et al., 2022). Moreover, research has repeatedly found that victims’ self-assessments are capable of outperforming the predictive power of DV-specific tools (Roehl et al., 2005; Van der Put et al., 2019).
It is also essential to report the models’ performance in different development phases (training, validation, testing) to give users a sense of the risk of overfitting (Seghier, 2022). Overfitting occurs when an algorithm fits too closely to the data it was trained on – that is, it replicates the noise and random fluctuations in the training data instead of deriving a pattern. The result is an algorithm that cannot make accurate predictions when deployed on new data as it fits the training data too well. Ideally, minor variations will occur between the models performance values across development phases. López-Ossorio et al. (2016) tested the predictive validity of the Police Risk Assessment (VPR – Valoración Policial del Riesgo), used by Spanish police forces to screen IPV cases as part of the Comprehensive Monitoring System for Cases of Gender Violence (VioGén), across different stages of development. They found the models’ AUC scores to be 0.71 within a follow-up period of three months, while during its fourth iteration, the authors reported an AUC score of 0.63 for VPR. Whilst this change indicates a risk of overfitting, the size of this risk is difficult to estimate.
Data sources for DA risk assessments
Although sample sizes for constructing and validating actuarial risk assessments have increased, they remain relatively small. Messing and Thaller's (2013) reported sample sizes for five different risk assessments varied between 56 and 1465. By the time of van der Put's (2019) study, sample sizes had expanded to between 26 and 29,317 participants. Yet, only ten of the 39 risk assessment tools included in the review were tested at least once with a sample larger than 1000 participants. While only five IPV tools included in the review had at least one study with sample sizes exceeding 2000 participants and none of these tools are widely used (Fitzgerald and Graham, 2016; Mason and Roberta, 2009; Stansfield and Williams, 2014; Williams, 2012).
Additionally, most risk assessment tools have been developed using criminal justice samples. Euser et al. note that retrospective designs can be a cost-effective and ‘a time-efficient and elegant way of answering new questions with existing data, but one has no choice other than to work with what has been measured in the past, often for another purpose … than the one under investigation’ (Euser et al., 2009: c216). Using historical crime data, which can be biased and/or incomplete, can lead tools trained on this data to ‘reproduce and entrench existing discriminatory practices’ (EFRA, 2022: 36). In their reanalysis of civilian–police encounters, Knox et al. (2020) found that traditional estimates tend to underestimate racial bias significantly, ‘a naive analysis that assumes no race-based selection into the data suggests only 10,000 black and Hispanic civilians were handcuffed because of racial bias in New York City between 2003 and 2013, we estimate that the true number is approximately 56,000’ (Knox et al., 2020: 620).
The possibility for replication of discrimination, and particularly racial bias, is clear from López-Ossorio et al.'s (2019) study which used historical police records from over 6613 IPV cases to validate VioGén's DA risk assessment tools. The dataset showed a high overrepresentation of several groups, including Romanian victims, who constituted 5.4% of the cases despite representing only 1.3% of the population (López-Ossorio et al., 2019; Statista, n.d.). As such, historical police data does not necessarily provide the most reliable basis for developing risk assessment tools. In fact, government agencies often conduct victimisation surveys, which poll a random sample of the population about their experiences of crime and violence to estimate the ‘real’ prevalence and extent of a crime. This is because official data sources, such as law enforcement data, can provide an unrepresentative sample of IPV victims and crime types, as most IPV is unreported (Tjaden and Thoennes, 2000). Consequently, this research utilises a national sample to determine victimisation rates across Germany.
Using policing data derived from arrests to build risk assessments also poses other challenges for risk assessments, which are intended for use in alternative settings. Trafford and Le's (2024) analysis of a nationally representative sample of IPV victims in Germany pointed to sociodemographic differences between IPV victims across the various types of support services approached. This suggests that respondents who seek support from the police may differ from respondents who consult other services. Thus, the reliability and validity of a DA risk assessment tool trained solely on respondents likely to interact with the police may not necessarily be upheld in non-police settings, such as health or consulting environments.
In terms of research design, most DA risk assessment tools such as ODARA, the VioGén risk assessment tools and B-SAFER, rely on historical data (López-Ossorio et al., 2019; Van der Put et al., 2019). In contrast, prospective designs, while more resource-intensive, allow for more precise and flexible data collection by observing risk factors in real time, which offers a more reliable approach to understanding recidivism (Euser et al., 2009). Rather than relying on historical data and associations, which might suffer from biases and recall errors, researchers can track how different risk factors impact recidivism over time.
Follow-up periods for DA risk assessments
It is essential to consider the follow-up period length for risk assessment tools because this defines the timeframe over which it is effective. Douglas and Skeem (2005: 370) note that ‘…most time intervals will risk missing fluctuations that occur in between assessments. The longer the interval between assessments, the greater the risk that changes will be missed. If changes are missed, the validity of measurement is threatened’. Therefore, longer follow-up periods spanning numerous years can present significant challenges for targeted intervention and prevention strategies. Where perpetrators are tracked for up to five years, such as in the sample used to construct ODARA (Hilton et al., 2004), the tool can predict the likelihood of physical abuse occurring over a five-year period. Yet, predictions across multiple years can be impractical for developing effective risk management strategies by emergency workers who seek to intervene with victims across short timeframes. Comparatively, shorter follow-up times, such as the one-year follow-up period used to develop the Danger Assessment (Campbell, 1986), allows for closer monitoring and more immediate and actionable insights across time periods that are more reflective of professional intervention. Despite the difficulties with longer follow-up periods for implementing tools in practice, Graham et al. (2021) found that 14/26 tools analysed did not record a follow-up period. This included B-SAFER, which makes it difficult to gauge the period over which predictions are effective (Kropp, 2008). Furthermore, 5/26 tools had a follow-up time of more than one year, with follow-up times ranging up to eight years.
Consequently, the literature suggests that risk assessment tools often have limited predictive validity in practice. This is despite the enhanced focus and reliance upon risk assessments over the past decade (Messing and Thaller, 2013; Van der Put et al., 2019). Whilst the predictive accuracy of current risk assessments might be ‘sufficient to justify their use … in both high-risk and general populations’, it is essential that the validity and reliability of these tools are improved (Van der Put et al., 2019: 113). Increasing the accuracy with which IPV is predicted can enhance targeted intervention and prevention, but it requires a greater investment of ‘time, money, and resources’ (Van der Put et al., 2019: 113).
AI advancements in DA risk assessments
Advancements in AI and predictive technology have heralded a new era for risk assessments to become increasingly sophisticated. Using historical data, several researchers have begun to demonstrate the potential use of AI to create models with significantly higher accuracy scores. For example, Turner et al. (2022) utilised information gathered using the DASH questionnaire, alongside incident descriptors, IPV history, personal and geographical demographics, and criminal and victimisation history to create a logistic regression model with an AUC of 0.748 for IPV recidivism, compared to an AUC of 0.567 based purely on DASH risk grading. Garcia-Vergara et al. (2023) have also utilised natural language processing to construct a dataset of relevant IPV cases and employed a random forest classifier that achieved an average accuracy of 81.14%. While Quijano-Sánchez et al. (2021) enhanced the VioGén model, achieving an accuracy of 81.26% through the application of machine learning techniques. Thus, while the application of AI and machine learning to the development of risk assessments remains sparse in the sphere of DA, these results suggest it is a promising area for development (Hui et al., 2023).
Aim
This research seeks to build upon previous studies by utilising a nationally representative sample of victims in Germany to develop a risk assessment tool which utilises AI to predict the likelihood of future physical abuse within the next three months, given previous physical emotional, financial and digital abuse by an intimate partner/ex-partner. Sexual abuse was not included in the study due to its higher potential to inhibit disclosure of abuse, which may stem from the sensitive nature of this form of abuse and shame experienced by victims (Felson and Paré, 2005; Hassanpour et al., 2025). While the harmful consequences of non-physical abuse are well-documented, German law only recognises physical forms of IPV. The vast majority of IPV cases are prosecuted under provisions related to bodily harm (§ 223 of the German Criminal Code – StGB), dangerous bodily harm (§ 224 StGB), grievous bodily harm (§ 226 StGB), as well as murder and manslaughter (§§ 211, 212 StGB). In contrast, less than one in five IPV cases involve charges related to stalking (§ 238 StGB), coercion (§ 240 StGB), or threats (§ 241 StGB), highlighting the relative neglect of non-physical forms of abuse in legal proceedings. As such, this study focuses on predicting physical abuse. This study is unlikely to be affected by professional intervention as a confounding factor because data collection included victims who had and had not been in contact with public authorities.
Methods
Study design and setting
To build a novel IPV risk assessment tool for the German context called Lizzy, we designed a longitudinal study with a three-month follow-up period based on a nationally representative German sample of 3878 respondents. The first survey was administered over two and a half weeks from 12th to 31st July 2023 (hereafter referred to as Wave 1) to create a nationally representative sample of 7400. Having limited the sample to female victims of abuse, this provided a sample of 1400 respondents in Wave 1. Respondents who disclosed having experienced any abuse at least once in the past year were recontacted after three months between 12 October and 12 November 2023 (hereafter referred to as Wave 2). The re-contact rate was high at 76%, resulting in 1065 participants. This is in line with the retention rates reported by other studies on IPV (Devries et al., 2013; Whitton et al., 2019). Overall, this provided us with a sample of 3878 female victims who had experienced abuse in the past year and responded to the second survey, three months later. The sample size reflected our estimated figure of 1000 victims, based on previous research indicating that one in four female Germans experience abuse by a partner at least once in their lifetime (Schröttle and Müller, 2004).
The survey was introduced to respondents with the following text: ‘This survey addresses the topic of unhealthy behaviours in romantic relationships. Even if you have not experienced unhealthy behaviours in your current or previous relationships, answering these questions will help create a broader understanding of relationship behaviours. Please be assured that we will treat your data confidentially. We will only evaluate your answers anonymously’. At the end of the survey, respondents were signposted to the relevant services. The study's design was built with expert and practitioner feedback and based on an extensive literature review. To reduce the risk of self-selection bias, the survey was framed around unhealthy behaviours in intimate relationships rather than explicitly focusing on intimate partner violence.
The survey respondents were recruited from YouGov's German online panel using nonprobability sampling. Panellists were recruited through various sources such as social media advertising, and they voluntarily join YouGov's online panel, providing demographic information to enable targeted sampling. To ensure national demographic representation, YouGov applied post-stratification weighting with quotas derived from the national microcensus of the German Federal Statistics Office. Participants are incentivised with reward points that can be exchanged for donations to a charity of their choice or credits for a gift card worth approximately €1.11 for completing this 20-min survey. Response quality was monitored through various checks (e.g., response patterns, speeding) to ensure data reliability.
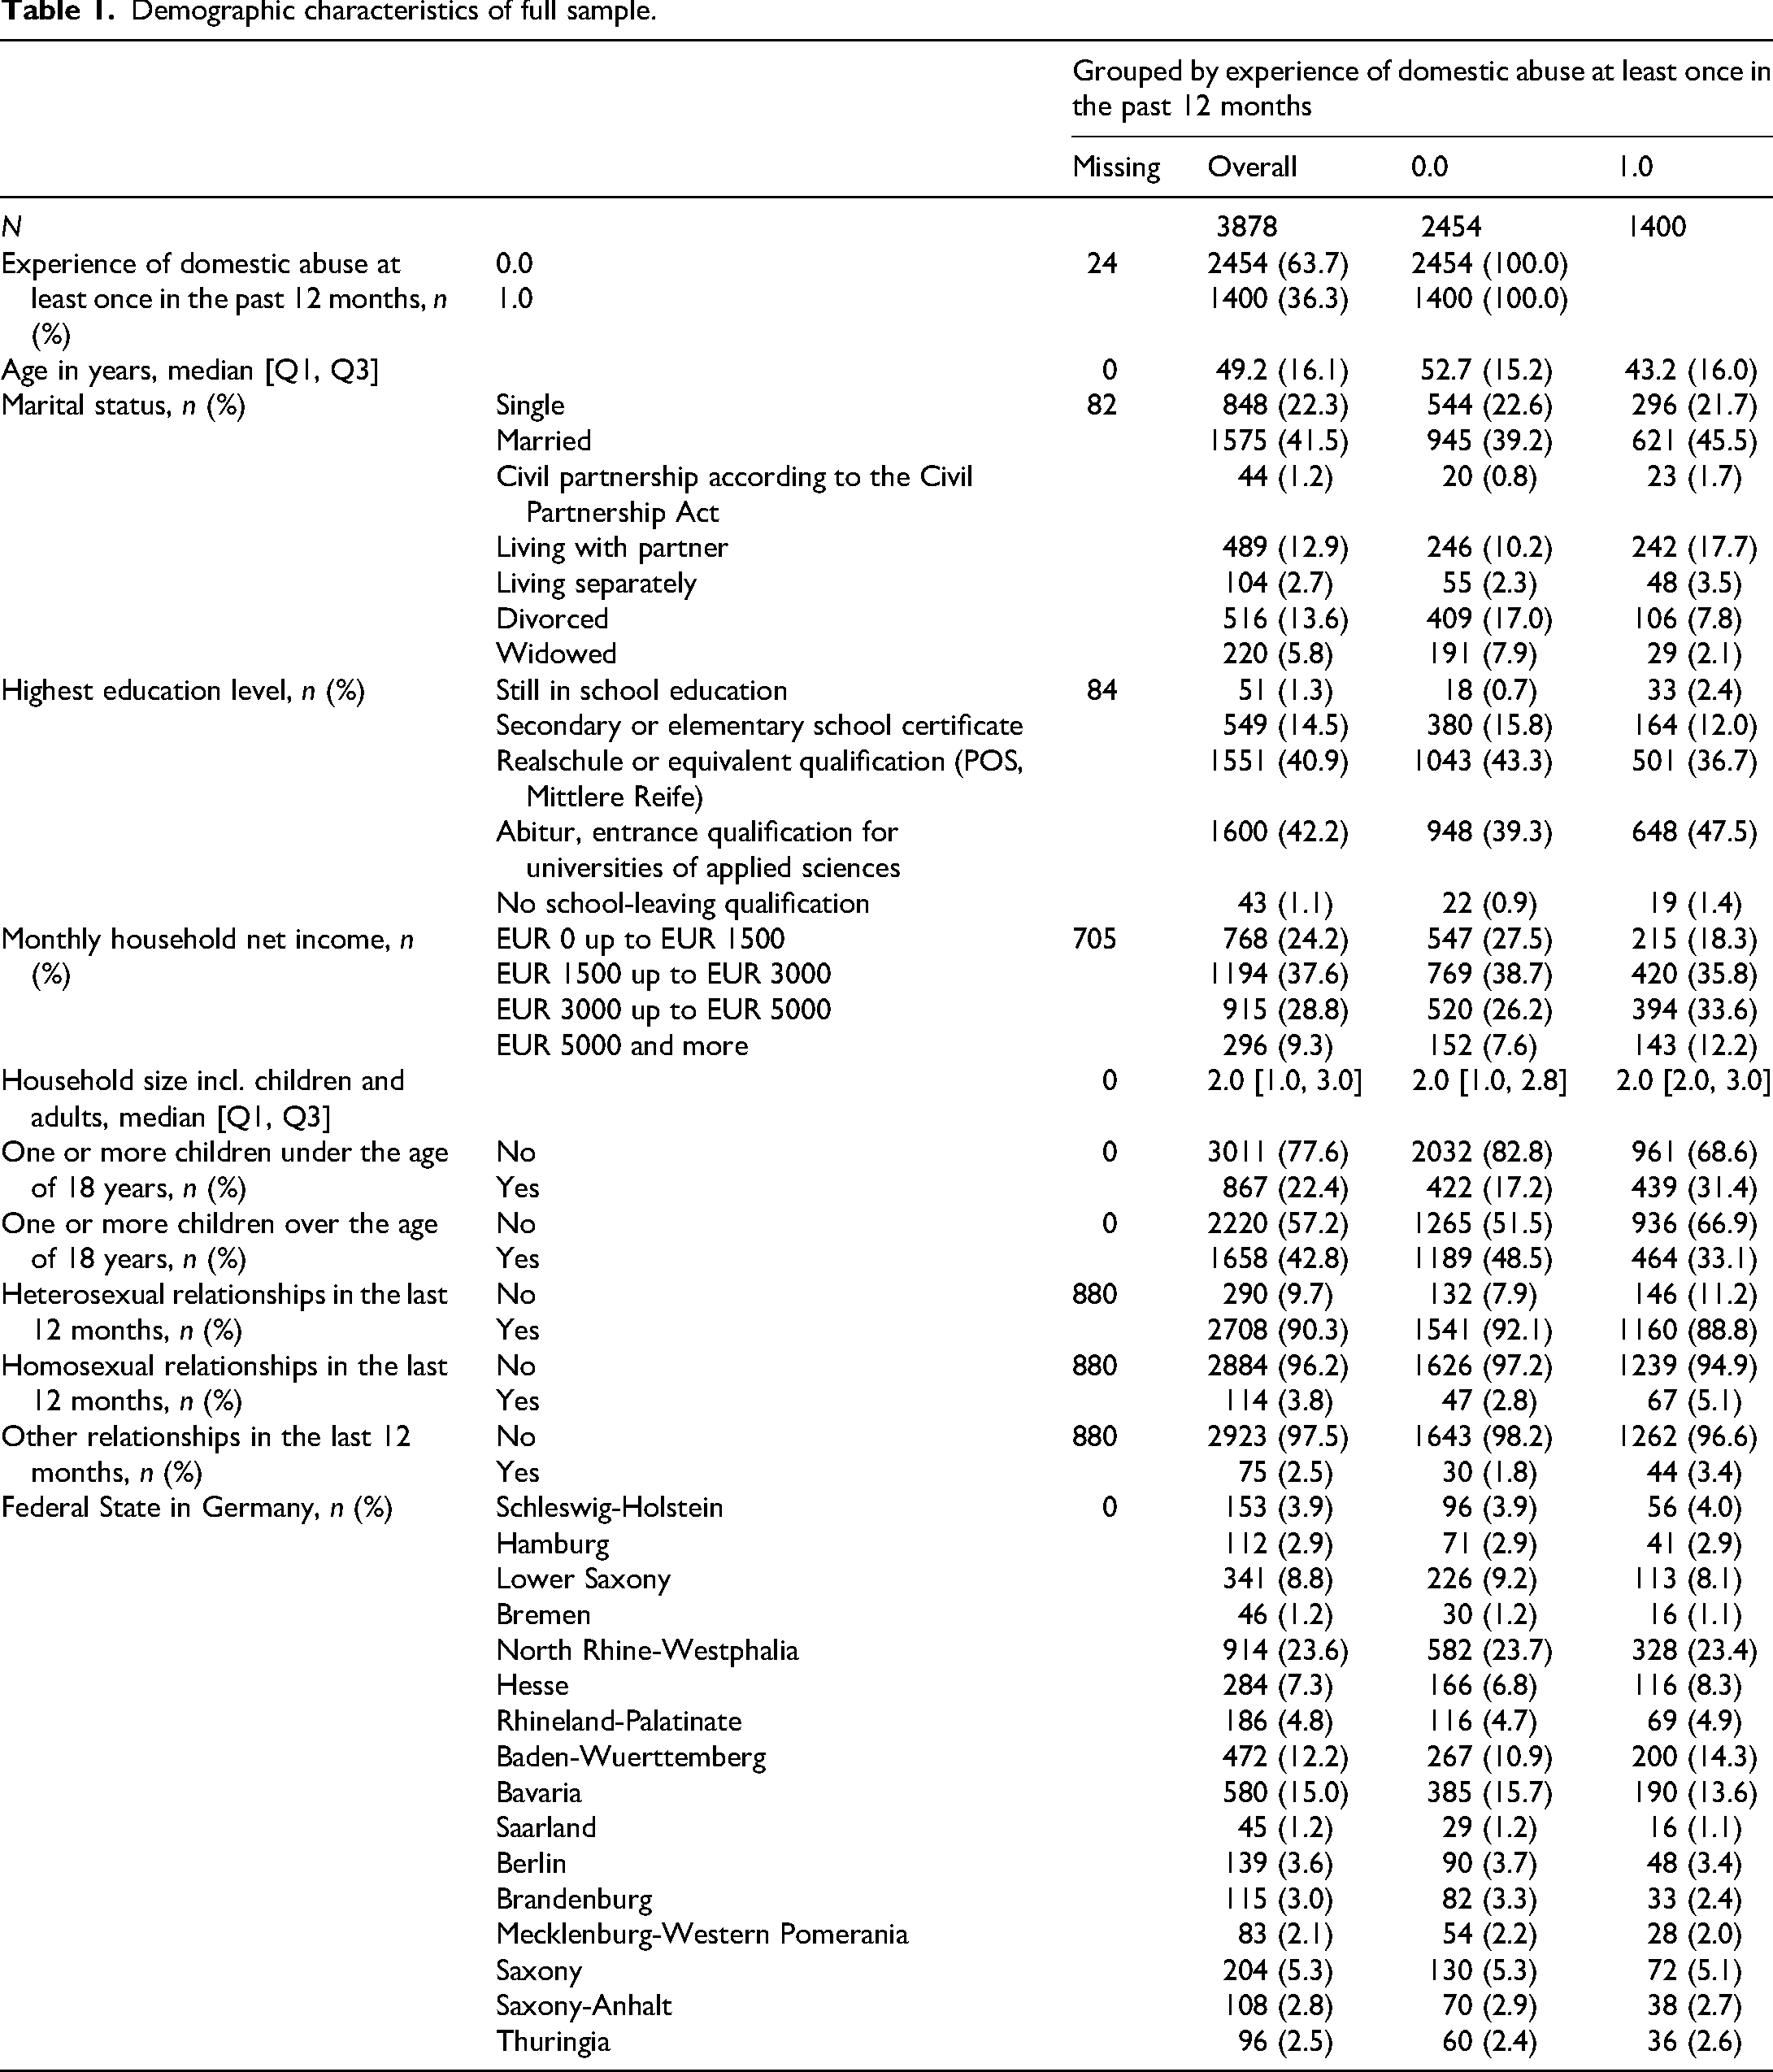
Demographics
The participants were all adults aged 18 years old or above, with a negatively skewed age distribution (Table 1). The average age was around 49 (SD = 16), with victims of IPV being on average 10 years younger (M = 43, SD = 16) than non-victims (M = 53, SD = 15). The majority of women were partnered (55.6%), either through marriage, civil partnership, or cohabitation. The rest were single (22.3%), divorced (13.6%), or widowed (5.8%). Relationship status at the time of the wave1 survey indicated that most women were in a relationship (67.8%) or had been in one within the past year (9.5%), with the vast majority of these relationships being heterosexual (90.2%). The sample distribution across German federal states was consistent with census population data. Most participants (83.1%) had completed at least 10 years of education, such as Realschule, POS, Mittlere Reife, Abitur, or equivalent qualifications. Household income was disclosed by 81.8% of women, being primarily below €5000 per month, with 37.6% earning between €1500 and €3000, 28.8% between €3000 and €5,000, and 24% earning less than €1500. These income levels reflect on average two-person households, whether consisting of two adults or an adult and a child.
Demographic characteristics of full sample.
Measures
Dependent variable: The dependent variable was whether the respondent experienced at least one form of physical abuse at least once within the follow-up period of three months. We used the Conflict Tactics Scale (Straus et al., 1996) and Severe Violence Scale (Johnson et al., 2014) to map physical abuse. ‘No’ or 0 indicates no physical abuse, ‘Yes’ or 1 indicates physical abuse.
Independent variable: Abuse experiences at wave 1 were chosen for feature selection as independent variables. This included the Coercive Control Scale (Johnson et al., 2014) for emotional abuse, the Conflict Tactics Scale (Straus et al., 1996) and the Severe Violence Scale (Johnson et al., 2014) for physical abuse, the Revised Scale of Economics Abuse (Adams et al., 2020) for financial and economic abuse, and the Controlling Partners Inventory (Burke et al., 2011) for digital abuse. The variables were ordinal with the following response options: 0 = never, 1 = yes but not in the past year, 2 = once in the past year, 3 = a few times in the past year, 4 = monthly, 5 = weekly, 6 = (almost) daily.
Data preparation
The data were provided in a clean, structured format and required minimal preprocessing. ‘Don’t know’ and ‘Prefer not to say’ responses were removed from the analysis. This was possible due to the high disclosure rates across questions relating to abusive experiences within the online survey setting.
Statistical analysis
The analysis included descriptive analysis of the prevalence and occurrence of IPV, feature selection via Student's t-test, Wilcoxon Rank-Sum Test and Chi-Squared Test and the application of these features on four machine learning algorithms to predict the occurrence of physical abuse within the follow-up period of three months given any abuse experiences in the past year (see Figure 1).
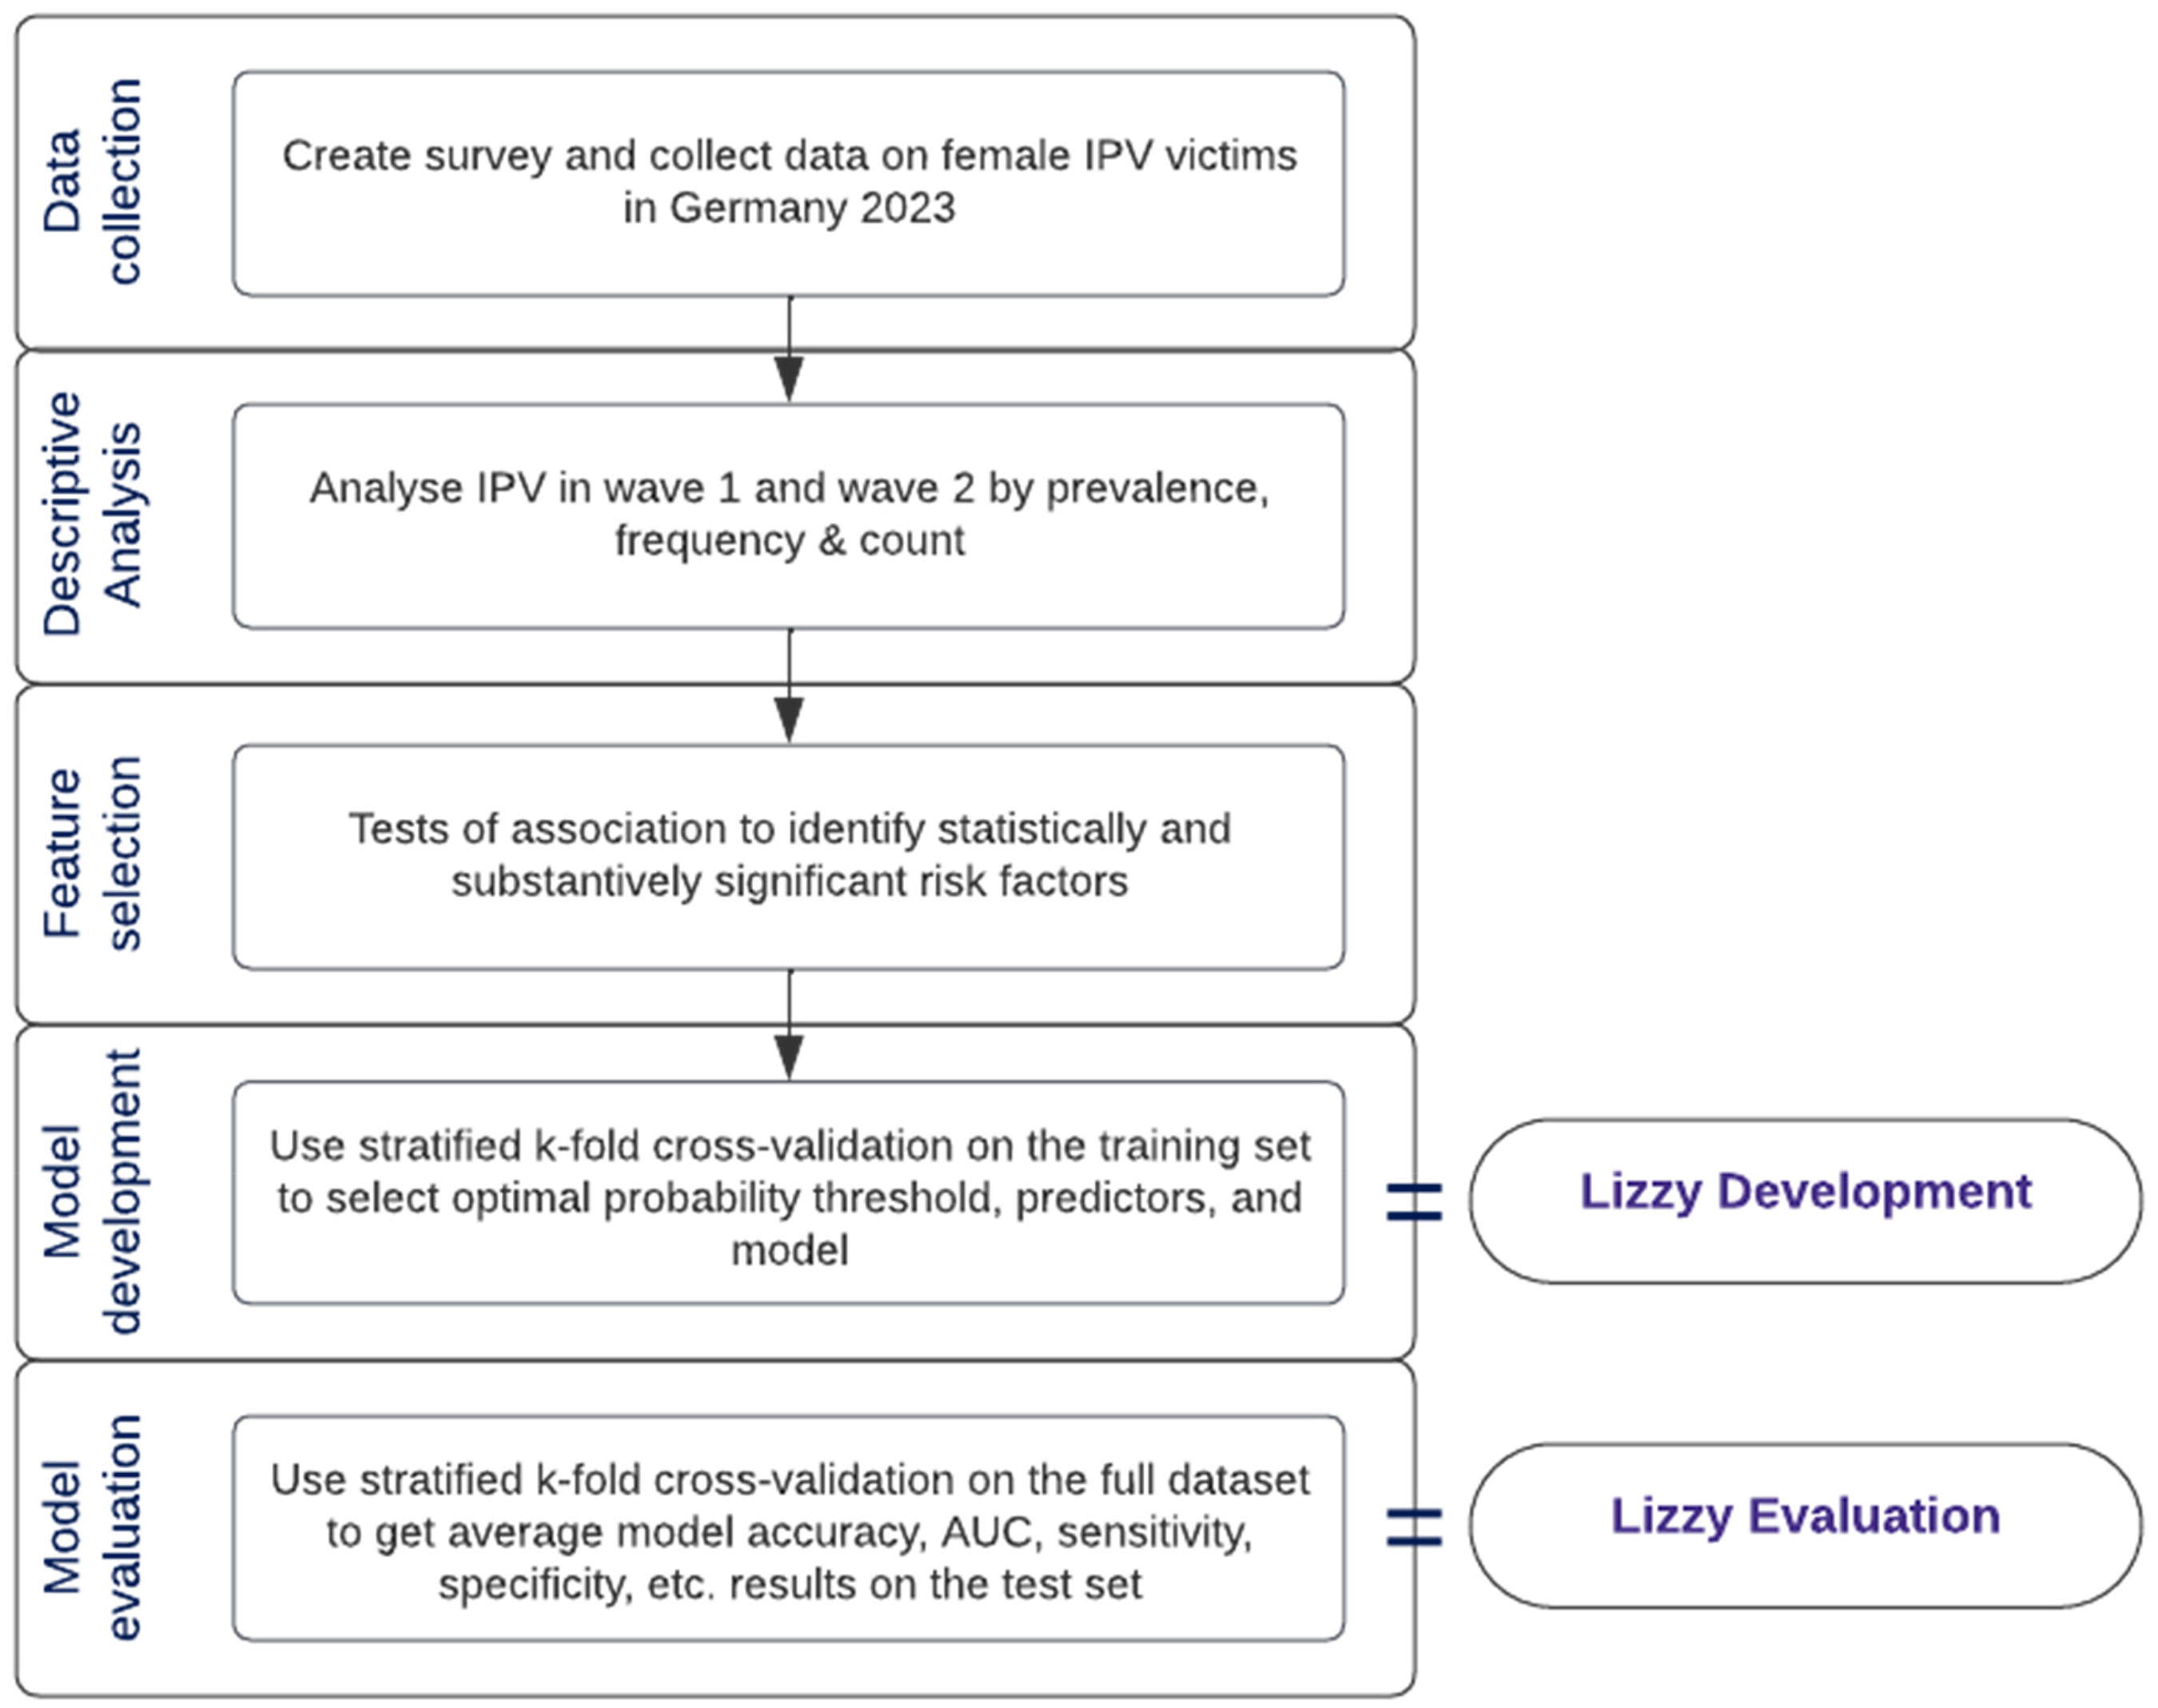
Workflow chart of development of IPV risk assessment tool, Lizzy.
Multivariate feature selection methods such as forward selection (FS), backward elimination (BE) and Lasso Regression were applied using consensus nested cross-validation (Parvandeh et al., 2020), yielding similar results to univariate selection in terms of emerging predictive features. Given its simplicity compared to FS/BE, it was chosen as a feature pre-selection method – to easily narrow down our search to a practical number of risk factors from a total of 110. Additionally, our focus was to build a predictive model, hence contributions to general explanatory models looking into main factors behind physical abuse recidivism are outside the scope of this article.
The top 3–15 factors were extracted from a list of substantively significant factors. The latter were selected using the Bonferroni-corrected p-value threshold (.0005 for t and Wilcoxon tests, .005 for chi-squared tests) and effect size (Cohen's d ≥ 0.5, Cramer's V ≥ 0.3). After filtering the dataset for the chosen predictors and target, null values were dropped.
For the model development, we performed nested stratified five-fold cross-validation. This method randomly partitions data into five equal-sized folds twice, using four out of the five folds for model training and the remaining fold for model validation. It also ensures the victim/non-victim ratio is equal in the train and test sets. The outer cross-validation layer is meant for model evaluation on a test set that the model has not previously seen. The inner cross-validation layer was used to choose the optimal probability threshold (Youden index). This process results in five sets of evaluation metrics for the inner and outer fold, summarised by their average and standard deviation.
Given the positive skew of abuse data, with the majority of respondents having not experienced IPV, we used the class weights parameter of each model to penalise inaccurate predictions – a method inspired by King and Zeng's paper (2001). The penalty is based on the class prevalences within the training set, so incorrect predictions in the minority class receive a higher penalty than incorrect predictions in the majority class.
A model was considered overfit if the difference between its train and validation AUC scores was more significant than 0.02 points. The same random state (42) was used for inner/outer cross-validation and tree-based models. The specific control parameters for each model are in Table 10 in the Appendix. The models were compared using performance metrics such as AUC score, accuracy, specificity, sensitivity and Brier score. The features essential to the model outcome were shown for the best-performing model and the number of predictors. The best-performing model was selected based on a balance between a high average AUC score and a small AUC score range (at most 0.10 points variation) across the five inner cross-validation folds of each outer cross-validation fold. All analyses were conducted using Python version 3.11. Tests of association were run using SciPy (Pedregosa et al., 2011; Virtanen et al., 2020), while model development was done using MLFlow (Chen et al., 2020) for MLOps, and the ML configuration manager Hydra (Yadan, 2019). FS/BE experiments were run using MLXtend (Raschka, 2018).
Results
Descriptive results
The past-year prevalence of IPV, including emotional, digital, financial, and physical abuse, was 36.1% (1400). Of those 1400 respondents, 1065 participated in the subsequent survey (%) and 58.8% (823) reported abuse by a partner again within three months. 16.6% (232) experienced at least one instance of physical abuse by a partner by Wave 2.
Table 2 shows the prevalence, average frequency, and count of abuse experienced by type of abuse in Wave 1, demonstrated by Table 3 for Wave 2. The ordinal scale applied ranges from once (1), a few times (2), monthly (3), weekly (4) to daily (5). The findings reveal that the majority of IPV experienced in the sample did not occur in isolation, with individuals reporting on average 1.5 types of abuse (SD = 1.7) over the past year in Wave 1 and 1.2 types of abuse (SD = 1.4) over the past three months by Wave 2. A significant portion of the sample experienced several types of abuse at least once in Wave 1 (averaging 70.38% across abuse types) and at least once in Wave 2 (averaging 30.38% across abuse types), indicating a pattern of multiple interacting types of abuse. Respondents in the sample experienced abuse on average between once and a few times in Wave 1 (over the past year) and during Wave 2 (over the past three months). Moreover, individuals reported experiencing various abuse tactics within the same abuse type, with an average of 2.6 tactics of physical abuse (SD = 3.7) in wave 1 and 0.8 (SD = 2.5) in Wave 2.
Prevalence of IPV in the past year in the victim sample by type of abuse in Wave 1.
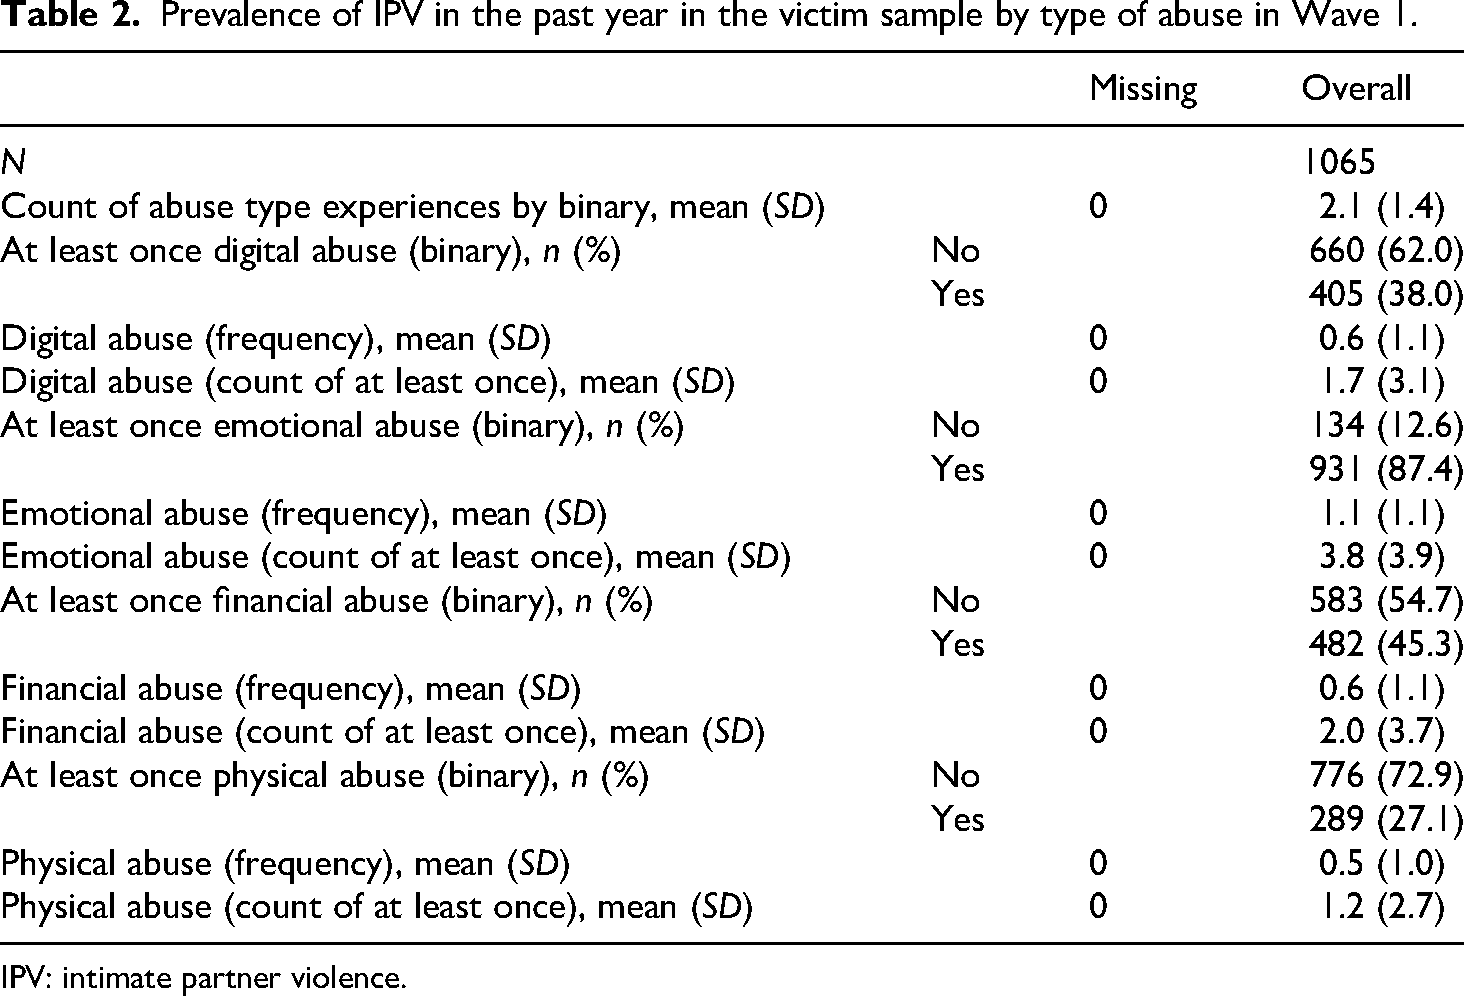
IPV: intimate partner violence.
Recidivism of IPV in the past three months in the victim sample by type of abuse in Wave 2.
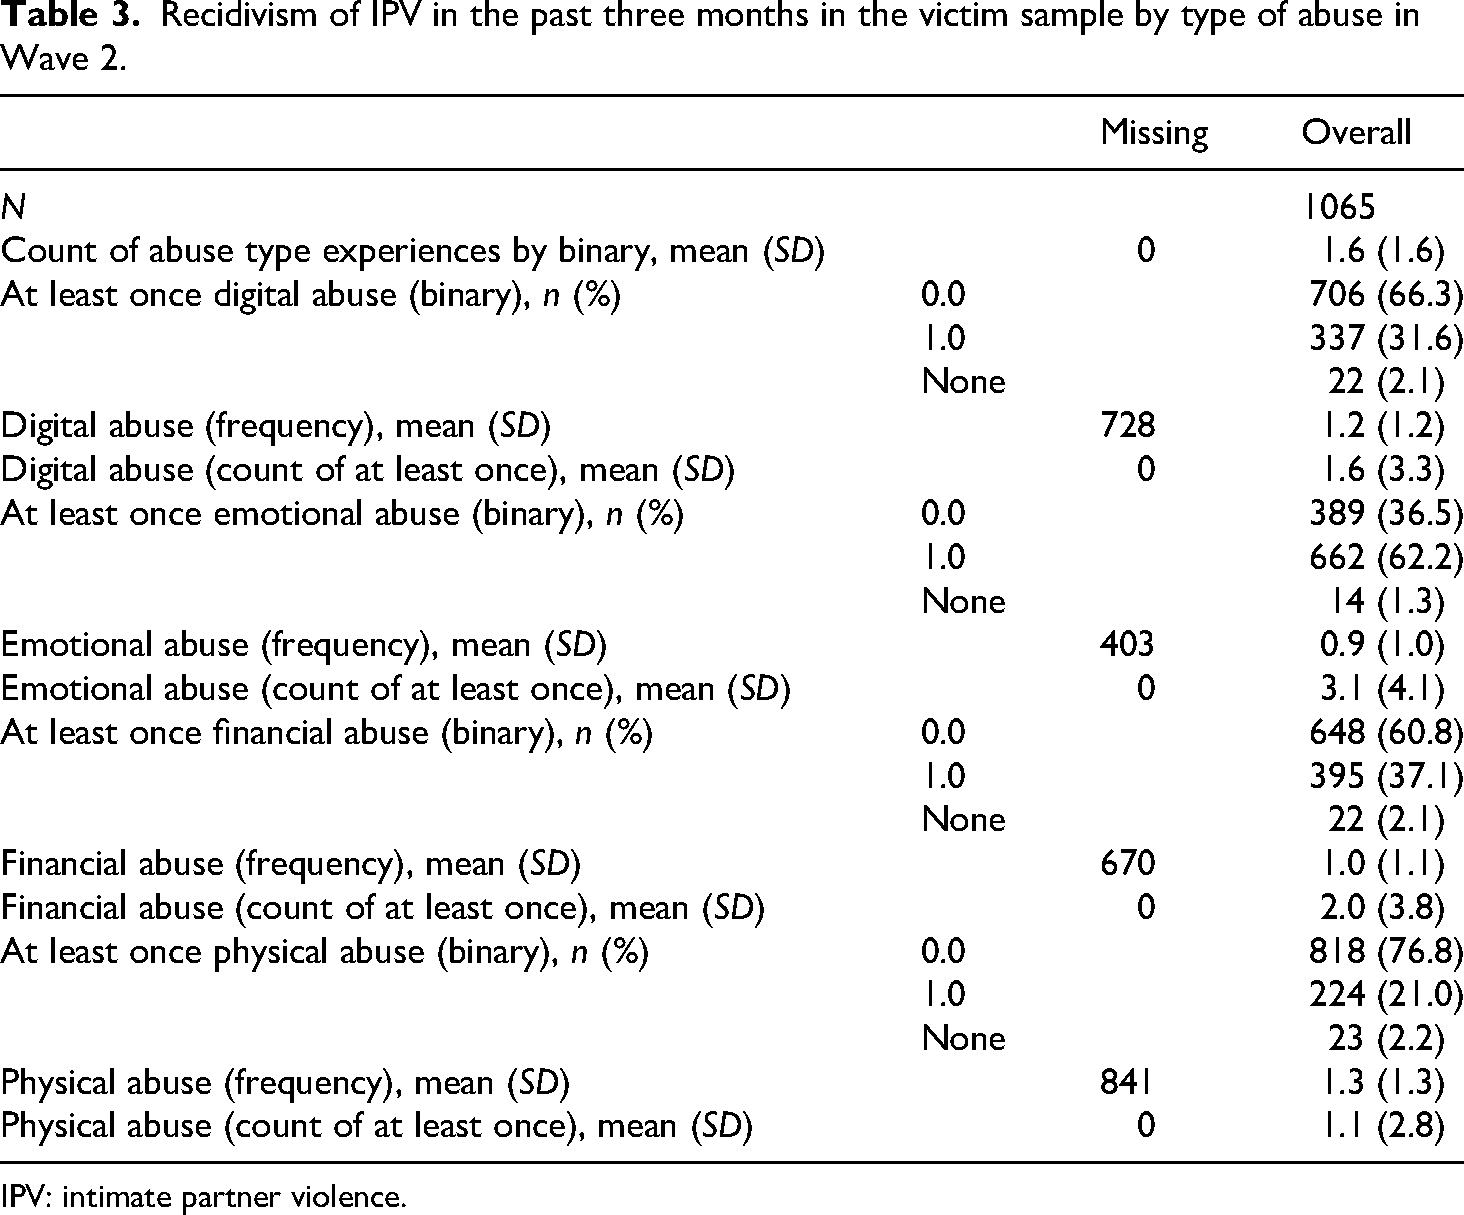
IPV: intimate partner violence.
Results of difference tests
Table 4 shows the top-performing numerical features of physical abuse by t-test-statistic. The total number of physical risk factors was limited to three to focus on the effect of proxies on predictive accuracy. The mean values between 1 and 2 indicate that victims of physical abuse in Wave 2 experienced these forms of abuse at least once or a few times in Wave 1. For example, victims of physical abuse at Wave 2 had their partners throw something at them that could hurt them on average ‘a few times’ by Wave 1 (M = 1.9, SD = 1.94) compared to almost ‘never’ by victims at Wave 1 who did not experience physical abuse at Wave 2 (M = 0.29, SD = 0.71).
Top 15 risk factors of physical abuse by t-test on unbalanced sample.
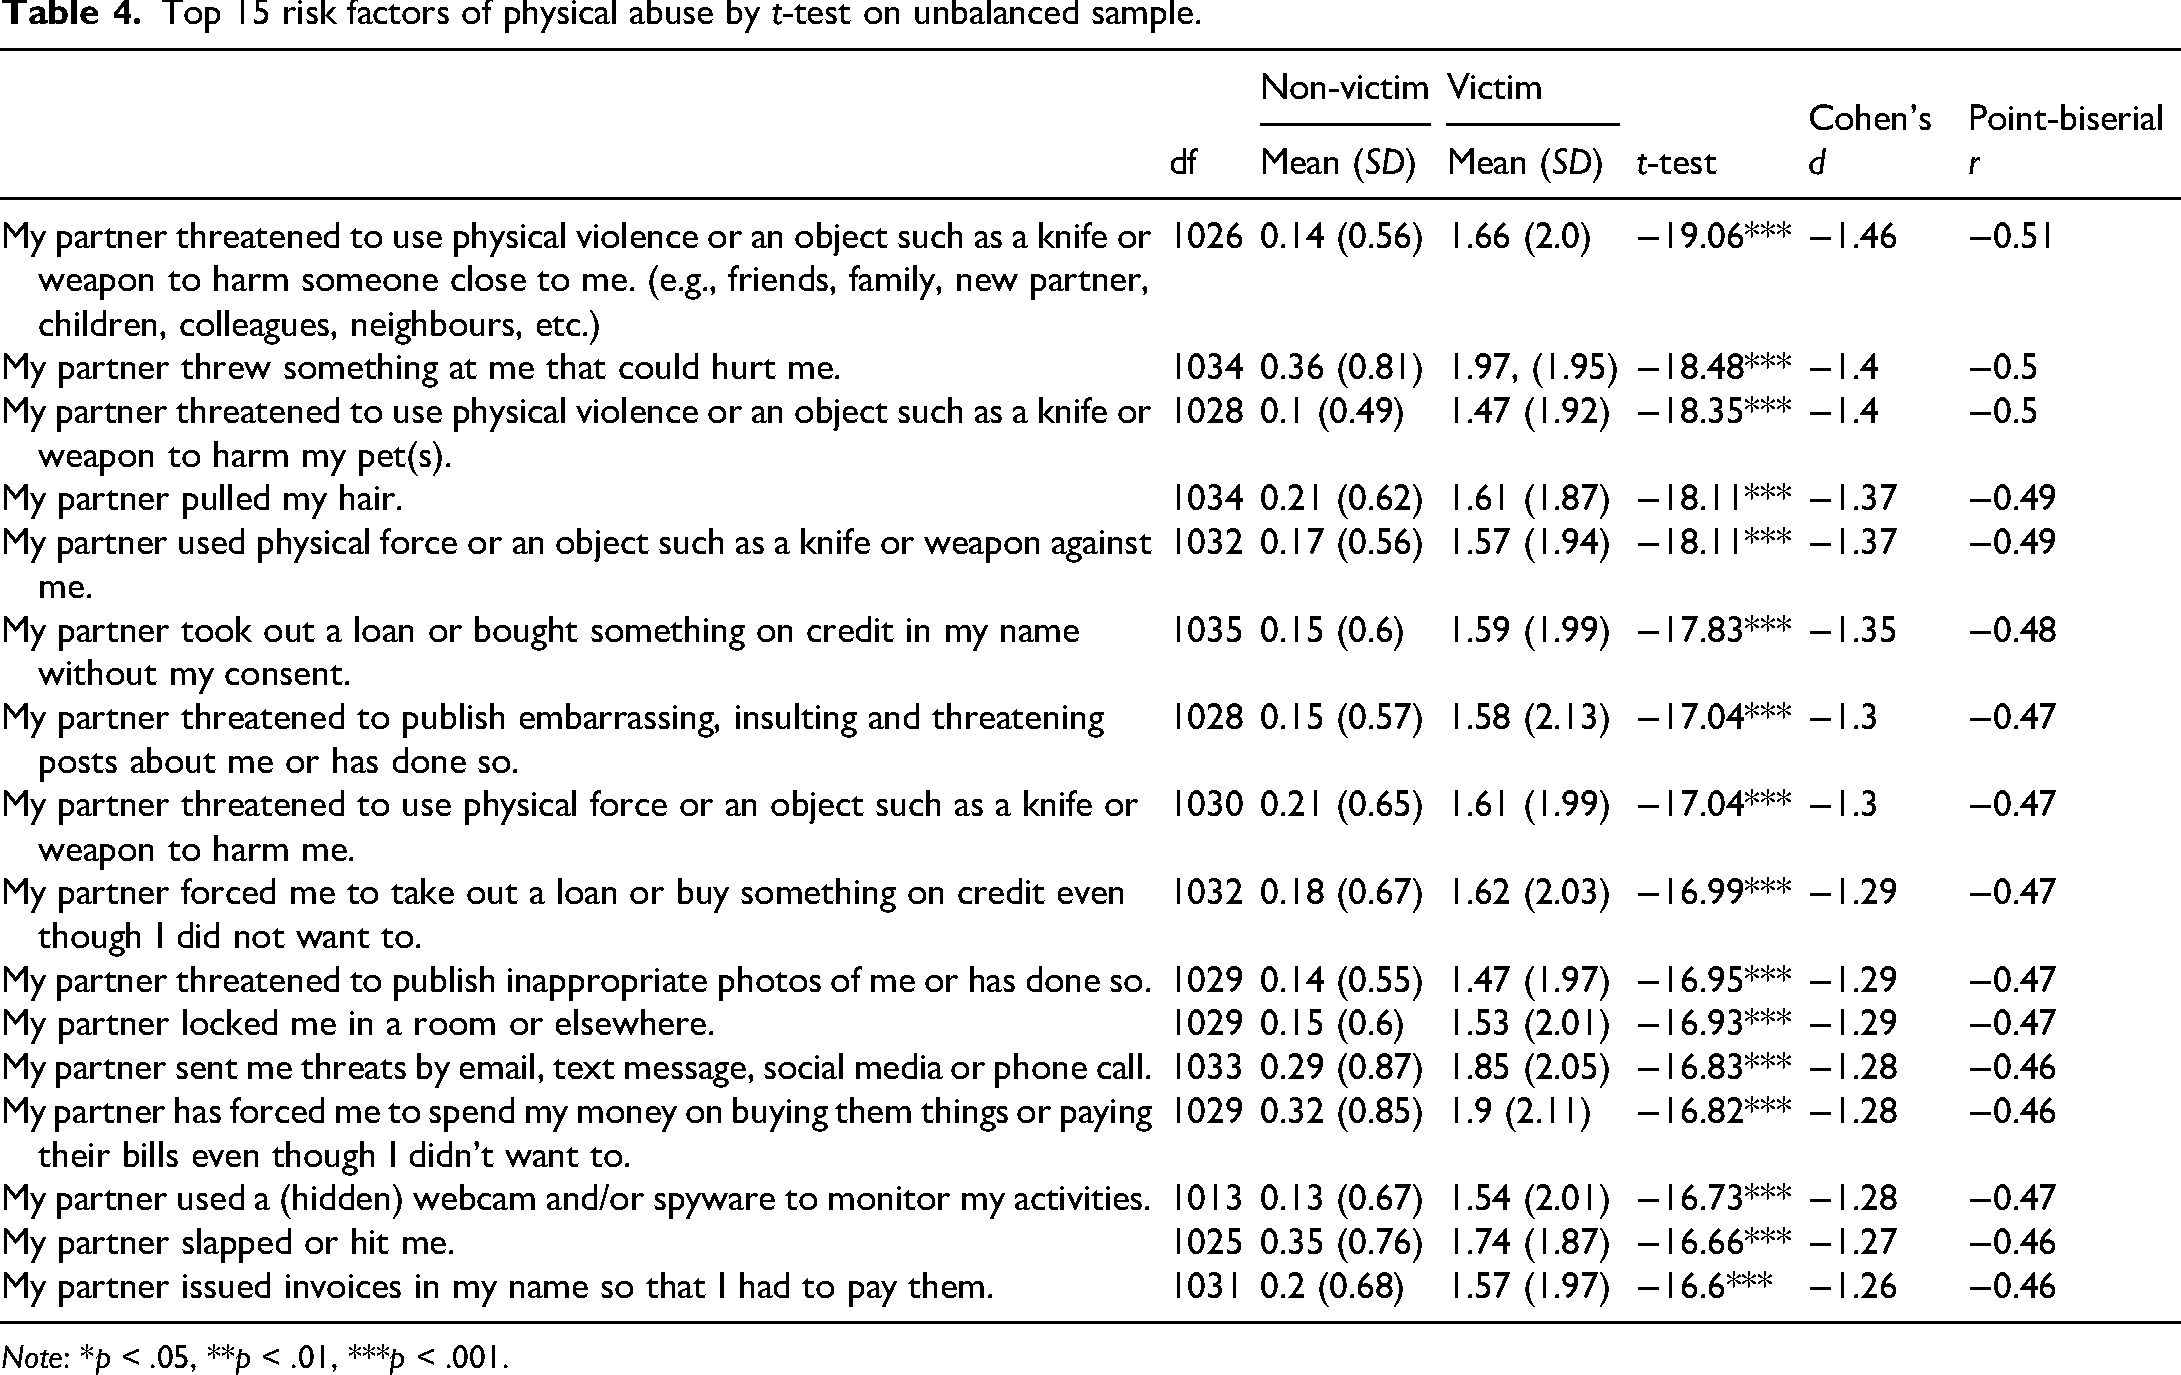
Note: *p < .05, **p < .01, ***p < .001.
Due to the unequal sample sizes and the possibility of unequal variances, we also conducted the Wilcoxon Rank-Sum Test. The top risk factors by t-test relate to physical, while the top risk factors by Wilcoxon Rank-Sum Test relate to digital abuse. Most features appear in both tests with slight differences in order of effect size. Overall, victims of physical abuse at Wave 1 appear to have frequently experienced various forms of digital, financial and physical abuse.
All nominal variables except for recent partner step parenthood, that is, Has one of your partners taken on the role of a step-parent for one or more of your children in the last 12 months?, which had a Cramer's V of 0.307 (X2(1) = 40.04, p < .000) were excluded due to low effect size. However, since this question is relevant to only 40% (<50%) of our sample, it was also excluded from model development.
Results of model development
To determine the number of risk factors to be input into the models, we first explored the performance of the validation AUC values as a function of the number of risk factors. The t-test statistic determined the order of risk factors. Figure 2 indicates that a longer risk assessment is not necessarily a better predictor of the outcome, that is, physical recidivism by an intimate partner. In the validation set, all models peak at seven features, whereas logistic regression peaks at 6, with model performance decreasing as more features were added. We see a similar trend in the test set, although models peak at 4 (RF, XGBoost) and 8 (LR, CatBoost) features, respectively (Figure 3).
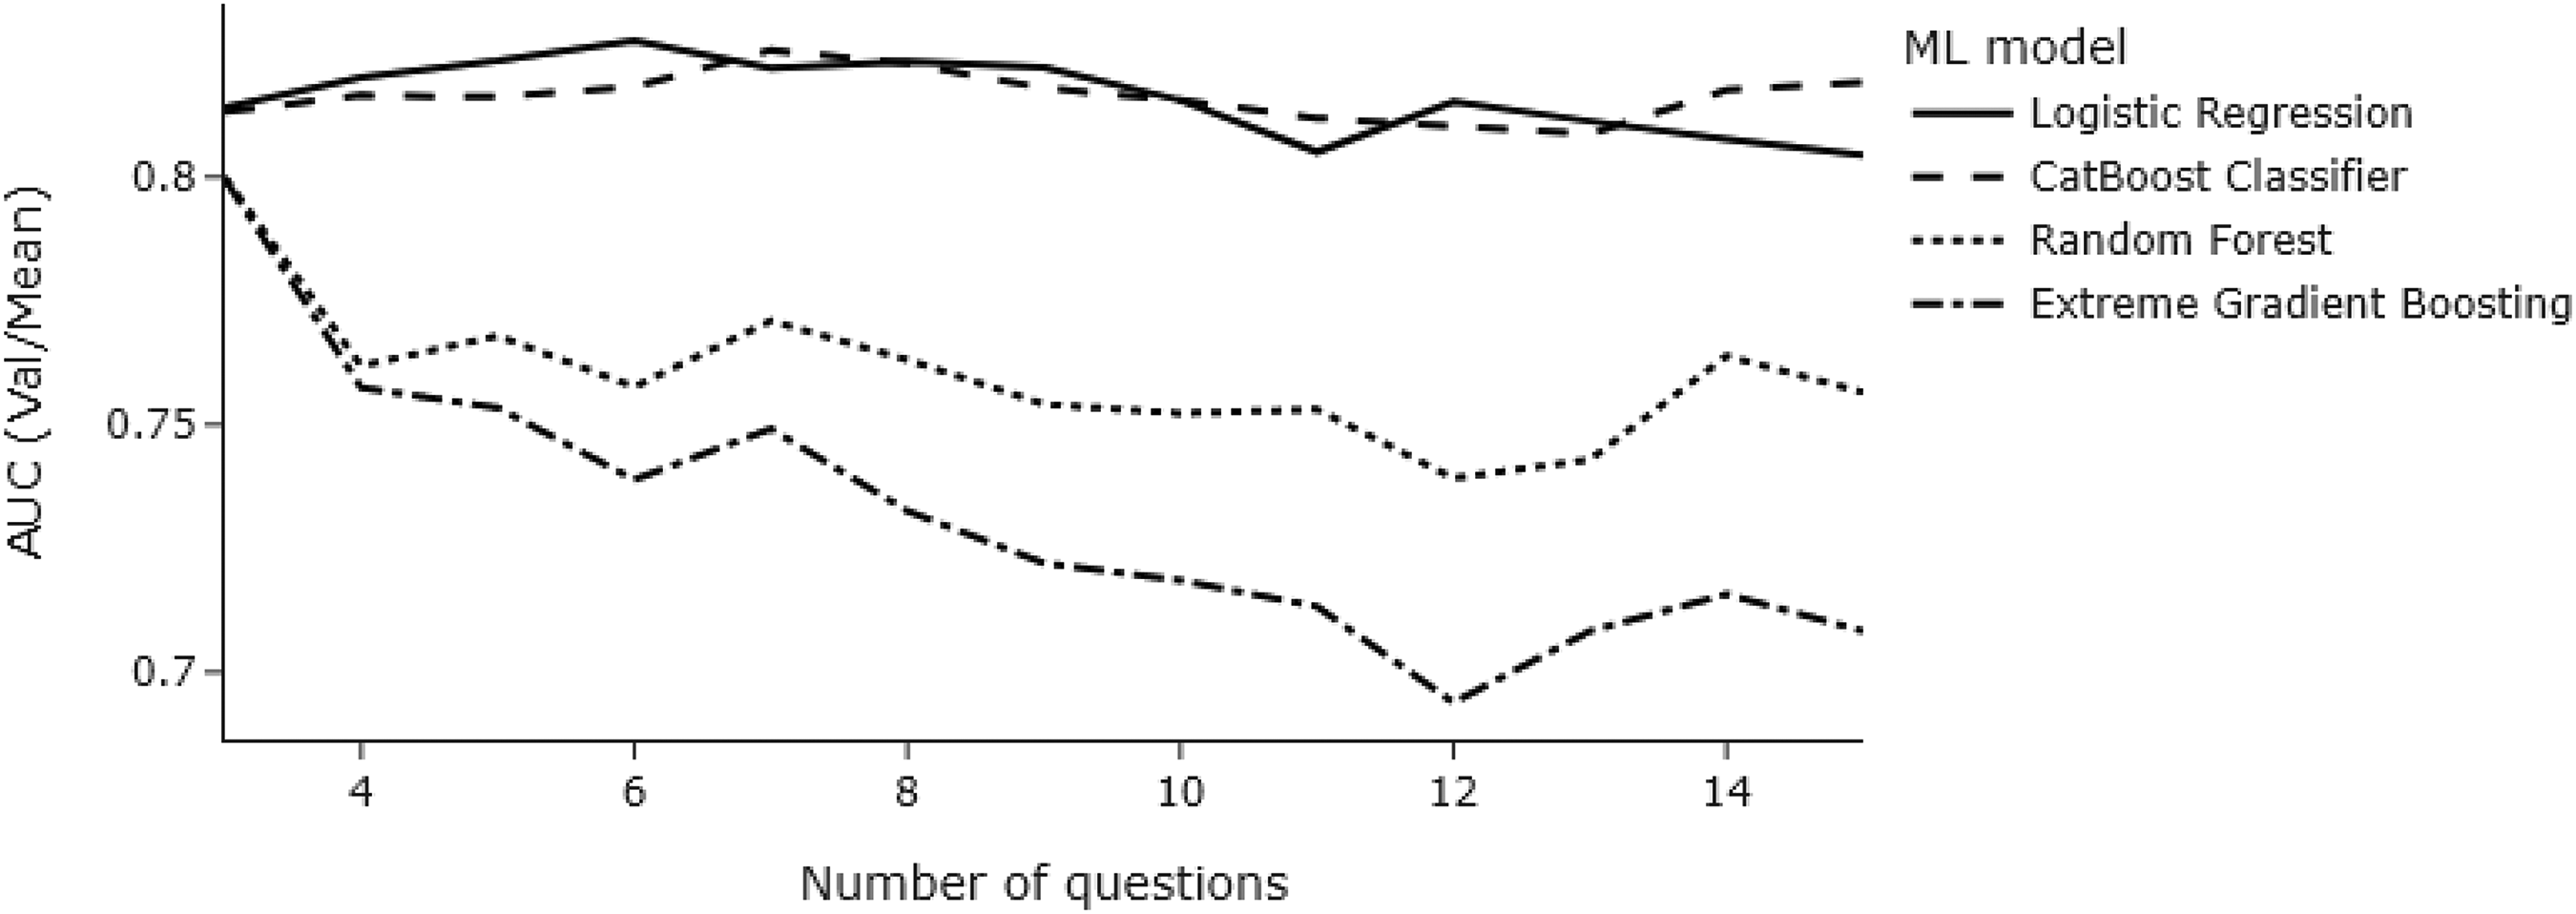
Line chart showing validation AUC values as a function of several risk factors across models.
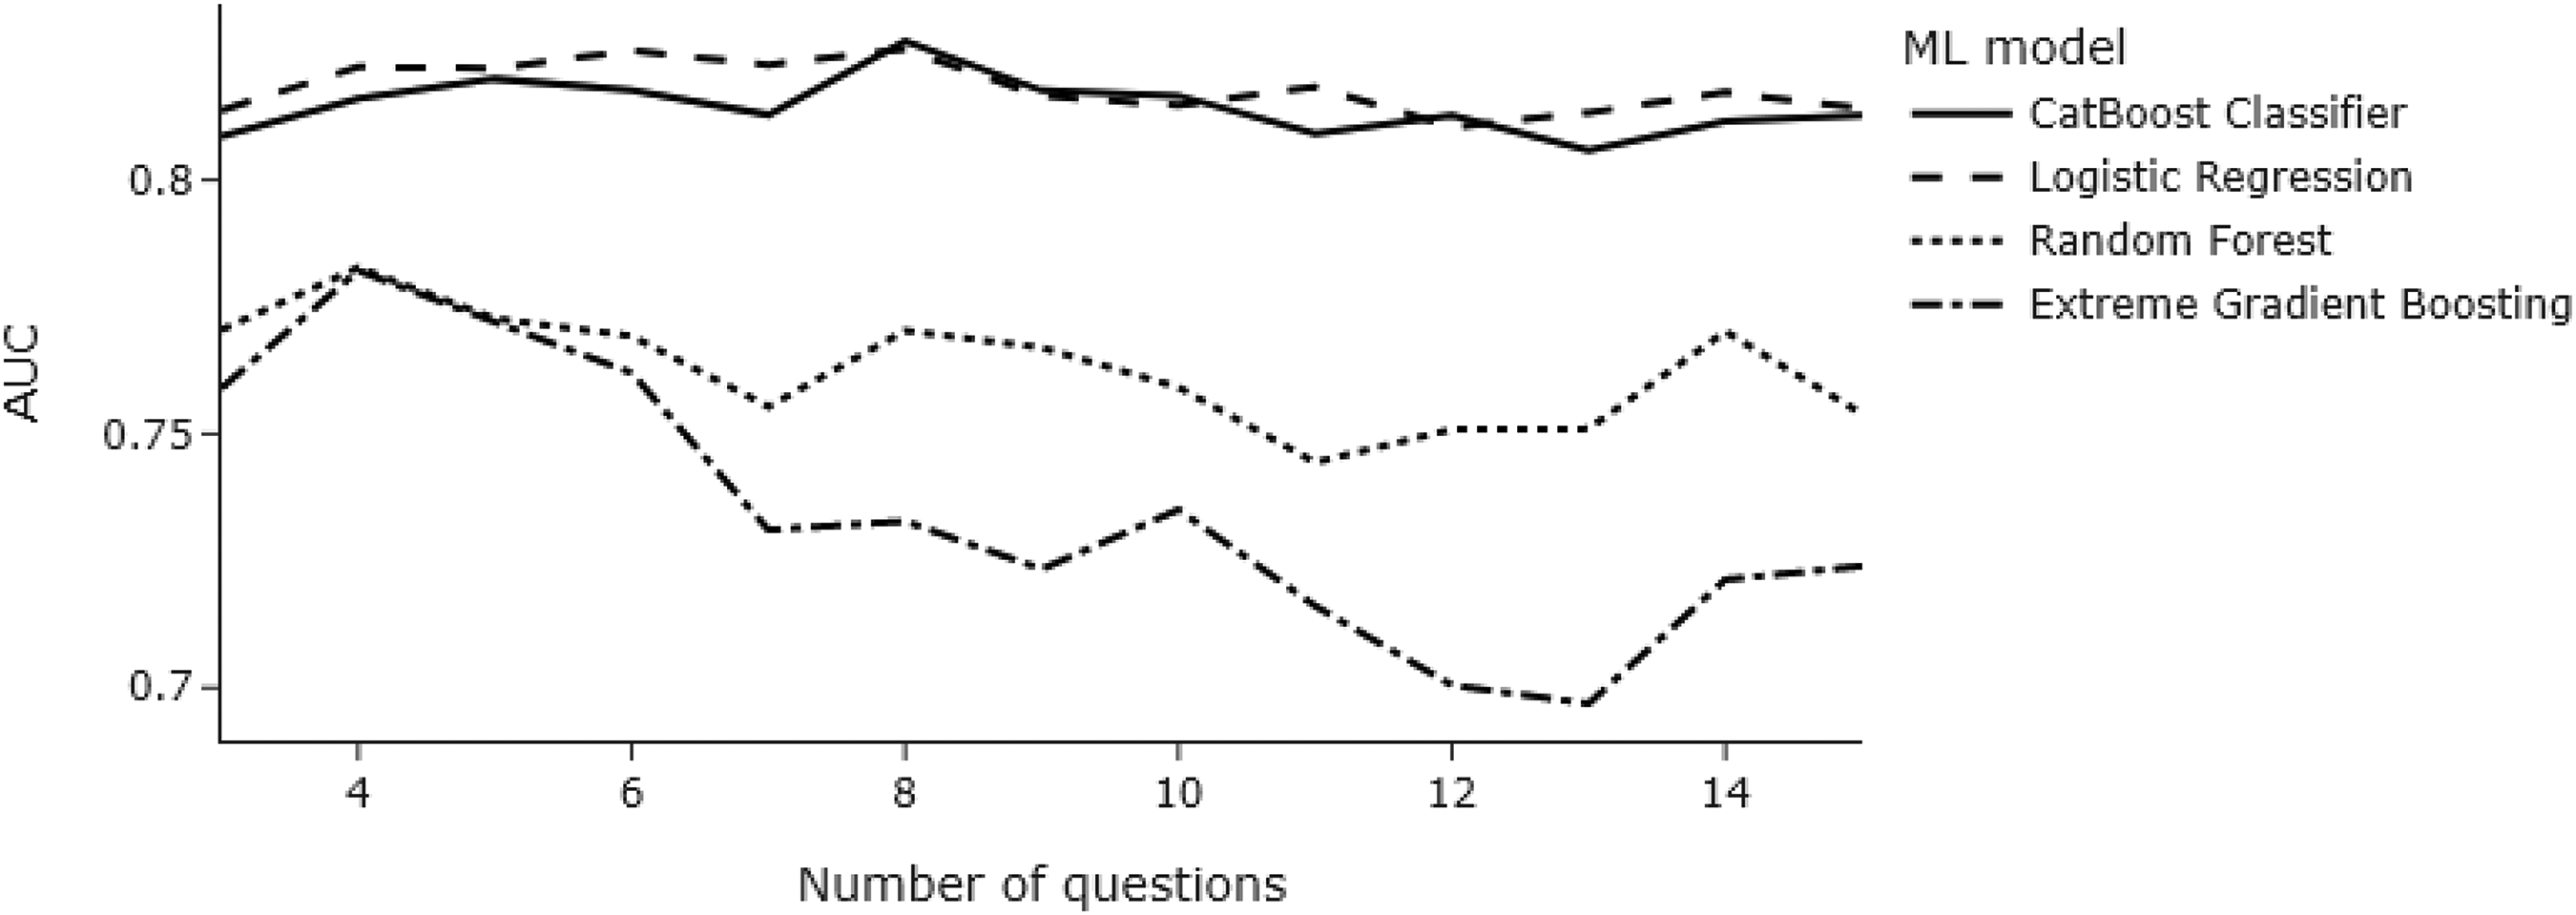
Line chart showing test AUC values as a function of several risk factors across models.
When looking at the difference in train and validation AUC scores across each number of questions, we noted that a higher number of questions increased the risk of overfitting (see Figure 4). Although reducing the number of trees and maximum depth of tree-based models to 15 and 3, respectively, decreased the risk of overfitting considerably, models with fewer predictors still overfit (see Figure 5).
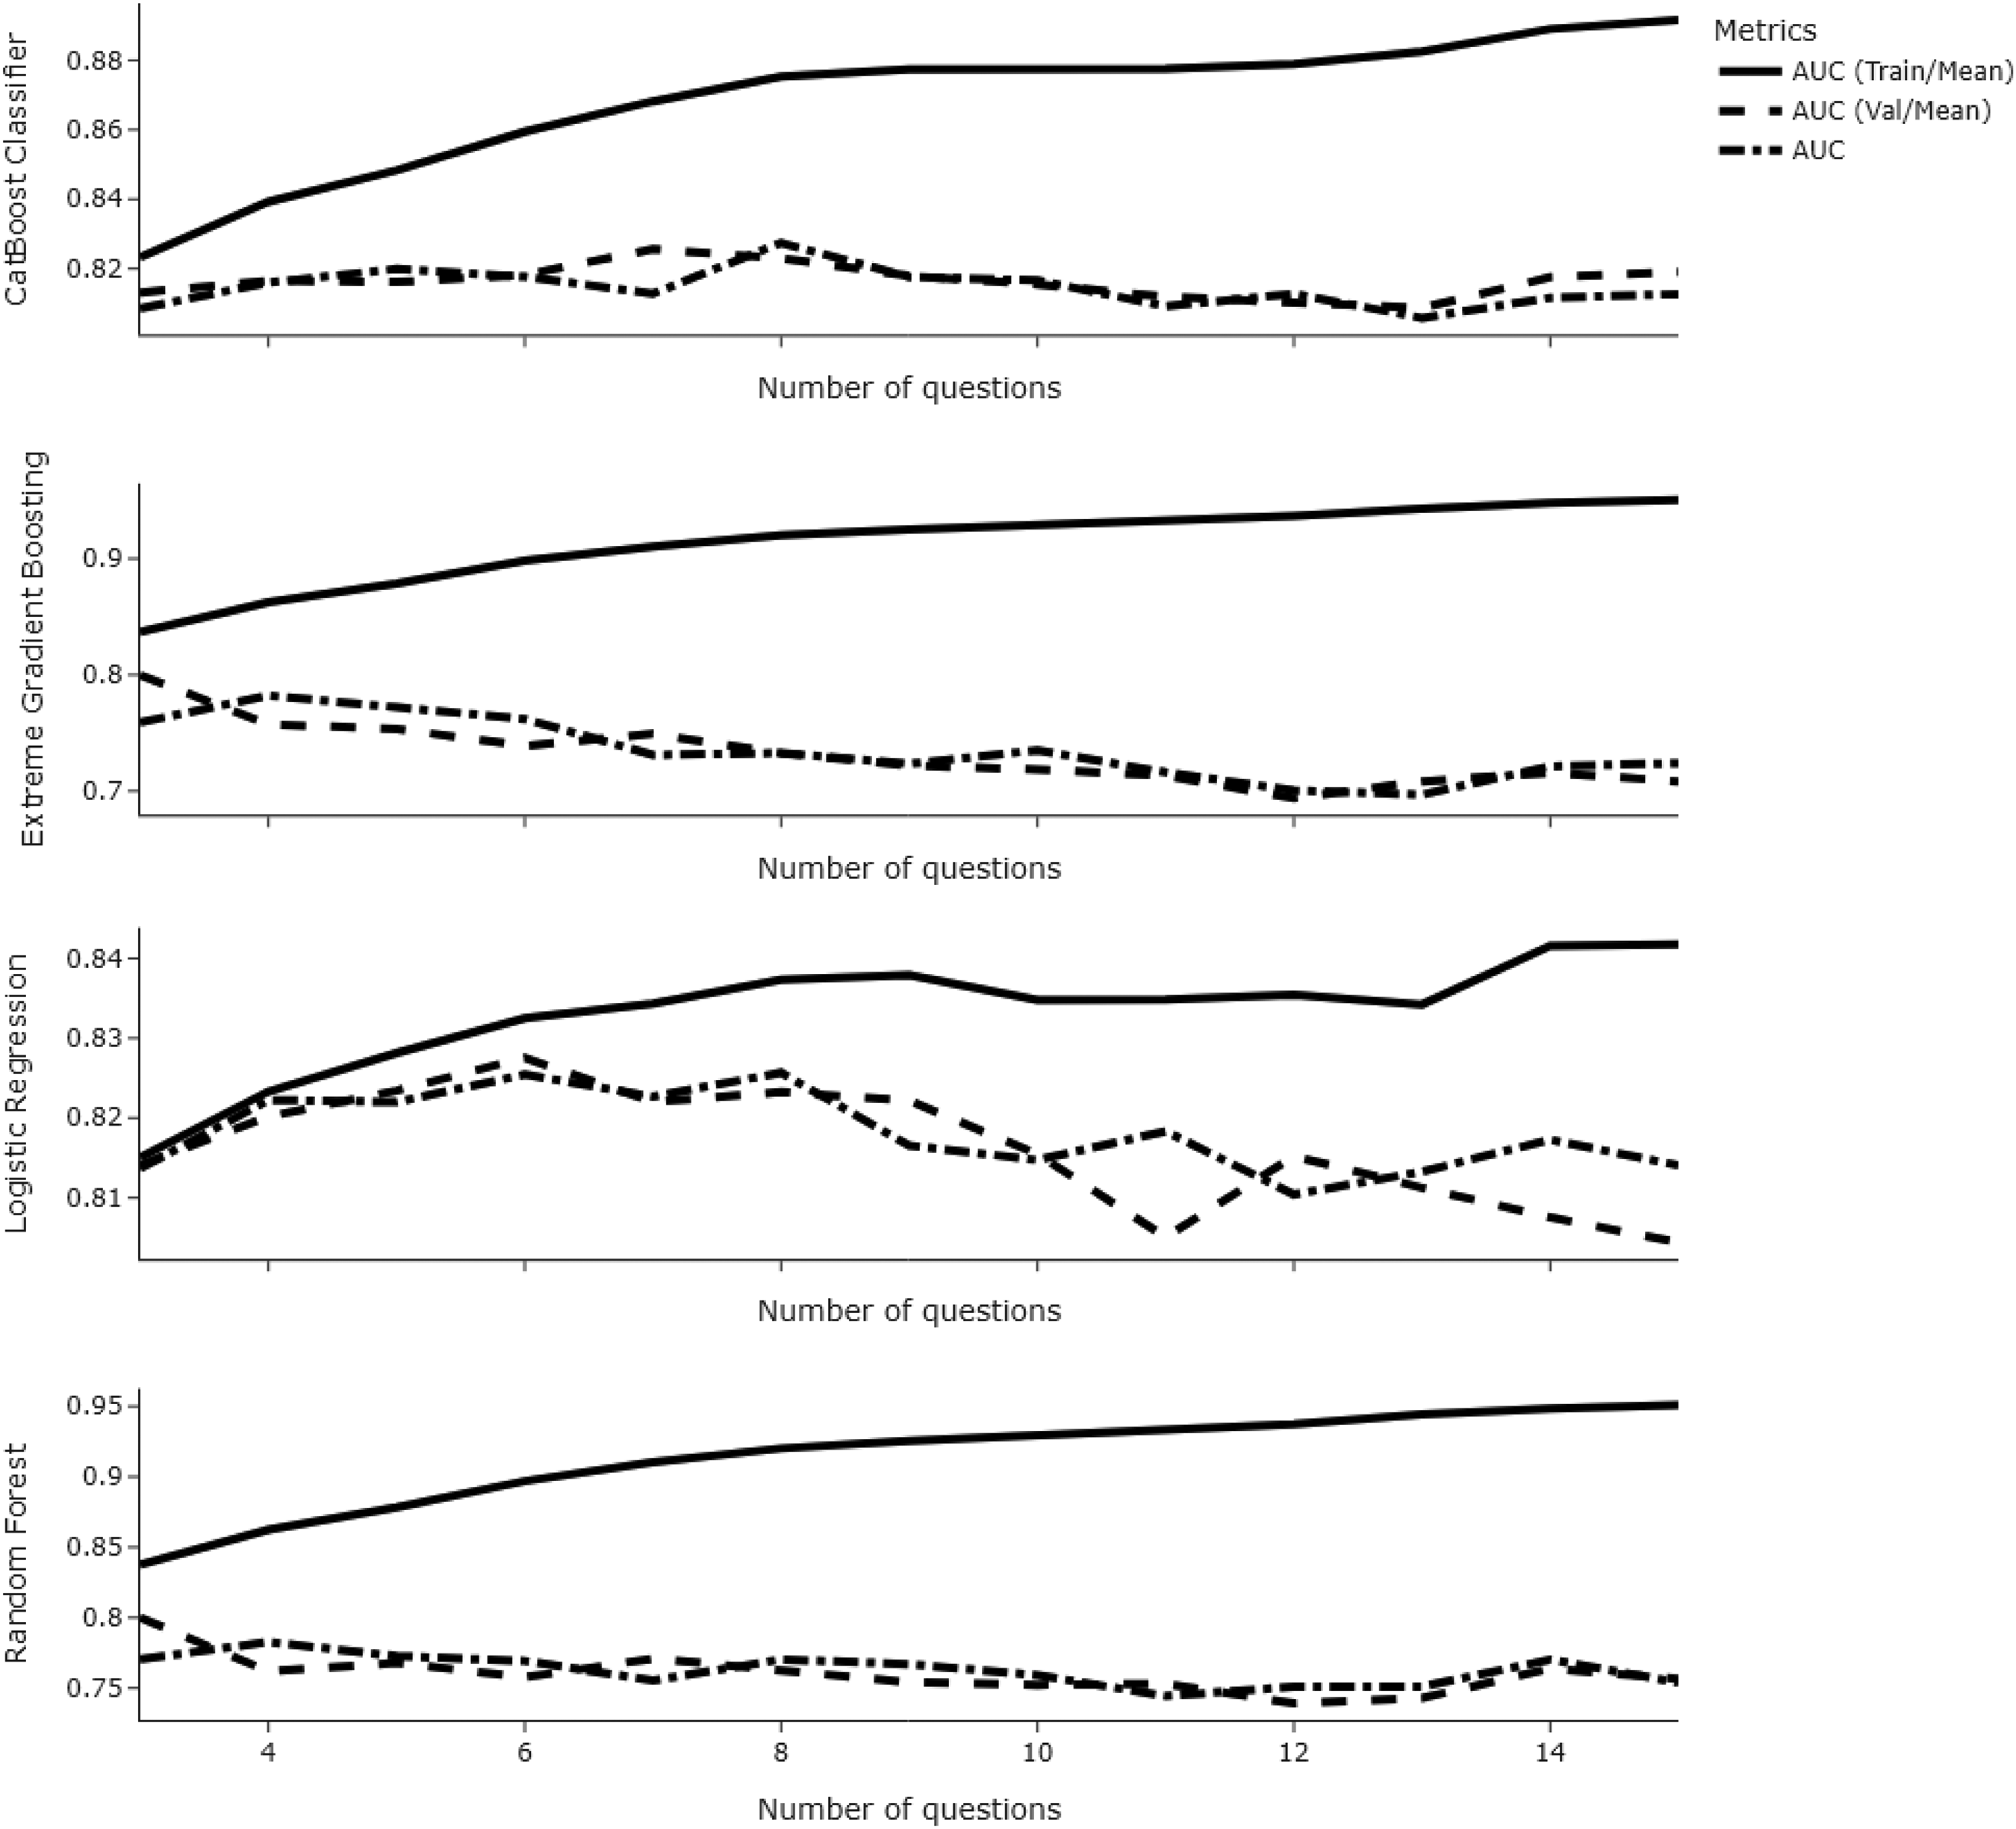
Line chart showing train-validation-test AUC values as a function of risk factors across models.
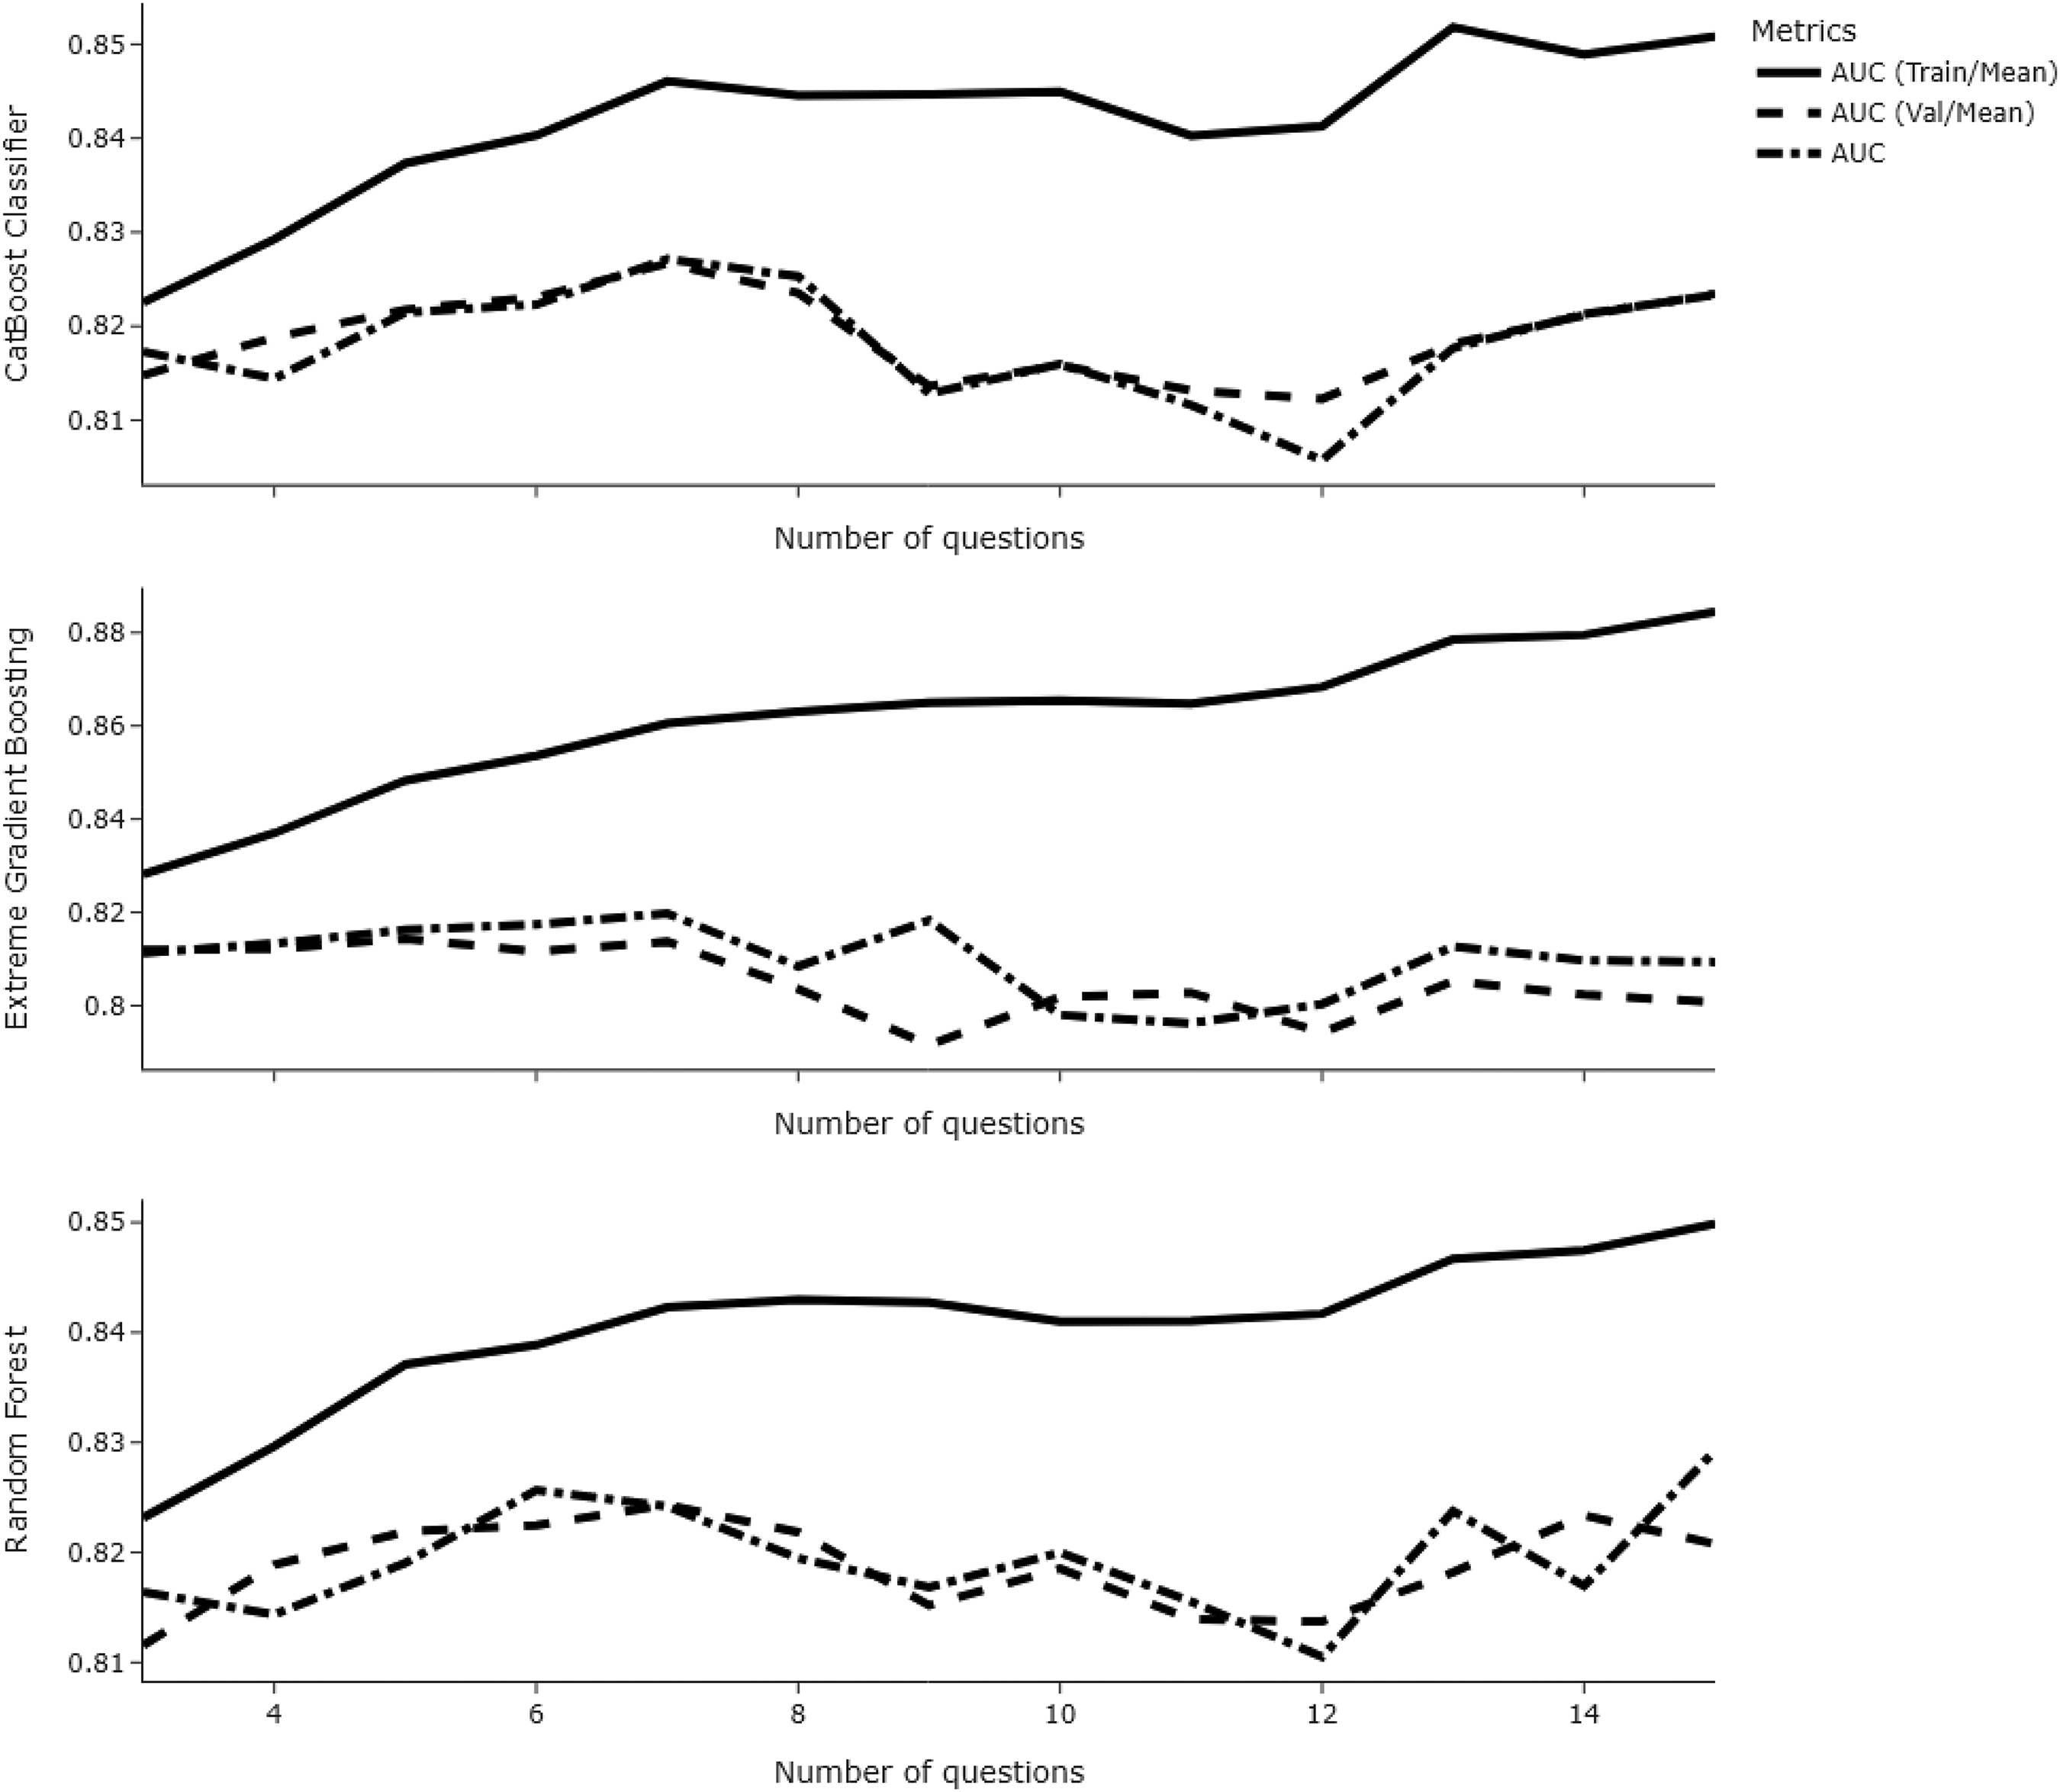
Line chart showing train-validation-test AUC values as a function of risk factors across models when the number of trees and maximum depth for tree-based models were reduced.
Setting six as the optimal number of risk factors to reduce the chance of overfitting, we re-selected predictors by pre-filtering on t-test results with a Cohen's d lower than −1, then ranked questions based on a mixture of t-test statistic and percentage prevalence within the sample. This was to ensure that Lizzy could detect as many potential victims as possible, assuming that a higher prevalence rate also indicates a higher disclosure rate in more stressful settings.
To create the ranking, we first scaled the absolute t-test statistic and percentage prevalence on the pre-filtered sample to fall within the 0–1 range using Min–max scaling. Then, we summed the scaled scores to create an absolute ranking, denoted as Ranksum in Table 5.
Top seven risk factors of physical abuse by scaled t-test statistic and sample pct. prevalence.
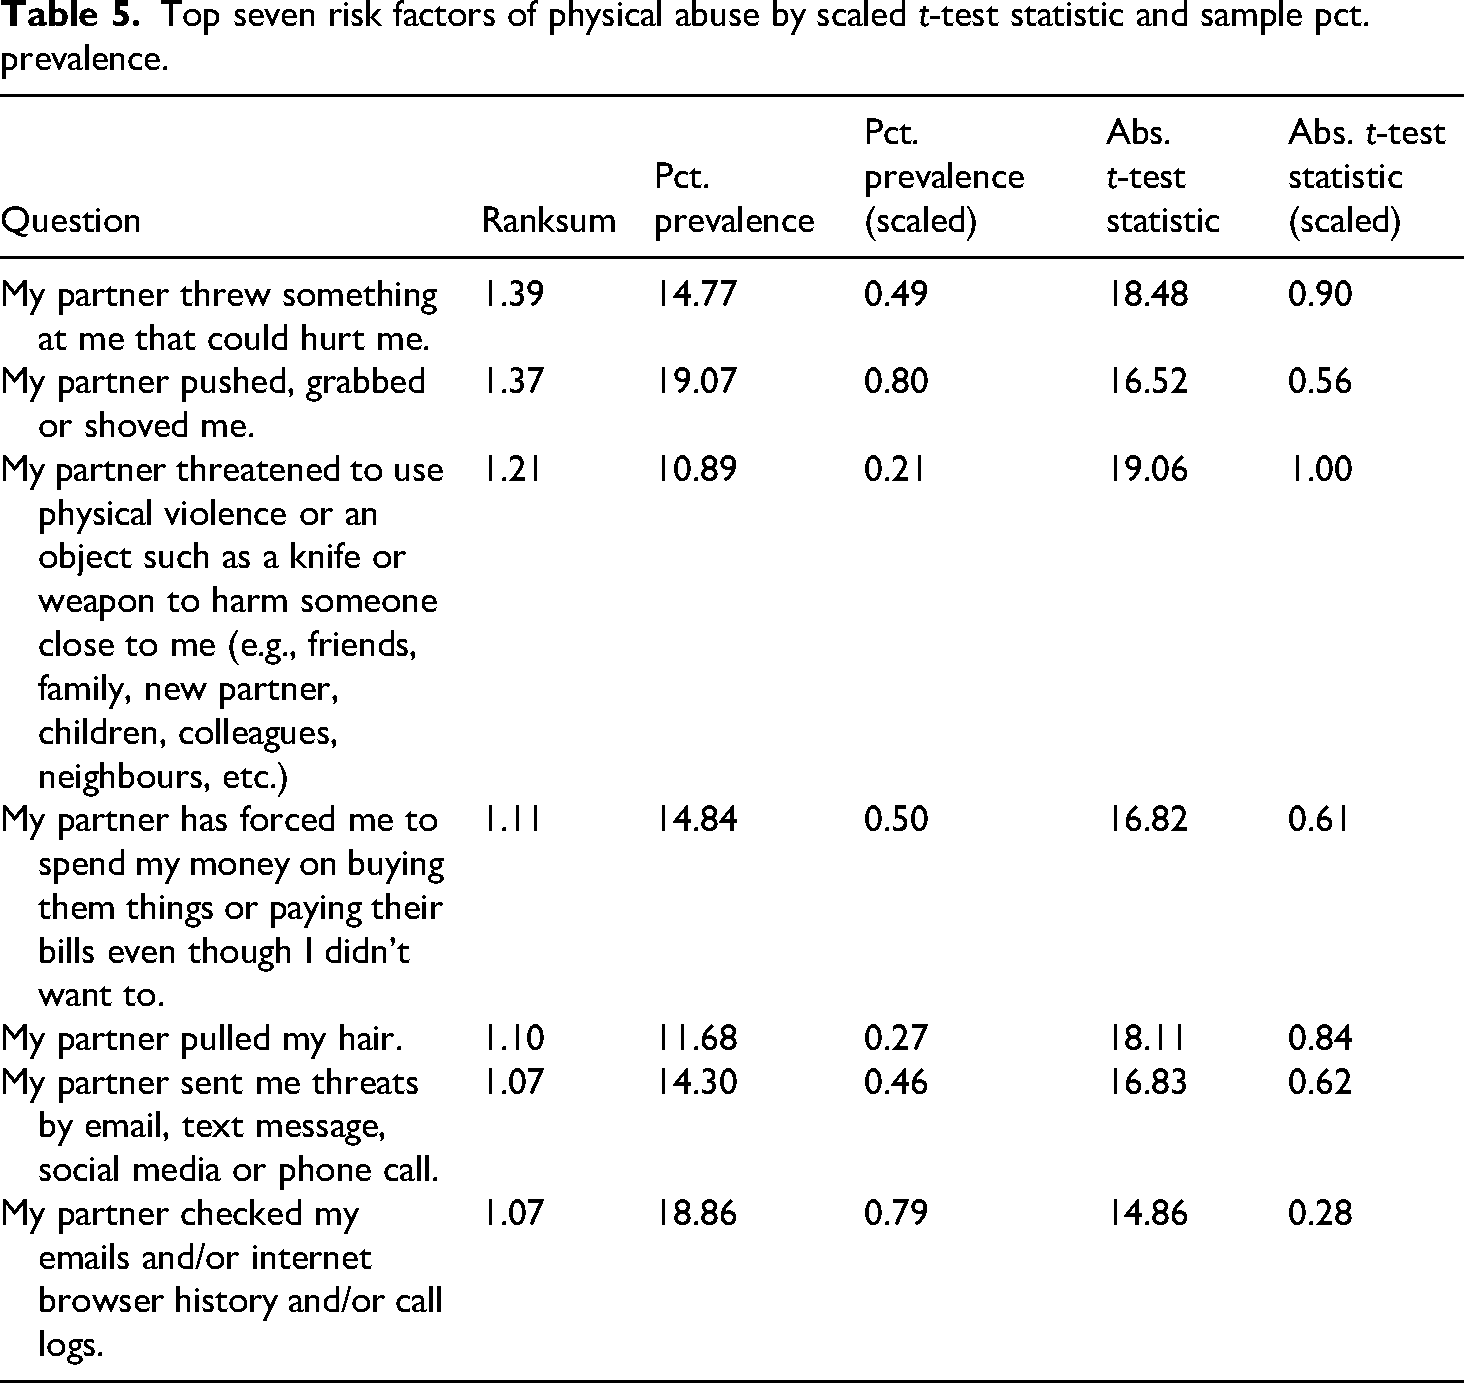
From the top seven risk factors by t-test statistic and percentage prevalence (Table 5), two models were further tested – one with three physical risk factors (including threats) and one with four, both totalling six risk factors. The model with the best validation AUC score included all the risk factors aforementioned (Table 6) except for ‘My partner pulled my hair’. This ranking method was applied using different weightings to the t-test statistic and pct. prevalence, but an equal weighting gave the best results.
Evaluation of the model's average performance across configurations.
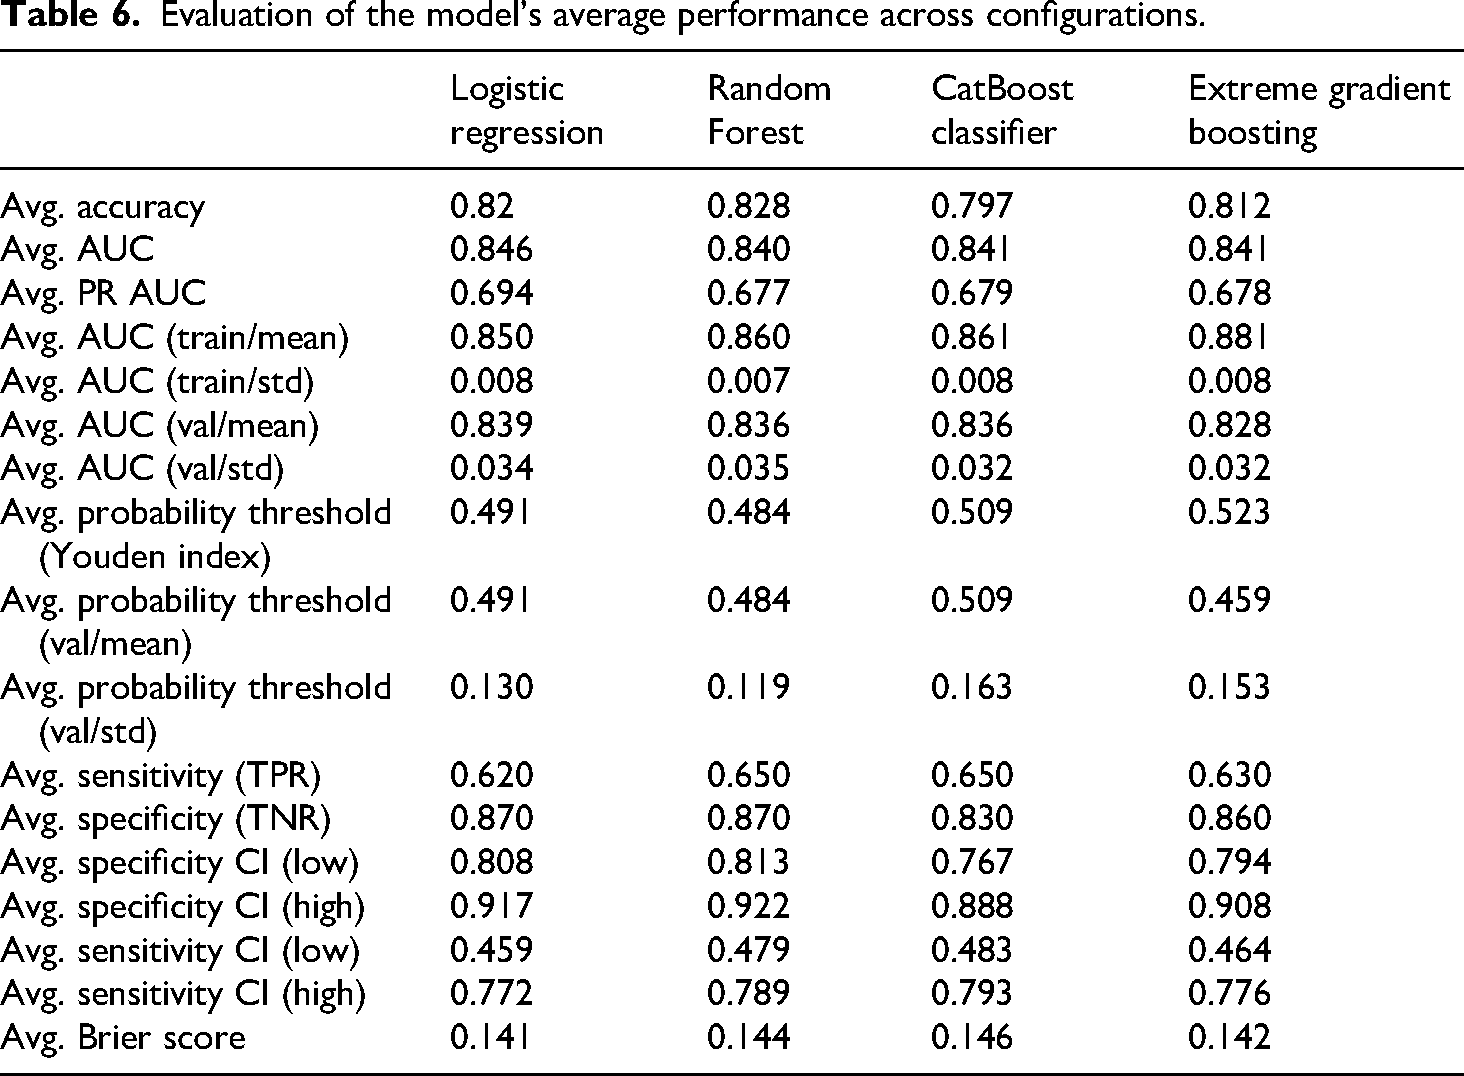
We compared the four algorithms using the average Accuracy, AUC, Recall (Sensitivity), Specificity, Precision, and Brier score across model configurations by algorithm. The average test accuracy score of the Logistic Regression, CatBoost, Random Forest, and XGBoost algorithms for our sample was 0.82, 0.80, 0.83 and 0.81, respectively, as shown in Table 6. The logistic regression algorithm performed best on AUC and Brier scores, with the highest AUC score of 0.85 and the lowest Brier score of 0.141, indicating better calibration. The Random Forest algorithm performed best with an accuracy of 0.83, but the train-validation AUC scores showed slight overfitting, with a ∼0.03-point difference. Regarding AUC, all models had a score between 0.84 and 0.85, with logistic regression performing best and Random Forest performing the worst. Figure 6 displays the Receiver Operating Characteristic curves for each model. The predictors were also associated with a high internal consistency with a Cronbach's alpha of 0.894 [0.884, 0.904]. When using only the non-physical predictors from the six predictors, the performance of the logistic regression drops to 0.78 AUC.
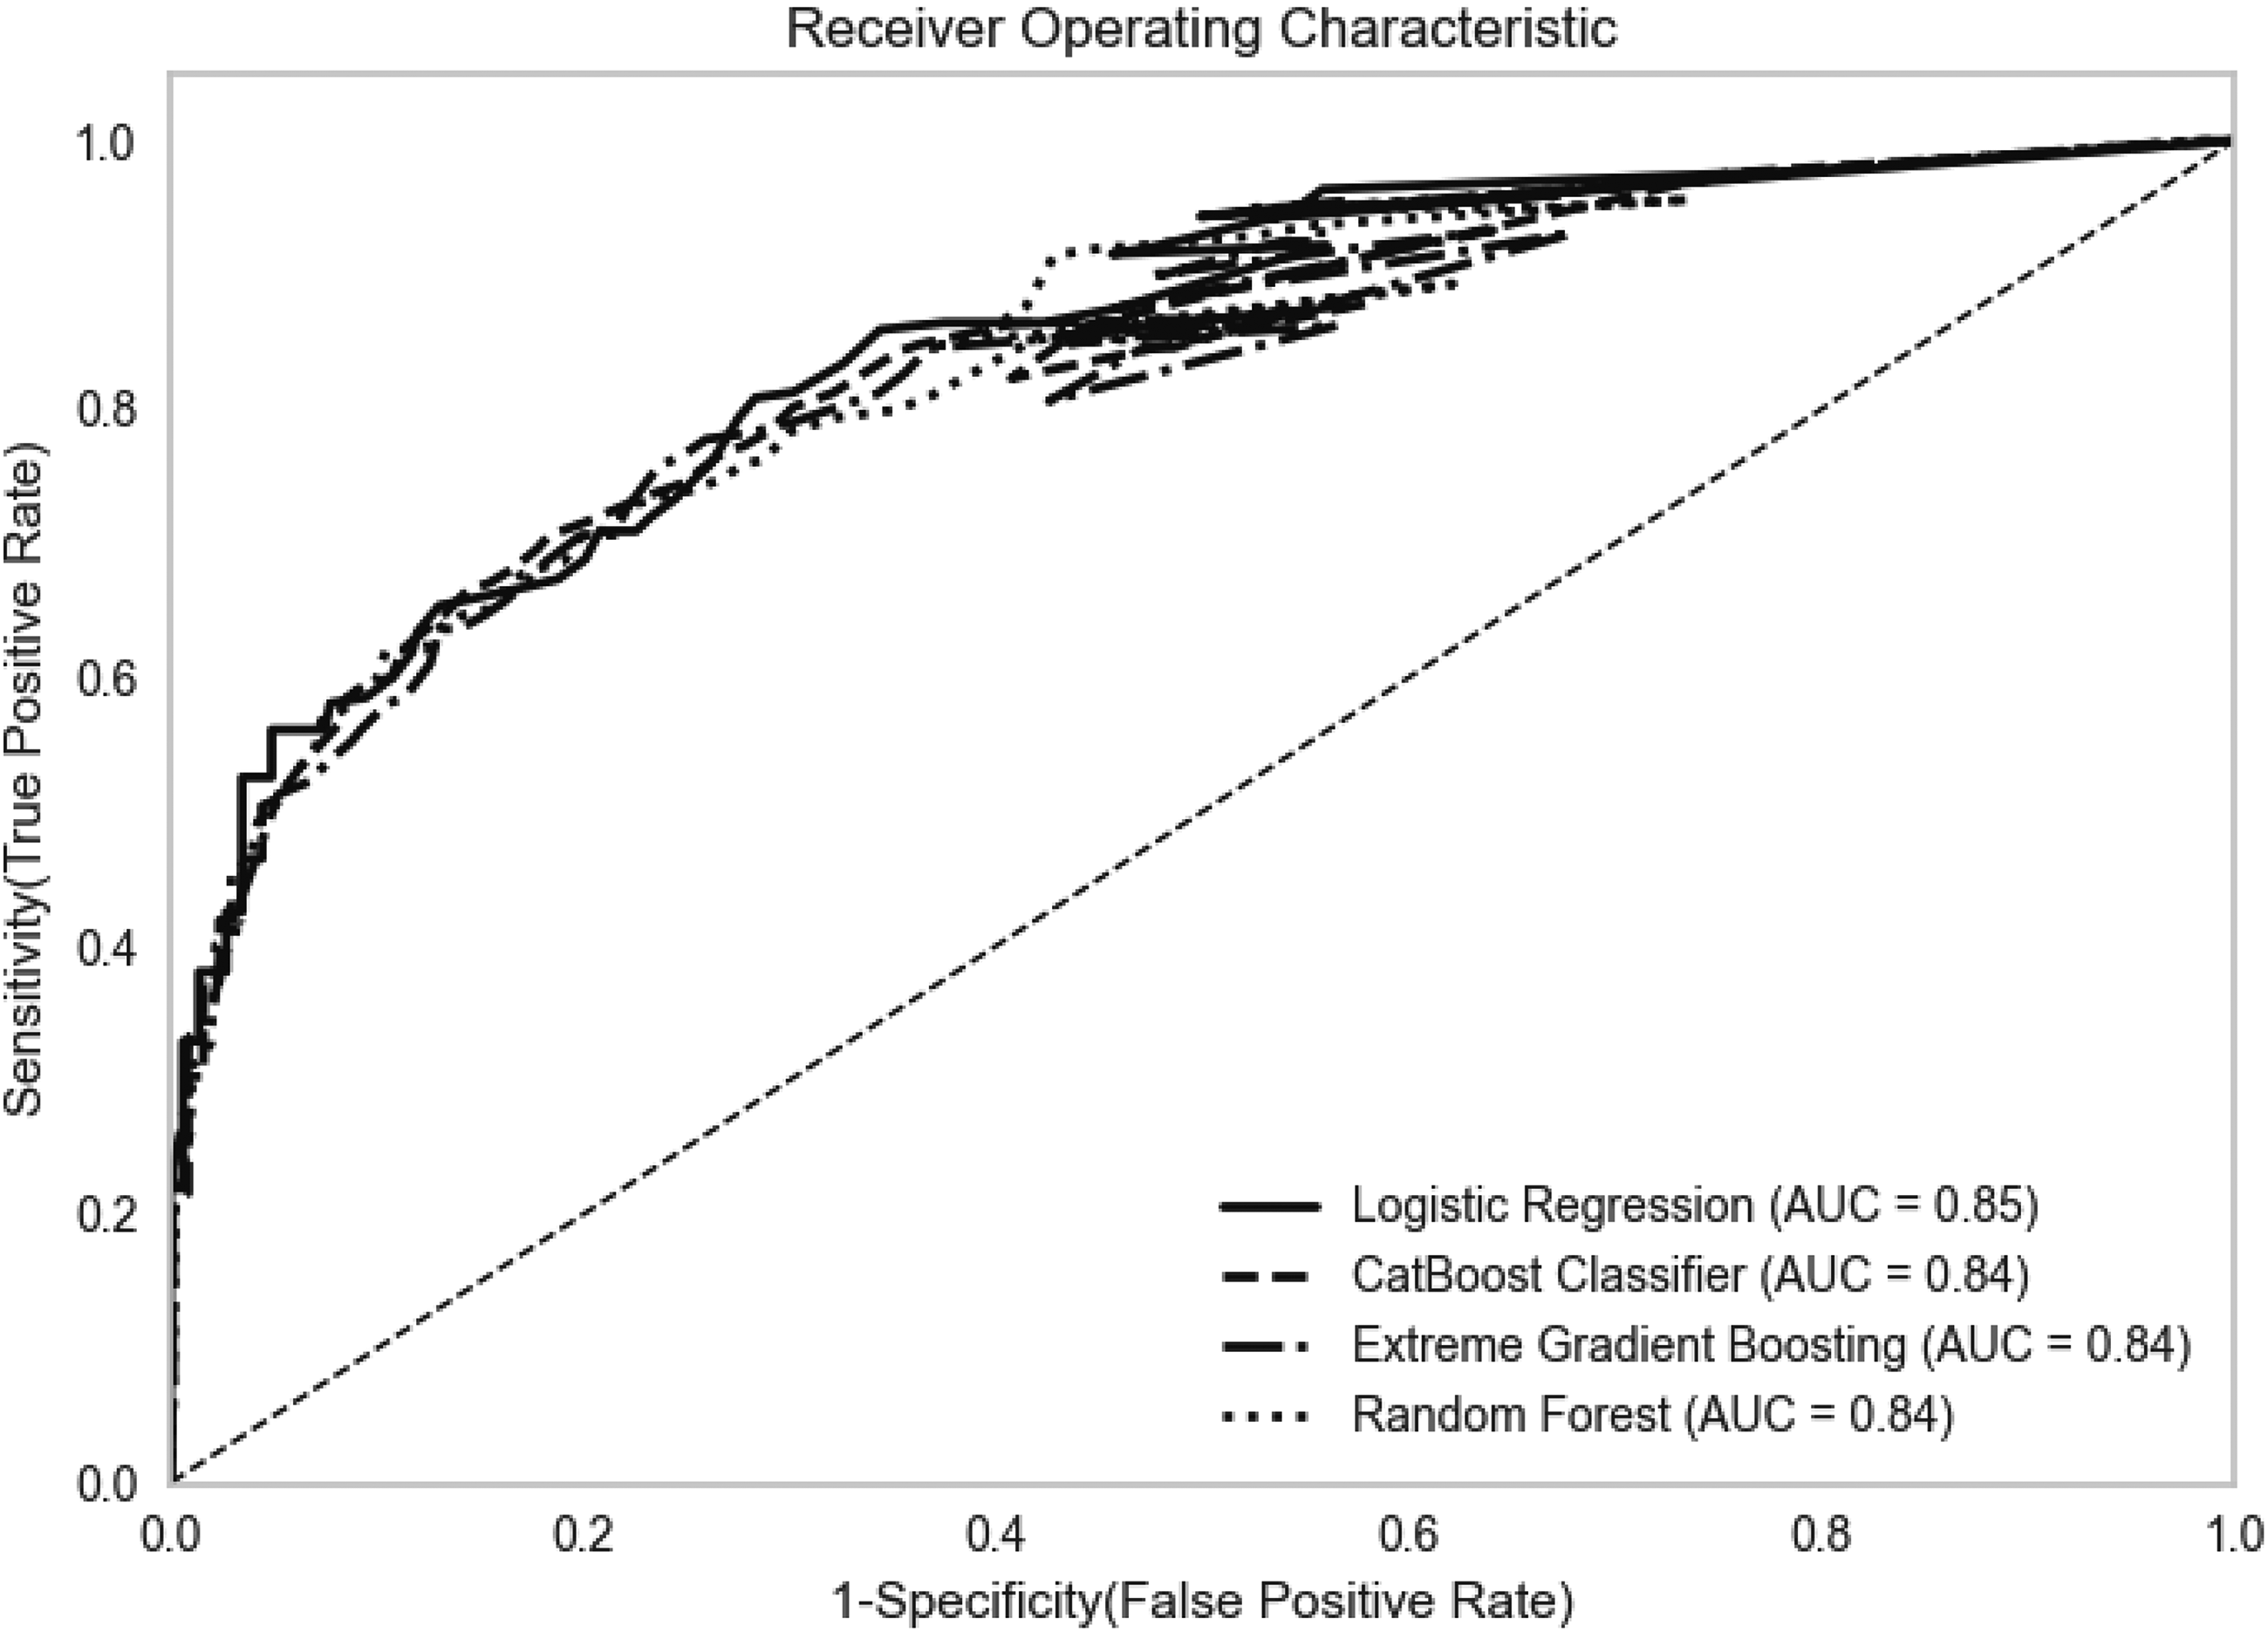
ROC curve (average) across the five outer cross-validation folds with k = 6.
Discussion
To build Lizzy, a novel IPV risk assessment tool based on nationally representative data, our model development approach deviated from existing actuarial methodologies through two critical changes. First, a comprehensive evaluation of 18 machine learning algorithms, expanding beyond the limited model sets typically employed in risk assessment, and second, a sophisticated feature selection approach integrating both univariate and multivariate methods. Our methodology leverages parametric and non-parametric statistical tests (t-test, Wilcoxon Rank-Sum test), regularisation techniques (Lasso regression), and stepwise selection methods (forward/backward elimination). The number of predictors was tested as a function of the validation AUC value. We found that a longer risk assessment is not necessarily better for predictive validity and chose six as the number of predictors to be input into the models. This is significant as longer risk assessments can be difficult to administer due to the psychological burdens imposed on victims and the time pressures faced by practitioners. Accuracy scores ranged from 0.80 to 0.83 and AUC values from 0.84 to 0.85, with XGBoost performing the worst (due to overfitting) and logistic regression performing the best. Our findings also demonstrate that multiple linear regression models using representative data can outperform conventional tools by >0.20 points and surpass the minimum threshold set by Lamb of 0.70. This is important as DA risk assessment tools are increasingly being used in criminal justice settings (CJS) and social services to inform and determine outcomes (Viljoen et al., 2018).
The top six factors identified as most relevant by feature importance were:
1. A partner threw something at them that could hurt them. 2. A partner pushed, grabbed, or shoved them. 3. A partner threatened to use physical violence or an object such as a knife or weapon to harm someone close to them. 4. A partner forced them to spend their money on buying things or paying bills even if they didn’t want to. 5. A partner sent them threats by email, text message, social media, or phone calls. 6. A partner checked their emails, internet browser history, or call logs.
Consequently, the most significant predictors of future physical violence appear to be a combination of prior physical abuse and coercive control, according to the predictors tested. It is important to note that one key benefit of this research is the identification of proxies. Risk assessments can provide false negatives where victims are unwilling to disclose abuse suffered due to fear of criminal justice or social service interventions, or where they do not perceive themselves to be victims of certain crimes or wish to disclose victimisation (Felson and Paré, 2005; Hassanpour et al., 2025). Consequently, using various forms of abuse across different levels of severity as indicators of future risk may increase the likelihood of physical abuse predicted from behaviours disclosed. This identification is essential for protecting victims.
Another significant shift emerging from this study, compared to conventional risk assessments, is the adoption of a shorter follow-up period of three months between data collection. This timeframe is informed by research which suggests that help-seeking might be linked to shorter durations of IPV, with most victims seeking help within the first three months after their initial experience of violence (Trafford and Le, 2024). Trafford and Le's analysis also shows that nearly half of abusive relationships last less than two years. It is therefore unlikely that tools predicting that a victim may be revictimised within the next 5–8 years provide sufficiently actionable information to improve emergency workers’ case management. In contrast, a three-month horizon aligns more closely with the behaviour patterns of victim populations and offers a critical window for effective intervention.
Looking ahead, pilot tests and consultations with practitioners and victims in the field and across different settings are needed to further develop Lizzy into a tool that, in addition to providing accurate risk assessments, can guide helpful risk- and needs-based risk management strategies (Graham et al., 2021; Jose Medina Ariza et al., 2016; Robinson et al., 2018; Spivak et al., 2021). This would reduce the likelihood of unintended consequences and help understand how the tool could affect risk management processes already in place. Furthermore, as the data was built on a nationally representative sample and as Trafford and Le's (2024) research has shown, there are subtly different typologies in the victims who approach various settings; there is a chance that Lizzy's accuracy would change in setting-specific environments.
Limitations
There were some limitations in the present study. Firstly, respondents might have been inhibited from fully disclosing their IPV experience due to the topic's sensitivity. However, the online research design enabled responses which reduce the potential of social desirability bias (Sperber et al., 2023). Additionally, using a nationally representative sample increases the validity and reliability of collected and relied upon data. This is because it avoids inaccuracies and biases prevalent in CJS data (Jose Medina Ariza et al., 2016) and avoids focusing on a targeted sub-sample of victims (Graham et al., 2021). Yet, using a nationally representative sample can also raise limitations. For example, prior research conducted by the authors has shown that victims who approach one setting are often slightly different to victims who approach another. This means that whilst Lizzy may be effective on a nationally representative sample, determining accuracy and applicability to specific settings (such as within criminal justice agencies and health services) will require further validation studies to understand and evaluate the impact of setting-specific targets and practitioner usage for risk assessment tools. Limitations also arise concerning the forms of data that can be collected at a national level. Due to limitations on data collection in Germany (Weider, 2025), it has not been possible to collect data on the ethnicity of victims and their abusers or to determine the accuracy of Lizzy across ethnicities.
Additionally, the choice of predictors is constrained to information available to the victim. This precludes characteristics about the perpetrators, such as psychological variables and other predictors, which are known to be strongly correlated with violent IPV and violent recidivism (Garcia-Vergara et al., 2022; Gerino et al., 2018; Yakubovich et al., 2018). This was a deliberate choice, as our aim in creating Lizzy was to develop an accurate, evidence-based, yet user-friendly DA risk assessment tool that frontline workers can easily and quickly administer without requiring substantial prior training or access to data from other agencies. Similarly, we chose to limit Lizzy to cases involving female victims and male perpetrators to reflect the disproportionately high prevalence of reportage of IPV among women. To the authors’ knowledge, no validated risk assessment for male victims or victims in same-sex relationships exists to date. However, since none of the questions are gender-specific, there is a strong case for validating the tool on more diverse samples. We also chose not to include sexual abuse as a potential predictor in the feature selection procedure due to the potential inhibitive impact on victims’ disclosure of abuse (Felson and Paré, 2005; Hassanpour et al., 2025). Future research could consider how direct questions about sexual abuse impact disclosure rates and/or violence prediction.
Finally, like many other risk assessment tools, the current version of Lizzy does not provide guidance on risk management strategies tailored to different risk levels (Lamb et al., 2022). However, access to data on emotional, financial and digital abuse enables the development of multiple models by type of abuse. These models could assist frontline workers in establishing risk profiles that differentiate by type of abuse, thereby contributing to more risk- and needs-driven risk management (Viljoen et al., 2018). Whilst comparisons to other risk assessment tools are difficult due to the varying reporting levels in construction studies (Graham et al., 2021), the creation of Lizzy builds upon and enhances current conventions by utilising a nationally representative sample, combined with a prospective design, to harness the power of AI.
Conclusion
In conclusion, our study utilised machine learning techniques and nationally representative online survey data to identify IPV risk factors in Germany and build an IPV risk assessment tool which we have called Lizzy. The predictors were selected via t-test with a minimum Cohen's d of 1 and were associated with a high internal consistency with a Cronbach's α of 0.894 [0.884, 0.904]. The logistic regression algorithm performed best on AUC and Brier scores, with the highest AUC score of 0.85 and the lowest Brier score of 0.141, indicating better calibration. Average sensitivity was 0.64, and the average specificity was 0.86 at a cutoff-point at the Youden-index. The results demonstrate that machine learning classifiers, such as logistic regression, performed well in predicting IPV recidivism and that the length of the risk assessment tool does not correlate with predictive performance. This supports the case for developing short, yet accurate, tools to predict violent recidivism in IPV cases. It also demonstrates that proxies are effective in predicting the re-occurrence of physical abuse in female victim populations alongside physical risk factors.
Supplemental Material
sj-docx-1-euc-10.1177_14773708251412637 - Supplemental material for Beyond physical violence: A machine learning framework for predicting IPV victimisation using multidimensional predictors
Supplemental material, sj-docx-1-euc-10.1177_14773708251412637 for Beyond physical violence: A machine learning framework for predicting IPV victimisation using multidimensional predictors by Ba Linh Le, Lucy Trafford, Sabina Firtala and Babatunde Williams in European Journal of Criminology
Footnotes
Funding
The author(s) disclosed receipt of the following financial support for the research, authorship, and/or publication of this article: This work was supported by the German Federal Ministry of Economy and Climate Action and the European Social Fund (Grant No. 03EGSBE582).
Declaration of conflicting interests
The author(s) declared no potential conflicts of interest with respect to the research, authorship, and/or publication of this article.
Supplemental material
Supplemental material for this article is available online.