
Abstract
It is well known that both deprivation and alcohol availability are associated with violent crime. However, less is known about whether the former moderates the latter. Pioneering the linkage of novel alcohol availability measures derived from consumer data with police data and an index of deprivation, we examine inequalities in violent crime across small-level geography (LSOAs) for the whole of England. Our findings confirmed a recent upward trend in recorded violent crime in England between 2011 and 2018 and substantial between-area variability in recorded violent crime, as well as an increase in violent crime inequality across LSOAs during the period of analysis. Violent crime was higher in areas with increased deprivation and alcohol availability, especially in the form of on-licensed premises. On-licence availability, in the form of pubs, bars and nightclubs, explained variability in recorded violent crime more so when compared with off-licence availability. A positive interaction effect between alcohol availability (in the form of on-licensed premises) and deprivation showed how deprivation amplified the impact of alcohol availability, with more deprived areas having a stronger impact of on-licence availability on violent crime. Deprivation is thus an important contextual factor when considering rates and the social ecology of violence. Our findings suggest a need to respond to the disproportionate impact of violence on areas with higher levels of deprivation and availability of on-licensed premises.
Introduction
This study explores whether alcohol availability and deprivation in local areas affect rates of violent crime. It builds on research examining whether the availability of alcohol outlets is correlated with violent crime rates to include consideration of whether deprivation moderates their impact. Hitherto, studies have identified a positive association between alcohol outlet availability and violence, although the evidence pertaining to the contribution of on- and off-licences therein is mixed. 1 There is also a well-established literature confirming a correlation between deprivation and violent crime. However, combined consideration of these correlates of violence is less common and, to date, these have not been considered when examining recent trends in violent crime in England. Consideration of both deprivation and alcohol availability is important because it remains unclear to what extent these are independently driving trends in violence and whether deprivation modifies the impact of alcohol availability on violent crime. Such insights can illuminate how best to target social policy, such as alcohol licensing, public health and crime prevention, aimed at ameliorating violence.
Pioneering the linkage of novel alcohol availability measures derived from consumer and police data as well as an index of deprivation, we performed an ecological (area-level) analysis of recent temporal trends in violent crime between 2011 and 2018 and explored the effect that deprivation and the availability of alcohol outlets had amongst Lower-layer Super Output Areas (LSOA) in England. Our alcohol availability measures offered an opportunity to separate out the impact of the availability of on- and off-licences on violence. The police data we utilized captured violent crime in the form of offences against the person such as common assaults, grievous bodily harm and sexual offences. 2 The longitudinal component of these police data allowed us to specify growth curve models to explore the following research questions:
What is the impact of area-level deprivation on violent crime?
What is the impact of area-level alcohol availability on violent crime?
Is the impact of alcohol availability moderated by deprivation?
Background
Crime rates have been declining across most Western societies since the early 1990s (Farrell et al., 2014). According to the Crime Survey for England and Wales (CSEW), violence also fell between 1995 and 2013/14 (Ganpat et al., 2020). However, more recently this trend has been called into question as police-recorded crime figures for violent crime roughly doubled between 2013 and 2017, whereas victimization survey data showed a flattening of the downward trend in violence since 2014 (Elkin, 2019; Flatley, 2018b).
Key to resolving outstanding questions as to whether violence is on the rise or not, and furthering our understanding of the mechanisms behind that change, is looking closely at the correlates of change in violent crime. Most analyses of violent crime rates across time are presented at the aggregate (national) level, thus obscuring area-level variation within such trends (Britten et al., 2012; Elkin, 2019; Flatley, 2018b; Walby et al., 2016). One exception examined variability in crime trends using longitudinal data to explore characteristics and trajectories of neighbourhood crime rates over time but did not disaggregate analysis by crime type or explicitly focus on violence (Bannister et al., 2017). And, although other scholars have also tried to establish whether any previous reduction in crime was equitable across different population segments (that is, in the case of burglary; Hunter and Tseloni, 2016), no studies of violent crime have assessed the variability across local areas conditional upon deprivation and alcohol availability.
Indeed, there have been limited empirical studies examining recent violent crime rates in England and Wales in relation to socio-economic deprivation (asides a study of domestic violence; Walby et al., 2016), and fewer still focus on alcohol-related violent offending. This is surprising given both distribution and impact of crime and alcohol-related harm (including violence) are also known to be associated with deprivation (Erskine et al., 2010; Hsieh and Pugh, 1993; Pease and Ignatans, 2016; Sadler et al., 2017; Whitworth, 2012). And given a routine association between both alcohol outlet density, associated consumption, and violence (Britt et al., 2005; Bye, 2007; Livingston, 2008). The literature relating to each of these points will be reviewed in turn below.
The role of alcohol availability
From an alcohol control perspective, scholarly interest has focused on the general consumption hypothesis, with greater outlet availability serving as a proxy for greater alcohol consumption. From this perspective, previous studies have tended to explore the impact of alcohol availability on all crime or aggregate harms more generally (Gmel et al., 2016; Holmes et al., 2014), with fewer focusing on violence specifically. Many studies exploring the impact of the spatial and temporal availability of alcohol on its consumption and related harms are also local and/or regional in their scope (predominantly based on US and Australian case studies; Holmes et al., 2014; Livingston, 2008), which limits their external validity. Moreover, national studies have potential to supplement findings at the local level that have shown promise of the impact of local alcohol licensing decisions in mitigating the effects of alcohol misuse (for example, De Vocht et al., 2020).
Alcohol consumption is known to impact upon changes in violence rates over time (Bye, 2007). And an association between alcohol availability and crime, including violence, has been well established. Indeed, the availability of alcohol outlets is a key contextual factor in the ecology of violence because greater numbers of and proximity to outlets provide individuals with more access and opportunities to consume alcohol (availability theory; Stockwell and Gruenewald, 2004) as part of their ‘routine activities’ (Clarke and Felson, 1993). From a crime control perspective, increased drinking opportunities result in further opportunities to engage in violence owing to an increase in the bringing together of (likely) intoxicated offenders and impaired victims (suitable targets), who often encounter each other in time and space, for example in night-time economy settings (location) (known as the crime triangle; Cohen and Felson, 1979).
The (spatial) availability of alcohol – in terms of both density of and proximity to alcohol outlets (Angus et al., 2017; Foster et al., 2017; Huckle et al., 2008; Morrison et al., 2015a) – is known to impact the probability of violence using a range of different violence outcome measures (Cameron et al., 2016; Campbell et al., 2009; Holmes et al., 2014; Livingston, 2008, 2011). For example, Livingston (2008) explored the longitudinal relationship between alcohol outlet density and assaults in communities in Melbourne, Australia, using police data and observed a positive relationship between changes in the number of alcohol outlets and the volume of assaults using fixed effects models. As in Livingston’s (2008) study, we also deem it important to disaggregate the impact of alcohol availability by on- and off-licence premises.
There is a differential theoretical impact of on- and off-licences on violence. In the case of on-licence premises, not only does increased access increase availability, but premises also serve as ‘crime attractors’ (Brantingham and Brantingham, 1993, 1995) in that such venues offer an opportunity for (intoxicated) individuals to come together. Where patrons do so in and around these venues a range of individual and situational factors, including intoxication of patrons, in turn increase the probability of violence outcomes (see Graham, 1980; Graham and Homel, 2008). The focus, from a crime prevention stance, has tended to be on on-licence premises (especially in night-time economy settings and city centres), as a setting in which the type and density of alcohol outlets allows violence to ‘situationally’ cluster as a result, because these are thought to facilitate to violence.
Off-licence premises also increase the availability of alcohol for public and domestic consumption – and, as such, operate similarly to on-licence premises. They do not necessarily encourage violence any less; however, the increased alcohol consumption that results tends to occur elsewhere, for example within unsupervised domestic environments, and so has the potential to increase the severity, risk of injury and probability of violence in such settings (Leonard, 2005; Taylor et al., 2010). A distinction between on- and off-licence premises is thus important in acknowledging the varying mechanisms by which violent behaviour could arise. Scholars have engaged with this issue, but the evidence on the association of outlet density and violence is mixed (Cameron et al., 2016; Gmel et al., 2016). That being said, most studies identify a greater density of outlets with increased alcohol consumption and associated harms, including violence (Campbell et al., 2009), and most have identified the association as stronger for on-licences compared with off-licences (Cameron et al., 2016; Gmel et al., 2016; Marco et al., 2017; Morrison et al., 2015a).
The role of deprivation
An association between deprivation (as a proxy for either offender motivations or strained social relations within deprived communities (see social disorganization; Shaw and McKay, 1942)) and crime, including violence, has also been well established. Such explanations purport that social disorganization – in which low economic status plays a key role (see Shaw and McKay, 1942) – contributes independently to the distribution of crime, including violence, in neighbourhoods (Gruenewald et al., 2006; Mair et al., 2013) by eroding informal social control and reducing collective efficacy (Sampson et al., 1997). Consequently, more unequal and deprived settings are considered fertile grounds for violent behaviour in that they increase polarization and corrode a sense of community and trust, leading to more violence (Wilkinson, 2004; Wilkinson and Pickett, 2009).
Given the non-uniform way in which crime and victimization are distributed according to geography and deprivation more generally (Hunter and Tseloni, 2016; Pease and Ignatans, 2016; Whitworth, 2012), it is likely those from more deprived areas are experiencing more alcohol-related violent crime than individuals in less deprived areas. Moreover, recent evidence from the CSEW points to disadvantaged socio-economic groups in England and Wales experiencing a disproportionate volume of alcohol-related violence, when studied at the individual level (Bryant and Lightowlers, 2021).
Alcohol outlet availability further increases the risk of violent outcomes where outlets are located in deprived or ‘high risk’ environments by providing ‘opportunities for at-risk populations to mix in potentially troublesome circumstances’ (Gruenewald, 2007: 873). Indeed, it has been observed that, although the availability of alcohol outlets presents independent risks for violence, they have a greater impact in socially disorganized neighbourhoods (Gruenewald et al., 2006), likely due to the socio-economic stratification of drinkers (Gruenewald, 2007). Studies have also identified, more generally, significant variations in the spatial availability of outlet type and deprivation and that alcohol availability amongst lower socio-economic groups encourages alcohol consumption (Angus et al., 2017; Morrison et al., 2015b; Shortt et al., 2018). Moreover, off-licence premises are known to be more densely clustered in disadvantaged areas (Shortt et al., 2015), potentially compounding this problem further; especially as those living in more privileged areas are likely better equipped to mitigate the impact of licensed premises and object in the licensing process, as well as make demands on policing resources (Martinez et al., 2008).
Socio-economic distribution of alcohol-related harm
Studies have highlighted how harm associated with alcohol consumption is not uniformly experienced by socio-economic groups; rather that rates of alcohol-related harm are higher in more deprived areas (Erskine et al., 2010). Indeed, a growing body of evidence highlights that those of low socio-economic status are more susceptible to and suffer a disproportionate share of the harm associated with alcohol consumption (despite drinking less or similar amounts) – a phenomenon known as the ‘alcohol harm paradox’. Rather than criminal justice outcomes (such as reported violent crime), such scholarship to date has centred on health harms such as morbidity and mortality related to alcohol consumption (see Bellis et al., 2016; Katikireddi et al., 2017; Mäkelä and Paljärvi, 2008; Robinson et al., 2015; Sadler et al., 2017). However, it is plausible that this patterning of harm extends to the consideration of violent crime. Moreover, scholars such as Katikireddi et al. (2017) readily acknowledge the narrow definition of harm employed in their study and the need for researchers to examine the socio-economic distribution of a broader range of harms associated with alcohol.
Our approach
Based on insights from the evidence on the impact of alcohol availability on violent crime, the known socio-economic distribution of crime and violence, as well as the unequal distribution of alcohol-related health harms and crime, we contend it is important to consider the impact of both deprivation and alcohol availability on violence. Consideration of both these correlates of violent crime in tandem is relatively sparse. As such, questions remain as to what extent deprivation and alcohol availability independently drive trends in violence and whether deprivation modifies the impact of alcohol availability on crime. Informed by an alcohol control perspective, our approach and research questions (as outlined above) specifically sought to test the moderating effect of deprivation on alcohol availability (as opposed to testing whether alcohol availability is statistically moderating the effect of deprivation on violence).
Methodology
Data
To examine change in violent crime conditional upon alcohol availability and local levels of deprivation, we used longitudinal violent crime data in England with high geographical resolution. The secondary data analysis pursued here involved merging three key datasets: (i) police-recorded crime data for England (calendar years 2011–18), (ii) items that comprise the English Index of Multiple Deprivation (IMD 2015), and (iii) indices of local alcohol availability for England in 2016. Although police and alcohol availability data were available for Wales, the Indices of Deprivation in these two areas are not comparable and analyses will be constrained to England for the purposes of this study.
The first two datasets are publicly available via the national website for policing in England, Wales and Northern Ireland (https://www.police.uk) and the UK government statistics website (https://www.gov.uk). The local alcohol availability measures are ranked indices based on median distances to alcohol outlets, calculated for pubs, bars and nightclubs (on-licensed premises) and a separate measure for off-licences. These were taken from a newly derived Access to Healthy Assets and Hazards dataset, which comprises a range of health-promoting and health-negating measures based on retail business data held by the Consumer Data Research centre (CDRC) and provided by the Local Data Company (LDC) (Green et al., 2018).
All data for England were merged at the LSOA level (N = 32,844 in England). LSOAs are designed to be of a similar population size with an average of 1500 residents in each. This in effect standardizes by population count in subsequent analyses.
Police-recorded crime data
Administrative police-recorded crime data for England represent a rich resource with which to examine crime trends. Police-recorded crime statistics cover all offences that are notifiable to the Home Office by the police. 3 Although these data do not capture all criminal offences (for example, notably those not brought to the attention of the police – the ‘dark figure’ of crime), they comprise a wide range of offences, including homicide, death by dangerous driving, threats, stalking and harassment (Flatley, 2018a). They thus provide a readily available data source on violent crime for monitoring subnational and short-term trends within England. In these data, violent and sexual crimes are combined into a category of ‘violent and sexual offences’ thus including offences such as rape, stalking and harassment, other sexual offences, and death or serious injury caused by illegal driving, violence with and without injury, and homicide. 4
Changes in reporting or recording practices mean that interpretation of longer-term trends in police-recorded crime data can be problematic, and these data cannot be used uncritically (for further detail, see Flatley, 2017). Nonetheless, they provide a more reliable source of information for more harmful forms of violence when compared with the CSEW (Elkin, 2019; Flatley, 2018b) because they include more extreme offences such as homicide (around half of which are thought to have involved alcohol intoxication; Brookman, 2000; Shaw et al., 2006). Police data also offer the necessary detail at low geographical level (that is, street level) for the whole of England (something the CSEW sampling strategy and sample size of around 35,000 cannot offer). Indeed, the CSEW sampling strategy is not suitable for small area analyses, especially when disaggregating by crime type (see, for example, Buil-Gil et al., 2021). Police data are thus often used for local crime-pattern analysis and for informing cumulative impact assessments (which are used to assess the broader health and safety/wellbeing impacts of licensing decisions).
Monthly downloads of police data are available for only the last three years at the time of download (see https://www.police.uk); these data were appended to data from the same source already collected by the authors dating back to January 2011 to cover the period 2011–18. 5 Data entries in the original downloads represent occurrences of crimes and include detail on where these occurred (street level). We aggregated violent crimes by year and 2011 LSOA, 6 creating a new measure capturing the number of violent crimes recorded per month and per LSOA. In some LSOAs, crime is relatively infrequent and there are months when no crime was recorded; in such cases, zero observations were backfilled. Although the study period represents a relatively short time-frame (96 months), the longitudinal dimension of the data affords the possibility of detecting area-level variability across time and higher statistical power compared with cross-sectional data. Analyses accounting for area-level heterogeneity allow us to examine whether violent crime is on the rise and whether this is occurring at differential rates across more privileged versus more deprived LSOAs, and/or in areas with higher/lower alcohol availability. The dataset generated is the first of its kind in terms of national coverage and spatial resolution. The analysis window of observation therefore covers the period 2011–18, capturing 7,656,411 violent crimes in total. The distribution of those violent crimes by year is displayed in Figure 1, which confirms an upward trend: the number of violent crimes more than doubled between 2011 and 2018 (an increase of 931,080 crimes over this period).
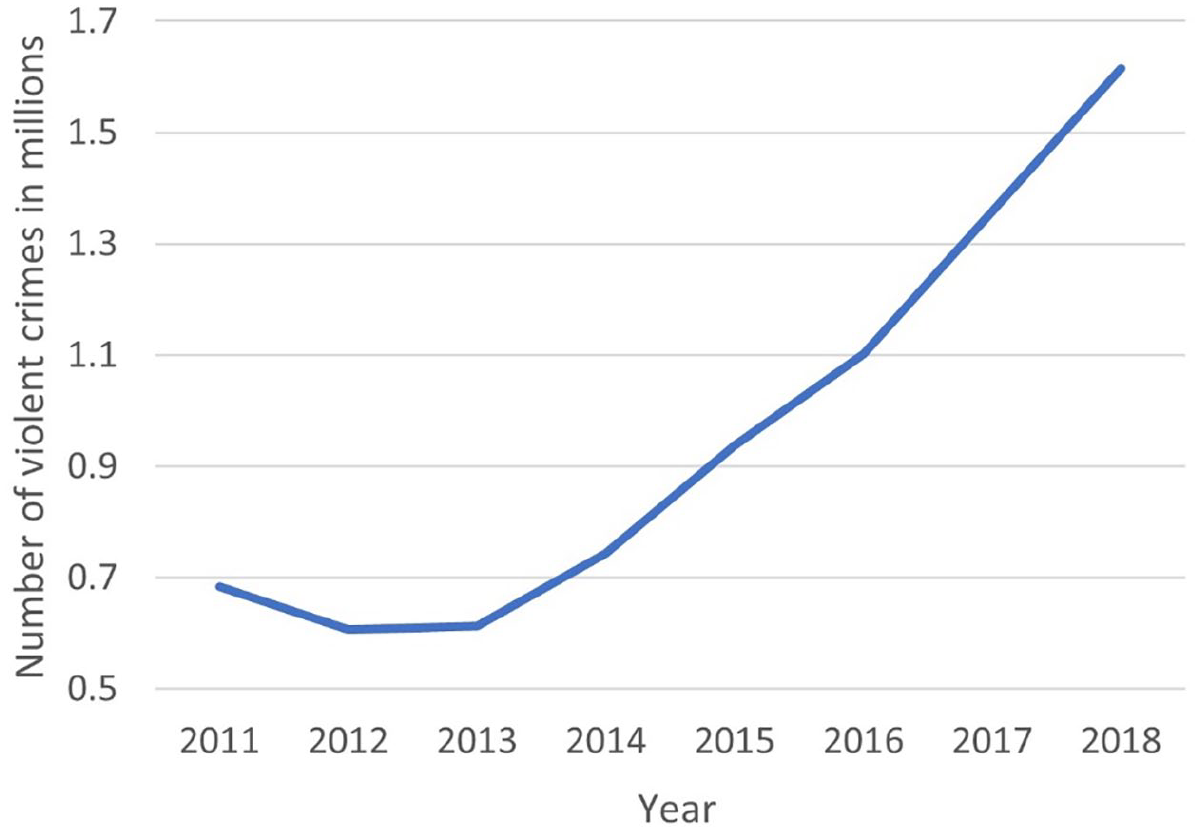
Number of violent crimes recorded in England by year, 2011–18.
Index of Multiple Deprivation
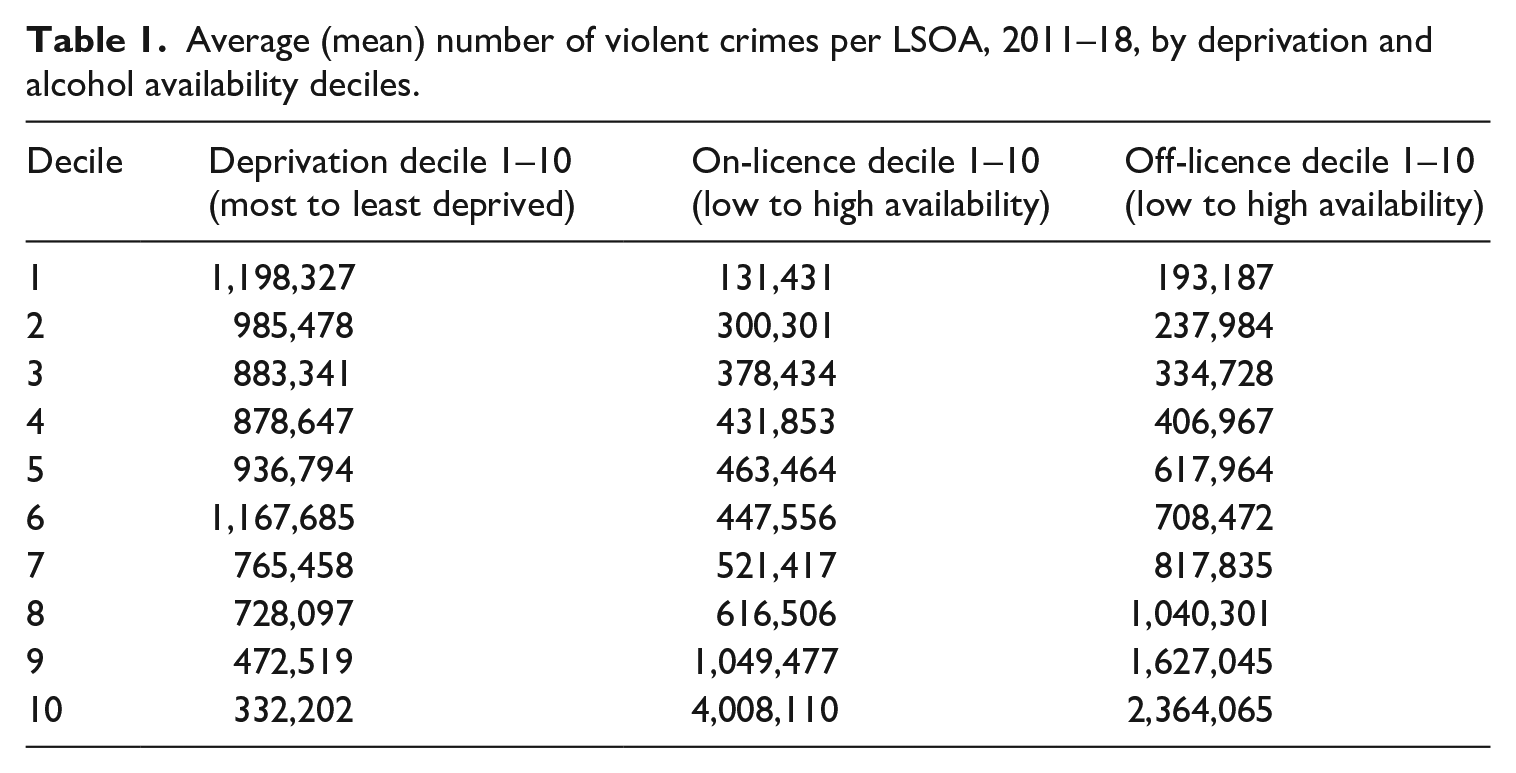
The IMD represents an official measure of relative deprivation in LSOAs in England, ranking each of the LSOAs from the most to the least deprived. It combines information from seven domain indices to produce an overall relative measure of deprivation, with its multidimensional nature offering a key strength (Noble et al., 2006). The seven domains are: Income Deprivation; Employment Deprivation; Health Deprivation and Disability; Education, Skills and Training Deprivation; Crime; Barriers to Housing and Services; and Living Environment Deprivation. 7 Deprivation scores for LSOAs are published alongside their ranks and deciles to describe the relative level of deprivation in the area – the larger the score, the more deprived the area. IMD scores for 2015 were employed as a time-invariant variable. To avoid issues of circularity in the regression modelling, original scores were recalculated to exclude the crime domain. The mean number of violent crimes by deprivation decile are reported in Table 1, which highlights – as expected – how violent crime is positively associated with higher levels of deprivation.
‘Access to Healthy Assets and Hazards’ data
The ‘Access to Healthy Assets and Hazards’ dataset comprises a range of health-promoting and health-negating measures based on retail business data held by the CDRC and provided by the LDC (Green et al., 2018). Amongst these data, two measures of alcohol accessibility are included for each LSOA in England in 2016. These are measured as ranked indices based on median travel distances to alcohol outlets, based on road network connectivity (km) from each postcode centroid to outlets selling alcohol. Measures of the physical availability of alcohol outlets are calculated separately for on-licensed premises (defined as pubs, bars and nightclubs) and for off-licences. This offers distinct geographical measures of on- and off-licensed premise availability – obtained through a combination of administrative databases and observational fieldwork to validate and update outlet details (Green et al. 2018). These measures are particularly useful in the absence of any central government database of licensed premises (Humphreys and Smith, 2013) and allow for a finer-grained assessment of the impact of the outlet type on violent crime in an area. In the original ‘Access to Healthy Assets and Hazards’ data, a high score was associated with longer travel distances to on- or off-licences and so was seen as health promoting (with shorter distances being health negating); for analysis here, these measures were reverse coded so that that higher scores could be interpreted as increased access to licensed premises/availability of alcohol. The mean numbers of violent crimes by alcohol availability deciles are reported in Table 1, which highlights – as expected – how the availability of on- and off-licences is positively associated with violent crime.
Average (mean) number of violent crimes per LSOA, 2011–18, by deprivation and alcohol availability deciles.
Analytical strategy
Our analytical strategy involves employing growth curve modelling with which to explore the variability in violent crime across LSOAs and time, together with the effect that could be ascribed to deprivation and alcohol availability.
Given the overdispersion of the distribution of the violent crimes recorded in our sample, negative binomial models were used. To account for the average trend for the whole of England, the year in which the case was recorded was introduced as an explanatory variable. This variable was demeaned (centred around the mean) to ease the computational challenge arising from the estimation of non-linear multilevel models based on large sample sizes.
The models to be explored were estimated sequentially. Our first negative binomial model included just one explanatory variable (Year) and is denoted ‘Model 1’. Substantively, Model 1 reports only the upwards trend already detected in the previous section; however, it was also used as the benchmark against which ‘Model 2’, a more complex random effects model, was compared. Model 2 included a random intercepts term assessing the extent to which violent crime varies geographically at the LSOA level. ‘Model 3’ involved the specification of a random slope for the explanatory variable year. This additional random term allowed us to examine the extent to which the change in violent crime throughout our window of observation is experienced uniformly across LSOAs.
Model 3 was further extended by adding explanatory variables for deprivation and alcohol availability in Model 4. These were used to assess the extent to which deprivation and alcohol availability affect crime rates and explain disparities across LSOAs. To facilitate the estimation process, but also to facilitate comparisons of the effect size of deprivation and alcohol availability, these variables were standardized (demeaned and divided by their standard deviation).
A final model (Model 5) was specified to include interaction terms to test whether the effect of alcohol availability was moderated by deprivation.
All of our models were estimated using the R2MLwiN package in R (Zhang et al., 2016). Markov chain Monte Carlo (MCMC) estimation was used with a default setting of 5000 iterations along with a burn-in of 500 and thinning factor of 1 (Zhang et al., 2016). Multicollinearity was also assessed and deemed not to pose a problem, with the highest variance inflation factor equal to 1.41 for the case of off-licences.
Model findings
Model 1 results (Table 2) confirmed the upward trend in violent crime, with a positive and strong coefficient for Year (0.095). This suggests that, on average, each year the number of recorded violent crimes increases by roughly 10 percent. In Model 2 the introduction of a random intercepts term improved the model fit, reflected by a substantial reduction in the Bayesian Deviance Information Criterion (BIC). Taking into consideration the standard deviation of the random intercepts term we also estimate substantial variability across areas. This result corroborates the long-established view that crime is far from being uniformly distributed, but rather is conditional upon neighbourhood characteristics. The random intercept was thus retained in further models.
Regression estimates for negative binominal regression models of count of violent crime, 2011–18 (standard deviations of the posterior distributions within brackets).
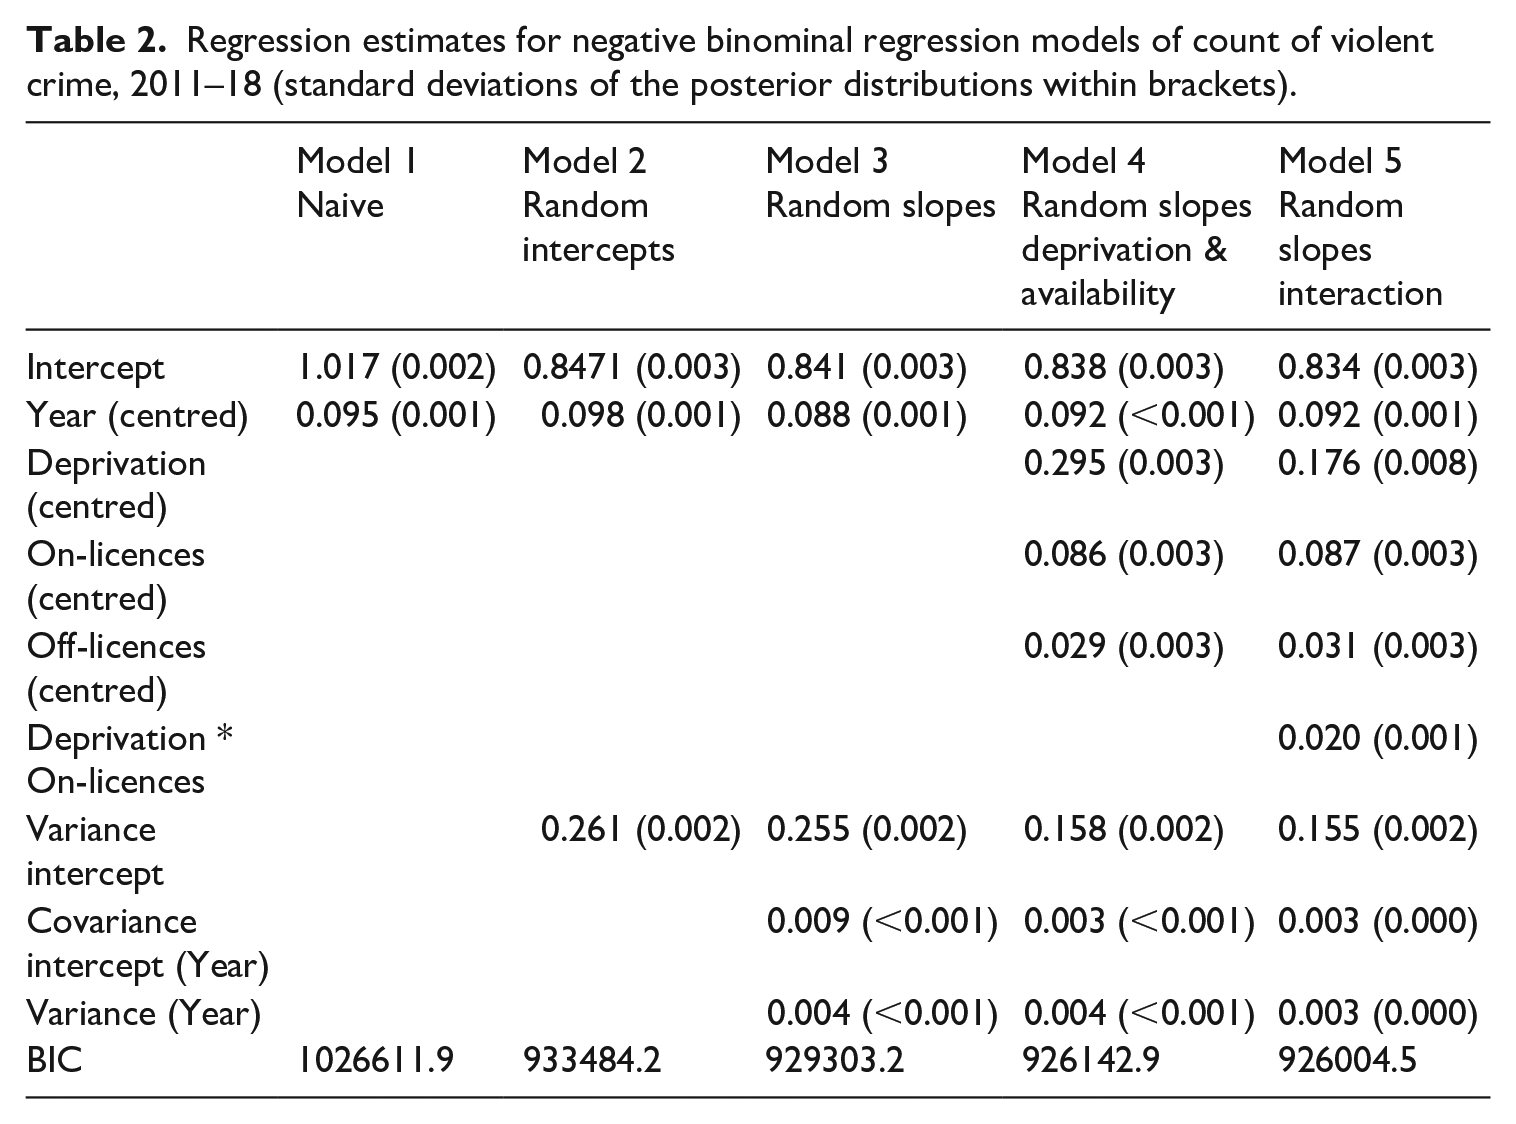
To further explore the different trajectories that LSOAs might have experienced throughout the study’s window of observation, a random slope for Year was introduced in Model 3. This was found to improve upon Model 2, as established by a reduction in BIC. The standard deviation of the random slope term (0.063) suggested variation in the gradient of change in recorded violent crime over years for different LSOAs. The 95% credible interval around the estimated effect for Year in Model 3 (0.088) highlighted change in violent crime across time ranging from 0.962 to 1.239. That is, there were LSOAs where violent crime is estimated to have increased by 24 percent per year, but others where it decreased by a rate of 4 percent per year, following a trend in the opposite direction to that of the average for England. This divergence in trajectories between LSOAs is also associated with the starting levels of recorded crime, as indicated by the positive covariance (0.009) between the random intercepts and random slopes terms, which suggests an increase in violent crime inequality across LSOAs during the period of analysis.
To answer our research questions about the effect of deprivation and alcohol availability on violent crime, we expanded on Model 3 to include IMD as an additional explanatory variable, as well as two measures of alcohol availability: off-licence premises and on-licensed premises (in the form of pubs, bars and nightclubs) (Model 4). The effect of deprivation was found to be positive and strong (0.295), indicating that more deprived areas experienced more violent crime. After back-transforming this estimate using the exponential function, and considering that IMD was standardized, we can interpret this effect as follows: for each standard deviation above the mean in deprivation, recorded violent crime increased by 34 percent.
The regression coefficients for both alcohol availability variables were found to be positive and relatively strong. For each standard deviation above the mean in on-licence and off-licence availability, violent crime increased by 9 percent and 3 percent respectively. The effect of the alcohol availability variables on recorded violent crime was, however, less pronounced than was observed for IMD, the latter being around 3.4 to 10 times higher when compared with the effects of on- and off-licence respectively.
To answer our third research question, Model 5 introduced an interaction term to assess whether deprivation moderated the impact of on-licence availability on violent crime, the stronger of the two alcohol availability variables. The positive interaction term (0.020) suggests more deprived LSOAs were more affected by on-licence availability, meaning the effect of alcohol availability on recorded violent crime is amplified in more deprived LSOAs. A model was also run including an interaction for deprivation and off-licences; however, this was found not to be significant.
Discussion
Main findings of the study
The current study sheds light on substantive questions about the impact of deprivation and alcohol availability on trends in recorded violent crime. Hitherto, these correlates of violent crime have been examined separately in studies that do not tend to look at area-level variability. This study also makes use of longitudinal police data, as well as innovative data linkage to examine – for the first time – inequalities in violent crime across small-level geography (LSOAs) for the whole of England.
Our findings confirmed a recent upward trend in recorded violent crime in England between 2011 and 2018 and substantial between-area variability in recorded violent crime as well as an increase in violent crime inequality across LSOAs during the period of analysis. We find that deprivation plays a key role in driving violence. Deprivation was found to be a strong contributor of recorded violent crime – around three and a half to 10 times stronger in its effect size when compared with on-licence and off-licence availability. Given the important role of deprivation in this study, we suggest studies looking to examine the impact of alcohol outlets but not accounting for deprivation may result in misleading findings that overestimate the impact of alcohol outlets.
Our findings also highlight on-licence availability – in the form of pubs, bars and nightclubs – as particularly important, because this drove variability in recorded violent crime more than off-licence availability. Of course, there are several potential reasons for this, notwithstanding the fact that there are other characteristics of on-licensed premises aside from the availability and consumption of alcohol that may make violence more probable.
The positive interaction effect between alcohol availability (in the form of on-licensed premises) and deprivation showed how deprivation amplified the impact of alcohol availability: more deprived areas experienced a stronger impact of on-licence availability on violent crime. Deprivation is thus an important contextual factor when considering rates and the social ecology of violence; it has also been identified in individual-level analyses of the socio-economic distribution of alcohol-related violence (Bryant and Lightowlers, 2021). That being said, the interaction was not significant for off-licences in our study. However, it is important to reiterate at this point that this measure does not include supermarkets in which much off-licensed trade occurs.
Policy and practice implications
This study has enabled us to bring together learning about the socio-economic distribution of alcohol-related harm from the field of public health and apply it to the study of violent crime. The ecological analysis pursued in this study is the pragmatic scale for police response resource allocation, as well as for planning and licensing decisions by local authorities. Moreover, our method of linking crime to the availability of licensed premises shows promise for informing licensing panels in considering new premises in their local area, which traditionally has been weak/unsystematic (Talbot, 2006).
The positive coefficient associated with both on- and off-licence availability and violent crime suggests that restricting the availability of such retail outlets would reduce violent crime rates. This accords with a strong existing evidence base that supports reducing the number of alcohol outlets and trading hours to minimize health harms and crime (Atkinson et al., 2018; Campbell et al., 2009; De Vocht et al., 2020). This is particularly relevant in terms of night-time city management, where alcohol-related violence is known to be an ongoing criminal justice and public health challenge. Intervening in violence in this way would subsequently free criminal justice agencies and health organizations from some of the burden of alcohol-related violence. Commentators have also argued in relation to domestic violence that, ‘even if these policies do not address consumption at home, if they reduce drinking among men most inclined to violence, a reduction in drinking in bar contexts could still have an impact’ (Leonard, 2001: 234).
Our findings also highlight the potential for ameliorating alcohol-related harm by tackling wider socio-economic inequalities. They suggest a need to respond to the unequal distribution of alcohol-related harm and the disproportionate impact of violence on areas with higher levels of deprivation and availability of on-licensed premises. That means taking into account the availability of and access to licensed premises as well as the deprivation profile of an area in making decisions about licensing with a view to minimizing violence as well as tackling the structural drivers of socio-economic deprivation in order to ameliorate alcohol-related violence.
Limitations of the study
There are several caveats to note. Firstly, we have relied on time-invariant measures of alcohol availability and deprivation. Clearly, alcohol availability (2016) could be subject to variation over the study period; however, previous studies exploring such variability between 2003 and 2013 found it to be relatively negligible (Angus et al., 2017). Some features of the IMD have been found to be relatively temporally stable at the area level (Cookson et al., 2016; Singleton et al., 2016). In any case, the effect of an unobserved variation in IMD or alcohol availability will be akin to a problem of Berkson measurement error. This is a type of measurement error that artificially reduces the variance of the observed variable, leading to a loss of precision but not conducive of bias (Heid et al., 2004).
Secondly, recorded police crime data are subject to several known limitations, notably that the picture of crime presented is only partial on account of many crimes not being reported to the police and on account of variations in recording practices and activity between police forces and over time (Britten et al., 2012; Elkin, 2019; Flatley, 2017). Recently, Pina-Sánchez et al. (2021) have demonstrated that both the random noise and the systematic under-recording observed in police data are corrected when crime rates are specified using a log-transformation such as the negative binomial models employed here. However, reporting rates can also vary systematically across areas, with deprivation identified as a factor leading to further under-reporting of crime (Baumer, 2002; Buil-Gil et al., 2020). Should this be the case, the estimates we generate here with respect to the effect of deprivation are likely to be underestimates, with the ‘true’ impact of deprivation on violence in fact likely to be larger than was reported here.
Here the ‘violent and sexual offences’ category in the publicly available data includes a broad range of offences that might have different relationships with socio-economic or environmental factors which we have not been able to tease out. Ganpat et al. (2020) highlight how trends in violence as an aggregate category can mask different trajectories in types of violence, and Bryant and Lightowlers (2021) highlight how the socio-economic distribution of alcohol violence differs between types of violence; its concentration is particularly stark for domestic violence in lower socio-economic groups. In future research, there is thus scope to more specifically identify trends in different types of violence (for example, sexual, domestic, stranger and acquaintance violence) and their respective drivers and associations with alcohol outlets using finer-grained data, where available.
Factors beyond those controlled for in these models may also be impacting results (unobserved confounding). The weaker association between off-licence availability and recorded violent crime is likely an underestimate because the measure of off-licence availability employed here does not include supermarkets, in which alcohol can be readily purchased by many (Green et al., 2018). It could also be the result of domestic violence being under-reported (Elkin, 2018) and strong associations between domestic violence drinking (Leonard, 2005), which may be predominantly driven by at home drinking. Although we were unable to confirm this, we encourage future studies to explore this suggestion further. Additionally, within on-licence availability there is likely variation in effect size dependent upon the type of venue; for example, different effects of pubs, bars and nightclubs and characteristics thereof, such as opening hours and volume of alcohol sales, amongst others, hitherto not available in the retail data. We thus encourage studies that employ data and methodologies to further disaggregate these differential effects and illuminate which characteristics of outlets are associated with violent crime.
Our findings suggest a need to identify ways in which policy can tackle inequalities in alcohol-attributable harm (Katikireddi et al., 2017). The evidence base suggests that reducing alcohol availability is a promising cost-effective policy initiative to reduce alcohol-related harm, including violence (Babor, 2010; Babor et al., 2010; Foster et al., 2017; WHO, 2009a, 2009b), yet initiatives for addressing the unequal distribution of such harm remain rare. It is important that we understand the distribution of such harms by area deprivation to assist with this endeavour, because those from more deprived areas not only suffer disproportionately from the harm associated with alcohol consumption (Mäkelä and Paljärvi, 2008; Sadler et al., 2017), but may also be less likely to object in the licensing process owing to barriers such as access to services and education. If so, the least advantaged communities might not only experience more crime but also have the least opportunity to use the licensing system to address this.
Given that COVID-19 has seen inequalities widen (Elwell-Sutton and Suleman, 2020; Fancourt et al., 2020), reports of domestic violence rise (Stripe, 2020; UN Women, 2020; WHO, 2020) and a shift to home drinking because of curfews imposed upon and the unprecedented closure of on-licensed premises (IAS, 2020), future research is also encouraged to examine the impact of alcohol availability on violence and the role of deprivation therein by performing analysis over the pandemic period. This could allow for comparisons and testing of the impact that restricting alcohol availability in on-licensed premises’ trading hours has had on violent crime.
Footnotes
Acknowledgements
A special thanks to Stephen Clark (University of Leeds), Yunzhe Liu (University of Liverpool), and Natacha Chenevoy (University of Leeds) for their input into the data preparation and R code at various stages is warranted and to Lucy Bryant (Institute of Alcohol Studies) for comments on an earlier draft.
Declaration of conflicting interests
The author(s) declared no potential conflicts of interest with respect to the research, authorship, and/or publication of this article.
Funding
The author(s) received no financial support for the research, authorship, and/or publication of this article.