
Abstract
Accurately measuring the prevalence of sexual violence is difficult. Police-recorded crime figures are known to underestimate the true extent of sexual violence, and so researchers have tended to rely on survey estimates instead. But estimates from surveys are not uniform, with recent estimates from the UK National Survey of Sexual Attitudes and Lifestyles apparently twice as large as official figures from the major crime surveys (the Crime Survey for England and Wales and the Scottish Crime and Justice Survey). In this study we use harmonized data from these three surveys and the UK component of the EU Violence Against Women Survey to explore the features of the surveys that may have contributed to these differences.
Keywords
Introduction
Obtaining an accurate measure of the prevalence of sexual violence is necessary to provide a more comprehensive picture of the extent of crime, better representing the experiences of vulnerable members of society and helping protect them from further victimization. But it is also inherently difficult. The limitations of police-recorded crime figures are now well known (for example, Smith, 2006), but are even more apparent when considering estimates of sexual violence (House of Commons Public Administration Select Committee, 2014). Here, under-reporting and under-recording are substantial issues, with many people unwilling, or unable, to report these incidents to the police, and there are a number of examples of figures being distorted by police recording practices (specifically the increased chances of offences being no-crimed, for example, IPCC, 2009). There is an additional problem when assessing trends because definitions change and new behaviours of sexual offending are criminalized (for example, stalking). Coupled with this, cultural shifts and changes in attitudes and perceptions all influence what people regard as crimes. For example, rape was largely regarded in the past as a crime committed by strangers, but now our understanding has broadened to recognize sexual violence in intimate settings among acquaintances, in the family or at work. Furthermore, cultural shifts also increase the propensity of victims to report incidents to the police (Estrada et al., 2010;,2012; Lynch and Addington, 2015).
As a result, studies have tended to rely on estimates from random probability surveys, where sampled individuals are asked to indicate whether or not they have been the victim of a range of different criminal activities. Here the methodological approach becomes paramount, with research emphasizing the importance of survey design (Hope, 2005), the wording of questions (Fisher and Cullen, 2000), and the appropriate definition of sexual violence (Myhill, 2017; Walby et al., 2017). The highly sensitive and subjective nature of experiences of sexual violence makes it particularly susceptible to these methodological influences. Survey estimates also cannot be removed from the broader socio-political context in which the surveys are conducted; Kivivouri (2011) suggests that general purpose crime surveys (termed ‘moderating surveys’) have generally functioned to normalize crime by highlighting the prevalence of petty delinquency, and the emphasis on generating national estimates leading to a tendency to underestimate more serious forms of violent crime that may be experienced by vulnerable subgroups. By contrast, more recently fielded violence against women surveys (referred to as ‘aggravating surveys’) have aimed to highlight the prevalence of serious crimes against women by adopting a more tailored approach.
Most existing evidence on the extent of sexual violence in the UK has been based on data from the major crime surveys – the Crime Survey for England and Wales (CSEW) and the Scottish Crime and Justice Survey (SCJS). Both of these studies report that approximately 5 percent of women and 0.5 percent of men had experienced a serious sexual assault since the age of 16 (Ministry of Justice, Home Office, Office for National Statistics, 2013; Scottish Government, 2011). By contrast, Macdowall et al. (2013) presented findings on sexual violence (which the authors term non-volitional sex) from the third National Survey of Sexual Attitudes and Lifestyles (hereafter Natsal-3), reporting that as many as 9.8 percent of women and 1.4 percent of men were victims of non-volitional sex since the age of 13. Natsal-3 findings are important; as the authors state, Natsal-3 is ‘the first [large] population-based survey in Britain to explore the issue [of sexual violence] outside the context of crime’. But to the authors of this article, who all have a long and close association with the CSEW, the estimates of sexual violence from Natsal-3 seemed high, even after recognizing that the figures are not strictly commensurable (we discuss in detail below the difference in the definitions adopted by these surveys). Another recent survey of interest here is the EU Violence Against Women survey (VAW-EU) in which women in each of the 28 members states were interviewed about their experience of physical and sexual violence. This found that approximately 11 percent of women across Europe had experienced some form of sexual violence since the age of 15 (FRA, 2014).
Given the public concern regarding sexual violence and the difficulties in measuring such a sensitive topic, it is imperative to compare findings from these surveys (and to our knowledge there has been no published comparison on such measures between CSEW and SCJS 1 ) and to reconcile any differences between the surveys. We therefore conducted secondary analyses of the survey microdata, harmonizing the data as far as possible in order to facilitate a ‘like for like’ comparison. The focus of this article, and the only measure considered, is the prevalence of sexual violence; that is, whether or not at any time a person has been the victim of sexual violence since age 16, although in practice a lower age limit is sometimes invoked (since age 13 in Natsal-3, since age 15 in the VAW-EU survey.) We are restricted to this measure because it is the only one common to all surveys. Unlike the crime surveys, Natsal-3 did not attempt to uncover incidents; that is, a count of the number of times the offence was committed. 2 The questions asked in each survey are given in the online Appendix, which shows that the Natsal-3 question is also confined to physical penetrative sexual violence (both attempted and completed) and does not consider other sexual offences such as stalking, harassment or non-physical coercion, which are widely recognized to be significant components of sexual violence (Myhill, 2017; Walby et al., 2017). Although these wider aspects of sexual violence are included in the crime surveys and VAW-EU, they fall outside the comparative analysis undertaken in this article.
First, we consider the main potential reasons for the observed differences between the four surveys. Next, we outline our approach to data harmonization and provide an initial assessment of the overall comparability of the surveys on a range of survey items. This is followed by an analysis of the differences in estimates of sexual violence between the CSEW, SCJS, Natsal-3 and VAW-EU. We conclude with a discussion of the most plausible explanations for the observed differences.
Background to the surveys
Natsal’s origins can be traced back to the 1980s when evidence was needed about sexual behaviour to inform policy and practice at the time of the HIV/AIDS epidemic. The first survey was conducted in 1990, the second 10 years later in 2000 and the third in 2010–12. Only Natsal-3 asked questions on sexual violence. Natsal is very much conceived as a health survey in its focus and sponsorship (its major funders are the Wellcome Trust and the UK Medical Research Council, with additional support from the Department of Health and the Economic and Social Research Council). Respondents were asked about sexual violence in the context of sexual behaviour and health more generally. Before being asked about non-consensual sex, respondents were questioned on their general health, how they learnt about sex, their experience of sex (first sexual experiences, number of partners and so on), sexual orientation and contraception.
The Crime Survey of England and Wales and the Scottish Crime and Justice Survey seek to obtain information on the public’s experience of crime and the criminal justice system, in particular to provide an alternative measure to police-recorded crime. Prior to April 2012 the CSEW was conducted on behalf of the Home Office and from April 2012 responsibility for the survey transferred to the Office for National Statistics. The SCJS was commissioned by the Scottish Office in 1993. Both surveys are thus clearly perceived as government surveys, forming part of the official suite of national statistics. Before being asked to complete questions on sexual violence, respondents are asked about their perceptions of crime, both locally and nationally. They are then asked whether they have been the victim of a range of individual or household property and violent crimes. 3 Respondents are then questioned about the performance of the criminal justice system, their contact with the police and any steps they may have taken to prevent crime. After having completed these modules, interviewees are asked about their experience of domestic violence and sexual victimization in a self-completion module which is designed to provide a confidential setting in which respondents will be more comfortable disclosing such experiences.
The Violence Against Women survey – an EU-wide study – was conducted in 2012 by the European Union Agency for Fundamental Rights (FRA) to inform policy and practice for those working to address violence against women at the EU and Member State levels. Prior to the survey, policy makers were confronted by an absence of comprehensive, robust and comparable data on the extent and nature of violence against women. Thus the objectives of the survey were to overcome this paucity of information and to highlight the manifestation of gender-based violence against women as a fundamental rights abuse in the EU. Respondents were first asked about their domestic arrangements and occupation. This was followed by questions about their general health, their feelings of safety and their knowledge of existing services available to women victims. The third module enquired about their experience of sexual harassment before subsequent modules on physical and sexual violence. Here we are interested only in the UK component of the survey and henceforth it will be called the VAW-EU(UK) survey.
Possible reasons for the observed differences between surveys
To better understand the likely causes of differences in estimates from these surveys we use the Total Survey Error (TSE) framework (Groves et al., 2009) to identify the main potential sources of methodological differentiation between each survey. TSE highlights the importance of both errors of non-observation (resulting in differences between the achieved sample and the target population of interest) and errors of observation (where the approach to measurement influences the estimated outcome). We therefore reflect in turn on the potential impacts of survey representation (specifically sampling error and nonresponse) and of measurement errors from the survey mode, the wording of the questions and the definition and measurement of sexual violence, and the type of survey. Table 1 provides summary details of the four surveys.
Summary of each in-scope survey.
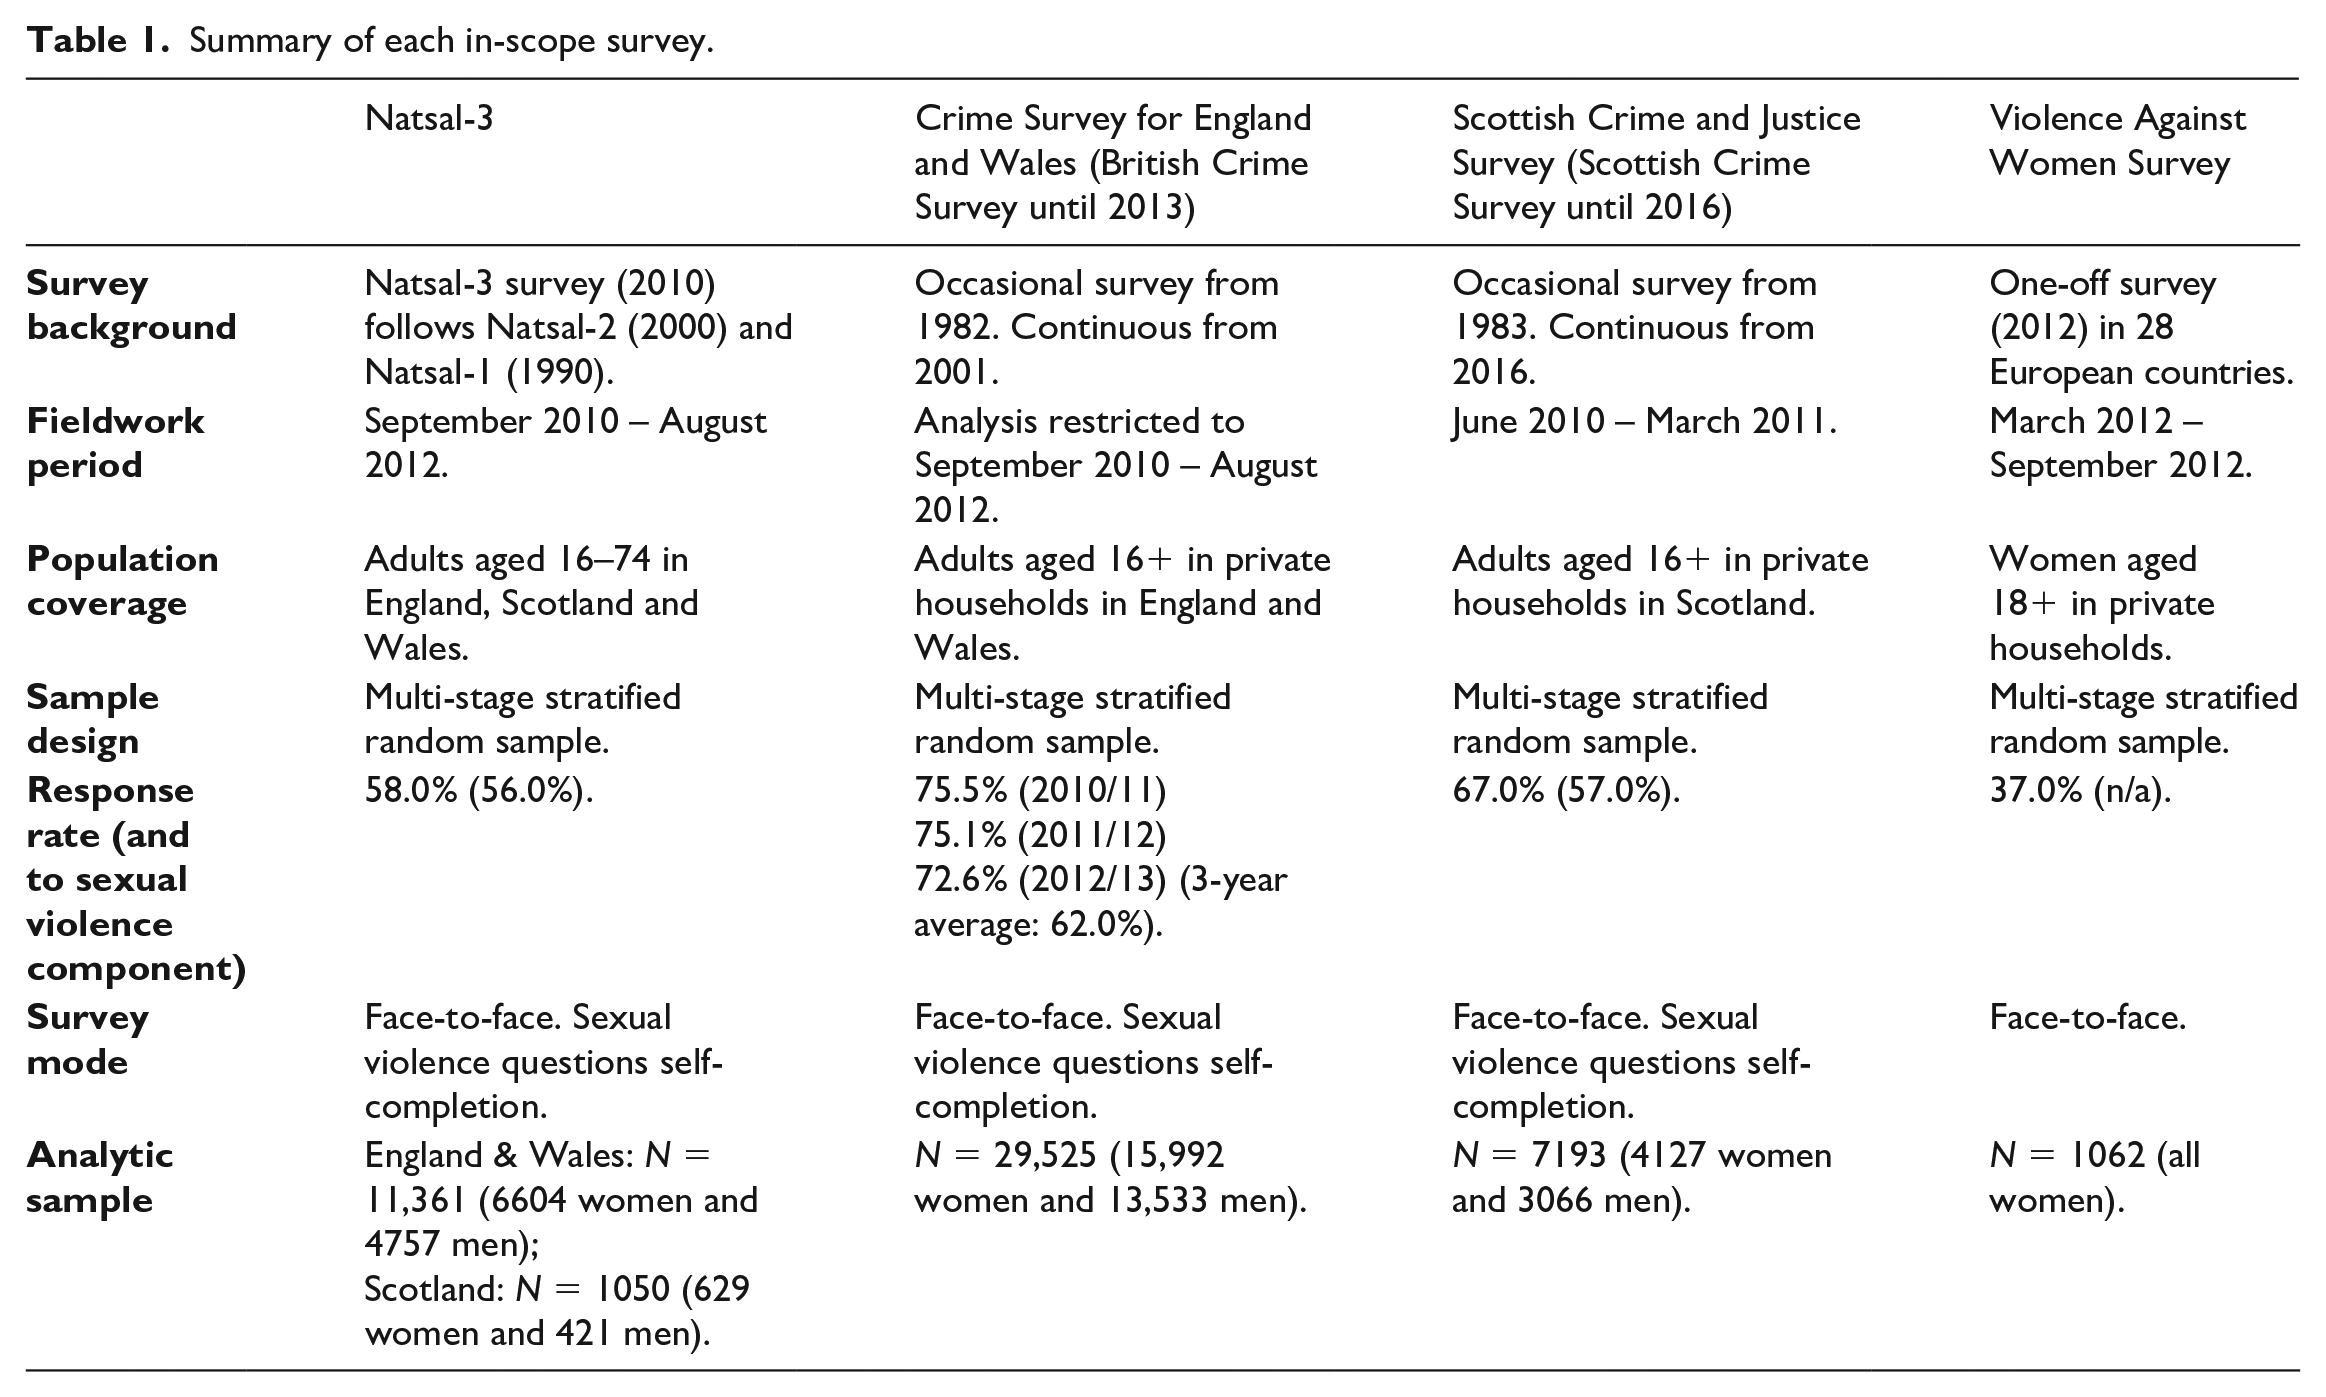
Survey representation
Perhaps the most obvious explanation for differences in the survey estimates is that the different samples may not be equally representative of the target population. However, all four surveys were household surveys adopting a probability-based sample designed to be representative of the national population who are normally resident in private or social housing. Household surveys have been criticized for under-representing women victims of domestic violence because some may have sought refuge away from the family home either with friends or in refuges, which, being communal establishments, are not covered in the sample. This is obviously a valid point if the extent of violence is sought, but in this comparative study all four surveys will be similarly biased. Coverage error is also clearly a problem for overall sexual violence estimates from VAW-EU because it is fielded only to women.
Response rates are another important indicator of sample representativeness. The response rate to Natsal-3 was 58 percent. The self-completion module was asked about half-way through the interview and 98 percent of those eligible for it completed it. Taking account of the attrition at the self-report stage, the response rate for the sexual violence component was 56 percent. The response rates for the CSEW are reported on a financial year basis. The three response rates covering the span of our data were: 76 percent, 75 percent and 73 percent. In the 2010/11 survey, 79 percent of those responding to the core interview also finished the self-completion module on sexual violence. The comparable figures for subsequent years were 81 percent and 91 percent. Thus the response rate to the CSEW sexual violence component was at an average of 62 percent across the three survey years from which these respondents have been extracted. The response rate for those agreeing to participate in the main 2010/11 SCJS was 67 percent. Of those, 85 percent agreed to complete the self-completion sexual violence questions, resulting in a response rate for this component of 57 percent. The response rate of the VAW-EU(UK), at 37 percent, was lower than for the other three surveys, which were all very similar.
Analysis by Groves and Peytcheva (2008) shows that response rates are only weakly correlated with nonresponse bias, leaving open the possibility that these headline similarities (at least between CSEW, SCJS and Natsal-3) may be masking some important differences in the propensity to respond for some population subgroups. And if the propensity to respond is also correlated with the risk of sexual violence, the survey estimate may still be biased. To mitigate the potential impact of this, all analyses include appropriate nonresponse adjustment weights. A similar biasing effect may be evident if there is differential item nonresponse between the surveys, although item nonresponse was generally low across all surveys on the sexual violence questions.
Survey mode
There is extensive evidence in the survey methods literature of the effect that mode of administration can have on survey estimates (Groves et al., 2009), with face-to-face and telephone surveys typically more susceptible to social desirability bias (Holbrook et al., 2003) and self-completion usually most effective for sensitive questions (Kreuter et al., 2008). 4 Three of the surveys – CSEW, SCJS and Natsal-3 – were conducted face to face using a mix of male and female interviewers experienced in the administration of general household surveys. However, although the main questionnaire was administered via face-to-face interviews, the sexual violence module was self-completion. By contrast, the VAW-EU(UK) interviews were all conducted face to face and the interviewers were all female. However, before concluding the interview, the women were handed a self-completion form to record any sensitive information that they might not have wished to divulge to the interviewer. The completed form was placed in a sealed envelope and delivered separately to the research analysts. The self-completion component added little to the prevalence rate obtained from the face-to-face interview. We can therefore discount mode effects as the key driver of different estimates.
Questionnaire wording and measurement of sexual violence
In their review of US surveys measuring sexual violence, Fisher and Cullen (2000) draw several conclusions on the effect of question wording. The use of behavioural-specific language, where the incident is described explicitly (but maps onto the legal definition of the range of offences of interest), draws a greater response than merely asking whether the respondent had been the victim of a rape or sexual assault. The latter approach requires the respondent to interpret the incident as a crime, and development work on the CSEW questions showed that the general population have a much narrower interpretation of what constitutes rape, for example, than is defined by statute. Kloss (1988), too, found that around three-quarters of college students in her US sample did not describe their experience as rape even though the incident met the legal definition of rape. Ambiguities persist, as highlighted by a recent survey commissioned by the End Violence Against Women Coalition (2018), which found unanimity among respondents in believing an incident is a rape only if the perpetrator is a stranger and force is used (97 percent considered it was always or usually a rape). Percentages agreeing that an incident constituted a rape fell away if there was no physical violence (57 percent) or if the couple were known to each other, especially if they were married or involved in a long-term relationship (67 percent).
Fisher and Cullen (2000) and Fisher (2009) also suggest that the more behavioural-specific questions asked (each defining the various acts that fall within the definition of the offence) the more likely respondents are to recall incidents. By including every possible scenario in a separate question, respondents are left in little doubt which of their experiences is being covered by the survey.
The sexual violence questions included in each of the surveys are reproduced in the online Appendix. This shows that all sets of questions followed the now accepted practice of avoiding subjective, emotive or prejudicial words, such as ‘rape’ or ‘crime’: all relied on neutral terms defining specific behaviours. However, with regard to the second point raised by Fisher and Cullen (2000), the extent and detail with which the specific behaviours were defined and addressed differed significantly between the crime surveys and Natsal-3. The crime surveys describe each possible act that constitutes sexual violence in order to clarify and to prompt the respondent, whereas Natsal-3 uses very generic and more ambiguous language (‘have sex’) – leaving the respondent to define that term to him/herself. The wording about consent is also more forcefully and explicitly expressed in the crime surveys (‘made it clear that you did not agree or when you were not capable of consent’, ‘forced you’ (either physically or by threats)) as opposed to Natsal-3 (‘against your will’). This should result in a higher estimate in the crime surveys, all things being equal.
Type of survey
There are also good reasons for believing that the type of survey may affect response. First, surveys focused on the topics of crime and security may appeal to different types of people than surveys focused on issues relating to health, thus affecting the composition of the two samples. Second, the choice of framing – ‘defined as the way the survey instrument communicates its topic and aim’ (Kivivouri et al., 2012) – may influence how people respond to particular questions: people recruited into crime surveys are more likely to interpret all questions in relation to criminal activity, even if the question itself does not make explicit reference to crime. Considering both influences, Kivivouri et al. (2012) demonstrate the importance of gender framing in victim surveys. Comparing self-reported victimization estimates when the survey was framed around male-to-male violence, female-to-male violence and male-to-female violence, they find that the male-to-female violence frame invokes both the highest response rate and the highest reporting rate among women.
Walby and Myhill (2001) suggest that surveys framed in relation to crime may actually produce lower estimates of some crimes, particularly when those crimes may have an ambiguous legal status in the eyes of many respondents. To explore this, Walby and Myhill divided surveys addressing violence (not just sexual violence) into three categories; generic crime surveys, dedicated domestic violence surveys and dedicated violence against women surveys. By examining results from surveys falling within each category, they concluded that dedicated domestic violence surveys generally produced higher crime rates than multi-purpose crime surveys and that violence against women surveys tended to produce even higher rates. The authors caution against drawing too strong a conclusion because other elements of TSE are likely to contribute to the differences, with individuals more (or less) likely to participate in a survey if it is on a topic of particular salience to them. In some surveys, the annual incidence of violence is measured and in others prevalence, and, more significantly, sexual offending is conflated with other forms of violence, principally domestic violence, which is related in that much sexual violence occurs in a domestic setting. For example, the 2014/15 CSEW found that, in over half (57 percent) of serious sexual assaults on women since the age of 16, the offender was a partner or ex-partner in at least one incident (ONS, 2016). Walby and Myhill’s (2001) categorization fits neatly with CSEW and SCJS (generic crime surveys) and VAW (dedicated violence against women survey) but does not neatly accommodate Natsal. Natsal is not a crime survey nor is it a domestic or violence against women survey; it is a health survey with sexual violence questions included.
Creating comparable datasets
In order to construct comparable datasets, certain adjustments had to be made to the initial samples. Here we followed the general principles of data harmonization as far as possible (Granda et al., 2010), trimming the data to cover equivalent target populations, recoding variables to ensure similar meanings and a common timeframe, and identifying appropriate survey weights to adjust for nonresponse and sample design.
All four surveys covered similar timeframes (see Table 1), mitigating the potential influence of cultural differences that may shape reporting levels over time. Because the CSEW is a continuous survey, we selected all respondents who were interviewed between September 2010 and August 2012 inclusive to mirror as closely as possible the fieldwork period of Natsal-3.
To ensure similar population coverage of the surveys, first Natsal-3 had to be separated into two surveys, one for England and Wales and one for Scotland. This was not possible with VAW-EU(UK) because there was no variable in the dataset to indicate where in the UK the respondent resided. Only those aged between 16 and 59 at the time of the fieldwork were included in the sexual violence component of CSEW (the age range has been extended to an upper limit of 74 in later years), so those 60 and over were omitted from Natsal-3 and SCJS and VAW-EU(UK). Furthermore, VAW-EU(UK) did not interview women aged 16 or 17, only those aged 18 or older. There was one further complication in that CSEW and SCJS asked respondents about their experience of sexual violence since 16 years of age, whereas Natsal-3 lowers this age to 13. Fortunately, Natsal-3 recorded the age when last experienced sexual violence so it was possible to identify and omit respondents who had last experienced sexual violence when aged 13, 14 or 15. This brought Natsal-3, CSEW and SCJS into alignment, with only VAW-EU(UK) being a slight anomaly.
Differences in the classification of sexual violence across the surveys also needed to be addressed. Natsal-3 distinguishes between the prevalence of ‘attempted’ and of ‘completed’ sexual violence, whereas the categories used for reporting results in CSEW and SCJS are ‘less serious’ and ‘serious’ (the full question wording is given in the online Appendix). The two sets of categories do not directly relate to each other; there is an overlap in that certain attempted and completed acts are defined as ‘serious’ in CSEW and SCJS. Furthermore, CSEW and SCJS also include acts such as indecent exposure and groping (under the category of ‘less serious’ sexual assault), which do not form part of Natsal-3’s questions. VAW-EU(UK) includes three questions that together measure ‘completed’ sexual violence, emphasizing both physical harm and lack of consent. Natsal-3 data could not be recoded but it was possible to reconfigure the CSEW, SCJS and VAW-EU(UK) data to bring them into broad alignment with Natsal-3 (full details of this reconfiguration are given in the online Appendix). However, we were unable to generate a comparable measure of attempted violence from VAW-EU(UK) because the definition of attempted sexual violence was more narrowly defined than in the other surveys, confining ‘attempts’ to ‘holding you down and hurting you’ and not offering ‘attempted’ counterparts to other sexual violence acts.
Although broadly similar in design and administration, there was one notable difference between the surveys. Natsal-3 aimed to increase the core target sample of 10,000 with a ‘boost’ sample of a further 5000 adults aged 16–34 (the researchers’ reason for disproportionately sampling younger adults was to permit more detailed analysis among those at highest risk of a range of sexual health outcomes, including teenage pregnancy and sexually transmitted infections). To compensate for this, all comparative results are based on weighted data. Analyses were undertaken in Stata, which readily corrects for the weighting, clustering and stratification of the samples.
Preliminary analysis: Comparison of the surveys
Before undertaking the main analysis and in order to gauge the similarity between the samples, we compared the weighted distributions in each survey on a range of socio-economic and demographic variables common across the samples and coded in the same way. Only two variables were recorded within VAW-EU(UK) – age and general health – but the other three also included the respondent’s sex, ethnicity, education and household income, and the Index of Multiple Deprivation for the neighbourhood in which the respondent lived and the region of the country. With the exception of VAW-EU(UK), which included proportionally more 35–44-year-old women and fewer 45–59 year olds than other surveys, no discernible differences were observed between the samples on any other of these weighted variables, providing reassurance that the samples were comparable and representative of the population of England, Wales and Scotland (results available on request).
In addition to comparing the surveys on a range of background characteristics of the respondents, it was also possible to compare them on responses to certain behavioural questions other than sexual violence. With the exception of VAW-EU(UK), the surveys included similar questions on drug taking and alcohol consumption. For three drugs considered, cannabis, cocaine and heroin, the prevalence recorded in Natsal-3 was generally higher than the prevalence recorded by the corresponding crime survey, but overall the surveys did not record dissimilar rates of drug taking, with approximately one-third admitting having taken cannabis at some point, around 10 percent cocaine and 1 percent heroin.
Natsal-3 and CSEW also asked respondents about their consumption of alcohol. Results for England and Wales were remarkably similar between CSEW and Natsal-3; a quarter of respondents said they drank alcohol more than three days per week, 40 percent between two and three times per week and one-third less than once or twice a week.
Thus, where comparisons were possible, the surveys did not indicate widely different levels of other forms of behaviour.
Results
Estimates of the prevalence of sexual violence
Before considering ‘attempted’ and ‘completed’ sexual violence across the surveys, we can compare the two crime surveys on their measures of ‘less serious’ and ‘serious’ sexual violence (see the online Appendix for the definition of each category). Results are presented in Table 2.
Since age 16 whether ever a victim of ‘less serious’ and/or ‘serious’ sexual violence, by gender (percent).
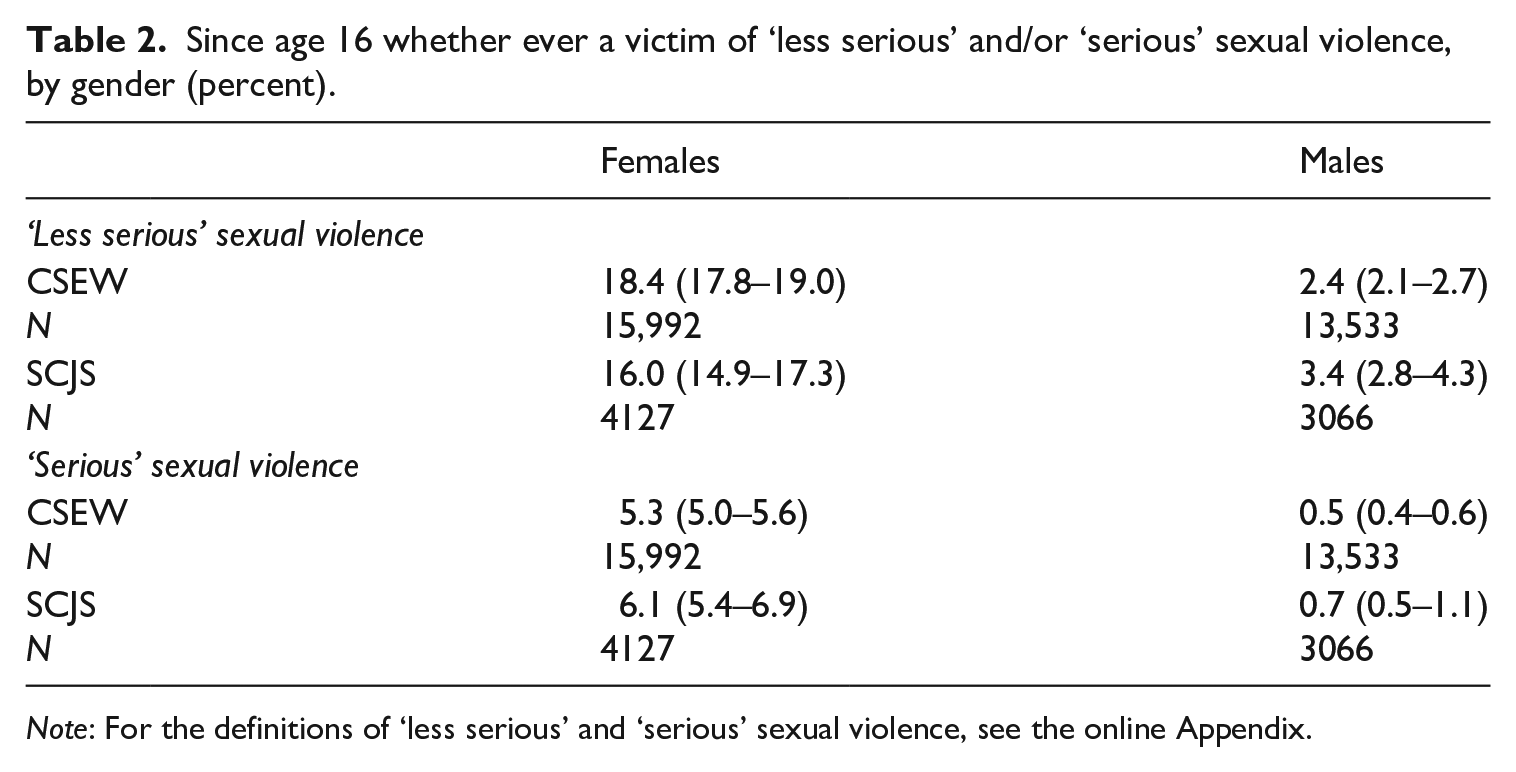
Note: For the definitions of ‘less serious’ and ‘serious’ sexual violence, see the online Appendix.
It can be seen from Table 2 that the rates for both ‘less serious’ and ‘serious’ sexual violence were higher for females than males in both surveys. For ‘less serious’ sexual violence offences the differences between the two crime surveys were statistically significant although in opposite directions, being higher for females in CSEW than SCJS but lower for males. For ‘serious’ sexual violence, prevalence was higher in Scotland than England and Wales for both females and males, but the confidence intervals for each estimate overlapped. Overall, however, the rates are quite similar.
Attempted and completed sexual violence
Turning to the definition of sexual violence adopted by Natsal-3, estimates from the four samples on the prevalence of ‘attempted’ and ‘completed’ sexual violence are given in Table 3 (see the online Appendix for the definitions of each category). Estimates are based on respondents answering ‘yes’ or ‘no’; omitted are those who answered ‘don’t know’ or refused to answer.
Since age 16 (15 VAW-EU(UK)) whether ever a victim of ‘attempted’ and/or ‘completed’ sexual violence, by sex (percent).
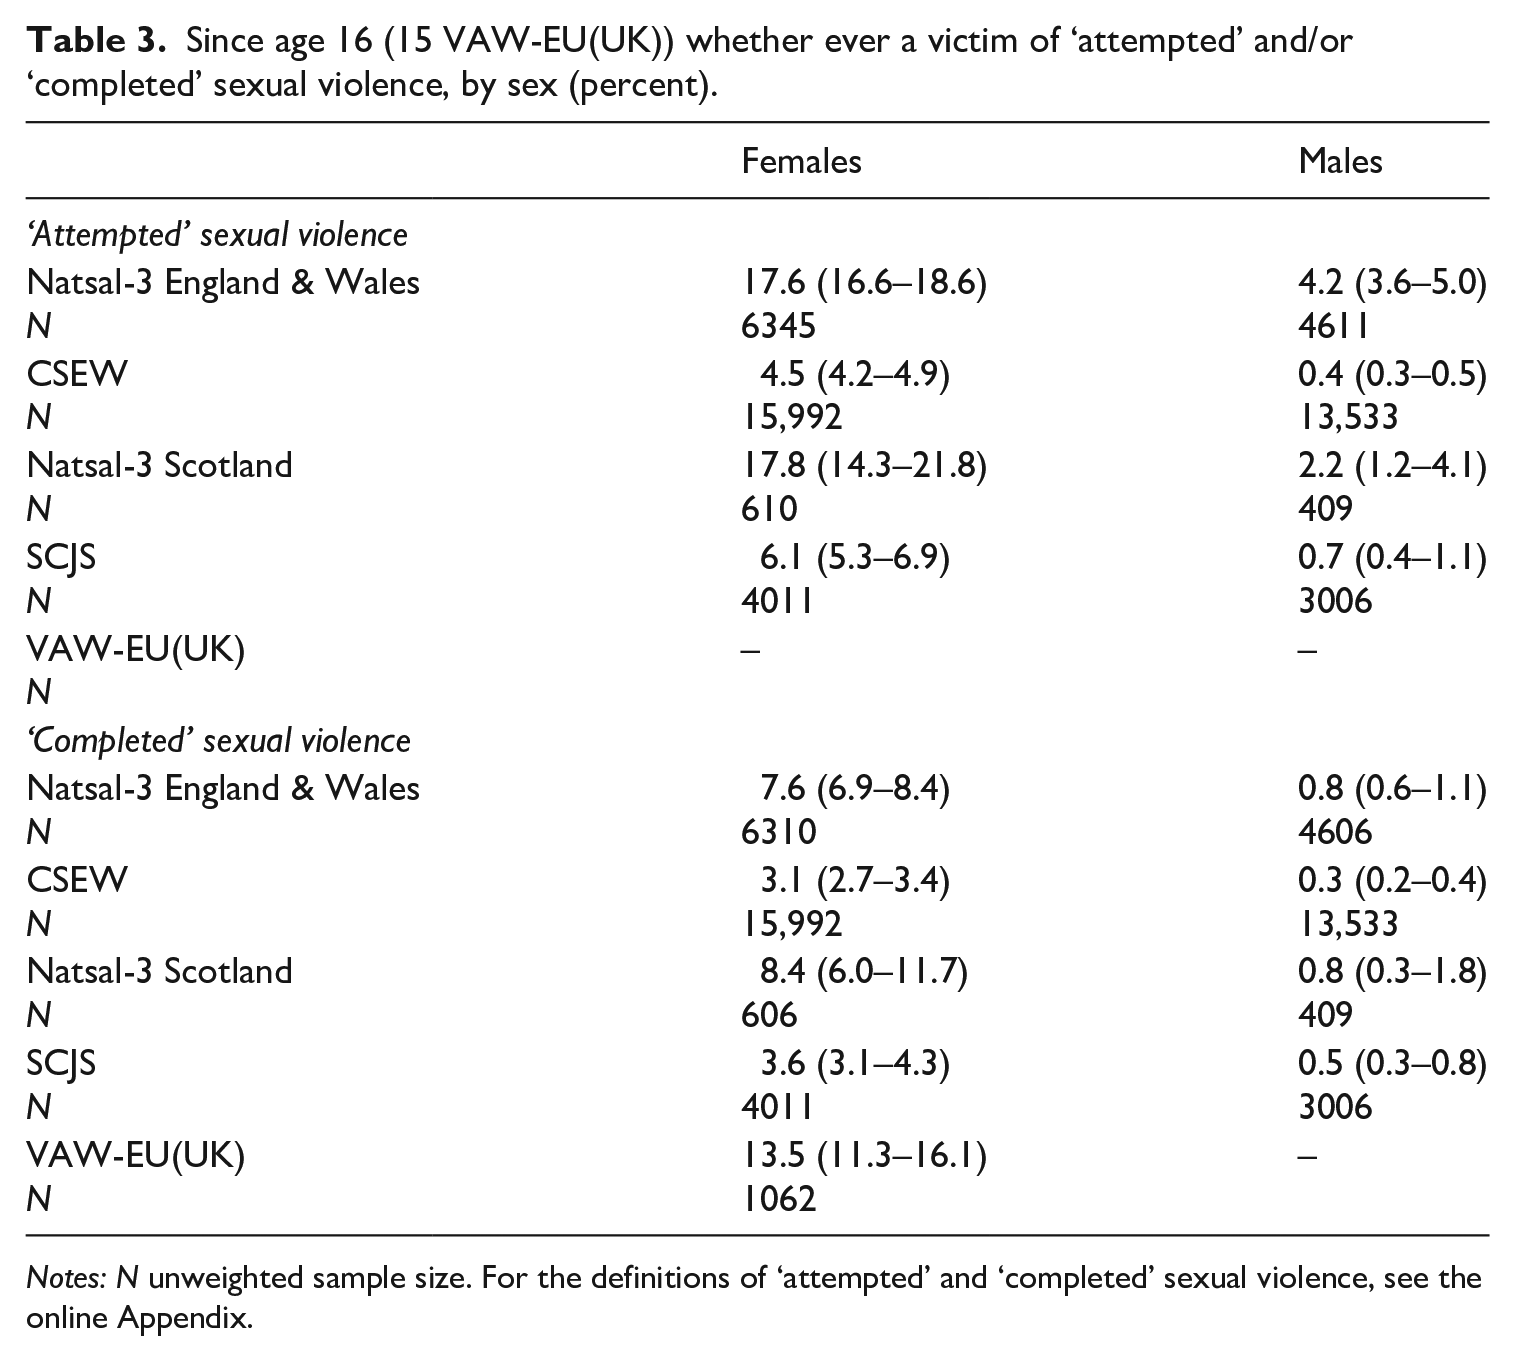
Notes: N unweighted sample size. For the definitions of ‘attempted’ and ‘completed’ sexual violence, see the online Appendix.
In every survey women were much more likely than men to have experienced either ‘attempted’ or ‘completed’ sexual violence since age 16. For ‘completed’ sexual violence, the rates for women were approximately 10 times the rates for men (but 7 times in SCJS). That ratio also held within the crime surveys for ‘attempted’ sexual violence but it was not so marked in Natsal-3.
However, the main focus of this article is the difference in rates between the surveys. For females, rates of completed sexual violence are highest in VAW-EU(UK), with 13.5 percent of women reporting being a victim. Beyond this, a fairly consistent pattern emerges: Natsal-3 percentages are between two and four times greater than the percentages given by their corresponding crime surveys. Furthermore, the percentages are higher in both absolute terms and relative terms for attempts compared with completed sexual violence. All differences between Natsal-3 and their corresponding crime surveys are judged statistically significant, with confidence intervals that do not overlap. Comparing the two crime surveys, the difference on ‘attempted’ sexual violence (CSEW 4.5, SCJS 6.1) is statistically significant but not so for ‘completed’ sexual violence (CSEW 3.1, SCJS 3.6).
For males, although the prevalence rates are lower in every case than for females, the ratios between surveys are not too dissimilar. As in the case for females, the ratios for ‘attempted’ sexual violence are higher than the ratios for ‘completed’ sexual violence. The major difference is that men were 10.5 times more likely to report ‘attempted’ sexual violence in Natsal-3 in England and Wales than were their counterparts in CSEW. This magnitude of difference did not hold between the two Scottish surveys, where the ratio was more in line with the ratios for females at 3.1. The differences between Natsal-3 and their corresponding crime surveys were statistically significant, with the exception of the difference between Natsal-3 Scotland and SCJS for ‘completed’ sexual violence (Natsal-3 Scotland 0.8, SCJS 0.5). The differences between the two crime surveys were not statistically significant for ‘attempted’ or ‘completed’ sexual violence. Interestingly, and in contrast to females, within both crime surveys the prevalence rate for males was very similar for ‘attempted’ and for ‘completed’ sexual violence. Nevertheless, the overwhelming conclusion is that both women and men were considerably more likely to report sexual violence in the context of Natsal-3 than in either crime survey, with estimates from Natsal-3 between 1.6 and 10.5 times larger.
Table 4 presents prevalence rates of ‘attempted’ and ‘completed’ sexual violence by age for women, with the corresponding results for men in Table 5.
Since age 16 (15 VAW-EU(UK) and age 18–24) whether ever a victim of ‘attempted’ and/or ‘completed’ sexual violence by age: Females (percent).
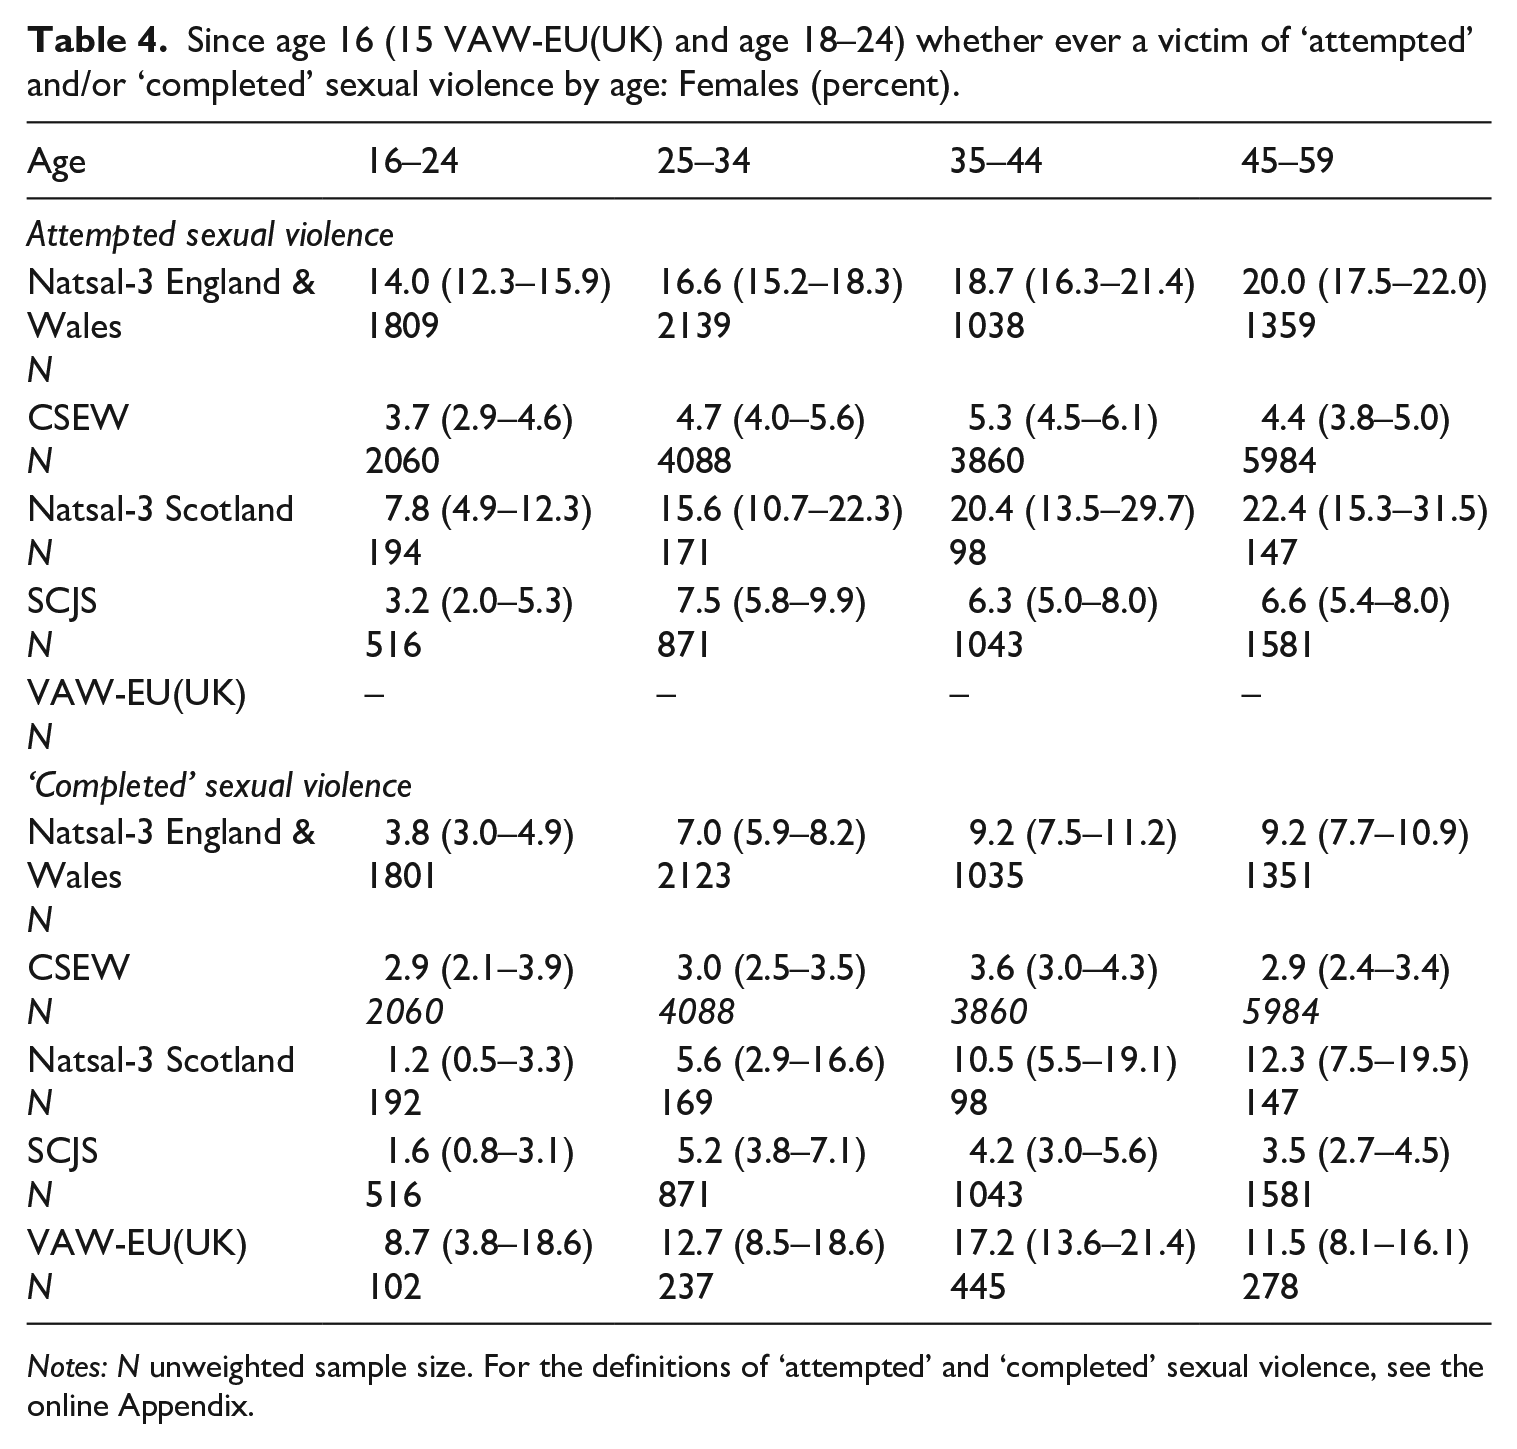
Notes: N unweighted sample size. For the definitions of ‘attempted’ and ‘completed’ sexual violence, see the online Appendix.
Since age 16 whether ever a victim of ‘attempted’ and/or ‘completed’ sexual violence by age: Males (percent).
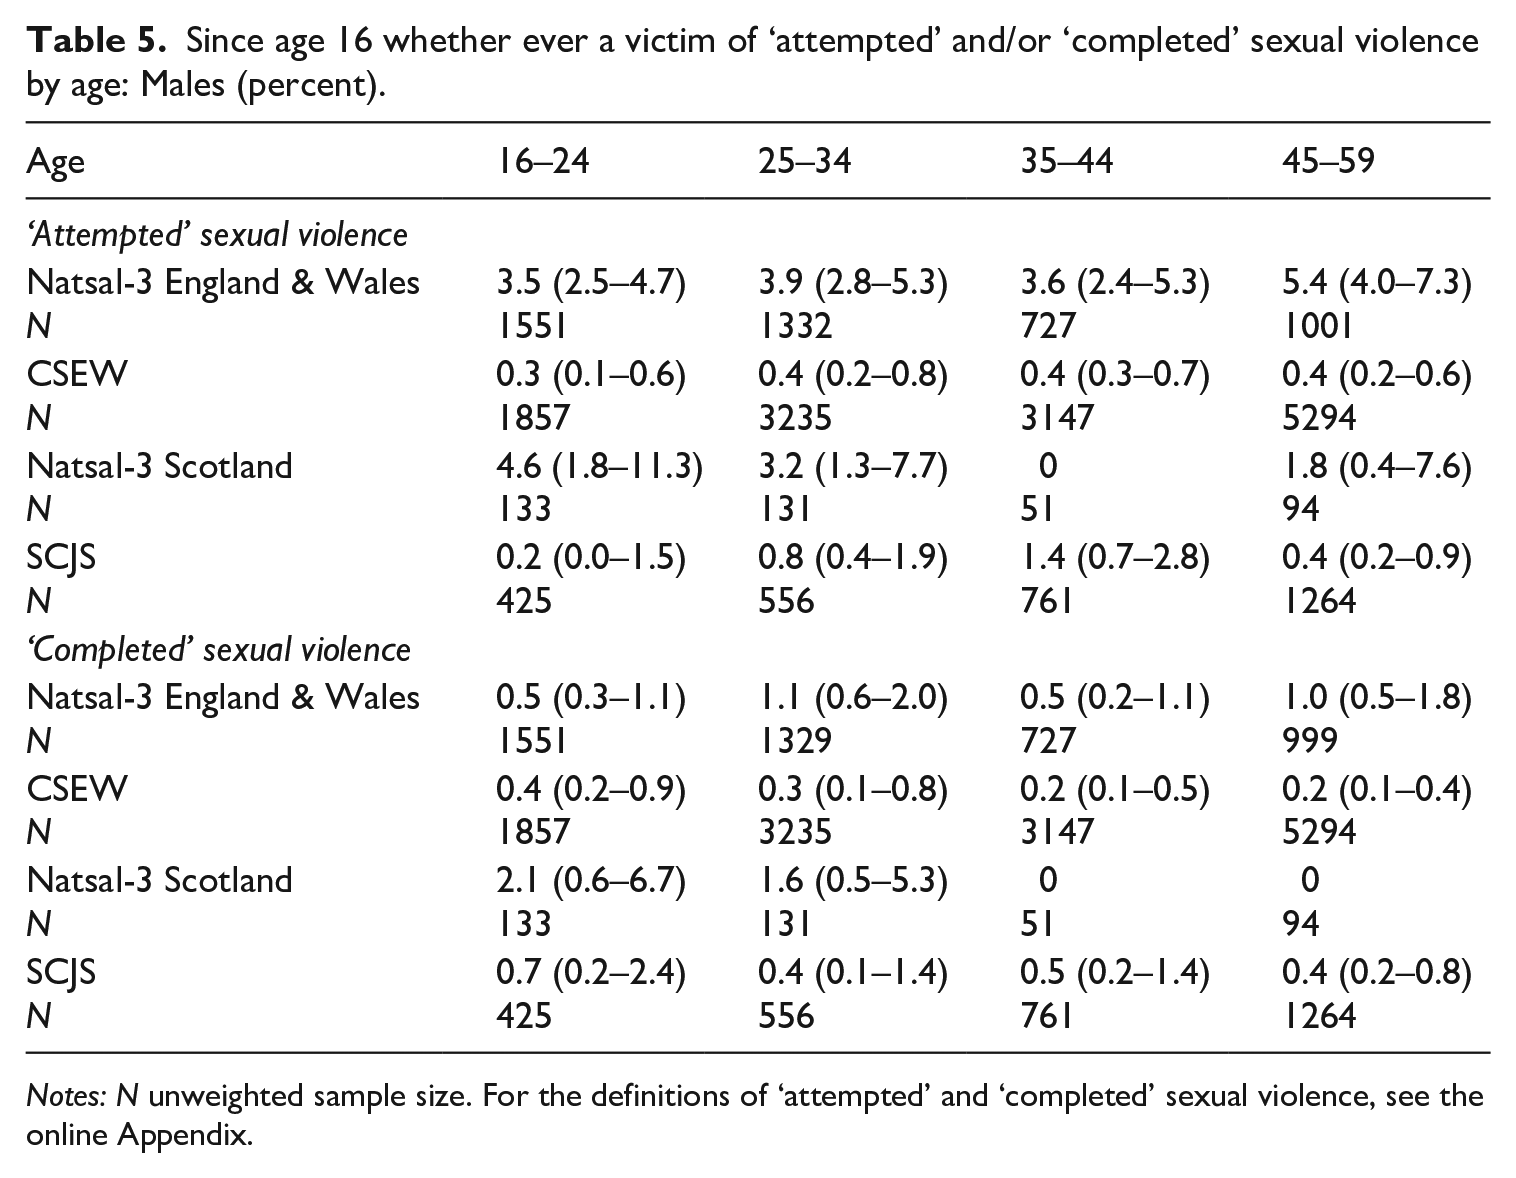
Notes: N unweighted sample size. For the definitions of ‘attempted’ and ‘completed’ sexual violence, see the online Appendix.
All of the available data have been reported in these tables, but it should be noted that the rates given in some cells may be based on a small number of respondents, especially in the case of Natsal-3 Scotland and more particularly males within that survey. Notwithstanding that caveat, for females, lower rates of both ‘attempted’ and ‘completed’ sexual violence are to be found in the lowest age group. (Perhaps not surprisingly because the rate is prevalence and the youngest age group have had less time to experience sexual violence since the start of the reference period.) Comparing samples, it would appear that older females in Natsal-3 were more likely to report sexual violence than their counterparts in the crime surveys. For example, comparing CSEW and Natsal-3 England & Wales (for which comparisons are most reliable given the sample sizes), for females aged 16–24, 14.0 percent reported being the victim of attempted sexual violence compared with 3.7 percent in CSEW – a ratio of 3.8, which rises to 4.5 for the 45–59 age group. The difference is more marked for ‘completed’ sexual violence: the ratio for the youngest age group is 1.3 and for the oldest age group 3.2.
The higher rates of ‘completed’ sexual violence given by VAW-EU(UK) are maintained across all age groups. The comparatively high rate for the youngest age group may be due to the absence of 16 and 17 year olds. It was noted above that this survey included relatively more 35–44 year olds and fewer 45–59 year olds, which, given the higher prevalence rate for the former age group compared with the latter, may have slightly inflated the overall rate for this survey.
For males, the rates are lower than for females and fluctuate more widely. However, it would appear that younger males are as likely or perhaps more likely to report sexual violence than are older males and the differences between the surveys are not clear cut.
In all surveys, those who reported that they had experienced sexual violence were asked to record their relationship with the perpetrator. There were differences in the definitions of relationships, and respondents to the crime surveys could report more than one incident and thus more than one relationship. By contrast, respondents to Natsal-3 were asked only in response to the last incident and, furthermore, the question was put only to those experiencing ‘completed’ sexual violence. Nevertheless and despite these anomalies, around half of all perpetrators in the crime surveys and in Natsal-3 were or had been in a relationship with the female victim. This percentage rose to 61 percent in VAW-EU(UK). The other clearly defined ‘relationship’ category was where the perpetrator was a stranger to the victim. The extent to which perpetrators were strangers varied between the surveys: 15.9 percent in Natsal-3, 14.8 percent in CSEW, 11.9 percent in SCJS and falling to 8.5 percent in VAW-EU(UK).
In addition to identifying the perpetrator, victims of ‘completed’ sexual violence were asked in Natsal-3, CSEW and SCJS whether or not they had reported the incident to the police. For female victims, the rate was similar across these three surveys – approximately 15 percent (Natsal-3 13.8, CSEW 12.4 and SCJS 17.4).
Discussion
In this article we looked at four surveys conducted in the UK that attempted to measure the extent of sexual victimization. Lower estimates were provided by the two crime surveys, CSEW and SCJS, which showed remarkable similarity between them both on their own measures – ‘serious’ and ‘less serious’ sexual violence – and on the measures adopted here – ‘completed’ and ‘attempted’ sexual violence. Higher estimates were produced by Natsal-3, a survey devoted to understanding all aspects of sexual activity and sexual health. The highest estimates emanated from VAW-EU(UK), a survey focusing on physical and sexual violence against women. It was interesting that on other aspects of risky behaviour – the prevalence of drinking and drug use – the surveys produced comparable results, suggesting that it was the questions on sexual violence that were treated differently in each survey, not other forms of behaviour.
However, there was no evidence to suggest that the different age groups perceived the surveys differently. The uplift between surveys persisted across ages. Nor was there much evidence to suggest that acts by certain people were viewed differently in each survey. In most cases the perpetrator was or had been in a relationship with the respondent. In the surveys where respondents were asked, a similar proportion of incidents were reported to the police.
The administration of the surveys was consistent across surveys. All were face to face but, for the sexual violence component, respondents were asked to ‘self-complete’ by entering their answers directly and anonymously into a computer. The British Crime Survey (the forerunner to CSEW) went over to self-completion in 1996 and the incidents of domestic violence increased significantly (Mirlees-Black, 1999). All the evidence since has confirmed the superiority of self-completion over face to face when addressing sensitive topics. Self-completion procedures ‘either reduce the respondent’s sense of the presence of another person or affect the respondent’s motivation to tell the truth or both’ (Tourangeau and Yan, 2007; see also Dayan et al., 2009). The exception was VAW-EU(UK), where the entire interview was conducted face to face (although respondents were given a paper questionnaire to complete later to record anything they might not have liked to divulge to the interviewer). And yet VAW-EU(UK) produced higher estimates despite the received wisdom that sensitive questions are best addressed via some form of self-completion methodology. Here, the fact that all interviewers were women and highly trained in the subject matter is likely to be important. (One concern of early crime surveys was that, when asking about such topics as domestic violence, the other party may well have been present. The women interviewers in VAW-EU(UK) would have been made aware of that potential risk.) Notwithstanding the method of interview, it is likely that female victims are more willing to disclose to an empathetic female interviewer.
It was noted that VAW-EU(UK) achieved a much lower response rate than the other surveys. This is likely due to the reduced effort put into contacting potential respondents. The interviewer in VAW-EU(UK) was obliged to try at least three times to secure an interview, whereas CSEW may have up 20 call-backs (and CSEW also puts in considerable effort by sending out letters in advance of an interview). More importantly, did the low response rate lead to the higher estimates of sexual violence found by VAW? There is no evidence to suggest it did. A recent study (Sturgis et al., 2017) analysed data from six major UK surveys, with one being CSEW, in order to examine how the number of calls affected the response rate and the outcomes measured by the survey. Although response rates improved with the number of call-backs, the outcomes changed only fractionally, especially after the third call (where response rates would have been low).
We cannot discount the possibility that differences in the question wording of the surveys may, in part, be contributing to the observed differences in estimates. Spiegelhalter suggests that the difference between the CSEW and Natsal-3 is ‘probably due to the Crime Survey using the term “rape”’ (2015: 284), in contrast to Natsal-3, which uses ‘non-volitional sex’, ‘making it clear they were including experiences that were not necessarily a criminal offence’ (2015: 283). This is not the case. The confusion here is that only the publication of results from these two surveys uses the headings ‘rape’ and ‘non-volitional sex’; the actual questions to both sets of interviewees avoided both terms (see the online Appendix).
Yet although the surveys all adopted a comparable approach to question wording – avoiding the use of subjective, emotive and prejudicial words – they do differ in specifics. Fisher and Cullen (2000) emphasize the importance of referring directly to behaviours, arguing that, by describing the range of different acts that might constitute sexual violence, a more comprehensive picture can be obtained. Both crime surveys adopt this approach, requiring respondents to think directly about a range of different activities that they might have experienced. Contrary to expectations, this actually resulted in a lower estimate from these surveys. The lower estimates may suggest that this approach is actually leading respondents to adopt a narrower definition of sexual violence when questioned in this way (at least in the context of a crime survey), perhaps missing some activities that people would self-define as sexual violence. The crime surveys also make direct reference to emotional reactions to these activities – fear, alarm and distress – which may plausibly lead some respondents to discount more ambiguous events, further depressing these estimates. Conversely, the more general questioning strategy adopted by Natsal-3 may be enabling respondents to consider a wider range of adverse actions as ‘in-scope’.
Although there was little difference in the words used, VAW-EU(UK) had a different approach. Instead of asking the question once and leaving it to respondents to identify which of a list of violations they had been subjected to, and to identify the perpetrator in a later question, VAW-EU(UK) inverted the sequence and repeated the question three times, first in respect of non-partners, then in respect of previous partners and again in respect of the current partner. This approach is likely to have elicited higher positive responses than the less prompted approach of the other surveys.
Notwithstanding the importance of question wording, the other major difference would appear to be the type of survey and how this may have affected the perception of respondents and how that can have non-negligible impacts on survey estimates. Surveys such as the CSEW and SCJS situate sexual violence within the broader context of criminal activity. ‘A survey that is framed by the concept of “crime” may under-record those acts of violence whose legality may be considered by respondents as ambiguous’ (Walby and Myhill, 2001; and the finding that men were reluctant to record attempted sexual violence as a crime offers some support). (And the finding that men were reluctant to record attempted sexual violence as a crime offers some support.) Thus crime surveys produce markedly lower estimates of sexual violence when compared with surveys that examine sexual violence within the context of sexual behaviours and sexual health more generally.
There are parallels. The impact that the type of survey can have on measured outcomes was highlighted by Tarling (2000) in a different subject area. Tarling found that dedicated surveys on the extent of volunteering and charitable giving produced considerably higher estimates than those obtained by more general surveys such as the Family Expenditure Survey or the General Household Survey, where voluntary activity comprised only one element, or a small dimension, of the survey’s remit. By their nature, dedicated volunteering surveys were more focused on teasing out the extent and range of voluntary activity. It is also possible that more narrowly focused surveys will appear more salient to that sub-set of the population who have relevant experiences. In the context of sexual violence, this might indicate that victims of sexual violence would be more willing to participate in a dedicated survey such as Natsal-3 or a survey that has been designed more explicitly to enumerate sexual violence against women such as VAW-EU(UK) than in a more general survey (and violence against women surveys are often undertaken to achieve the broader aim of promoting women’s safety). Conversely, those who had not experienced such victimization may be less likely to participate in a dedicated survey but more likely to do so in a more general survey.
Although every attempt has been made to harmonize the data to ensure comparability, we are restricted by the available data. The limitations include some inconsistencies in the range of in-scope ages covered by the surveys, moderate differences in response rates (more marked for VAW-EU(UK)) and some irreconcilable differences in the specific question wording used in each survey. Some of the estimated differences between surveys were also based on comparatively small sample sizes, particularly when assessing differences by age and gender. We are also unable to say anything about the extent to which non-sexual violence questions are responded to in the same manner. Natsal-3 does not ask about any other forms of criminal activity and there is also limited scope for comparisons with VAW-EU(UK). We did, however, observe similar distributions of drug use across the surveys, suggesting the differences in sexual violence estimates were being driven by the specific connection between the crime and survey type, and that they are more sensitive to contextual and framing factors. Finally, although restricting our comparison to a single point in time has ensured that any observed differences are not confounded by cultural shifts in the status of sexual violence as a crime, or by changing public attitudes towards these offences, it remains possible that in a different socio-political context the observed differences between surveys would be more (or less) apparent.
Our goal in this study is not to say that some approaches are intrinsically right, whereas others are producing incorrect, or inaccurate, estimates. Instead, by highlighting where these differences persist and connecting them more closely to the methodological context of each study, a more comprehensive understanding of the scope and nature of sexual violence can be achieved. We have shown that, when experiences of sexual violence are situated within the broader context of consensual sexual activity, respondents appear primed to identify all behaviours that are threatening or violent and violate their normative understandings of consensual sex. Similarly, focused violence against women surveys (‘aggravating surveys’, Kivivouri, 2011) seek to highlight crimes against women. By contrast, respondents to general crime surveys may be limiting their cognitive assessments to the most serious forms of activity, which are most clearly identifiable as criminal. This is important for generating robust estimates of activities that can be consistently measured across time, but may come at the expense of gaining a full picture of the range and nature of sexual violence and threatening behaviours.
Supplemental Material
EJC_-_Prevalence_of_sexual_violence_-_APPENDIX_revised – Supplemental material for Prevalence of sexual violence: A comparison of estimates from UK national surveys
Supplemental material, EJC_-_Prevalence_of_sexual_violence_-_APPENDIX_revised for Prevalence of sexual violence: A comparison of estimates from UK national surveys by Ian Brunton-Smith, John Flatley and Roger Tarling in European Journal of Criminology
Footnotes
References
Supplementary Material
Please find the following supplemental material available below.
For Open Access articles published under a Creative Commons License, all supplemental material carries the same license as the article it is associated with.
For non-Open Access articles published, all supplemental material carries a non-exclusive license, and permission requests for re-use of supplemental material or any part of supplemental material shall be sent directly to the copyright owner as specified in the copyright notice associated with the article.