
Abstract
This study describes the criminal careers of offenders convicted of fraud, distinguishing different career dimensions such as intermittency, versatility and specialization. Results indicate that most fraud offenders are versatile in the sense that they also have significant criminal records for other serious offending (that is, not fraud). At the same time they are also specialized in fraud. When we examine developmental trajectories of serious offending and next explore patterns of fraud for the groups identified, we find that offenders in our sample represent a heterogeneous group and that the classic divide between typical financial (for example, white-collar) offenders and common criminals does not apply to the majority of our sample.
Introduction
Ever since the 1980s there has been considerable debate about Sutherland’s (1949) offender-based approach to offending. According to Sutherland, who was one of the first to recognize the importance of studying a white-collar crime category, white-collar criminals are defined by high social status and occupation, providing them with opportunities to commit types of crime that are out of reach for the ‘common’ criminal (see also Sutherland, 1983). In addition, white-collar offenders were typically thought of as one-shot offenders, with few prior convictions and at low risk of developing a diverse crime pattern (Weisburd and Waring, 2001). This profile supposedly distinguished white-collar offenders, who commit their crimes in the course of their occupation, from the typical street criminal, whose disadvantaged social background, low self-control and criminal history put them at risk of a prolonged and versatile criminal career.
In sharp contrast to the 1940s however, when most financial crimes were out of reach for ordinary people, in modern-day society the opportunity structure for white-collar crime has dramatically changed. The growth of the credit economy, the increase of the service sector, increased urbanization, and the advent of the internet – to name but a few factors – have increasingly democratized the phenomenon of financial crimes and fraud. With the advancement of technology, crimes labelled as ‘white-collar’ do not require employment or specific skills, and have increasingly come within range of the poor and disadvantaged who disproportionately came in contact with the criminal justice system then and now. A growing amount of empirical research indeed shows that the traditional stereotype of the white-collar criminal does not fit well with the characteristics and criminal career patterns of offenders involved in financial crimes or fraud observed (Benson and Moore, 1992; Piquero and Benson, 2004; Piquero and Weisburd, 2009; Weisburd et al., 1990). Many convicted for white-collar crimes are middle-class citizens and a nontrivial portion has committed additional (that is, non-financial) crimes (Weisburd et al., 1991; Weisburd and Waring, 2001). Consequently, the traditional focus on high social status offenders needs to be broadened to include the wider array of offenders who have gained opportunities to commit fraud.
An important limitation of studies that have investigated fraud is the reliance on cross-sectional samples (see also Holtfreter et al., 2010). Although at least some level of fraud behaviour is to be observed among most (adult) offender populations, it is unknown whether white-collar crime can still be linked to other types of offences when using longitudinal designs. Such a life-course approach is necessary to explore the shared features and possible causal mechanisms giving rise to fraud and non-fraud offending.
An important advance in the recent literature of white-collar crime was the recognition of substantial heterogeneity among white-collar offenders. Weisburd and Waring (2001) identified three distinct criminal career patterns in their sample of offenders convicted in the late 1970s. Whereas some were convicted only once or twice, the criminal career of others more closely mirrored that of the typical street-crime offender in terms of length as well as offending diversity. In addition, the criminal careers of a substantial number of offenders in their sample were characterized by multiple convictions separated by long periods of intermittency, which made them distinct from both the one-shot offenders as well as the stereotypical street criminals. A more recent follow-up study using group-based modelling techniques unavailable at the time of the original study largely corroborated earlier findings yet found evidence for the intermediate offending group to be larger than was originally thought at the expense of the criminally most active group (Piquero and Weisburd, 2009). Whereas the Weisburd and Waring (2001) and Piquero and Weisburd (2009) studies provided important new insights to our understanding of white-collar crime, these studies are limited in that the data allowed offenders to be tracked not by age but rather by years since their conviction for a white-collar offence.
To date we know of only two studies that have used long-term longitudinal data on white-collar offenders to trace their criminal career development by age. A recent study by Morris and El Sayed (2013) tracked a sample of youths from the National Youth Survey in the US who reported a white-collar crime at least once between ages 11–17 from adolescence to ages 38–44. This study found evidence of different developmental patterns partially corroborating those reported by Piquero and Weisburd (2009). As noted by the authors, however, an important imperfection in their available data is a nine-year gap between two of the five consecutive waves, resulting in an extended blind spot precisely in the period where criminal trajectories appear to be changing – either downwards or upwards – for the large majority of their sample. Another recent study by Van Onna, Van der Geest, Huisman and Denkers (2014) used official conviction data to reconstruct the criminal careers for a sample of recently prosecuted white-collar offenders again from their early teens up to age 50. These researchers identified four different developmental patterns as well as socio-demographic profiles that were in part consistent with the typology put forward by Weisburd and Waring (2001). Although an important advance in terms of method, the observation period for this study was restricted to the years prior to prosecution for a white-collar offence and therefore does not speak on desistance. Also, this sample pertains to a selective subset of complex and serious cases of white-collar crime.
Building on these prior studies and in an effort to gain more detailed insight into the criminal careers of modern-day financial offenders, the current study takes a more inclusive approach by analysing a broad sample of offenders ‘ever’ convicted of fraud in the Netherlands. We will focus on the most common types of fraud in the Netherlands: forgery, embezzlement, swindling, bankruptcy fraud and tax fraud. 1 Doing so, this is the first long-term study of fraud offending that is able to follow offenders on the basis of conviction data from age 12 to age 50 and to describe their age–crime development. First, we will examine several criminal career characteristics, such as onset, incidence, intermittency and specialization. Specialization – the extent to which offenders engage in specific types of fraud, and/or common criminality – is particularly important given the prevailing image of ‘fraud offenders’ as being highly specialized (see also Weisburd and Waring, 2001: 6). Second, using group-based trajectory modelling, we will analyse the long-term development of serious offending in our sample of fraud offenders. Combining trajectory analysis with descriptive analysis of the development of fraud offending, we will explore the ways in which fraud and other serious offending (that is, not fraud) are associated. Our analyses will be based on detailed long-term conviction data that allow us to track offenders over a period of almost 40 years.
Literature
Inherent in the offender-based approach to studying financial crime was a strong focus on situational factors, and for a long time empirical work on white-collar offenders was primary based on – highly publicized – case studies (Benson and Moore, 1992). The image of white-collar offenders as one-shot offenders additionally impeded longitudinal research in this field. It was not until the 1980s that researchers started to realize that there was a lack of generalizable knowledge about the backgrounds of white-collar offenders and that criminologists were largely oblivious to the way the criminal careers of these criminals developed over the life span (Piquero and Benson, 2004; Weisburd and Waring, 2001; Weisburd et al., 1990; Weisburd et al., 1995). In the wake of criminal career research becoming a leading paradigm for studying common offending, white-collar crime researchers began collecting quantitative data on large samples of white-collar offenders, allowing statistical analyses of their criminal career development over time. Interest in the criminal careers of financial offenders was accompanied by the reintroduction of the offence-based approach, where offenders were labelled as ‘white-collar’ based not on their social and occupational status, but rather on the type of offence they committed (Benson and Moore, 1992; Weisburd et al., 1991; Weisburd and Waring, 2001). Although some scholars criticized this approach for including low-level fraudsters who did not engage in typical high-end white-collar schemes (Copes and Vieraitis, 2009; Friedrichs, 2010; Steffensmeier, 1989), other researchers argued that the traditional focus on high social status white-collar offenders was too strict, because it excluded the majority of offenders prosecuted for a white-collar offence (Weisburd and Waring, 2001: 10). Furthermore, especially in modern Western societies that have moved to a computer-based credit economy, the increased opportunities for financial crime and fraud seem to justify a more inclusive offence-based approach (Schlegel and Weisburd, 1992; Weisburd et al., 1991). In the current study we take this more inclusive approach by focusing on different types of fraud (that is, fraud, forgery, embezzlement and swindling). Focusing on these crimes, which may have been ignored in past research, we choose not to use the umbrella term ‘white-collar crime’, but will refer to these crimes as ‘fraud’ for the remainder of this article.
Offender typology
Linking criminal career dimensions, such as onset age and offending versatility, to personal characteristics, Weisburd and Waring (2001) were the first to propose a criminal-career-based typology for white-collar offenders. These researchers identified four offender groups that, to them, epitomized four different explanations for criminal involvement. The first two had similar patterns in their criminal careers, though the underlying explanations for offending were different.
Crisis responders are low-frequency offenders who commit white-collar offences typically in response to a crisis occurring in their personal or professional life (for example, financial pressures or pressures from colleagues). Few have multiple convictions for other offences and typically these offenders lead ordinary and law-abiding – though at times troubled – lives. They often own or manage small businesses that provide them the means to commit white-collar crime. The second group of offenders is called opportunity takers. To them, committing an offence is equally unusual. Yet, unlike crisis responders, their key motivation to engage in white-collar crime is to take advantage of a specific opportunity. They typically commit only one or two white-collar offences, and only when the chance arises. Crisis responders and opportunity takers constitute the bulk of white-collar offenders. Both are distinct from a third group of offenders, which is labelled opportunity seekers. This group of offenders actively seeks out opportunities to commit an offence. Despite characteristics of conventionality (Van Onna et al., 2014; Weisburd and Waring, 2001), they typically follow a more chronic – though intermittent – criminal career that spans multiple convictions. The fourth and final group of offenders is a small group of stereotypical criminals. Their white-collar offences are part of a mixed and high-frequent criminal career. Their profile is very similar to that commonly found in the general offender population: their personal lives reflect disadvantage, they often have experienced academic failure, and they show unstable employment careers.
Weisburd and Waring’s (2001) typology paves the way for a better theoretical understanding of the life-course development of offenders who – at some point in their lives – become involved in financial or occupational crime. Their explanation is a complex interplay of opportunities, situational choices and the life-course circumstances of individuals, which is not fully captured in existing theoretical models. Many theories emphasizing situational influences on offending during adulthood, for example, do not explicitly describe the process of adult onset of offending (Beckley et al., 2016), which is commonly observed for white-collar offenders (Piquero and Benson, 2004; Van Koppen et al., 2014).
Criminal careers of fraud offenders
To date little is known about the long-term criminal career development of fraud offenders. Only a handful of studies on white-collar crime have had access to longitudinal data on offenders’ criminal careers and have used group-based models to empirically distinguish different types of offender showing distinct patterns of offending over the life-course.
Piquero and Weisburd (2009) reanalysed the data on the sample (N = 968) of white-collar offenders convicted between 1976 and 1978 and who were the subjects of the 2001 Weisburd and Waring study. They estimated arrest trajectories – for all types of crime – during the 12 years following the sample members’ conviction for a white-collar offence (the criterion offence). Trajectory analysis identified three groups of offenders: low-rate offenders (71 percent), who showed only episodic involvement in crime and fit the career pattern expected for both crisis responders and opportunity takes; medium-rate offenders (25 percent), whose overall rate of offending is still relatively low and whose criminal careers are highly intermittent following a pattern conforming to that of opportunity takers; and high-rate offenders (5 percent), who had the most extensive criminal careers and therefore fit the image of stereotypical criminals. As noted earlier, a major weakness of this study was its inability to track offending by age instead of by the years since the criterion offence.
A study by Morris and El Sayed (2013) used data from the National Youth Survey (NYS) in the US. Their analyses pertain to the part of the NYS sample (N = 220) who reported having engaged in a white-collar offence at least once in the year preceding one of seven interviews. Using self-report information about white-collar offending across seven waves spanning 16 years of follow-up, they identified six offending white-collar crime trajectories: low-level offenders (21.4 percent), prevalent offenders (31 percent), intermittent offenders (13 percent), low-level desisters (13 percent), high-level desisters (6 percent) and medium-level chronics (15 percent). All trajectories were characterized by intermittency, with low levels of participation in white-collar crime at some points, and elevated levels of white-collar crimes at others. These researchers then examined self-reported levels of street crime for respondents in each of the six trajectories. Though offenders differed in their involvement in street crime, during periods of increased involvement in white-collar crime the level of white-collar crimes far surpassed that of street crimes.
To date, the most recent study on long-term criminal development of white-collar offenders is that by Van Onna et al. (2014). These researchers reconstructed the criminal histories of a cohort of white-collar offenders recently prosecuted in the Netherlands (N = 644). The majority of these offenders were brought to court by a special unit of the Public Prosecution Service. Van Onna et al. (2014) identified four different offending trajectories leading up to the conviction for a white-collar offence: stereotypical white-collar offenders (39 percent), adult-onset offenders (39 percent), adult persisters (18 percent) and stereotypical offenders (4 percent). The commonality between stereotypical white-collar offenders and adult-onset offenders, who differed in both the timing and the overall level of offending, was that they first engaged in crime when they were adults – the average onset age of street crime for these groups was 43.3 and 25.5 respectively, with the onset of white-collar offending occurring some years later. Adult persisters and stereotypical criminals also evidenced juvenile offending, with the latter group’s level of street offending topping the level of white-collar crimes four-fold. Since this study analysed offending trajectories up to the conviction for a white-collar offence, all offenders in the sample were still active offenders at the time of sampling, and the trajectories identified in this study therefore do not speak on patterns of desistance.
Finally, Van Koppen, De Poot, Kleemans and Nieuwbeerta (2010) investigated offending trajectories of offenders who were convicted for organized crime. Organized crime, which in case of the Netherlands is mostly transnational crime (for example, drug trafficking), often also involves offences such as forgery of customs documents and tax fraud. Using information from the Dutch Organized Crime Monitor, Van Koppen et al. (2010) analysed the long-term offending trajectories of 854 offenders. They identified four offending trajectories leading up to organized crime: first offenders (19 percent), adult-onset offenders (40 percent), persistent offenders (30 percent) and early starters (11 percent). In a related study by Van Koppen, de Poot and Blokland (2010), the comparison between organized crime offenders and general offenders showed that, although organized crime offenders did not differ from general offenders in terms of their average age of onset, organized crime offenders did commit more serious offences from the start of their criminal career onwards and tended to show higher levels of persistence in offending during adulthood compared with general offenders. These findings illustrate, that in a sample characterized by specific opportunity structures for fraud, an early onset is more likely than what has been typically reported in white-collar crime research.
In sum, to date trajectory studies analysing the long-term development of criminal behaviour in offenders involved in more or less typical white-collar offences are still scarce, but findings thus far indicate substantial developmental heterogeneity reflected in large groups of sporadic offenders as well as distinct patterns of adult-onset offending. In addition, crime patterns of more prolific offenders appear to be characterized by versatility, rather than by specialization in offences such as embezzlement, forgery and fraud (Weisburd and Waring, 2001).
Mapping the development of offending in white-collar offender samples, the aforementioned studies made an important advance in terms of method. At the same time, these studies were limited in their ability to prospectively map persistence of and desistance from offending in offenders by age, nor did these studies examine the full range of fraudulent offending, that is, offences that do not particularly require a high-class offender to commit them (for example, forgery, embezzlement, swindling, bankruptcy fraud, tax fraud or customs fraud). Some of these studies were also based on very specific groups of white-collar offenders involved in complex offending schemes, begging the question of whether these studies’ findings can be generalized to the larger population of fraud offenders. Changes in modern Western society call for a more inclusive approach as the barriers between fraud and common crime may have become more porous than was traditionally suggested (Benson and Moore, 1992).
Building on the insights gained from prior research and making an effort to overcome some of these studies’ shortcomings, the current study analyses the long-term criminal development from ages 12 to 50 of all offenders in a nationally representative conviction cohort who were convicted of a fraud offence at some point in their criminal career.
Method
Sample
For this study we use data from the Criminal Career and Life-course Study (CCLS; Blokland, 2005), which in turn builds on data from a 1977 Dutch conviction cohort used by Van der Werff (1986) and Block and Van der Werff (1991) to examine short-term recidivism. The original sample was chosen from a listing of the datasets of Statistics Netherlands (CBS) to represent 4 percent of all criminal cases that were either ruled upon by a judge or decided upon by the public prosecutor in 1977. For each case, information was available on the way the case was dealt with, the nature of the offence, and – when applicable – the type and severity of the sentence imposed. These data also hold information on the sex and ethnicity of the offender. At present, the CCLS extends the original study’s follow-up period of 6 years to over 25 years, with new data being added still (Blokland et al., 2005). Here we follow an offence-based approach and select all 1160 offenders who were convicted of fraud at least once during the CCLS’s extended follow-up.
Conviction data
In the Netherlands, fraud offences are frequently punished under the penal code. Although different sections of the penal code can be used to prosecute fraud offences, only a few – such as special codes for forgery, swindling and embezzlement – are commonly used, while registrations of tax fraud and social security fraud are less common. 2 Using detailed annual crime data from the official registers in the Netherlands, we were able to reconstruct the entire criminal histories of fraud offenders from age 12 – the minimum age of legal responsibility in the Netherlands – onwards.
Offending information in this study is based on convictions registered in the Judicial Documentation abstracts of the Netherlands Ministry of Security and Justice. These abstracts contain information on every case that is registered at the Public Prosecutor’s Office and the ensuing verdict. They also contain information about the type of offence. These abstracts span both juvenile and adult offending, that is, from age 12 and up – age 12 being the minimum age of criminal responsibility in the Netherlands. On average, we were able to collect conviction data over a period of 42 years, the sample members’ average age at the end of the current follow-up being 54 years (SD = 9.8 years).
The judicial registration system of the Ministry of Security and Justice classifies offences in terms of Criminal Code (CC) sections. A variety of penal codes may be used in the prosecution of fraud offences: forgery (sections 208–235 CC), embezzlement (sections 321–323 CC), swindling (sections 326–337 CC), bankruptcy fraud (sections 194, 340–347 CC), tax fraud (Economic Offences Act), and customs or duty fraud (General Customs Act).
For non-fraud offences we employed the standard classification for offences in the Netherlands (CBS, 2000) and we distinguished between serious and minor offences following Loeber, Farrington and Waschbusch (1998). Given that most minor offences are relatively common even in a random sample of Dutch men (Van der Geest et al., 2006) we chose to exclude the following minor offences from our analyses: vandalism, traffic offences and violations of city ordinances.
Analysis approach
The analyses proceeded in two steps. First we describe the development of fraud offending in terms of onset, duration, intermittency, versatility and specialization, using the forward specialization coefficient (Farrington et al., 1988). Second, using Nagin’s (2005) semi-parametric group-based trajectory model, we identify distinct trajectories of serious offending up to age 50 – including both fraud and non-fraud offending. Group-based modelling was carries out using the SAS macro called Proc Traj (see also Jones and Nagin, 2007).
Results
Development of fraud offending
Between age 12 and the end of the follow-up – or the age of death if this occurred prior to that – 1160 offenders were convicted of fraud, constituting one-quarter (25.2 percent) of the CCLS sample (N = 4595). On average, sampled offenders accumulated 2.2 fraud convictions (SD = 2.7) during the entire follow-up. The majority of this subset (N = 649) were one-shot fraudsters. Yet, among those convicted for fraud more than once (N = 511), the total number of fraud convictions ranged from 2 to 40. Table 1 shows the average onset age and criminal career length by the accumulated number of fraud convictions. The average age of onset for fraud in our sample is 30.5 (SD = 10.0), but repeat fraud offenders are significantly younger when they commit their first fraud offence (F = 21.519, p < .01). Similar to Benson and Kerley’s (2001) findings for white-collar offending, the age of onset relates to the length of the fraud-offending career. The average time between the first and final fraud conviction during follow-up (career length or duration) is 11.4 years (SD = 9.0).
Fraud-offending career characteristics by accumulated number of offences.
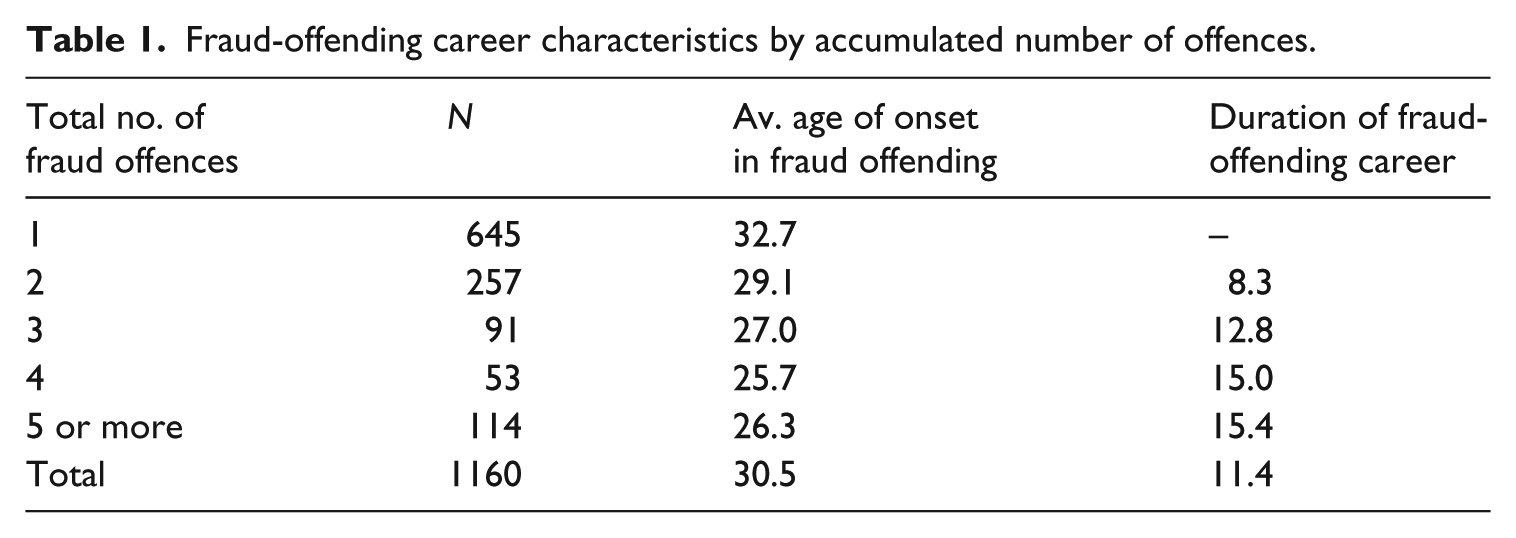
Figure 1 shows the development of fraud convictions from age 12 to age 50. The age–crime curve for fraud is less steep than that commonly found for general offending and even seems to reach a kind of plateau between ages 23 and 35. The average conviction frequencies are low at any given age, with less than one conviction in every 10 (or more) years, indicating that – even among those who are reconvicted – fraud convictions are highly intermittent.
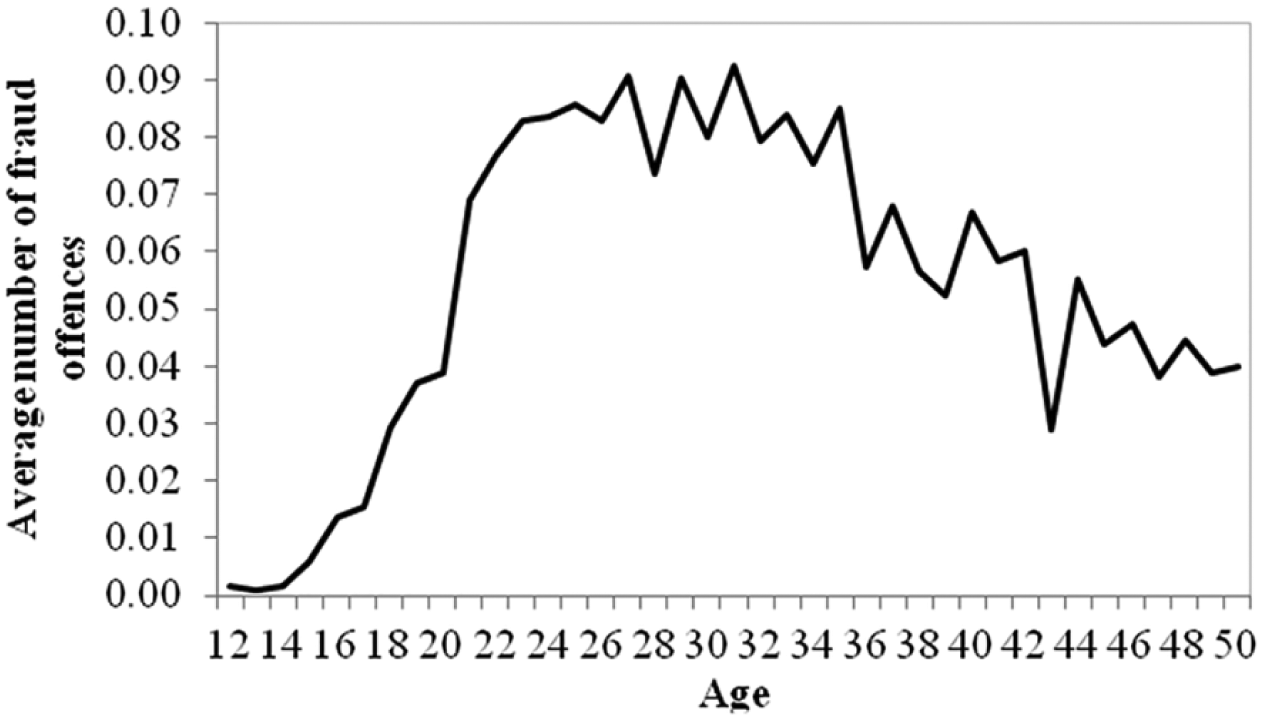
Average number of fraud offences by age.
To examine the extent to which the elongated age–fraud-offending curve results from fraud offenders typically being more criminally active during the adult period, or from fraud offences typically being committed during the adult years, Figure 2 also provides the age–street-crime curve for the sample of fraud offenders, as well as the age–street-crime curve for the remainder of the CCLS sample (street-crime convictions referring to all serious non-fraud crime). Comparing these age–street-crime curves shows that both subsamples more closely follow the typical age–crime development, with a clear peak in late adolescence. Averages among fraud offenders are higher compared with non-fraud offenders, which could indicate that – at least in this sample – fraud offending is part of a more general criminal repertoire and a possible marker of prolific, or extended, criminal activity.
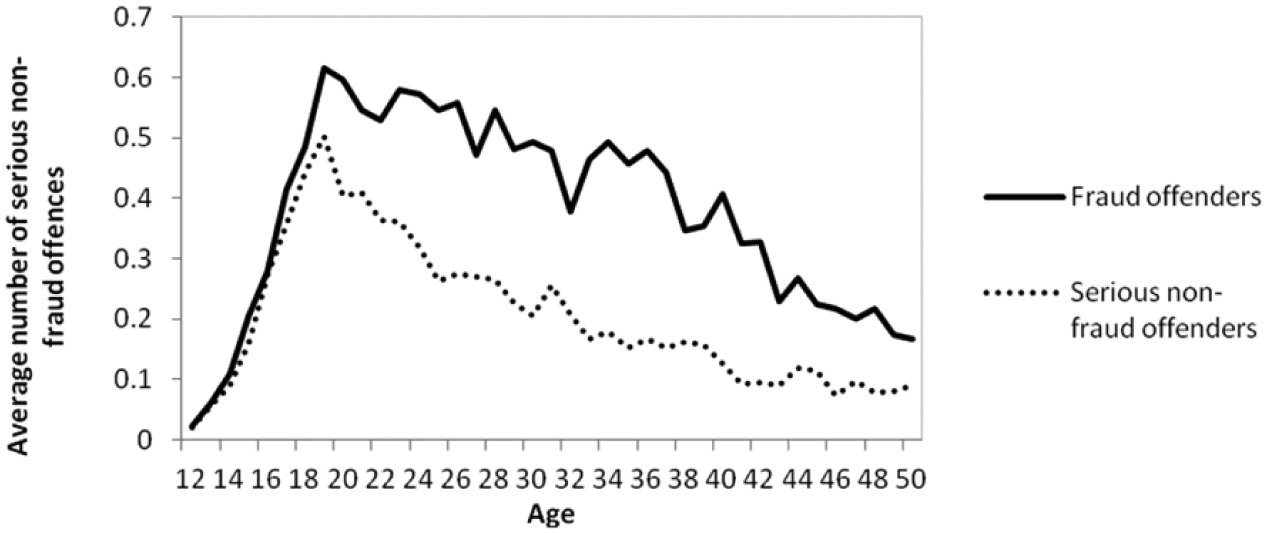
The age–street-crime curves for the subsample of convicted fraud offenders, and the age–street-crime curve for the remainder of non-fraud offenders.
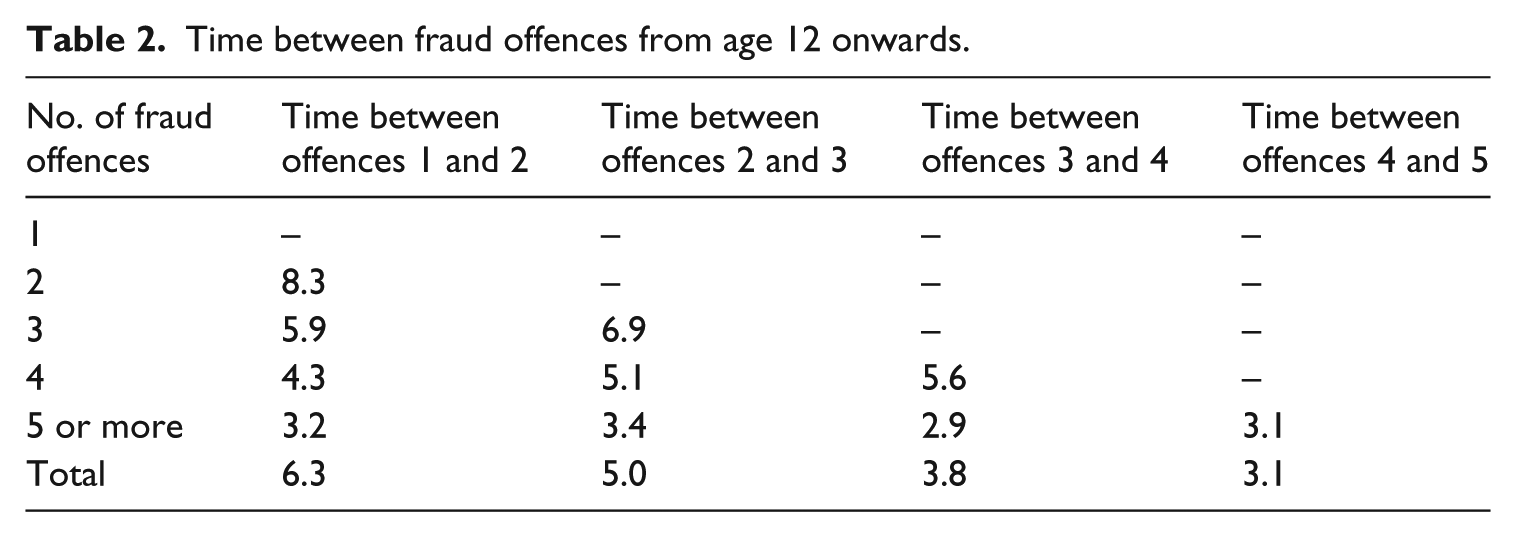
Table 2 depicts the average intermittency period between fraud offences by the number of fraud convictions in fraud offenders’ criminal careers. It shows that the average time span between subsequent fraud convictions differs between offender groups (column-wise comparison), but remains relatively stable across the criminal career (row-wise comparison). Rather than speeding up or slowing down their fraud offending, offenders appear to follow a uniform temporal pattern of fraud offences throughout their fraud-offending career. Thus, age differences in participation – rather than de-acceleration of active offenders – seem to contribute to the slowly declining age–crime curve depicted in Figures 1 and 2.
Time between fraud offences from age 12 onwards.
Offending versatility and specialization in white-collar crime
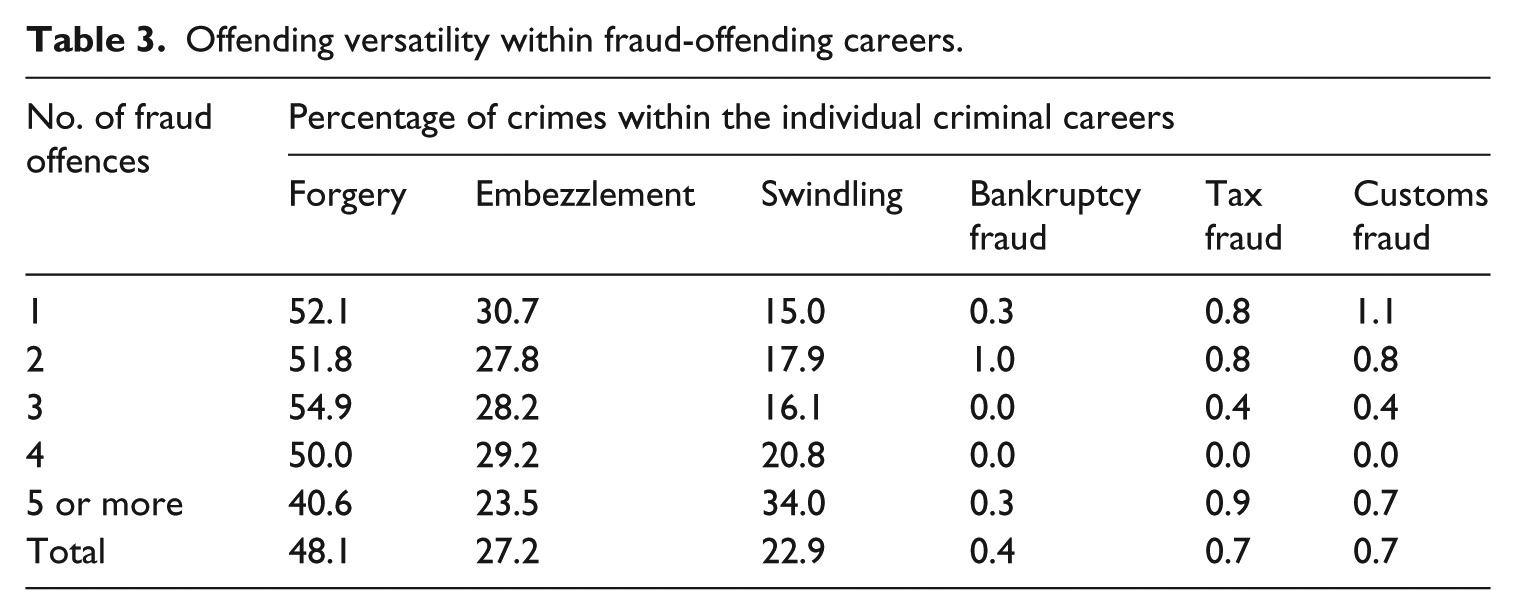
Examining offending versatility within fraud-offending careers, three types of fraud offence are most common: forgery (48.1 percent), embezzlement (27.2 percent) and swindling (22.9 percent). Other forms of fraud offending are rare in this sample (see also Table 3). High-frequency fraudsters (who commit five fraud offences or more) are disproportionately involved in swindling. Constituting less than 10 per cent of the sample (9.8 percent), they commit more than half of all offences of swindling (52.4 percent). These convictions involve a variety of fraud offences, such as identity fraud, mortgage fraud and – less often – internet fraud. 3
Offending versatility within fraud-offending careers.
In addition to measuring the extent to which offender groups are overrepresented in specific types of fraud conviction, we also analyse differences in offence specialization across subgroups of offenders. Table 4 shows the overall offence transition matrix for all offender groups including the forward specialization coefficient (FSC), which is an indicator of offence specialization for each of the diagonal cells of the matrix (Farrington et al., 1988). The FSC can vary from 1 (complete specialization) to 0 (complete versatility) to −1 (no offences followed by the same offence). The FSC values for forgery, embezzlement and swindling all indicate a small but substantial degree of specialization for these crime types. The largest FSC value is for forgery, indicating convicted forgers’ relatively high risk of reconviction for the same type of offence.
Transition matrix for types of fraud offence.
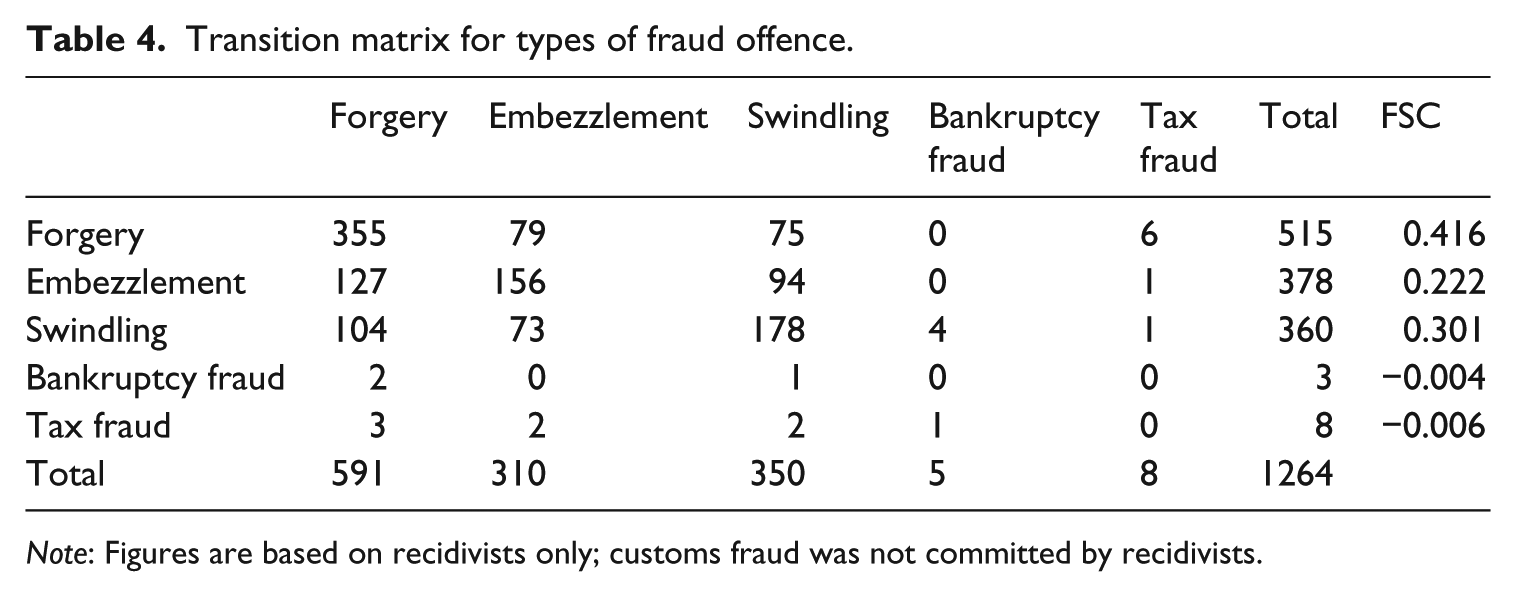
Note: Figures are based on recidivists only; customs fraud was not committed by recidivists.
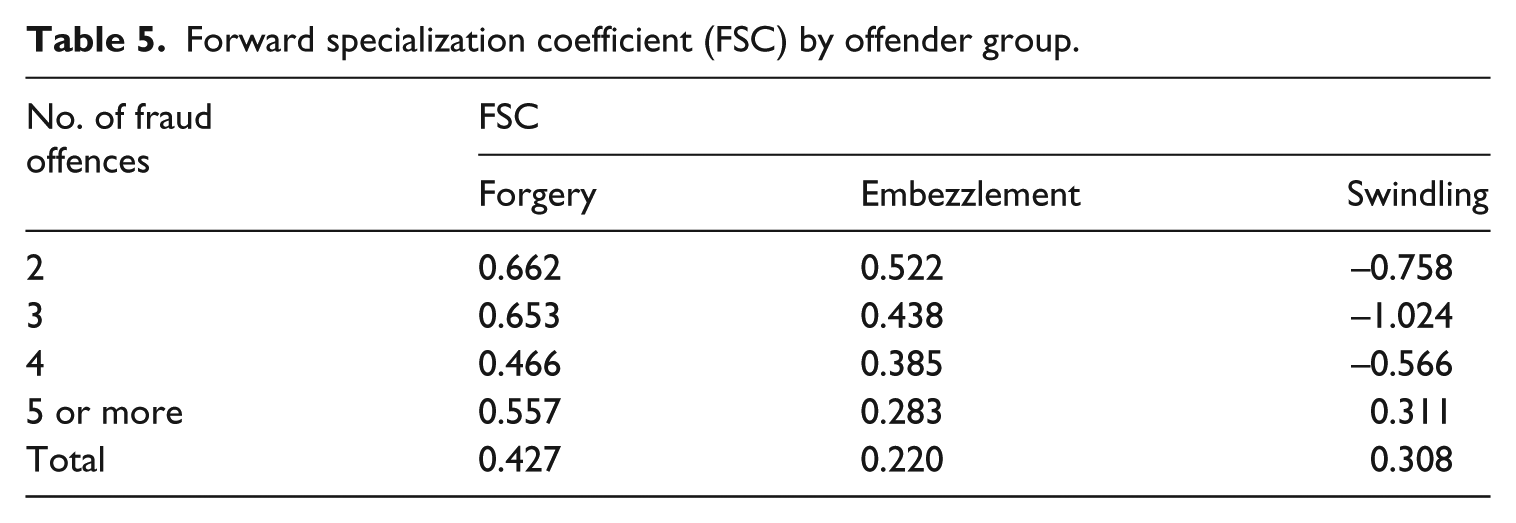
Analysing the most common fraud offences only (forgery, embezzlement and swindling), we calculate FSC values separately by the total number of fraud convictions in fraud offenders’ criminal careers. The FSC values in Table 5 indicate a relatively high degree of specialization for forgery and – to a lesser degree – embezzlement for all offender groups. Only for high-frequency fraud offenders, who have five fraud convictions or more and who are overrepresented in swindling (Table 3), the degree of specialization in swindling is relatively high. For forgery and embezzlement, specialization is not confounded by frequency, as not only frequent offenders are specialized.
Forward specialization coefficient (FSC) by offender group.
Development of non-fraud offending
Next, we examine how fraud offending is related to the development in serious non-fraud offending at a group level. To do so, we use Nagin’s (2005) semi-parametric group-based trajectory model, with the number of convictions for serious non-fraud offences in a given year as the dependent variable. Group-based models do not assume normality in the distribution of the development of offending, but approximate this distribution by a discrete number of groups. In estimating criminal development over time, parameters defining the shape of that development are allowed to vary across groups. We fitted a zero-inflated Poisson model to account for the fact that convictions are relatively rare events. The use of an inflation parameter allows subjects to have short periods of non-offending without this resulting in disjunct changes in the modelled rate of offending (Bushway et al., 2003).
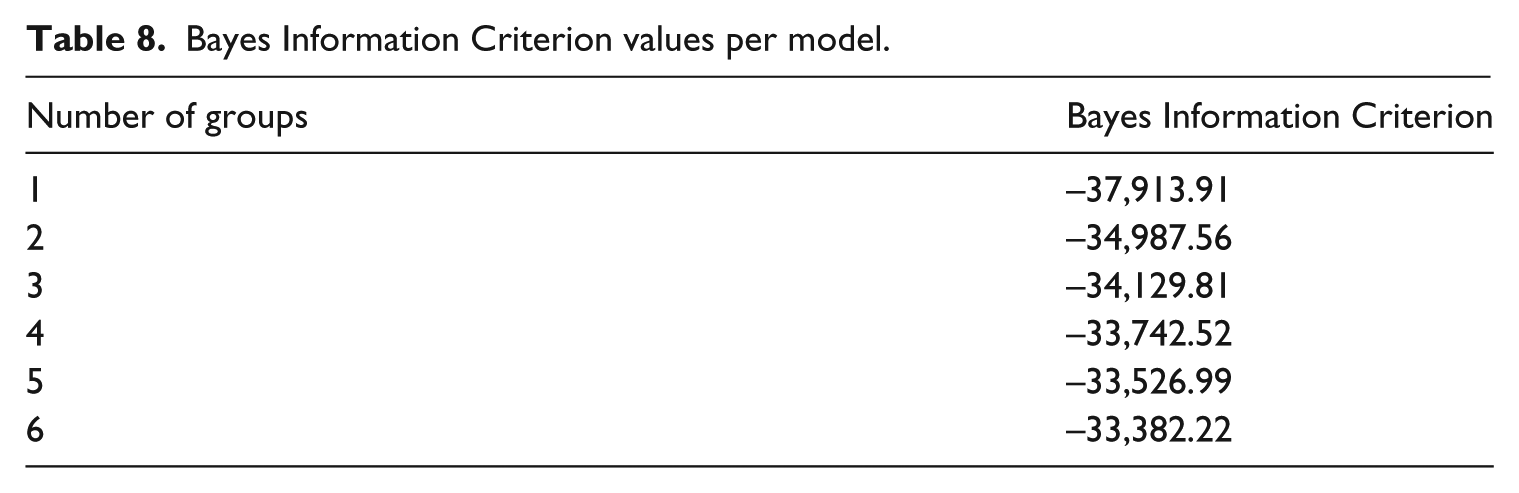
The Bayesian Information Criterion (BIC) was used to determine the optimal number of groups. However, as Nagin (2005) explains, the BIC by itself is not always useful in identifying the best model. For example, in some applications BIC scores continue to increase as more groups are added, or, consequently, at some point adding more groups generates very small group sizes. In that case, we follow Nagin’s (2005: 75) recommendation to select a model including only groups that disclose features of the data that are theoretically or empirically important. To evaluate the model fit, we calculated the average posterior probabilities (higher than .7) and the odds of correct classification (higher than 5.0).
Testing several multiple-group models, a five-group trajectory model resulted in a BIC value of −33,526.99 (N = 1160), higher than that of quadratic models distinguishing one to four groups, but not substantively lower than that for a six-group quadratic model (−33,382.22; N = 1160), which led to the identification of very small groups (less than 2 percent), so the more parsimonious five-group model was chosen for the analysis (for a complete overview of BIC values, see Appendix A). The inflation parameters resulting from the zero-inflated Poisson model were estimated for each of the five groups and turned out significant for all except one (Table 6). Group probabilities were high, all averaging above .87. The odds of correct classification for the groups indicated high assignment accuracy. The five-group model thus performed well on all other criteria of model fit, corroborating our model choice. Table 6 presents the five-group trajectory model characteristics. For ease of reporting, we labelled the trajectory groups based on the overall shape and level of the respective trajectories as follows: sporadic offenders (SOs), young adult (YA) offenders, low-frequency persisters (LFPs), late-desisting (LD) offenders, and persistent offenders (POs).
Zero-inflated Poisson quadratic model with five groups.
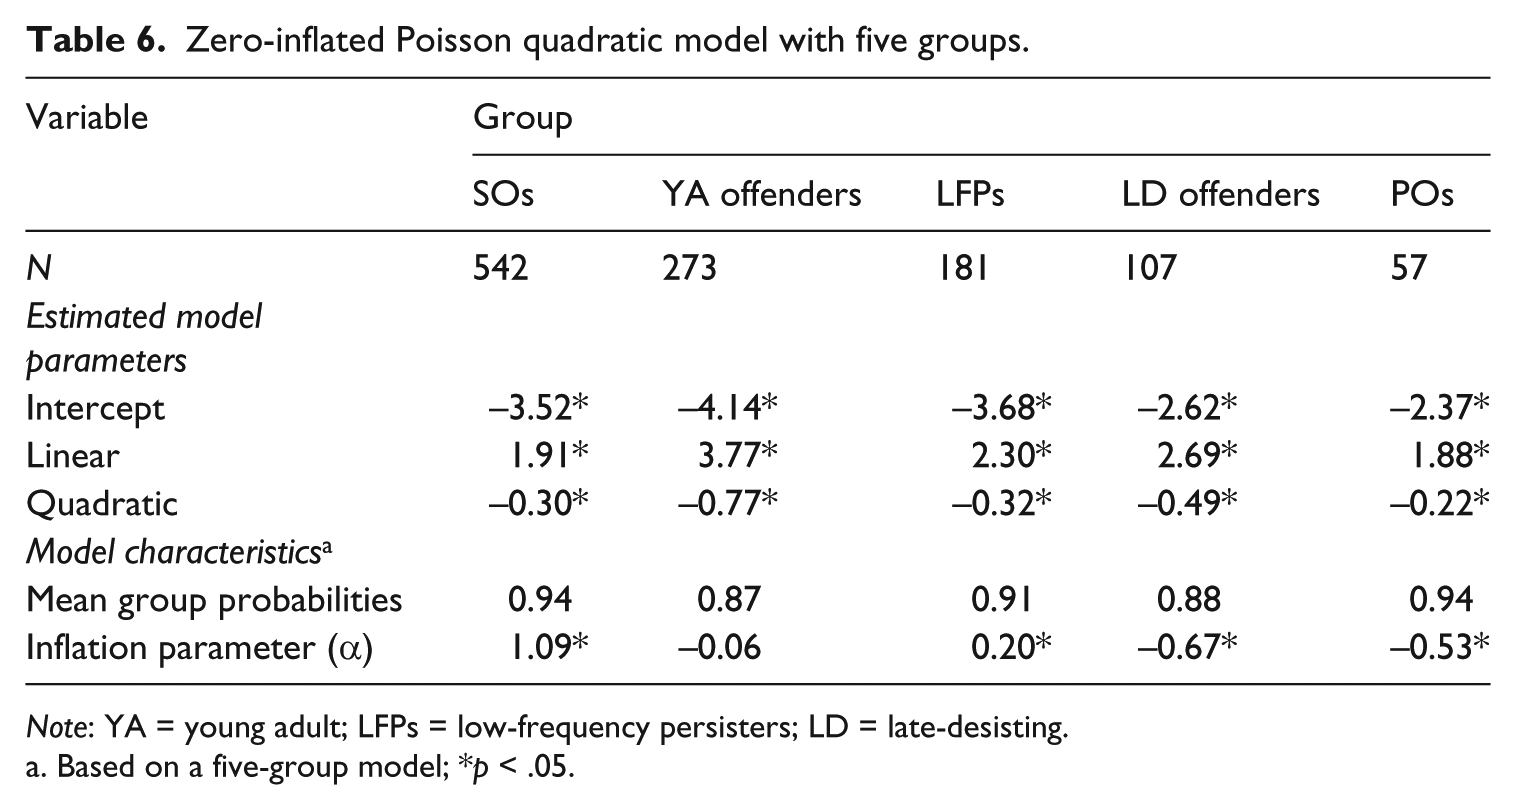
Note: YA = young adult; LFPs = low-frequency persisters; LD = late-desisting.
Based on a five-group model; *p < .05.
Figure 3 graphically depicts the five trajectories. SOs make up more than two-fifths of the sample (46.7 percent). The two low-frequency offending groups – YA offenders and LFPs – although similar in the level of offending differ in terms of peak age, and jointly also constitute two-fifths (39.1 percent) of the sample. One in 10 fraud offenders follows the LD trajectory (9.2 percent), which is characterized by an early onset and high levels of offending up to the mid-twenties, followed by a gradual decline. POs, who begin their upward trajectory in line with LD offenders before veering away and showing persistence in high levels of crime, make up 5 percent of the sample (4.9 percent). Figure 3 shows how, for the vast majority of the sample, serious offending declines with age. Only POs continue to show high levels of offending well into their forties.
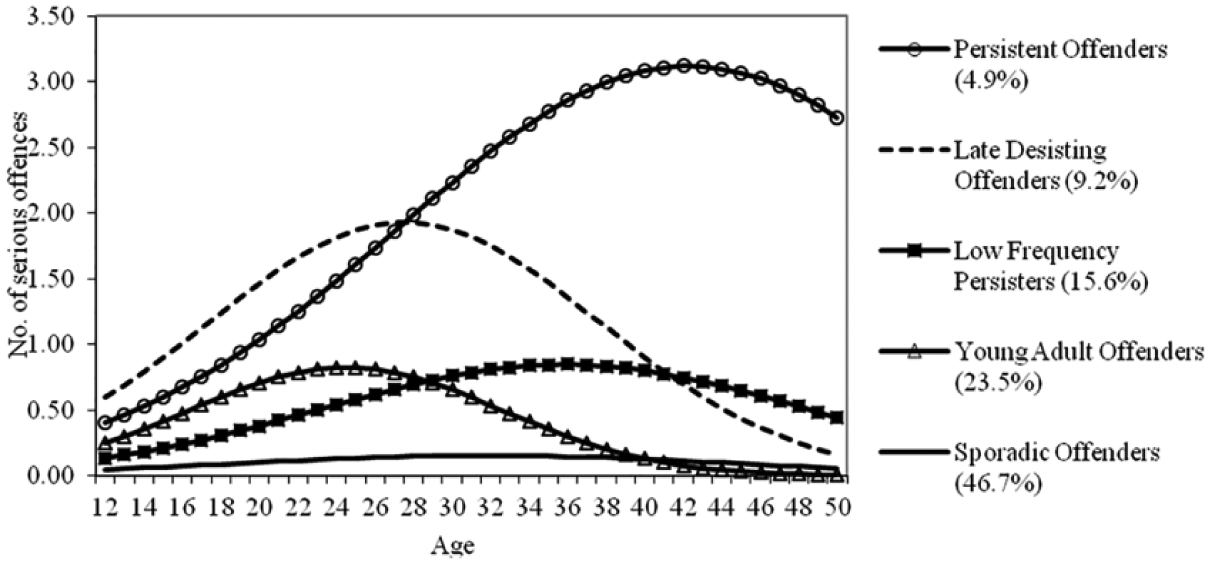
Estimated group trajectories of serious offending from age 12 to age 50.
All active offender groups – except sporadic offenders – accumulated a substantial number of convictions for serious offences across the observation period: YA offenders and LFPs are convicted for around 19 offences; the average LD offender accumulated 46 convictions; and POs were convicted 71 times on average (see Table 7). These offences include both fraud and serious non-fraud offences. However, Table 7 also shows that non-fraud offences are more common than fraud offences for all offender groups. The vast majority of the non-fraud offences are constituted by property offences (for example, theft and fencing), which are typically labelled as street crimes. Fraud offending is characterized by a higher age of onset (the average time between the first non-fraud offence and the first fraud is 8.7 years) and, correspondingly, a shorter criminal career duration (time span between the first and final offence).
Criminal career characteristics by trajectory group.
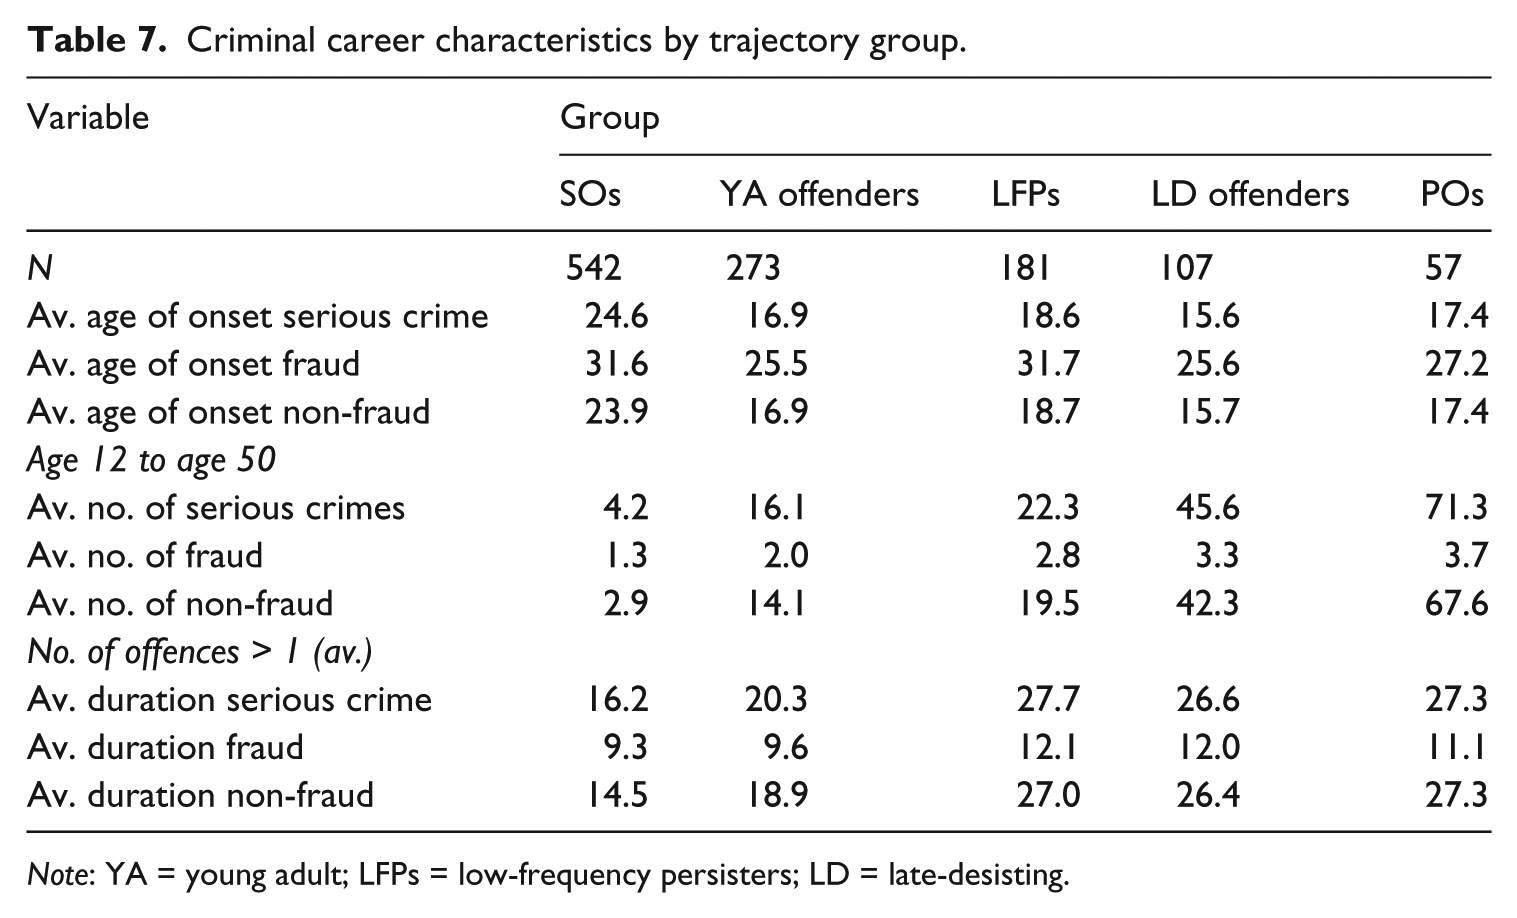
Note: YA = young adult; LFPs = low-frequency persisters; LD = late-desisting.
Finally, to explore the association between group membership classifications based on serious non-fraud offending and the development of fraud offending, Figure 4 depicts the observed number of serious non-fraud 4 and fraud offences by trajectory group. As can be seen, the model’s predicted offence trajectories in Figure 3 are a good representation of the observed offence trajectories in Figure 4 (the dotted lines; for a better comparison, Appendix B depicts the predicted and observed offence trajectories in a single figure). It is important to note that across all trajectory groups, especially in the high-frequency offender groups, the accumulated number of fraud offences through age 50 is relatively low compared with serious non-fraud offending (note the scale difference between the primary and secondary axis in Figure 4): convictions for serious non-fraud offences are 2 (SO) to 18 (PO) times more frequent (Table 7). Taking this level of difference into account, in Figure 4 we examine differences in developmental patterns between serious non-fraud and fraud offending within offender groups.
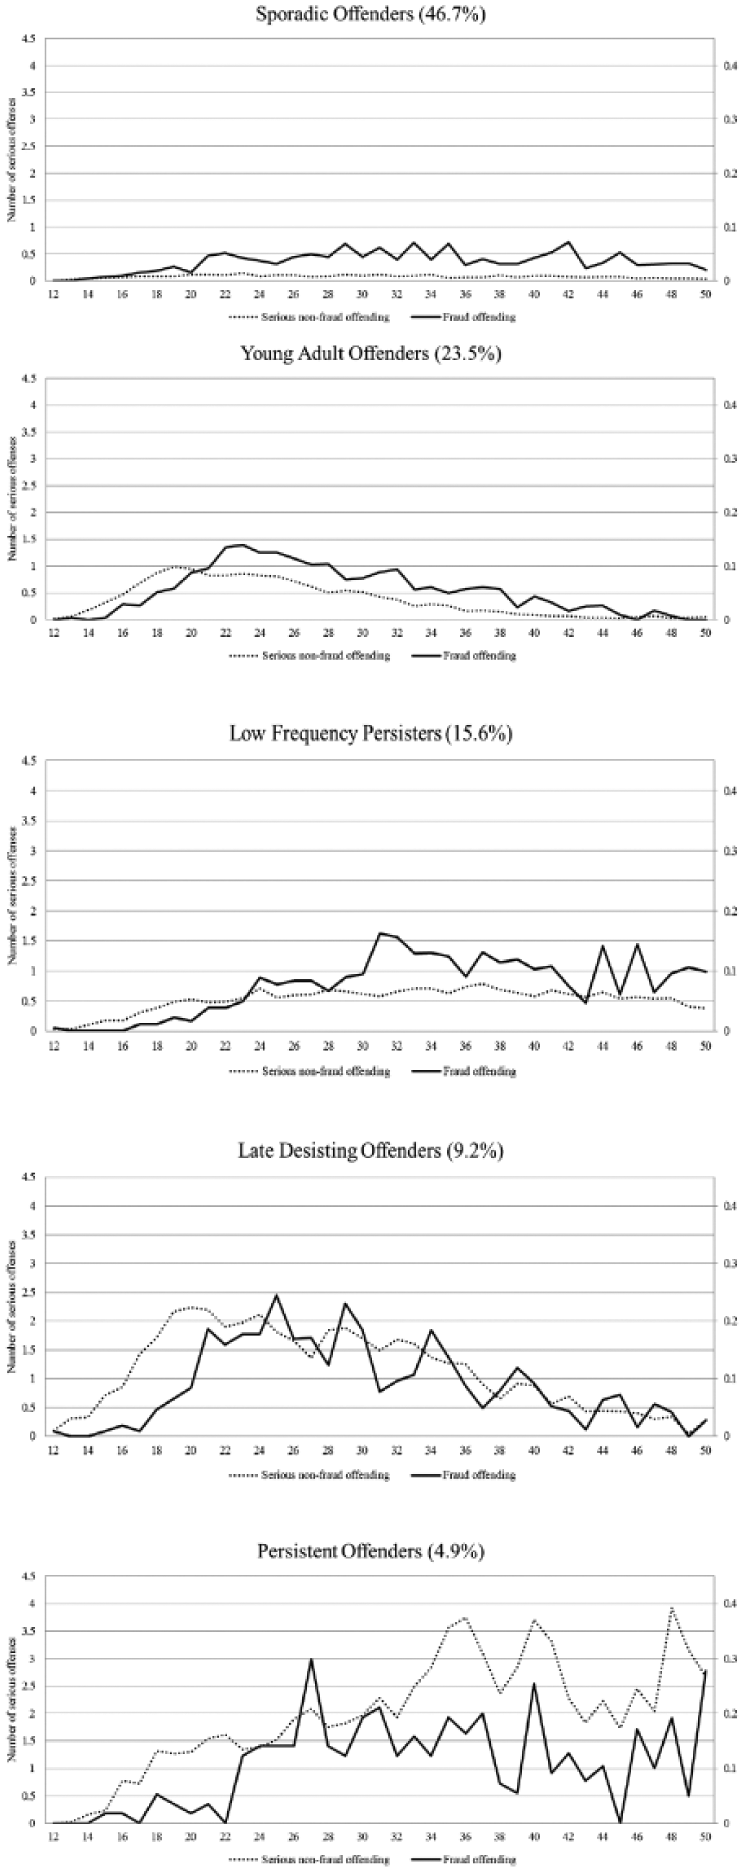
Observed patterns of serious non-fraud and fraud offences by trajectory group.
For POs and LD offenders, and to a lesser extent for LFPs and YA offenders as well, Figure 3 shows a delayed onset in fraud offending compared with serious non-fraud offending. Following this ‘late blooming’ development (which is also visible in the overall age–crime development for fraud in Figure 1), fraud offending peaks between ages 25 (for LFPs) and 31 (YA offenders) for these trajectory groups. Also, results across all serious offender groups, except SOs, show that fraud offending is part of a more general criminal repertoire. Importantly, none of the co-occurring developmental patterns in fraud offending, except the YA offending pattern, suggests a replacement of non-fraud offending by fraud offences.
Summarizing the results, despite using a large category index offence, some of the trajectory groups follow closely the typology put forward by Weisburd and Waring (2001) and the arrest trajectories identified by Piquero and Weisburd (2009). More than two-fifths of the sample fits the SO trajectory (46.7 percent), which is similar to the expected offence pattern of crisis responders and opportunity takers. They are sporadically involved in serious crime and accumulate approximately one offence in every 20 years. In most cases they are convicted of one fraud offence only (Table 7). However, unlike prior studies that identify two-thirds as following this trajectory (Piquero and Weisburd, 2009; Weisburd and Waring, 2001), in the current sample of fraud offenders the SO group comprises less than half of the sample. To some extent this may reflect sampling bias, because offenders in the current sample had to have at least one adjudication (in 1977) to be part of the sample, and this conviction did not necessarily have to pertain to fraud.
The YA offenders and LFPs in this sample appear to follow a pattern that is closer to that of opportunity seekers. Their rate of offending – on average one conviction in every one or two years – is substantially higher than that of SOs. It is important to note that it is also higher than for the medium-rate offender group in Piquero and Weisburd’s study (2009). We find evidence that YA offenders (23.5 percent), who peak in non-fraud ‘street’ crime in their mid-twenties, desist from serious non-fraud offending but not fraud offending in their thirties and forties. For LFPs (15.6 percent), as well as the other groups, this replacement pattern is less clear.
The LD offenders and POs conform to Piquero and Weisburd’s stereotypical criminals. However, their identified rate of offending is much higher than in the high-rate offender group in Piquero and Weisburd’s study (2009), and more similar to what is reported in trajectory studies on general offender samples (Laub and Sampson, 2003; Van der Geest et al., 2009). The offence patterns also suggest more heterogeneity – the LD and PO patterns diverge at around age 30 – and less stability than is commonly found. Comparing our findings to Piquero and Weisburd (2009), who suggest that stereotypical criminals constitute between 6 and 16 percent of the sample, in the current sample 14.1 percent of all fraud offenders follow such a trajectory.
Discussion
This study examined crime development in a sample of offenders convicted of fraud. Analysing their long-term development of offending, we paint a detailed picture of the fraud-offending careers in this sample. We describe onset and duration, intermittency, versatility and specialization, and, using group-based trajectory modelling, we also identify distinct trajectories of serious non-fraud offending up to age 50. A number of important findings stand out.
First, using an extensive follow-up and group-based trajectory analysis, we find substantial heterogeneity in our sample of fraud offenders, both in the course of their fraudulent offending and in their general long-term criminal development. This is consistent with earlier studies that emphasized the heterogeneous nature of offending by distinguishing between qualitatively different groups of white-collar offenders (Benson and Moore, 1992; Morris and El Sayed, 2013; Van Onna et al., 2014; Weisburd and Waring, 2001).
Second, within this heterogeneity we find indications that the typology of Weisburd and Waring (2001) has a bearing on the criminal patterns we identified. More than two-fifths of the sample follow a pattern that is consistent with that of crisis responders and opportunity takers – they commit very few offences and may do so in response to specific life-course circumstances or specific opportunities for committing fraud (or white-collar crime). Another two-fifths bear a resemblance to opportunity seekers, who display an intermittent but nevertheless persistent pattern of criminal behaviour. Especially for YA offenders, who desist from serious non-fraud offending in their late thirties while still committing (small numbers of) fraud offences, the shift in offending may reflect changes in the opportunity structure of offending. Finally, one in six offenders conform to a pattern we would expect for stereotypical criminals, showing large numbers of street crimes – for example, theft and fencing – both prior to and concurrent with fraud offending. Comparing our findings with studies using general offender samples (see Piquero, 2008) these non-sporadic offenders committed common crimes to much the same degree as non-fraud offenders.
Third, despite significant specialization in specific types of fraud (especially forgery and embezzlement and, for more chronic offenders, swindling), fraud offenders can hardly be viewed as specialist offenders. That is, for the majority of our sample it holds that those convicted of fraud also have significant criminal records for serious non-fraud. Only fraud offenders of the sporadic type show no substantive evidence of common crime offending. Fraud offenders being both versatile in terms of their overall offending but at the same time specialized in their fraud offending mirrors the paradoxical findings of Soothill, Francis, Sanderson and Ackerley (2000) regarding the criminal careers of sex offenders.
The lack of a clear distinction between fraud offenders and street-crime offenders is consistent with at least two theoretical mechanisms. The first harks back to general theories of offending that trace all offending, regardless of the type, back to a single (set of) cause(s). Self-control theory, for example, claims that white-collar crime and fraud share particular features with street crime and even non-criminal types of deviance (for example, use of drugs, poor school achievement), especially instant gratification, that make those inclined to act on acute desires without taking into account the long-term costs more prone to engage in all these different types of act (Hirschi and Gottfredson, 1987). Given the opportunity, all offenders are equally likely to engage in fraud and, regardless of their overall level of offending, some portion of the criminal career will always consist of acts labelled fraud.
Results from an empirical study by Holtfreter, Reisig, Piquero and Piquero (2010: 196) also support this mechanism, by showing that low self-control is associated with different forms of offending, including fraud. Whereas general theories, such as self-control theory, tend not to emphasize opportunity, other theories do just that. Opportunity-based theories (Felson and Clarke, 1998) would argue that the distinction between white-collar crime (including fraud) and street crime has become increasingly blurred as a result of the increased opportunity that modern-day ‘common’ criminals have to engage in fraud and other types of financial crime. In the mid-20th century, when Sutherland first coined the term ‘white-collar’ crime, most financial crimes were beyond the opportunity structure of ordinary people. Though at the time white-collar crime was likely to be more common among middle-class people than Sutherland himself described (Weisburd et al., 1990), many white-collar schemes were out of reach for the majority of people holding ‘blue-collar’ jobs. With the growth of the credit economy and the increased use of computers, crimes labelled ‘white-collar’ have increasingly come within range of the common people. As a result, barriers between white-collar and street crime may have become more porous (Benson and Moore, 1992). Over two decades ago, Weisburd, Wheeler, Waring and Bode (1991) had already noted that ‘ordinary people are committing white-collar crime in increasing numbers’, and we have no reason to believe this trend has diminished over time.
Although we feel our data reflect broad changes in the opportunity structure of fraud, we recognize that our results may also be – in part – explained by the nature of the sample we examined. Analysing a general conviction cohort in the Netherlands, our findings indicate that many offenders moved back and forth between fraud and serious non-fraud crimes. This is at odds with many prior white-collar crime studies. Yet, because of a focus on complex, high-end white-collar crimes, these studies may have been biased towards the archetypal white-collar crime offender. Taking a more inclusive offence-based approach, our findings suggest that fraud offenders respond to or create opportunities for crime in general, rather than for fraud exclusively. As most prior studies on white-collar crime and fraud have been carried out in Anglo-Saxon countries, our study provides a unique addition to the fraud literature. Though with the global advancement in technology and the use of the internet we do not expect our findings to be sensitive to (relatively small) variations in socio-cultural context and legal corollaries across modern Western societies, future research should focus on the role of national policies against both white-collar offending and low-level fraud.
Our findings reinforce prior studies that show that the common image of fraud offenders being ‘one-shot offenders’ is incomplete. Many fraud offenders engage in non-fraud, and a large proportion even do so repeatedly. The level of heterogeneity in fraud offenders’ non-fraud criminal careers mirrors that found in general offender samples (Piquero, 2008). This raises the question of to what extent fraud offenders share personal and social background characteristics with the common offender population, and to what extent these characteristics can also explain fraud. Especially for persistent offenders in our sample, who exhibit far higher serious non-fraud offending rates compared with any street-crime trajectory identified in white-collar crime research thus far, the developmental pattern seems to occur at the intersection of life-course criminological explanations and white-collar criminal opportunities.
The theoretical and practical importance of distinguishing different criminal career trajectories of fraud offenders lies in the realization that different mechanisms may be at play causing these offenders to engage in fraudulent behaviour. Those following the SO trajectory in our sample show a behavioural pattern that might be expected from individuals reacting to personal crisis or taking advantage of a unique opportunity. For this group it might be called for to be reticent in terms of interventions, because many of these individuals are one-shot offenders and appear in many respects to be conventional people (Piquero and Weisburd, 2009). For those on the YA and LFP trajectory, who resemble Weisburd and Waring’s opportunity seekers, situational crime prevention increasing the effort required to carry out the offence or the risk of detection, or lowering the benefits gained from the offence, may be successful in curbing their fraudulent careers (Simpson and Weisburd, 2009: 11–12). Finally, those on the LD and PO trajectories evidence a high propensity towards crimes in general, not only fraud. Because their offending is far from limited to fraud offending, changing opportunity structures may be relevant for the expression of their offending, but less so for explaining its prevalence.
Some limitations to the current study should be noted. First, as is common to all criminological studies based on official data, our criminal trajectory estimates are based on crimes that became known to the police, were then prosecuted and brought to court. Consequently our results are open to bias if the dark figure for fraudulent offences differs greatly from that for other types of offences. Also, to construct long-term criminal trajectories, a long-term follow-up is required. Our sample consisted of offenders brought to court in the late 1970s. For some of these offenders a substantial part of their criminal careers materialized in an era without the internet. With the introduction and subsequent blooming of the internet, access to opportunities for fraud have equally sky rocketed, reducing traditional barriers to white-collar offences even further. The consequences for the typology of white-collar crime offenders, in terms of both offender types and their distribution across the offender population, will require additional research based on more contemporary samples.
Finally, the current study did not examine time-varying risk factors that may help to explain why individual offenders engage in fraud at specific points in their criminal career. Although there is ample evidence in life-course criminological research that important transitions and events in the life-course can alter the likelihood of committing street crime (Blokland and Nieuwbeerta, 2010; Van der Geest et al., 2011), the extent to which this also applies to specific crime types, such as white-collar crime, still remains an empirical question. Research among offenders involved in organized crime indicates that important life-course transitions, such as marriage or employment, that are generally thought to deter individuals from offending can also give rise to changes in the offenders’ opportunity structure, making crime more instead of less likely (Van Koppen and De Poot, 2013). Future research on fraud offenders that includes data on both positive and negative life events can thus help to ascertain what are the ‘crises’ crisis responders typically respond to, and what circumstances constitute opportunities for opportunity takers and seekers to exploit, and as such deepen our understanding of the ways in which fraud and white-collar crime develop across the life-course.
Footnotes
Appendix A
Bayes Information Criterion values per model.
| Number of groups | Bayes Information Criterion |
|---|---|
| 1 | −37,913.91 |
| 2 | −34,987.56 |
| 3 | −34,129.81 |
| 4 | −33,742.52 |
| 5 | −33,526.99 |
| 6 | −33,382.22 |
Appendix B
Funding
The author(s) received no financial support for the research, authorship, and/or publication of this article.