



Abstract
Light emitting diode (LED) road lighting and the impact of correlated colour temperature (CCT) variations in comparison to traditional high pressure sodium (HPS) road lighting on driving-related human factors was the focus of this research. This work is highly relevant for road authorities, transitioning from traditional high intensity discharge to LED road lighting, as they make choices including which CCT types to select. This night-time field-based study measured visual performance and pedestrian recognition under three road lighting conditions: LED (3000 K, 4000 K) and HPS (2000 K), for 20 young visually normal participants (M = 25 ± 3 years). Visual acuity (VA) and contrast sensitivity (CS) were assessed using customized charts, and time to first recognize pedestrians wearing non-reflective clothing walking towards the road was recorded at two distances for participants positioned in a stationary vehicle. There were no significant differences in VA or CS between road lighting conditions; however, pedestrians were recognized significantly sooner under HPS than either of the LED road lighting conditions (3.6 s sooner under HPS compared to 4000 K LED), likely due to the greater lateral spatial light distribution from the HPS used in this experimental study. Road lighting design using LED luminaires needs to consider the impact of their potentially sharper luminous cut-offs and provide designs with appropriate characteristics and dimensions.
1. Introduction
Road lighting has an important safety function at night and has the potential to reduce night-time fatalities,1,2 particularly those involving pedestrians. 3 Traditional road lighting uses high intensity discharge (HID) light sources, such as high pressure sodium (HPS) lamps, but these are being superseded by new road lighting designs involving LED-based technology. LED road lighting is being introduced worldwide to take advantage of the high efficacy, longer lifetime and cost-effectiveness of LED light sources through adaptive light controls. LED road lighting also provides the opportunity for further lighting infrastructure savings through dimming. However, while there is a body of data regarding the energy savings associated with LED luminaires,4–8 there has been only limited research on the driving-related human factors issues associated with these road lighting designs and how they might potentially impact on road user performance and road safety. 5
Two meta-analyses of crash data and associated road lighting levels in the United States 9 and the United Kingdom 10 have demonstrated the already known benefits of road lighting for reducing night-time crash risk, and also that reducing the level of traditional road lighting illumination levels may not adversely impact on road safety. These studies suggest the potential for dimming and adaptive strategies, where lighting levels are adjusted based on the needs of roadway users, which are well suited to LED luminaires. In addition, LED road lights have different spectral power distributions of light output across the visible spectrum, resulting in differences in colour appearance represented as correlated colour temperature (CCT), and colour rendering ability, usually represented by the colour rendering index, compared to HPS road lights. However, there is only limited evidence regarding how LED road lighting configurations, and potential design changes, including dimming and adaptive capacity, as well as CCT variations, impact on visual performance or road safety. 11 This information is important for guiding road safety authorities regarding their choices, particularly regarding the most appropriate CCT for LED road lighting, in terms of impacts on driver visibility and road safety on night-time roads.
Several studies have explored the effect of CCT on aspects of visual and task performance for interior lighting scenarios, such as those found in offices and classrooms. However, existing studies that relate to the impacts of CCT on driving task performance tend to focus on tunnel lighting scenarios that have relatively high and transitioning lighting levels compared to typical roadways.12–15 One of the key performance measures in this field are driver reaction times, with laboratory studies suggesting that CCT has an impact on driver reaction times,16–19 with higher CCTs generally associated with shorter (faster) reaction times. Few studies have explored the effect of CCT on vision and driving performance for road lighting. One closed-road study demonstrated no effect of CCT (LED (6000 K) and a matched HPS (2100 K)) on pedestrian detection distances at higher road light levels (5 lx), but shorter pedestrian detection distances for LED compared to HPS under lower road light levels (1.25 lx). 20 Another study conducted under on-road conditions with two LED road light installations (3000 K and 4000 K), reported drivers’ preference for 3000 K lighting in terms of colour, and 4000 K lighting in terms of their perceived ability to detect small light-coloured obstacles; however, there were no differences in pedestrian detection or overall visibility. 21
In view of the limited and mixed findings of these previous studies, there is a need to better understand whether the CCT of LED road lights influences visual performance in field-based studies under typical road lighting conditions. This is highly relevant for road authorities wishing to transition from HPS to LED road lighting using existing infrastructure, and making choices regarding which CCT types to select, based on maintaining safety. These decisions need to be based on evidence regarding the performance of LED road lights of CCT types that are regularly applied on roads (3000 K and 4000 K), compared to the historical baseline of acceptable driver safety, which is typically HID (such as mercury vapour, HPS and metal halide). Another factor that should also be considered when transitioning from HPS to LED lighting is that LED lighting can have a more controlled spatial light distribution than HPS. This control of light distribution would reduce the quantity of light adjacent to the road (spill light) which not only has potential advantages for reducing unwanted light on neighbouring properties but also has ramifications for lighting of pedestrian areas that traditionally took advantage of spill light to illuminate pedestrians walking on the side of the roadway and pavements.
This field-based study was designed to investigate the impact on visual performance induced by the changeover from traditional HPS to LED road lighting scenarios, where the existing luminaire poles are typically retained (so that pole spacing and mounting height remain the same, luminaires change, road category requirement is not changed and the same general lighting requirements are met by each scenario). This study was undertaken by replicating realistic retrofit scenarios that highlight the typical changes to spectrum, uniformity and spatial distribution of light that occur. The impact that these factors have on visual acuity (VA), contrast sensitivity (CS) and pedestrian recognition was evaluated, first comparing the dissimilar conditions of HPS (2000 K) and LEDs, and then the similar conditions of 3000 K and 4000 K LEDs to assess any differences in visual performance arising from the spectral difference between these two CCTs using LED luminaires that were in use in the region at the time of the experimental study. This work is critical for road authorities in developing policy surrounding LED road lighting and requires evidence of the relative safety of LED road lighting and dimmed LED road lighting compared to accepted baseline technologies.
2. Method
2.1 Participants
Participants included young 20 adults with normal vision (25 ± 3 years, range = 20 years to 31 years; 11 females, 9 males) recruited from Queensland University of Technology (QUT) staff and students and their associates. All participants were licensed to drive in Queensland and had best-corrected distance visual acuity of 0.10 logMAR (Snellen 6/7.5) or better in both eyes and passed the Ishihara pseudoisochromatic plate test (24-plate edition), where the criteria for failing the test was three or more errors on the first 17 plates. Participants were excluded if they had any known ocular disease. The study adhered to the tenets of the Declaration of Helsinki and was approved by the QUT Human Research Ethics Committee. All participants were provided with an explanation of the nature of the study and procedures, and written informed consent was obtained.
2.2 Laboratory-based testing
Monocular and binocular visual acuity were measured in a clinical setting prior to the field-based studies, using a high contrast Early Treatment Diabetic Retinopathy Study letter chart at 4 m and scored on a letter-by-letter basis (−0.02 log units per letter correct). Binocular letter contrast sensitivity was measured with the Pelli–Robson letter chart at 1 m, with a +1.00 Dioptre working distance correction in place, and scored on a letter-by-letter basis (0.05 log units per letter correct). All testing was conducted using the habitual refractive correction worn for driving.
Participants also completed a custom driving questionnaire, which included questions about driving experience and typical driving exposure (days per week, nights per week, types of roads driven), as well as questions about their vision and driving at night.
2.3 Field-based testing
2.3.1 Experimental set-up
The study was conducted at a closed-road circuit facility which has been used in previous night-time driving studies.22–26 A large flat, bitumen road region of the circuit was used (140 m × 45 m) which has no existing lighting. Six road lights were mounted on four custom-designed trailers on one side of the road which were spaced 25 m apart, with the luminaires at a height of 10 m from ground level. The trailers had two mounting heads, allowing for two different luminaires to be mounted and powered by portable petrol generators. Two of the trailers were installed with one HPS luminaire (Sylvania 250W HPS Lamps 2000 K) and two trailers with one 3000 K and one 4000 K LED luminaire on each (Philips 170W 3000 K LED luminaire and Philips 170W 4000 K LED luminaire). A graphical comparison of the normalized spectral power distributions of each of these luminaires is shown in Figure 1.

Spectral power distributions of a typical 250W HPS lamp (2000 K), and the LED (3000 K) and LED (4000 K) luminaires used in this experimental study
Only one lighting condition (either 2000 K HPS, 3000 K LED or 4000 K LED) was tested at a time, with two of the four trailers illuminated, spaced at 50 m apart (Figure 2). The 2000 K HPS road lights were powered at 100%, while the power input to the 3000 K and 4000 K LED luminaires was reduced by 30% and 20% respectively of their maximum power using lighting software, so that all three luminaires produced comparable horizontal illuminance levels at the road surface at a point midway between poles and in the middle of the representative carriageway.
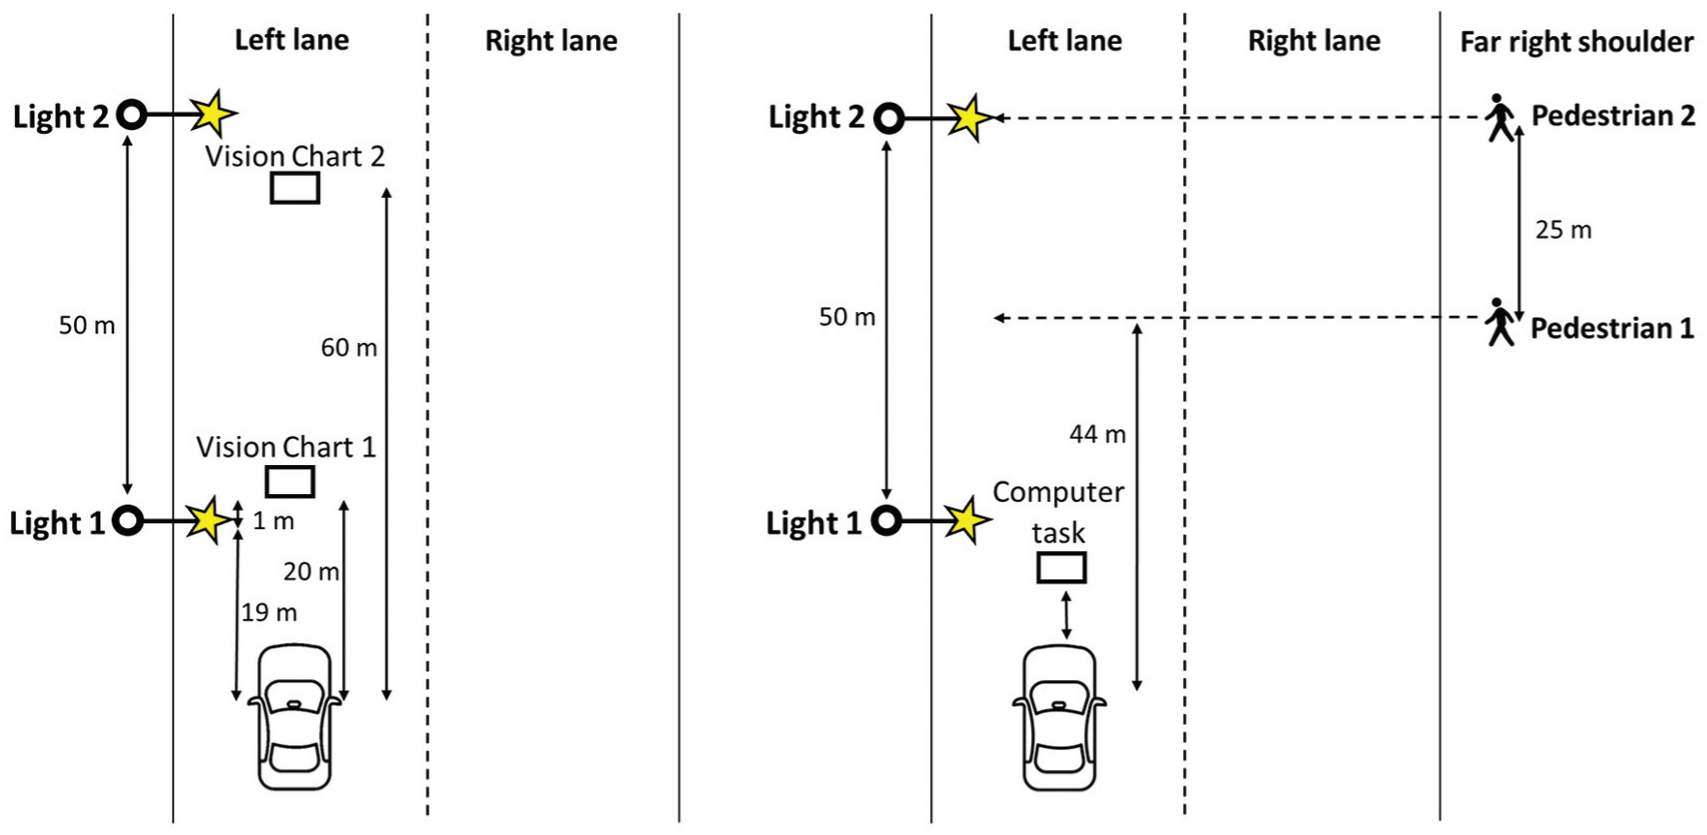
Schematic of road light layout for assessment of visual function (visual acuity and contrast sensitivity) (left) and for the pedestrian recognition task (right); note schematic diagrams are not to scale
All testing was performed after nautical twilight on days when there had been no precipitation, and the road surface was dry. Participants were seated in the front driver seat of a stationary research vehicle (2016 Toyota Camry), with the headlamps on low beam. As shown in Figure 2, the research vehicle was positioned 19 m from the closest road light pole and 69 m from the furthest illuminated road light pole in each condition and 5 m lateral to the right of the road light poles to account for the presence of the pavement that would normally be located at the roadside to represent a typical road situation. The position of the research vehicle, vision charts and pedestrians was the same in the two LED road light conditions, as the 3000 K and 4000 K LED luminaires were dual-mounted on the same trailers, while for the 2000 K HPS road light condition the research vehicle was moved forward 25 m, so that the distance from the participant seated in the stationary research vehicle was the same as for the LED road lights, with alternate positions for the vision chart and pedestrians.
For each type of road lighting, the design horizontal illuminance levels were calculated and are presented at ground level over a 5 m × 5 m measurement grid on the road surface, with both luminaires on. These illuminances were used to generate illuminance maps for the 2000 K HPS, 3000 K and 4000 K LED luminaires. Average road luminance and luminance uniformity for all three conditions were also measured from the driver’s position using the TechnoTeam LMK Colour Photometer and built-in road surface analysis software.
2.3.2 Design of lighting conditions
There are several ways in which lighting could be compared for consistency across the different lighting conditions. Potential metrics include road luminance (either at a point or averaged over a region) and illuminances (horizontal at the road surface or vertical at specified planes). Since the HPS and LED light sources applied in this study differ by CCT and their luminaires have significantly different spatial distributions, it is not feasible to exactly match all luminance conditions for each lighting scenario, while maintaining similar illuminances on planes near the visual task areas.
On a practical note, a primary feature of the LED retrofits under investigation was their use of existing luminaire pole spacing. Accordingly, each lighting condition was designed to accommodate a pole spacing of 50 m, the distance at which the (baseline) HPS luminaires met the requirements of Category V3 road lighting in AS/NZS 1158.1 Lighting for roads and public spaces 27 (i.e. maintained average carriageway luminance ≥0.75 cd m−2, overall uniformity ≥0.33, and for intersections – a point horizontal illuminance ≥7.5 lx).
Given that a pedestrian recognition task was involved in this study, the test area was treated like an intersection in terms of its design requirements. For Category V3 roadways in AS/NZS 1158.1, this requires that at a point midway between two adjacent poles and in the middle of the carriageway, a horizontal illuminance of at least 7.5 lx is achieved at the road surface. Lighting design software (Perfect Lite™ (https://www.perfectlite.com/)) was used to calculate the dimming levels of the 3000 K and 4000 K LED luminaires used in this study that gave the best match between LED and HPS lighting conditions with respect to this point horizontal illuminance requirement.
This design process was undertaken in collaboration with a designer from the local road transport authority so that the LED lighting conditions were matched, as closely as possible, to the HPS baseline in a way that was consistent with real practice (and the relevant standard requirements) in cases where HPS is upgraded to LEDs at a Category V3 roadway intersection.
2.3.3 Visual acuity measurements
Visual acuity was measured for participants seated in the stationary research vehicle for each road lighting condition using custom-developed Tumbling E charts at 20 m and 60 m. The 20 m testing distance was 1 m further from the participant than the first road light and thus represented a location of relatively high horizontal illumination at ground level provided by the road light closest to the participant. The 60 m testing distance represented a location where there were relatively low levels of light, with the only illumination reaching the chart being from the road light closest to the vehicle (Figure 2: Left), with no illumination from the furthest road light as it was located behind the chart. These testing distances were also selected to allow appropriate scaling of the Tumbling E symbols.
The Tumbling E charts were printed on large board mounted posters and scaled to logMAR (log of the minimum angle of resolution) values of −0.30 to 1.20 logMAR in 0.10 logMAR steps for the 20 m testing distance and −0.30 to 0.70 logMAR for the 60 m testing distance, where more negative values represent better visual acuity levels. For each of the testing distances, there were five to six letters presented for each visual acuity level, where the letter ‘E’ could appear in one of four orientations, up, down, left or right (Figure 3). Charts were mounted using easels at set heights and angles to ensure a consistent viewing position between road light conditions. All visual acuity charts were positioned 5 m laterally from the base of the road lights and along the line of sight of the participant seated in the driver’s seat of the research vehicle.

Example of the high contrast tumbling E chart, with five targets presented at four different orientations
Participants were instructed to identify the orientation of the letter ‘E’, reading from left to right, with the termination rule defined as three identification errors for a given target size (logMAR value). Thresholds were scored letter by letter (−0.02 logMAR per letter correct), where more negative values represented better visual acuity.
The chart luminance was measured using the TechnoTeam LMK Colour Photometer, calculating an average value of luminance for the white area of the charts.
2.3.4 Contrast sensitivity
Contrast sensitivity was also measured for participants seated in the stationary research vehicle under each of the three road light conditions using an edge-detection contrast sensitivity test, the Melbourne Edge Test (MET), positioned at 20 m and 60 m from the participant (Figure 2: Left). Charts were scaled to subtend the same visual angle (0.33°, equivalent to 0.6 logMAR) at the participant’s eye at both distances to ensure that the MET targets were easily visible. MET charts were printed on board mounted posters, measuring 396 mm × 168 mm and 841 mm × 396 mm, for the 20 m and 60 m testing distances, respectively and contained MET targets with edges orientated either vertically, horizontally or along the diagonal sloping up to the left or the right as is the case for the standard MET charts used at 40 cm (Figure 4). For both distances, there were 10 contrast levels ranging from 8 dB (highest contrast) to 21 dB (lowest contrast), each with four targets per contrast level. The MET charts were mounted using easels at set heights and angles to ensure a consistent viewing position between the road light conditions, as for the Tumbling E charts.
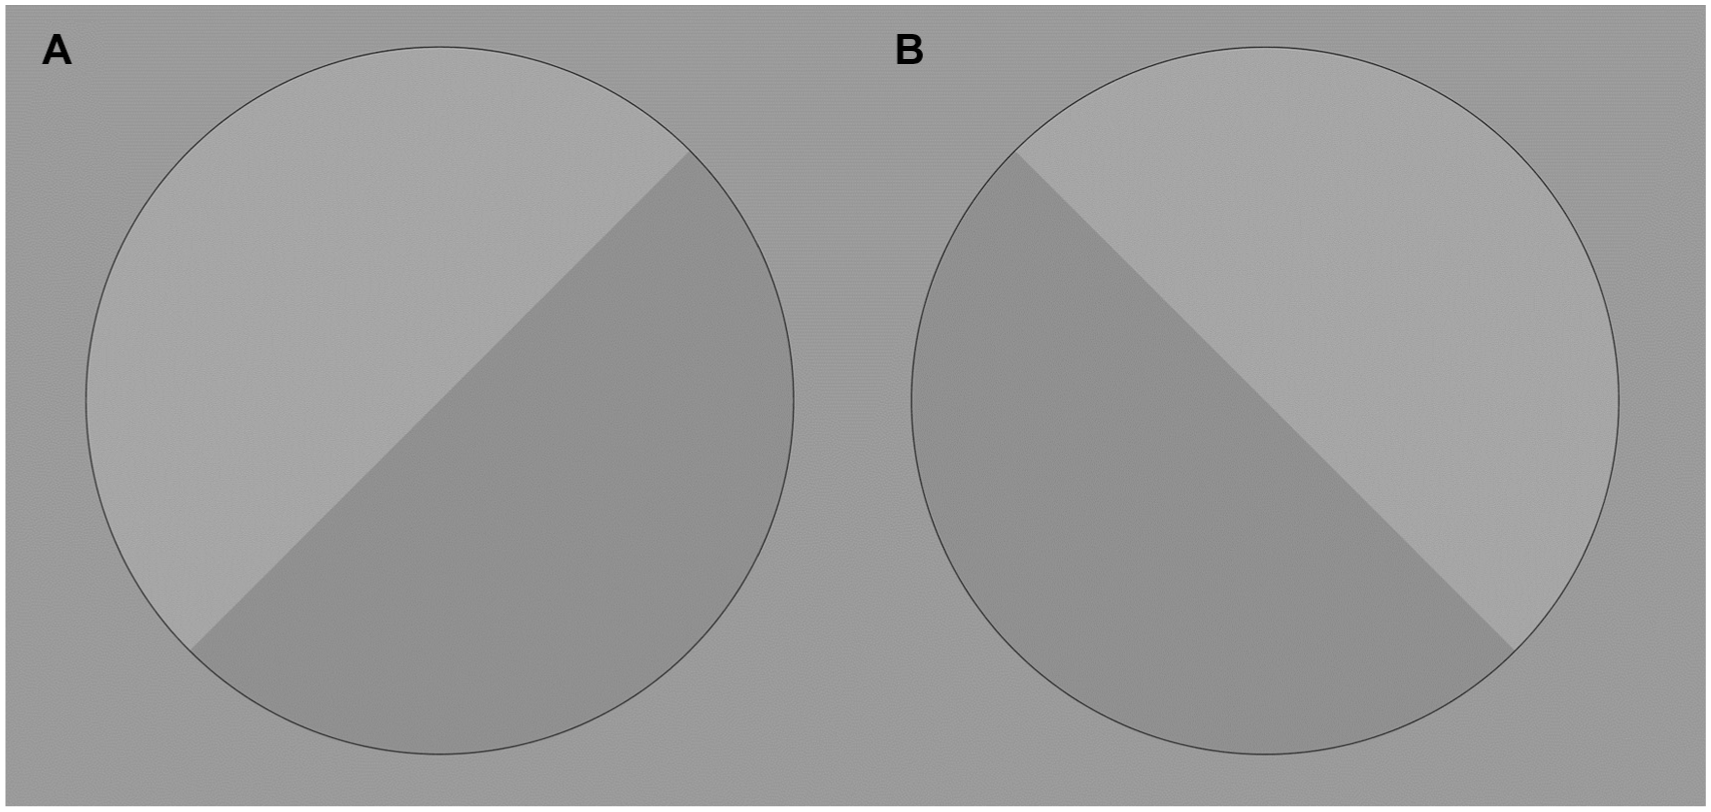
Example of the edge-detection contrast sensitivity targets adapted from the Melbourne Edge Test (MET) with edges orientated up and to the right (A) and up and to the left (B)
Participants were instructed to identify the orientation of the line that divided the shaded semi-circles, whether vertical, horizontal or up and to the left, or up and to the right. The termination rule was three errors for identifying the correct orientation of the line for a given contrast value. Contrast sensitivity was calculated using a probit model, with a 62.5% correct level to account for guessing for this four alternate forced-choice task, with higher values representing better performance.
The chart luminance was measured using the TechnoTeam LMK Colour Photometer, calculating an average value for the charts.
2.3.5 Pedestrian recognition task
The ability to recognize a pedestrian walking from outside of the area illuminated by the road lights towards that illuminated by the road lights was measured. The pedestrians were at two different distances from the participant, with only one of the pedestrians walking at any one time. One pedestrian (Pedestrian 1) walked into the intersecting zone of illumination between the two road lights (44 m from the research vehicle), while a second pedestrian (Pedestrian 2) walked directly in line with the region of peak illumination of the furthest road light (69 m from the research vehicle; Figure 2: Right). Each pedestrian wore dark street clothing and dark shoes (Figure 5) and walked from the right side of the road to the left at a tempo of 100 bpm, with a step length of 0.85 m, representing an approximate walking speed of around 5 km h−1.
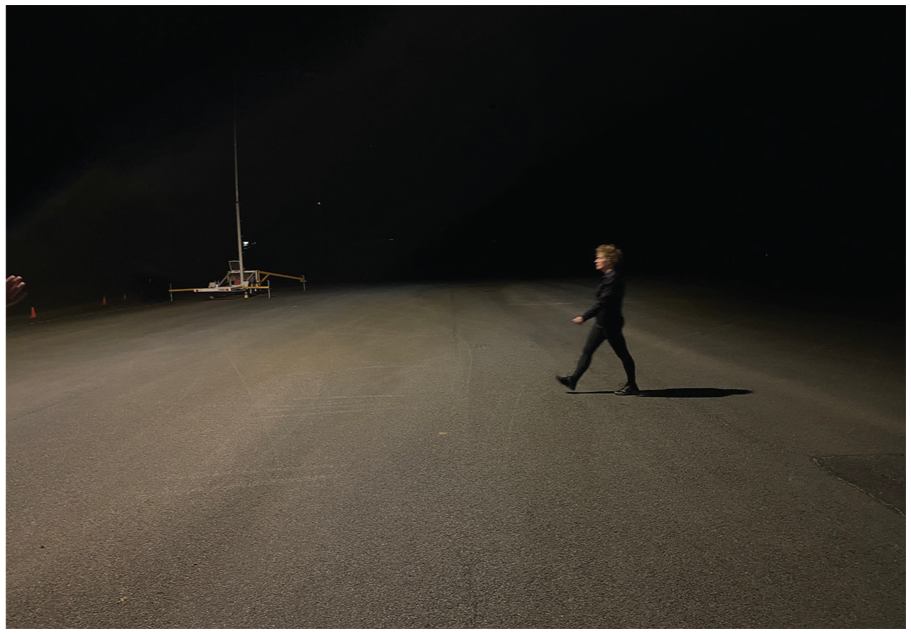
Example of pedestrian walking from right to left on the roadway
As shown in Figure 5, in each lighting scenario the pedestrians’ legs and torso were in negative contrast (i.e. in silhouette against the lighter background road surface). Conversely, the pedestrians’ heads were in positive contrast compared with the distant dark background. The luminance of each pedestrian’s full body in position against the immediate background was measured using the LMK Colour Photometer for all lighting scenarios, at 15 m lateral to the participant’s line of sight, which was the distance at which pedestrians were first detected as determined from pilot studies.
To simulate the cognitive and attentional demands of driving and to avoid participants scanning across the roadway to search for the pedestrians, participants also completed a central task to maintain a constant forward fixation location, using a rapid serial visualization presentation (RSVP) task. This involved brief presentations (300 ms) of a random series of alternating large white letters and numbers (17.5 cm high, subtending 2° at the eye) against a black background on a computer screen 5 m from the research vehicle. Participants were instructed to report only when numbers were displayed in the RSVP task, as well as call out ‘Pedestrian’ when they were confident that they could first recognize the presence of a person in their peripheral vision.
Following a practise run for the pedestrians at the two locations, each pedestrian walked four times from right to left, with a random starting time as would be the case when pedestrians cross the road in a real-world driving situation. The first response for each pedestrian for each condition was removed to allow for learning effects and the average of the last three responses for each position and road light condition calculated; a shorter recognition time indicated that the pedestrian was recognized sooner by the participant. The approximate distances at which pedestrians were first recognized lateral to the participants’ line of sight were estimated, based on the recognition time and pedestrian walking speed (5 km h−1). Each pedestrian commenced walking at a lateral distance of 35 m from the participant’s line of sight; thus, recognition distance was calculated as 35 m minus the approximate distance travelled by the pedestrian before they were first recognized.
2.3.6 Pupil size
Pupil size was measured at the start of the visual acuity and contrast sensitivity tasks to determine whether there were any differences in pupil diameter between road lighting conditions. This was conducted using the Pupil Labs eye tracker with an in-built infrared pupil detection algorithm (Pupil Labs, 200 Hz sampling rate), where five screenshots of the eye, over a one-minute period, were captured when the participant was focussing on the 20 m visual tasks, as confirmed by the front-facing real-world footage. Once the pupil screenshots were recorded, the eye tracker was removed and visual acuity and contrast sensitivity measured without the eye tracker in place. The pixel width of the pupil and horizontal visual iris diameter (HVID) were measured from the screenshots, and pupil diameter in millimetre was estimated by multiplying the ratio of pupil diameter to HVID (in pixels) by the population HVID average of 12.0 mm.
2.4 Analysis
Statistical analysis was performed using SPSS statistical software v25.0 (www.ibm.com/products/spss-statistics) with level of significance set at p < 0.05. Participant demographic and vision characteristics were presented using descriptive statistics. Repeated measures regression analysis using linear mixed models assessed differences in visual acuity, contrast sensitivity and pedestrian recognition times as a function of the three road lighting conditions. All models included random intercepts for participants, to take into consideration the repeated measures design, and used maximum likelihood estimation. Significant interactions were tested using simple effects models and pairwise comparisons made using the least significant difference method.
3. Results
3.1 Laboratory-based testing
The mean binocular visual acuity of the participants was −0.15 ± 0.10 logMAR (approximately 6/4.8+2 Snellen equivalent), and mean binocular contrast sensitivity was 1.93 ± 0.03 logCS, which both represent normal values for age. Most participants (85%) rated their vision as either good or excellent for driving at night, with 90% of participants reporting little discomfort when driving at night (none or a little of the time), and most participants (85%) did not avoid night driving due to their vision. On average, participants reported 8.0 years of driving experience, and in a typical week drove regularly at night and in the day, with a mean of 4.8 driving days and 3.1 driving nights.
3.2 Field-based testing
3.2.1 Light levels in the field-based study
Table 1 shows the spatial distribution of the design illuminance at ground level for each lighting condition over a 5 m × 5 m grid, consistent with the design method outlined in Section 2.3.2 so that each condition satisfied the standard requirements. The average roadway illuminances were comparable for each condition, with designed illuminances averaged over the driving lane grid points of 17.6 lx, 16.2 lx and 17.6 lx for the HPS (2000 K), LED (3000 K) and LED (4000 K), respectively. This table illustrates the differences in spatial distributions of the HPS and LED luminaires. It was noted that there were higher illuminances at the outer-most edge of the far-right shoulder area for the HPS condition due to the broader lateral spread of beam intensity from the 2000 K HPS luminaires in comparison to the ‘sharper’ lateral cut-off in this direction for the 3000 K and 4000 K LED luminaires.
Design illuminance distribution (lx) at the level of the road surface for each light condition with both luminaires turned on
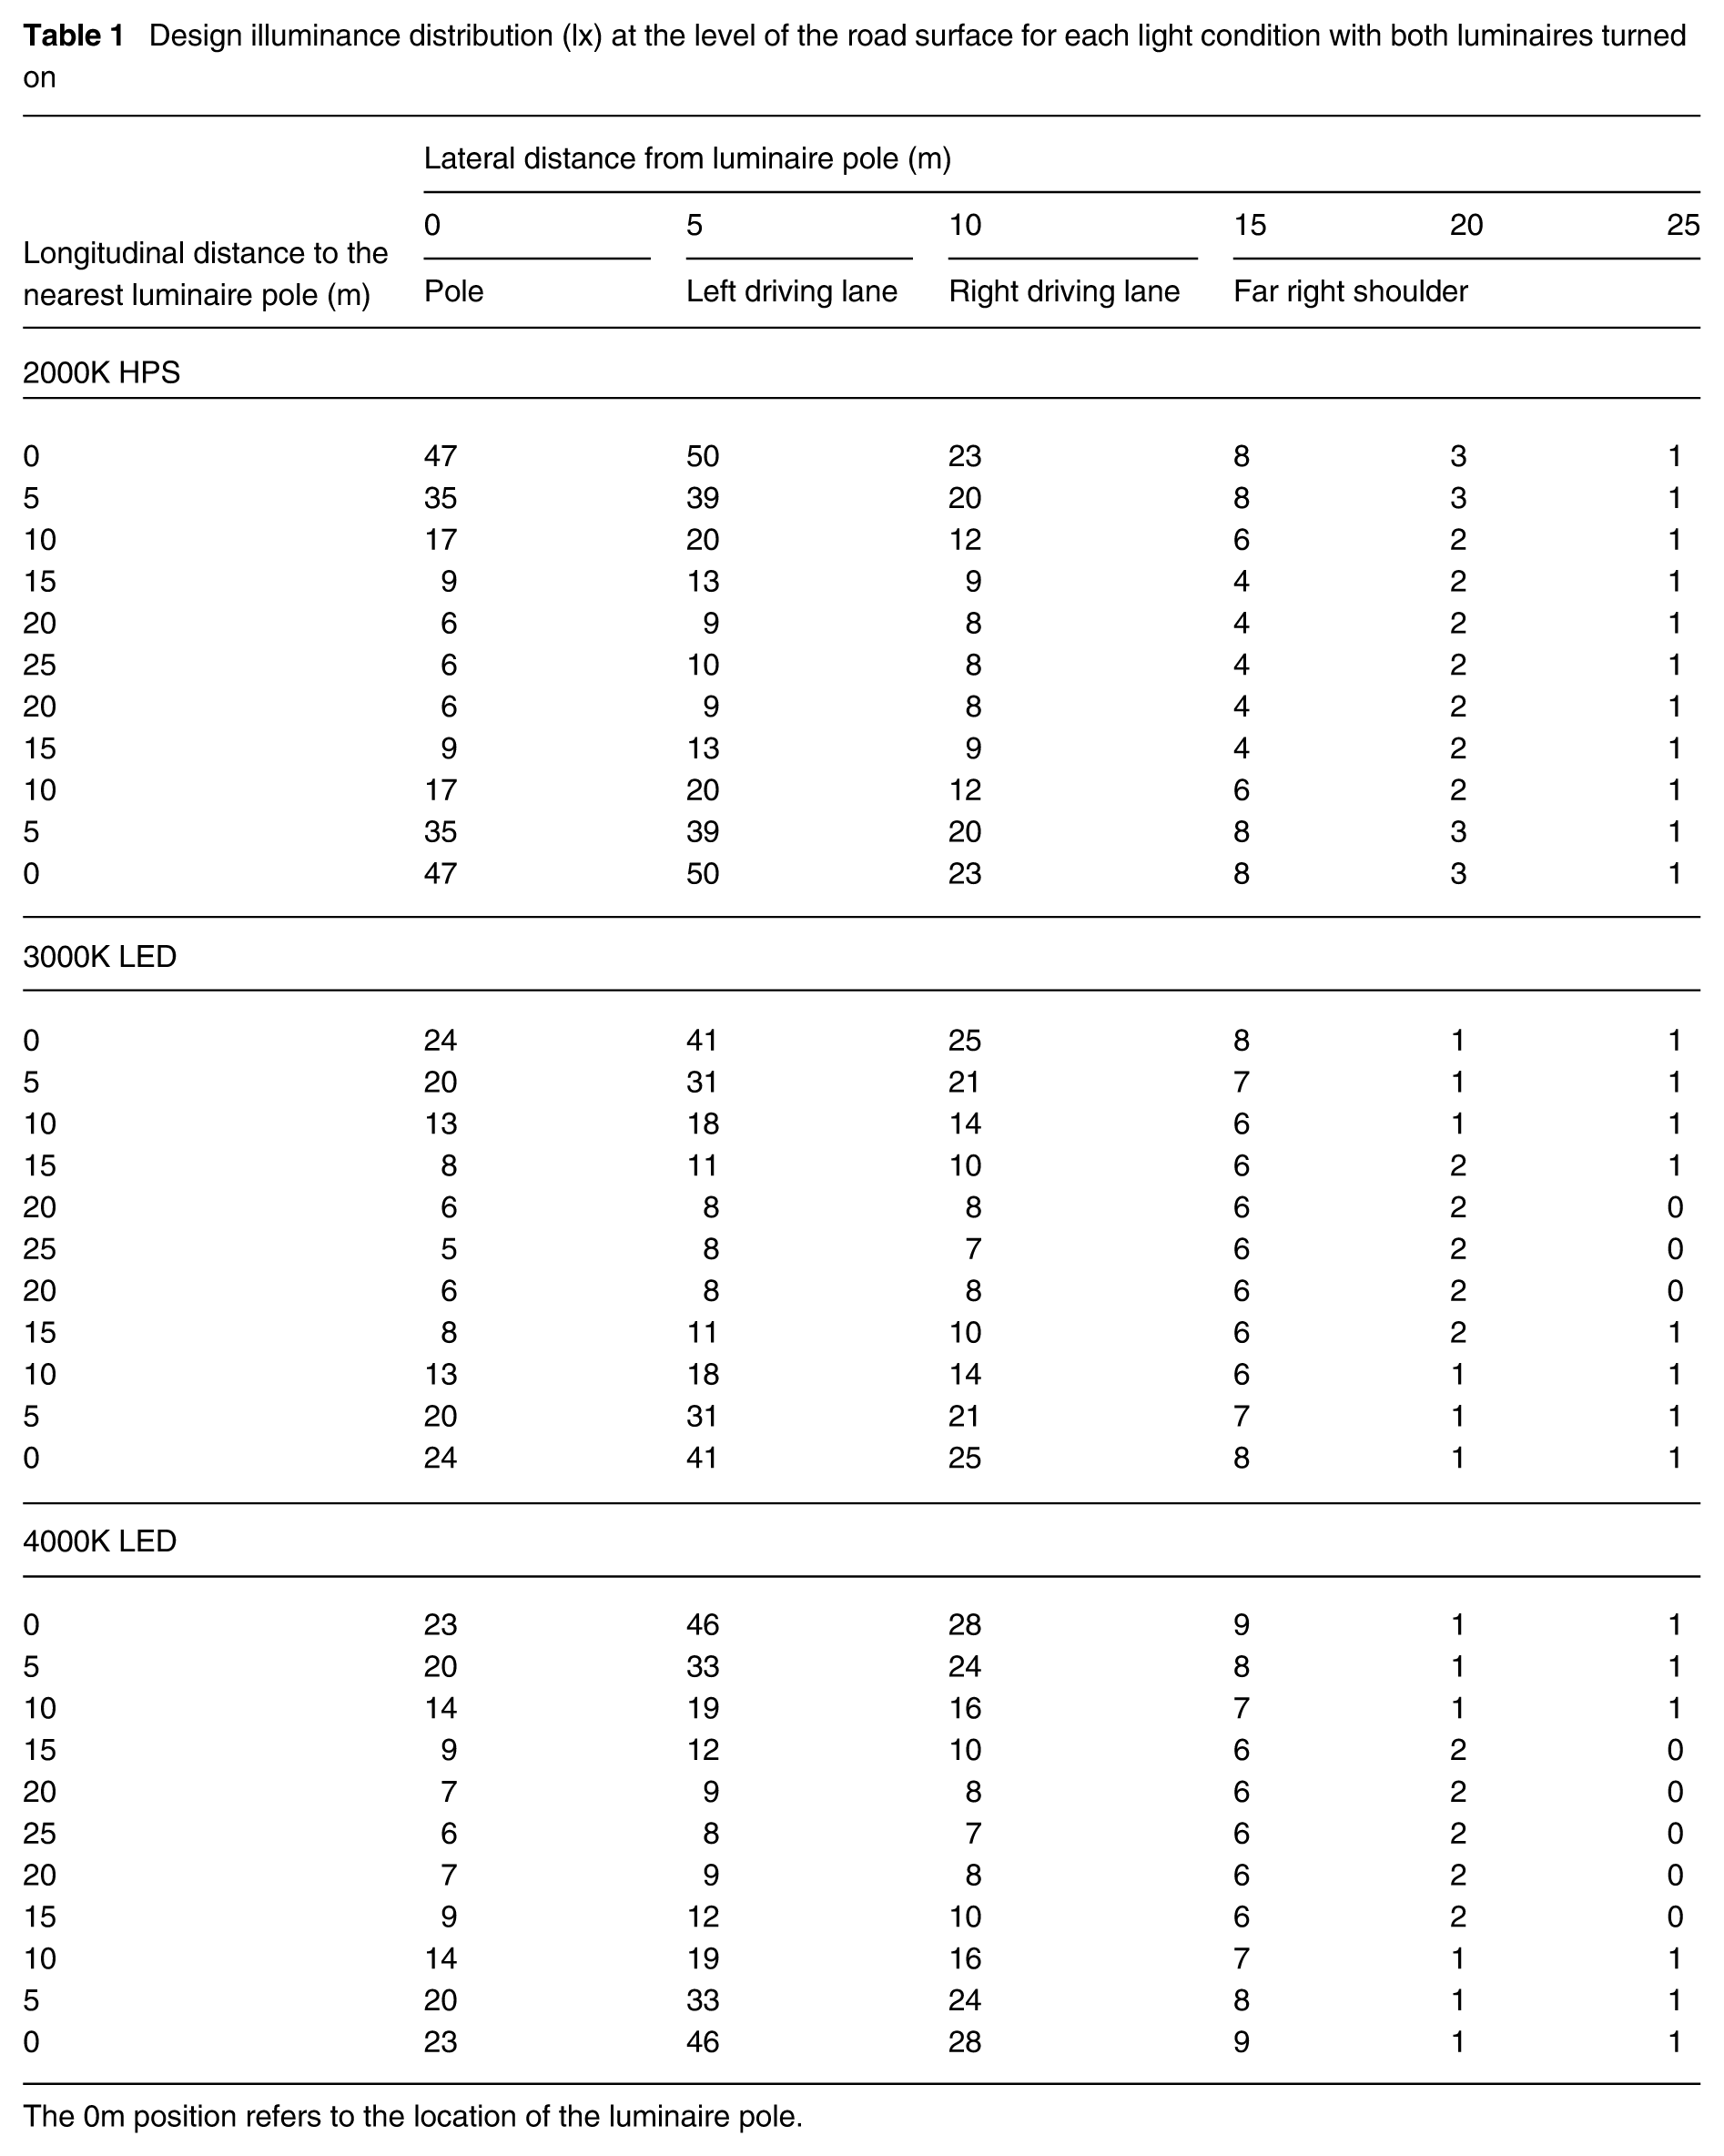
The 0m position refers to the location of the luminaire pole.
Although lighting conditions were designed to match required point illuminance mid-carriageway, due to the differing spatial intensity distributions of each luminaire type, the road surface illuminance at the far side of the roadway was not equally matched in each condition. The average vertical illuminance at eye level in the driving seat of the stationary research vehicle when the road lights were turned on was 0.7 lx for the 3000 K and 4000 K LED road lights and 0.5 lx for the 2000 K HPS road light (Table 2). The luminance contrast of the pedestrian entering the lit region of each road lighting scenario (lateral to the participant’s line of sight) was measured using the TechnoTeam LMK Colour Photometer and calculated by Weber’s contrast,
Photometric data (luminance and illuminance) across the three road lighting conditions

Uniformity index is the ratio of the minimum calculated luminance to the mean carriageway luminance, where a number closer to 1 indicates more uniform road surface luminance
In terms of mean luminance of the roadway, the 2000 K HPS lighting condition (0.95 cd m−2) was lower than that of either of the two LED road lights (1.36 cd m−2 and 1.32 cd m−2 for the 3000 K and 4000 K LED road lights, respectively; Table 2). However, all installations complied with their designed standard requirements for luminance.
With respect to luminance contrast, in all scenarios the torso appeared in negative contrast (i.e. in silhouette), while the head appeared in positive contrast as they approached the road area. In every lighting condition, the most distinct measured luminous advantage of HPS for pedestrian visibility appeared to be a higher positive contrast at head height (ranging from 1.2 to 8.5 times greater than LEDs). The HPS road lighting condition produced higher light levels, both vertically and horizontally, at greater lateral distances from the luminaire pole. The absolute luminance of the pedestrian’s head is proportionately higher against the dark background for the HPS lighting condition than for either of the LED conditions. The luminance contrast at the torso is measured to be similar across the three lighting conditions, since it is a ratio of torso luminance to road surface luminance, and this quantity remains relatively balanced for the darkly-clad pedestrian in each road lighting scenario.
3.2.2 Field-based measures of visual acuity
Mean visual acuity for the six testing conditions (three road lights and two distances) is given in Table 3, where a more negative logMAR value represents better visual acuity. There was no significant effect of road light condition (F2,95 = 0.46; p = 0.636), but there was a significant effect of testing distance (F1,95 = 340.92; p < 0.001), where visual acuity averaged across the three different lighting conditions was significantly better at 20 m compared to the 60 m testing distance (−0.10 logMAR vs. +0.10 logMAR), which represents a two line decrease in visual acuity at 60 m relative to that obtained at 20 m. However, there was no significant interaction between road light condition and testing distance (F2,95 = 1.28; p = 0.283), indicating that the reduction in visual acuity at the longer testing distance was consistent across road lights. The significant reduction in visual acuity at the longer testing distance is likely to be due to the lower luminance of the Tumbling E charts averaged across the three different lighting conditions at the 60 m testing distance (0.7 cd m−2) compared to the 20 m testing distance (9.5 cd m−2; Table 2).
Mean values (SD) for visual acuity, contrast sensitivity, pedestrian recognition times and pupil size as a function of road light condition and testing distance

Pedestrian recognition distance estimated based on recognition time and pedestrian walking speed.
3.2.3 Contrast sensitivity
Mean contrast sensitivity is given in Table 3, where a higher value in dB represents better contrast sensitivity. There was no significant effect of road light condition (F2,95 = 2.80; p = 0.07). There was a significant effect of testing distance (F1,95 = 192.35; p < 0.001), where contrast sensitivity averaged across the three different lighting conditions was significantly higher at the 20 m compared to the 60 m testing distance (16.3 dB vs. 10.0 dB), but there was no significant interaction between road light condition and testing distance (F2,95 = 0.56; p = 0.58), suggesting that the decreased contrast sensitivity at the longer testing distance was evident regardless of the type of road lighting. As for visual acuity, the significant reduction in contrast sensitivity at the longer testing distance is likely due to the lower luminance of the MET averaged across the three different lighting conditions at 60 m (0.3 cd m−2), compared to the 20 m testing distance (3.2 cd m−2; Table 2).
3.2.4 Pedestrian recognition
Table 3 also provides the time taken to first recognize a pedestrian walking from the starting position (far right of the roadway outside of the area lighted by the road lights), towards the line of sight of the participant seated in the stationary research vehicle, where a shorter time to recognize the pedestrian represented better performance. There was a significant effect of road light condition on pedestrian recognition times (F2,335 = 116.51; p < 0.001), with pairwise comparisons showing significant differences between all road light conditions (p < 0.001), where recognition times averaged across the two pedestrian locations were quickest (better performance) for the 2000 K HPS road light (15.4 s), followed by the 3000 K (17.6 s) and the 4000 K LED road light (19.0 s).
There was also a significant effect of pedestrian position on recognition time (F1,335 = 159.50; p < 0.001), averaged across lighting conditions where Pedestrian 1 was recognized significantly more quickly than Pedestrian 2 (16.1 s vs. 18.6 s). This difference is likely to be due to the larger visual angle subtended at the eye by Pedestrian 1 who was closer to the participants than Pedestrian 2. However, there was no significant interaction between road light condition and pedestrian location (F2,335 = 0.26; p = 0.771), suggesting that these effects did not vary with road light condition.
The approximate recognition distances based on recognition time and pedestrian walking speed (100 bpm; 5 km h−1) were calculated for Pedestrians 1 and 2 for the three lighting conditions (Table 3). As expected from the recognition time data, pedestrians were recognized further from the participants’ line of sight for 2000 K HPS (better performance), followed by 3000 K LED then 4000 K LED road lights and for Pedestrian 1 who walked at a distance closer to the participants than Pedestrian 2.
3.2.5 Pupil size
There was no significant difference in pupil size as a function of lighting condition (F2,38 = 0.08; p = 0.93; Table 3).
4. Discussion
This field-based study compared the effect of the different spectral and spatial distributions of two LED road lighting conditions (3000 K, 4000 K) and a HPS (2000 K) road lighting condition on visual function and pedestrian recognition of young participants with normal vision. The lighting conditions were designed to match based on standard requirements and reflect the outcomes of real retrofit situations, where road authorities are taking advantage of existing infrastructure (i.e. maintaining pole spacing and heights) to transition from HID to LED technology. Overall, the findings demonstrated that for the three road lighting conditions tested, there was no significant impact on visual acuity or contrast sensitivity (for targets which were scaled to account for different working distances) for tasks within the lit roadway area, with both measures being significantly better at the shorter compared to the longer testing distance, regardless of lighting condition. However, in this study, using commonly installed and commercially available HPS and LED luminaires, it was observed that the type of luminaire impacted on the ability of participants to recognize pedestrians walking from the darker shoulder areas beyond the lit roadway, moving towards the road. In these cases, pedestrians were recognized significantly more quickly for the HPS condition than either of the LED road lighting conditions.
The ability to resolve high contrast, fine detail measured using the Tumbling E visual acuity charts was significantly better at the 20 m compared to the 60 m testing distance, which was expected given that the luminance levels of the charts regardless of road light condition were much higher at 20 m (range 8.9 cd m−2 to 9.9 cd m−2, falling within the low photopic region) than at the 60 m distance (0.6 cd m−2 to 0.8 cd m−2, falling within the mesopic region). However, visual acuity was not significantly affected by the type of road lighting, at either the shorter (20 m) or longer (60 m) testing distances. The finding that visual acuity was poorer at the lower luminance levels present at the longer testing distance is expected given that visual acuity is reduced for lower luminance levels, particularly under mesopic and scotopic conditions, relative to photopic conditions.28–30 This suggests that drivers may experience significant changes in visual acuity while driving under all three types of road lighting conditions, dependent on the luminance of objects on the roadway.
Contrast sensitivity was also significantly higher at the 20 m compared to the 60 m testing distance but as for visual acuity, the reduction in contrast sensitivity at the longer testing distance was evident regardless of the type of road lighting. Similarly, as for visual acuity, contrast sensitivity was not significantly affected by the type of road lighting, at either the shorter or longer testing distances. The significant reduction in contrast sensitivity at the longer testing distance is likely to be because the luminance of the MET was significantly reduced at the longer distance (0.3 cd m−2) compared to the shorter testing distance (range 3.0 cd m−2 to 3.4 cd m−2). This decrease in contrast sensitivity under reduced light levels is well known in laboratory-based studies,30,31 and means that the ability to detect low levels of contrast, such as a darkly clad pedestrian or a pothole on the road surface, is reduced when the luminance of the roadway provided by road lights is reduced.
Collectively, the findings from the visual acuity and contrast sensitivity data demonstrate that drivers may experience significant changes in visual acuity and contrast sensitivity while driving under all three types of road lighting conditions, dependent on the luminance of objects on the roadway. Importantly, the findings suggests that the spectral differences between the 2000 K HPS, 3000 K LED and 4000 K LED test conditions designed to replicate typical levels of road lighting for a Category V3 roadway in Australia and New Zealand (i.e. maintained average carriageway luminance) did not significantly impact either visual acuity as measured by the Tumbling E charts, or contrast sensitivity measured with the MET.
The ability of participants to recognize the presence of pedestrians walking from outside the area illuminated by the road lights into that region illuminated by the road lights varied significantly as a function of lighting condition and pedestrian location. Both pedestrians were recognized sooner under the 2000 K HPS lighting condition, followed by the 3000 K LED and then 4000 K LED conditions, with the differences between all conditions being significant. Overall, collapsed across locations, pedestrians were recognized 3.6 s sooner under 2000 K HPS compared to 4000 K LED lighting, translating to an estimated difference in visibility distance of 5 m. To some extent, these findings can be compared to those from a government report 20 which showed that recognition distances for pedestrians wearing non-reflective clothing were shorter (poorer) for LED compared to HPS for lower levels of road lighting. In our study, the differences in pedestrian recognition between these lighting conditions are likely to have resulted from differences in the spatial light distribution of the luminaires used. The extent and intensity of the lateral distribution of light from the HPS luminaires was greater than that of the LED luminaires. This is evidenced by the higher horizontal design illuminances for the 2000 K HPS scenario at the lateral distance of 20 m shown in Table 1. In addition, the 3000 K road lights provided 1 lx to 2 lx higher illuminance levels than the 4000 K at the lateral distance of 20 m from the road light poles. These differences in spatial light distribution likely explain the slightly shorter recognition times (better performance) recorded for pedestrian recognition for the 3000 K compared to the 4000 K LED condition. Our findings demonstrate that the quantity of light adjacent to the road (spill light) is a critical factor in determining pedestrian recognition. Thus roadway lighting design when transitioning to LED luminaires, needs to consider the impact of potential reductions in spill light to pedestrian areas and provide designs that accommodate for this. This is most important in pedestrian-dominated areas such as intersections, particularly where spill light from roadway lighting was previously intended and utilized as a contributing element to pedestrian lighting adjacent to the roadway.
The findings of this study should be considered in the context of both its strengths and weaknesses. Strengths include a field-based study which reflects the visual distribution of road lighting at night which is not possible in laboratory-based or simulator testing. The study also replicates a realistic retrofit scenario that highlights the typical changes to spectrum, uniformity and spatial distribution of light that occur when transitioning from standard HPS to LED lighting. However, it should be noted that this study was limited by the fact that participants were not driving when their performance was measured, which while allowing a relatively high level of control of the measures, does not necessarily represent performance when a person is driving on regular roads. Ultimately, this approach was necessary, given that for safety and ethical reasons, driving towards a pedestrian entering the roadway would not be considered appropriate or safe. In addition, we included only younger participants with normal vision, so we are unable to predict whether there would be greater differences between road light conditions in older participant with normal vision or in those with age-related declines, who should be included in future studies. The study also only included one specific manufacturer’s LED type; thus, the findings are not generalisable across all LED luminaires, given that the spatial distribution of luminous intensity can vary from one LED roadway luminaire to another.
5. Conclusions
This field-based study demonstrated that there were no differences in visual performance for visual acuity or contrast-based measures under the three different road lighting conditions, where two different LED conditions (at CCTs of 3000 K and 4000 K) were designed to match a baseline provided by 2000 K HPS utilizing the same pole spacing. Another important finding was that the sharper cut-offs in beam intensity for the LED luminaires observed in this study, consistent with the well-controlled optical beam patterns often seen in LED roadway luminaires, negatively impacted on pedestrian recognition capacity when compared to the HPS condition. This optical property of LED luminaires should be considered in roadway lighting design, particularly in pedestrian-dominated areas. However, it is important to note that in interpreting the data from this study, testing was undertaken for one specific manufacturer’s LED type, and spatial distribution of luminous intensity can vary considerably from one LED roadway luminaire to another, so are not necessarily generalisable across all LED products. Collectively, the findings of this study provide a useful basis for studies to further explore the practical implications of transitioning from HPS to LED road lighting using existing infrastructure.
Footnotes
Declaration of conflicting interests
The authors declared no potential conflicts of interest with respect to the research, authorship, and/or publication of this article.
Funding
The authors disclosed receipt of the following financial support for the research, authorship, and/or publication of this article: This research was funded by the Department of Transport and Main Roads, Queensland, Department of Planning Transport and Infrastructure, South Australia, and Energex, Queensland.
