



Abstract
Lamps based on LEDs often introduce temporal light modulation (TLM). TLM consists of fluctuations in the emitted light over time and can lead to the perception of temporal light artefacts such as flicker and the stroboscopic effect. Due to the widespread concern about the negative effects of TLM on health and safety, additional regulations (Ecodesign) have been introduced. Since these regulations entered into force, it is important for laboratories to underpin their TLM measurements with SI traceability, and to intercompare their result for validation, because their measurements determine whether an LED lamp is allowed on the European market. Therefore, an interlaboratory study of LED lamps was conducted to validate laboratories’ capabilities and methods for TLM measurements of light sources. Overall, the developed models and evaluated uncertainties perform consistently, especially for optical TLM measurements of well-controlled sources with built-in power supply.
1. Introduction
Since the introduction of LED lamps, incandescent and fluorescent light sources are being replaced by these more energy-efficient LED lamps. While LED lamps have many advantages such as the mentioned energy efficiency and prolonged lifetime, LED lamps also introduce temporal light modulation (TLM). Both pulse-width modulation drivers and suboptimal AC–DC converters are usually the root cause of the TLM. 1 TLM consists of fluctuations in the emitted light over time and can lead to the perception of the temporal light artefacts (TLA) such as flicker, stroboscopic effect and the phantom array effect.2–5
Flicker is the perceived variation in light intensity because of fluctuations in luminance or spectral distribution observed by a static observer in a static environment. 5 In the case where the observer is in a non-static environment, for example, there is a change in motion perception, the stroboscopic effect can be perceived.5,6
Flicker and the stroboscopic effect can introduce negative effects on health and well-being.7,8 These effects can be divided in neurobiological effects, such as eye strain, fatigue, headaches and migraines,9–11 and performance or cognitive effects, such as decreased mood and comfort.12–14 Additionally, TLM affects brain activity, with a higher brain activity being measured when the flicker or stroboscopic effect are observed. 15
Due to the widespread concern on the negative effects of TLM on health and safety, the European Commission laid down Ecodesign requirements.16–18 These requirements entered into force in September 2021 and raised interest in reliable, accurate and reproducible methods to measure TLM. According to these regulations, short-term flicker
Since these EU regulations entered into force, it is important for laboratories to underpin their TLM measurements with SI traceability and to intercompare their results. These measurements play a decisive role whether an LED lamp and its associated separate control gears can enter the European market. Over time, guidance on how to measure and calculate TLM has been described in various technical reports.3–5,19 To validate the laboratories’ capabilities and methods for TLM measurements of light sources, an interlaboratory comparison of LED lamps was conducted among eight laboratories. These laboratories included national metrology institutes, lamp manufacturers, instrument manufacturers and universities.
In this study, we compared measurements of flicker and SVM of commercially available lamps as well as of a programmable TLA reference radiator designed for verification. Most commercially available lamps used in the study have flicker and SVM values below the regulation limits. We show that most of the participants would reach consensus on classification of the LED lamps in conformance with the regulations, but there is still room for discussion.
2. Method
2.1 Structure of interlaboratory comparison
The interlaboratory comparison comprised of eight participants: Aalto University, DTU Electro, Gigahertz Optik, ICCS, LMT, RISE, Signify Netherlands B.V. and VSL. Of these participants, VSL acted as pilot and performed the data analysis of the comparison results. RISE acted as copilot and carried out lamp ageing, pre- and post-comparison measurements, and distributed the light sources to the participants. Figure 1 shows an anonymised schematic of the structure of the comparison, where the copilot’s measurements are used to link the results of all participants. Each participant measured the light sources according to their normal measurement procedure for flicker expressed in

The structure of the comparison, where four sets of light sources are sent around, each measured by two of the participants. The copilot acts as a linking laboratory and measures the light sources before and after the participating laboratories. In addition, one of the sets was measured by the copilot, acting as participant, this time using a slightly different measurement set-up
2.2 Light sources
During the interlaboratory comparison, several light sources were measured: four waveforms of the Signify TLA reference radiator, two lamp types selected by the MetTLM project and five lamps supplied by the IEA 4E Solid State Lighting Annex.20–22 While in possession of participants, the light sources were stored between 15 °C and 35 °C and at a relative humidity below 75 %. To enable parallel measurements by participants, four sets of nominally identical light sources have been used.
The Signify TLA reference radiator is a programmable LED source with preinstalled waveforms to emulate flicker and stroboscopic effect, having various visibility and perception properties.23,24 Additionally, the temporally modulated output of the TLA reference radiator is independent of the mains impedance because of the programmable driver for the current. The TLA reference radiator needs 15 min of stabilisation time for initial warm-up and 5 min after changing waveform. The waveforms measured are waveforms 9, 14, 24 and 26. The shape of these waveforms is depicted in Figure 2. Occasionally, (about once every 30 min) the TLA reference radiator can switch off for a second, resulting in unintended temporal modulation. To mitigate this issue, participants performed repeated measurements.

The waveforms used in the comparison of (a) the lamps selected from the MetTLM project, (b) the lamps from the IEA 4E Annex interlaboratory comparison, (c, d) the TLA reference radiator
The lamps selected by the MetTLM project, lamps 1 and 2, needed a stabilisation time of 30 min and were measured base-up. These lamps were a combination of omnidirectional lamps with an E27 screw base and spot lights with an E14 screw base. The lamps supplied by the IEA 4E Solid State Lighting Annex, lamps 3 to 7, used a stabilisation time of at least 15 min, and the lamps were also measured base-up. All IEA 4E Solid State Lighting Annex interlaboratory comparison lamps were omnidirectional and had an E27 screw base.
2.3 Stability of the light sources
All light sources were seasoned and thereafter assessed for stability by the copilot following the stabilisation test protocol. To season the lamps, they were placed base-up in racks and powered for 24 h with a stabilised power supply. The racks were shielded from ambient light and kept at an ambient temperature of (25 ± 5) °C. The electrical test conditions used a supply voltage of 230 V AC (±0.5 %), a frequency of 50 Hz, a total harmonic distortion below 1.5 % and a power meter with a bandwidth larger than 100 kHz meeting CIE S 025 requirements.
25
After seasoning, the lamps were then moved to another facility where the photometric and electrical quantities were then measured every 5 min for the total duration of the stability test of 63 min, with measurements of the

Two examples of measured 15-min variance (relative variation width) for the comparison light sources (a) lamp type 2, light source set 1 and (b) lamp type 7, light source set 1
2.4 Measurement methods
The participants measured the TLM properties for each of the light sources. However,
To measure the

Typical measurement set-up to measure TLM
2.5 Data analysis
The calculation method used in analysis of the comparison results for flicker is outlined below; a similar approach was applied to the results for the stroboscopic effect. The results were processed by the pilot laboratory using methods from ‘Guidelines for CCPR Key Comparison Report Preparation, CCPR-G2 Rev.4, January 8, 2019’.
36
The copilot laboratory performed measurements of the light sources before sending them to the participants and after receiving the light sources back. In the analysis, each lamp type, as well as each waveform of the TLA reference radiator, is mathematically treated as an independent light source. Flicker measurements by the copilot are denoted by

This ratio is then normalised by dividing the ratio by the average of the ratio of the before and after measurements of the copilot. The normalised ratio

where
The uncertainty

where


The combined uncertainty of the ratio is determined by taking the partial derivatives and can be found in Equation (4). Additionally, the uncertainty corresponding to the normalised ratio is obtained by taking partial derivatives of the absolute expanded uncertainties of the before or after measurements of the copilot and is shown in Equation (5).
After determining the performance of the copilot, the measurements of the participants are evaluated. First, the relative difference
Additionally, the uncertainty of the relative difference can be calculated by taking partial derivatives shown in Equation (9).
Next, the average relative difference per waveform

where

The relative difference from the mean value for each participant

Using this equation,

The comparison reference value (RV) of the flicker measurement

and the corresponding uncertainty of the RV is given in Equation (15)

It should be noted that the comparison RV of each of the lamps or waveforms is the same for all participants who measured that lamp or waveform.
2.6 Outlier removal
Outliers were removed according to ‘Guidelines for CCPR Key Comparison Report Preparation, CCPR-G2 Rev.4, January 8, 2019’. In the case where the difference between the measurement and the RV is larger than three times its associated expanded uncertainty, the point is removed, and a new RV is calculated. 36 The biggest outlier is removed first; if outliers still remain after the RV is recalculated, then the next biggest outlier is removed, and so on until remaining outliers are the result of underestimation of the measurement uncertainty. This underestimation was assumed when (i) the measurement had a significantly lower uncertainty compared to other measurements, and (ii) the measurement would not be an outlier if it had an uncertainty comparable to the other measurements.
3. Results
3.1 Flicker results
3.1.1 Light source stability and consistency
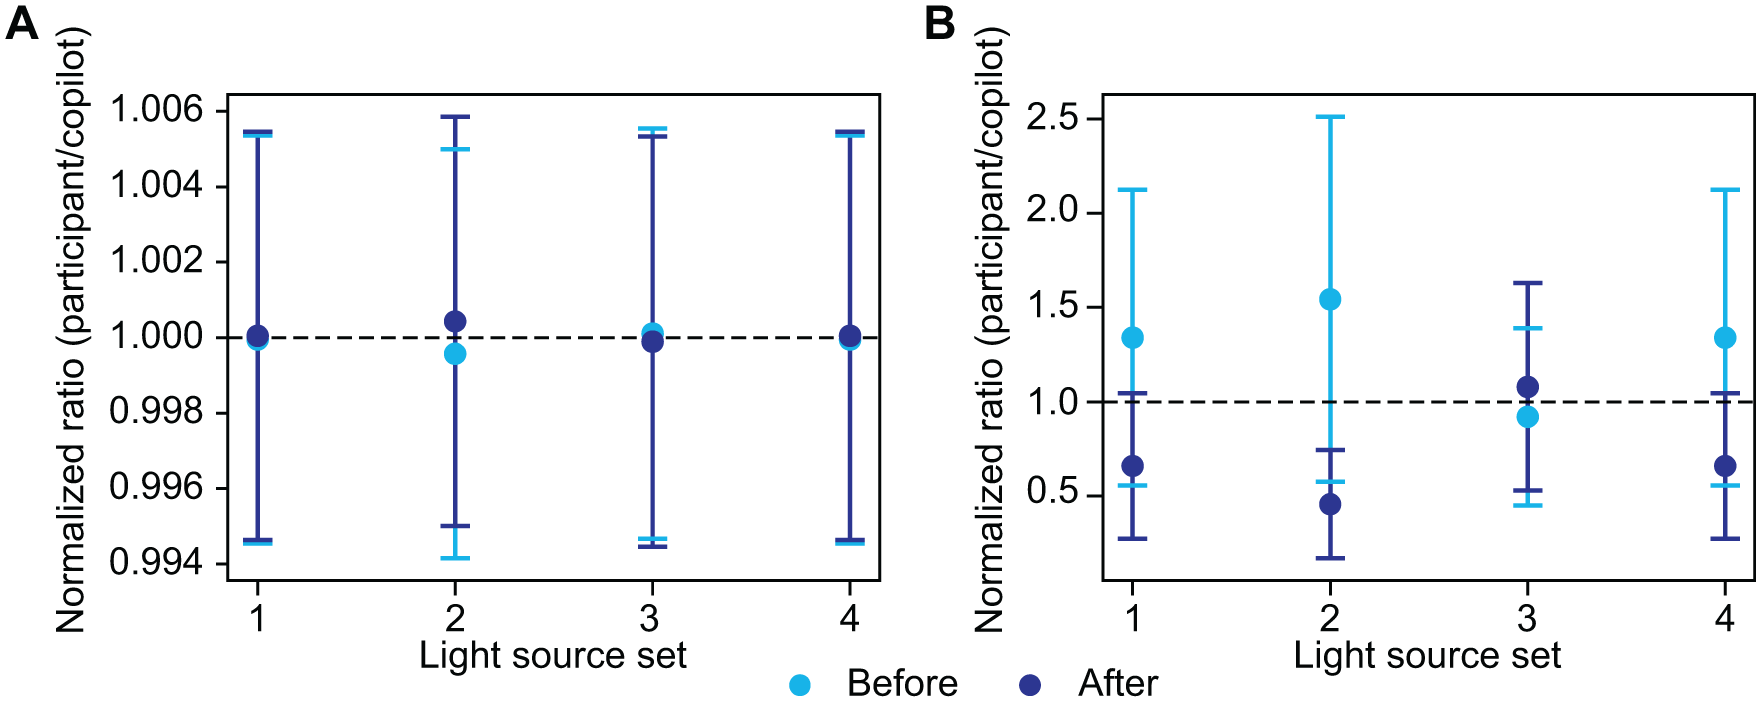
Figure 5 shows the normalised ratios, used to assess stability and consistency of the light sources, for flicker measurements of two of the light sources. Figure 5(a) shows the normalised ratio of waveform 9 of the TLA reference radiator. The before and after measurements are nicely overlapping. This normalised ratio is representative for all the waveforms of the TLA reference radiator and for the other light sources, with the exception of the lamp type shown in Figure 5(b).
The normalised ratio of the flicker (
Figure 5(b) shows the normalised ratios of lamp type 1. These lamps are less stable than the TLA reference radiator waveform 9, with lamp type 1 from light source set 2 only having barely overlapping uncertainties from the before and after measurements, of which one does not even pass the normalised ratio value of 1.0. Lamp type 1 was the exception from all the other lamp types and an example of an unstable light source, which was specifically chosen by the consortium due to the high amount of flicker.
3.1.2 Degrees of equivalence
Figure 6 shows the degrees of equivalence as well as the flicker measurements and their RV of four types of light sources from those measured during the comparison. Figure 6(a) shows the degrees of equivalence of TLA reference radiator waveform 9. The figure shows that participants 1, 2, 3, 4 and 6 are non-equivalent. Figure 6(b) gives the results, RV and uncertainties for each participant for this waveform and shows that the value of participant 3 is significantly higher than the RV. Additionally, for participants 5, 7 and 8 the uncertainties are nicely enveloping both the measurement value and the RV, while for participants 1, 2 and 4 only the uncertainties are overlapping. Figure 6(c) shows that for lamp type 1 the participants have reached equivalence. Figure 6(d) shows that the uncertainty of the RV of lamp type 1 overlaps with the measurements of all participants, but the uncertainty of the measurement only envelops the RV for participant 5. Figure 6(e) shows that for lamp type 3, as for waveform 9, there also is no equivalence. This is confirmed by Figure 6(f), where there is a large variation in measurement values. Only for participant 5 is the measurement overlapped by the uncertainty of the RV. Additionally, Figure 6(f) shows that the result of participant 3 is off from the RV and is thus pushing the other laboratories out of equivalence. Figure 6(g) shows that for lamp type 6 none of the participants are equivalent. This is confirmed by Figure 6(h), where only participant 5 has their measurement overlapped by the uncertainty of the RV. Participant 3 even measures a value above 1. However, since the measured value still falls within 10 % of the limit, the lamp would still be allowed on the EU market. Furthermore, Figure 6(h) shows that the results of participant 3 is off from the RV and thus pushing the other laboratories out of equivalence. The results of all degrees of equivalence as well as the mean RV for all lamps and all participants are shown in Supplemental Information 1.

Degrees of equivalence and their uncertainty of the flicker (
3.2 Stroboscopic effect visibility measure
3.2.1 Light source stability and consistency
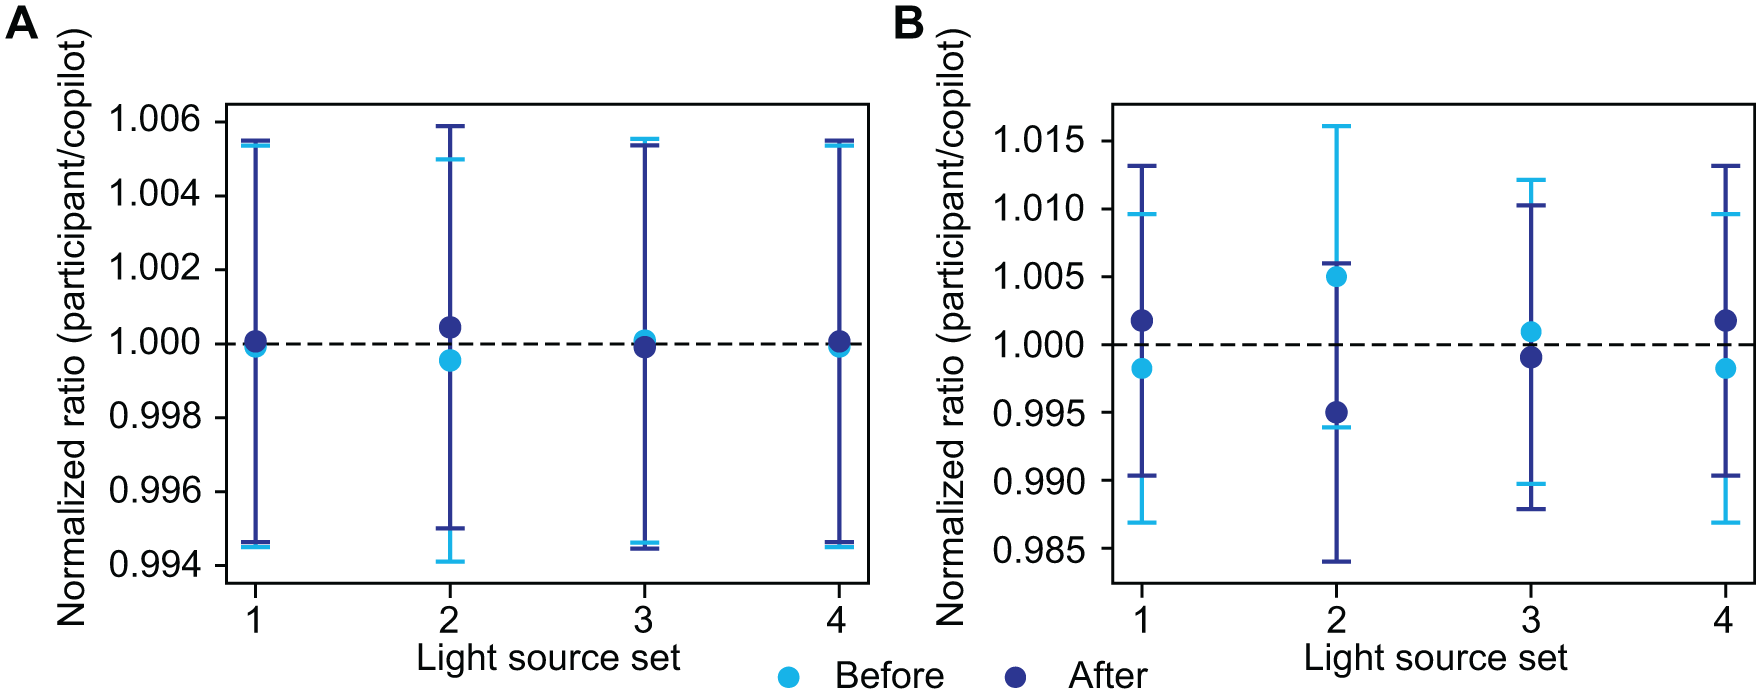
Figure 7 shows the normalised ratio of the stroboscopic effect visibility measure for two of the light sources. Figure 7(a) shows the normalised ratio of
Normalised ratio of the stroboscopic effect visibility measure (
3.2.2 Degrees of equivalence
Figure 8 shows the degrees of equivalence and the measurement and RV for two of the waveforms of the TLA reference radiator as well as of two of the lamp types. Figure 8(a) shows that participants 3 and 6 are non-equivalent for waveform 9. This is confirmed by Figure 8(b), which shows that the uncertainties for these participants are not overlapping. Additionally, Figure 8(b) shows that the measurement and RV are enveloped by the uncertainties of participants 1, 2, 4, 5 and 7. Figure 8(c) shows that all participants are equivalent for waveform 24. Figure 8(d) shows that for waveform 24 the measurement and RV are enveloped by participants 2, 4, 5, 6, 7 and 8. Figure 8(e) only shows equivalence for participant 8 for lamp type 2. Figure 8(f) shows that participant 7 measured a value significantly higher than the others. Additionally, the

Degrees of equivalence and their uncertainty of the stroboscopic effect (
3.3 Outlier removal
The measurements of the light sources contained several results which required removal since they were outliers, that is, the difference between the measurement and the RV was larger than three times its associated expanded uncertainty. This resulted in removal of outliers for waveform 9, waveform 24 and waveform 26, and lamps 6 and 7 for the

Degrees of equivalence of (a) waveform 9 of the TLA reference radiator and (b) the lamp type 6 for the flicker measurements after removal of the outliers

Degrees of equivalence of (a) lamp type 2 and (b) lamp type 4 of the stroboscopic effect visibility measure after removal of outliers
4. Discussion
The aim of the interlaboratory comparison was to validate participants’ capabilities for measurements of the flicker and stroboscopic effect produced by several types of light sources. While most of the participants agreed on the admission of certain lamps to the European market, the results show that the agreement is not yet unanimous, with one result falling even outside the 10 % tolerance of the Ecodesign requirements. 16 Therefore, it is important to evaluate the origin of the differences between measurements of the participants.
These differences can be explained because each of the participants used their own measurement set-up with corresponding uncertainty budget for this interlaboratory comparison. Therefore, uncertainties between participants vary greatly. Participants with a lower claimed measurement uncertainty could have missed some factors affecting their measurement in their uncertainty budget determination, resulting in a poor degrees of equivalence and thus having less overlap with the RV or measurements of other participants. Additionally, the equivalence and RV could be affected by outliers in the measurements. While we took outlier removal into account, alternative removal methods could be debated. 36 Furthermore, the stability of the lamps could have affected the measurements. Lamp type 1 showed a stability worse than the others. This could have increased the differences among the participants.
In addition, it has been shown that applying zero padding, a method to increase the frequency resolution of a fast Fourier transform to the
5. Conclusion
This interlaboratory comparison showed measurements of the flicker and stroboscopic effect by eight different participants. The participants measured the
Furthermore, some participants must re-evaluate their uncertainty budget, since the uncertainty is underestimated for the influence of zero padding in the SVM model for stroboscopic effect visibility measure and differences associated with the use of different power supplies among laboratories. For optical sources such as the TLA reference radiator, that eliminates the effects of different external power supplies, the results are consistent among most participants, underpinning their capability for assessment of light sources against the Ecodesign requirements.
Supplemental Material
sj-docx-1-lrt-10.1177_14771535261417537 – Supplemental material for Interlaboratory comparison of measurement capabilities for flicker and stroboscopic effects for Ecodesign conformity assessment
Supplemental material, sj-docx-1-lrt-10.1177_14771535261417537 for Interlaboratory comparison of measurement capabilities for flicker and stroboscopic effects for Ecodesign conformity assessment by MW Kuiper, S Källberg, A Thorseth, A Klej, V Mantela, EN Madias, T Reiners, R Zuber and PR Dekker in Lighting Research & Technology
Footnotes
Declaration of conflicting interests
The authors declared no potential conflicts of interest with respect to the research, authorship, and/or publication of this article.
Funding
The authors disclosed receipt of the following financial support for the research, authorship, and/or publication of this article: The work published in this paper is funded by the European Metrology Programme for Innovation and Research (EMPIR) Project 20NRM01 MetTLM ‘Metrology for temporal light modulation’. This project has received funding from the EMPIR programme co-financed by the Participating States and from the European Union’s Horizon 2020 research and innovation programme.

Supplemental material
Supplemental material for this article is available online.
References
Supplementary Material
Please find the following supplemental material available below.
For Open Access articles published under a Creative Commons License, all supplemental material carries the same license as the article it is associated with.
For non-Open Access articles published, all supplemental material carries a non-exclusive license, and permission requests for re-use of supplemental material or any part of supplemental material shall be sent directly to the copyright owner as specified in the copyright notice associated with the article.
