
Abstract
Everyday light exposure plays a vital role in circadian entrainment, especially during twilight. Electric lighting can supplement daylight anytime, enabling unlimited human activity; hence, many struggle to combine a healthy sleep regime with social constraints. Dusk/dawn simulators have been developed to compensate for the lack of twilight exposure and are typically applied in residential environments, where people usually sleep. Innovations in tuneable lighting control enable home-integrated dusk/dawn simulation, but it is essential to understand their performance and acceptance in real-life situations. A pilot field study was executed in 14 Swedish apartments and tested 3 lighting control scenarios for effects on behaviour, well-being and sleep patterns during the winter. Data were collected using wearable actigraphy, weekly surveys and interviews. The light intervention influenced wake- and bedtimes and contributed to slightly more consistent sleep schedules. Subjective responses emphasised that the dawn simulation assisted in a calm and peaceful wake-up, providing extra time for morning activities. The dusk simulation was a reminder to go to bed, but not all participants appreciated the light quality. Satisfaction and acceptance of the pre-programmed dusk/dawn control system were very high, provided there would be increased control for the residents.
1. Introduction
Home lighting is typically designed to focus on visual, aesthetic and, more recently, energy efficiency aspects. 1 Lighting accounts for up to 20% to 30% of the home’s electricity usage in Sweden.2,3 Therefore, identifying optimal approaches to reduce electric lighting energy consumption in residential environments is crucial for operational cost savings through reduced electricity bills. Innovations in electric lighting now enable advanced lighting control beyond merely manually switching the light on and off. Advanced lighting control systems allow (remote) 24 h control of lights and control over a dynamic light character. Automated control can switch lights on and off at predetermined times and adjust the lighting in both intensity and/or spectral composition to the setup desired at different times of the day. The idea of ‘smart’ lighting emerged over the years in commercial and industrial environments, focusing on energy saving. A light simulation study with a residential context in Sweden suggested that using controlled lighting solutions, including optimised sensor applications, can save more than 50% of electric lighting energy consumption compared to non-smart systems. 4 Nevertheless, that is, occupant behaviour and climate context can affect the energy-saving potential. 5
Enhanced lighting control can offer opportunities in addition to energy saving to users in home environments to provide a comfortable atmosphere and maintain user sleep quality and well-being. Empirical knowledge about how light affects human sleep and well-being is growing.6–8 Bright light exposure in the morning phase advances sleep on a consecutive night, and bright light exposure in the second part of the biological day phase delays sleep on a consecutive night. 9 A consistent sleep pattern appears essential for good health. 10 Sleep has been linked to many mental and physical health aspects, ranging from better mood to lower overall mortality.10–12 Many factors negatively affect sleep, such as high workload, work hours and perseverative cognition (e.g. Akerstedt et al., 13 Clancy et al. 14 ). In addition, human social schedules, such as work and school hours, pose significant constraints to when and how long humans can sleep, often leading to less efficient sleep schedules. 15
Everyday light exposure is of significant biological relevance for a good night’s sleep and human circadian functioning in general. 16 The light transition during twilight is necessary for good human photoentrainment, affecting human health and well-being.17,18 People are often at home during the twilight periods, and most humans get their first and last light exposure of the day at home. Therefore, especially during the dark Scandinavian winter, well-timed dawn-simulator electric lighting in the bedroom can help people wake-up and get-up comfortably and timely.19–21 Furthermore, dusk-simulator lighting in the evening can inform and guide people regarding an appropriate bedtime to attain restorative sleep. Enhanced lighting control systems are available for the residential market. They can be applied to the entire home as part of a regular home lighting system to aid people in acquiring and maintaining a healthy and consistent sleep pattern while facing demanding social schedules.
Most research regarding light effects during the day is performed in non-residential buildings (i.e. offices, 22 healthcare facilities,23,24 schools25,26). In the limited studies on lighting at home, a substantial part focuses on therapeutic interventions (i.e. seasonal affective disorder,27,28 burnout, 29 sleep disorders, 30 dementia31–33) rather than applying lighting to the healthy population.34,35 Additionally, there is a strong emphasis on exposure to electric lighting, that is, daylight exposure through windows has been underrepresented. 36
In residential studies, dawn and dusk light simulation scenarios have been proposed to help people maintain healthy sleep hygiene. A dawn simulation can provide a less steep transition from sleep to wakefulness, which could positively affect morning alertness,37,38 mood,37–39 sleep quality 37 and cognitive performance. 20 Others found improved cardiovascular functioning and lower burnout scores 29 due to a dawn-simulated wake-up. In addition, combining dusk and dawn simulation can help people fall asleep more easily 40 and has led to lower sleepiness scores and improved cognitive functioning. 41 Combining dusk and dawn simulation may thus improve sleep, daytime well-being and performance and help people synchronise better with social schedules. Recent recommendations stated that daytime light exposure should provide a melanopic equivalent daylight illuminance (mEDI) of at least 250 lx. In contrast, light levels should decrease significantly to an mEDI of 10 lx three hours before bedtime. 16
However, the studies lack scientific rigour in the limited cases in which home environments were investigated, predominantly using dawn simulation. For example, studies that consisted solely of surveys or studies that lacked documentation of used lighting equipment led to reduced possibilities for causal inferences. Additionally, to let controlled lighting guide and assist people in a healthy and comfortable light exposure scenario, it is crucial to fully understand the lighting systems’ performance and acceptability in real-life situations. Therefore, a seven-week pilot field study aimed to investigate the effect of an enhanced lighting control schedule on sleep outcomes and well-being while at the same time investigating the usability and acceptance of this system.
2. Method
The field study involved 15 people populating 14 one- or two-bedroom apartments in Jönköping (Sweden) who were followed in a field study for seven weeks while experiencing three different pre-programmed control scenarios (‘Wake-up’ (dawn), ‘Go to work’, ‘Go to sleep’ (dusk)) for four weeks. The first two weeks were baseline weeks, and the third week was a transition/wash-out period. The field study focussed on apartments as home environments for convenience and simplicity. Since different lighting scenarios were implemented, the apartment had to have a separate bedroom; therefore, it needed to be at least a one-bedroom apartment. The study was executed during the winter and started directly after the Christmas vacation (10 January to 25 February 2022, sunrise between 07.08 and 08.41; sunset between 15.40 and 17.25, hence minimal to no interference by daylight). Outcome variables were related to sleep quality, well-being and comfort, and system usability. The researchers collected results via wearable sleep trackers, weekly online surveys and personal interviews at the end of the study.
2.1 Participants
A rental housing provider, Willhem AB, helped recruit participants from their one- or two-bedroom apartments database in Jönköping, Sweden (57°46′N, 14°09′E). Over 75 tenants responded and received a short online questionnaire including questions related to predefined in- and exclusion criteria. Sixteen individuals who met predetermined inclusion criteria were selected. The study requested that the participant be available during the entire study period and not travelling for more than two consecutive days twice during the study period. A selected participant had to work at least 20 h per week during the day. Participants were excluded if they had young children (aged <2 y) to prevent nighttime awakenings or if they take sleep medicine or have (medically diagnosed) sleep disorders. If the participant shared the bedroom, the other person should not work night shifts and have a similar wake-up time (no more than one hour apart). Eventually, 14 apartments having one resident engaged in the study; one household had two residents, and one participant withdrew before study procedures could be initiated. During the study, one participant was unable to continue due to illness. Therefore, the data from 13 apartments and 14 participants were included in the analysis.
The Swedish Ethical Review Authority approved the study (ref. number 2021–03873), and written informed consent was obtained from all participants. The participants did not receive any rewards for their participation other than that they were allowed to keep the luminaires and the lighting control system after the study.
2.2 Field study and lighting control
Three luminaires (floor lamps) were placed at three locations in the apartment (Figure 1(a)). Off-the-shelf residential lighting control systems were programmed for each participant following the intended light control scenarios, as shown in Figure 1(c) to (d). One luminaire (IKEA Skurup floor uplighter with IKEA Ranarp clamp spotlight) with two smart light sources (Philips Hue White (2700 K) A67 soft-white bulb 1600 lm and Philips Hue White warm-white (2700 K) Lustre P45 bulb 470 lm) was placed in the living room for dusk simulation, one luminaire (uplighter with spot, two bulbs) in the bedroom for dawn simulation and one luminaire (uplighter, one bulb) in the kitchen for dawn lighting and a ‘time-to-leave’ signal. The luminaire was retracted for transportation to the apartment (see Figure 1(a)) and adjusted on-site to its full height (uplighter scale at h = 2 m). The luminaire could be moved to another nearby location if necessary, and the spotlight (h = 1.3 m) on two of the luminaires could be pointed in an appropriate direction. An adjusted version of the control software running on the communication bridge/hub (Philips Hue Bridge 2.0) controlled the lighting using a separate Wi-Fi network (with its own SIM card). The participants received a Hue remote control, which enabled them to turn-off the lighting at any time for the rest of the day. The next morning, the control would function as planned. They were told to only use it in exceptional circumstances (i.e. sickness).
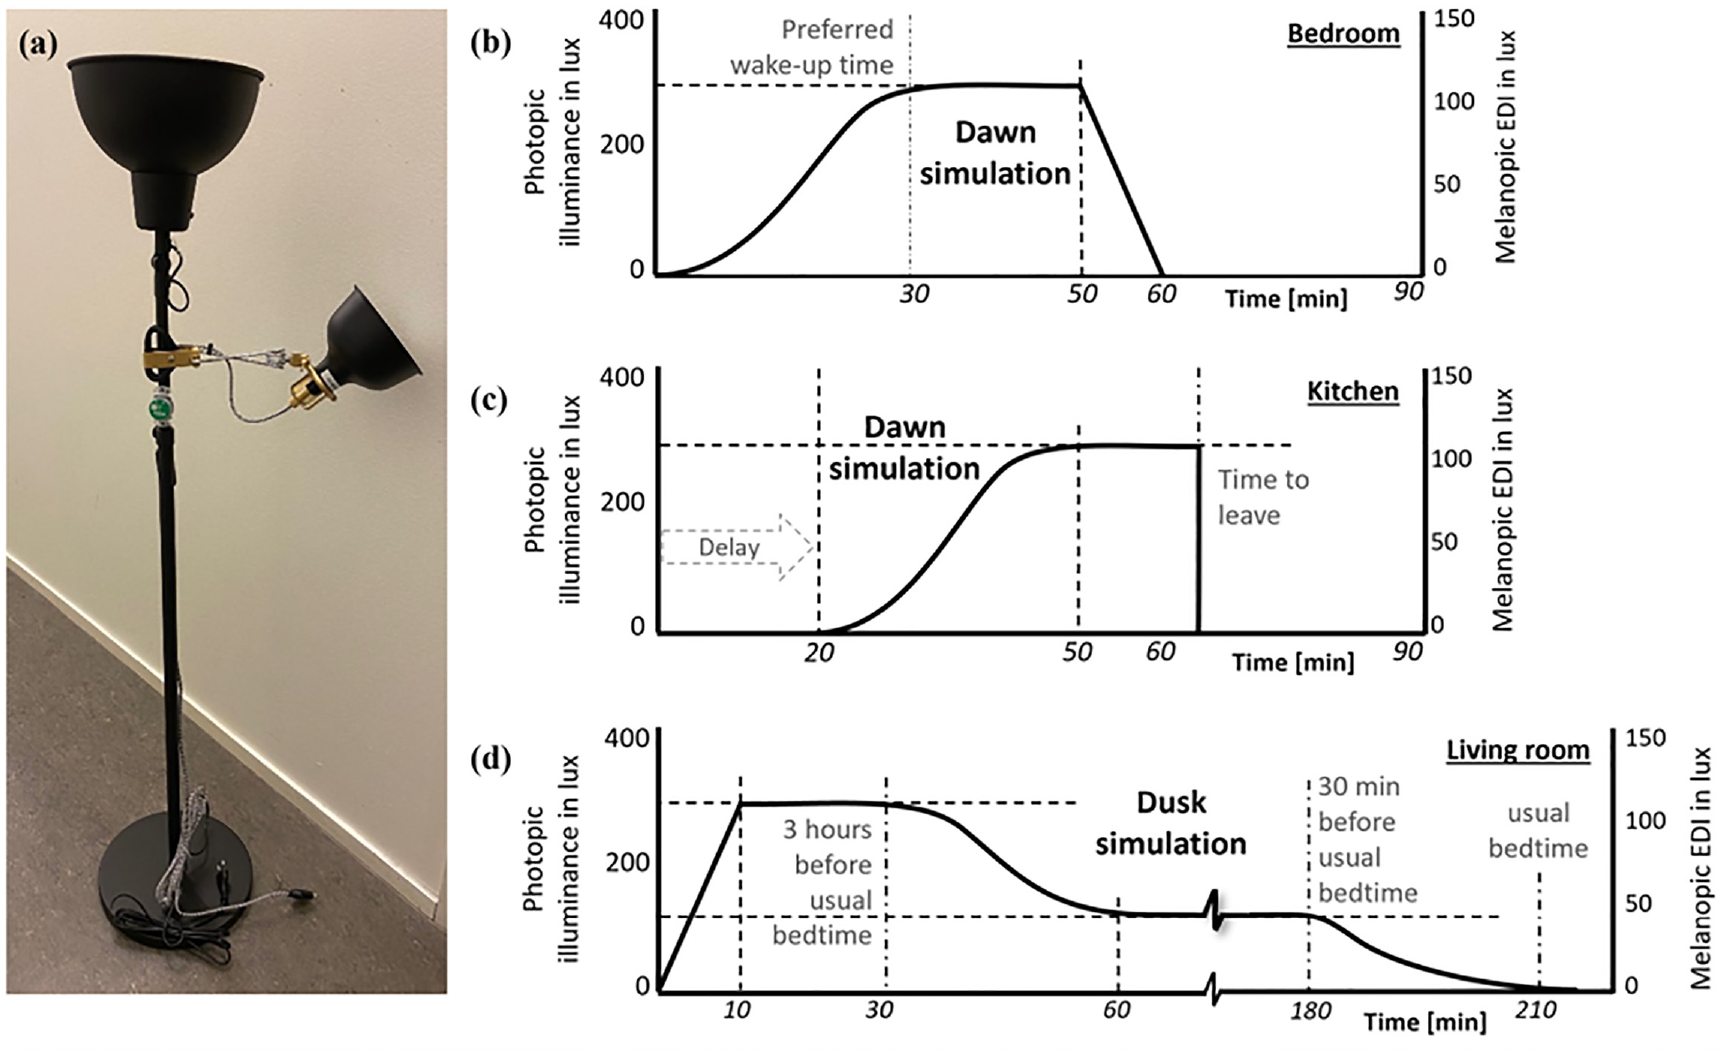
(a) Study luminaire (retracted height) combination used to control the lighting according to the scenario in (b) bedroom, (c) kitchen and (d) living room. The set light levels are reported as photopic illuminance and mEDI in lux and measured at a distance of ±50 cm from the luminaire (at h = 75 cm). The luminaire in the kitchen did not have the spotlight attached
An illuminance/temperature data logger (Onset MX2202 HOBO Pendant MX) was attached to the bedroom luminaire (h = 1.25 m), which continuously logged the vertical illuminance levels in the bedroom at five-minute intervals. An MBIENT logger (MBIENT MMS) was placed in the living room uplighter’s bowl to monitor the occurrence of the planned lighting control at five-minute intervals. The participant was aware of the logging even though the logger in the living room was not directly visible to the participant.
The programmed lighting (Figure 1) followed recommendations found in the literature.16,42 Brown et al. 16 recommended that daytime light exposure provides a mEDI of at least 250 lx; hence, the dusk simulation started dimming at the light bulb’s maximum level (second dashed line in Figure 1(d)). Light levels should go down significantly to an mEDI of 10 lx three hours before bedtime, and the simulation partly agreed by dimming down in two steps. The lighting dimmed from 50 lx to 0 lx for 30 min before the participant’s preferred bedtime. The dawn simulation started increasing 30 min before the participant’s preferred wake time. Danilenko and Hommes 42 reported that the suppression of the darkness hormone melatonin began when the dawn simulation reached 100 lx. The dawn simulation in the kitchen (Figure 1(c)) started 20 min after the bedroom dawn simulation to account for an estimated 20-min waking period, including activities such as a bathroom visit or dressing. The aimed levels when planning the experiment were to provide an Ehor of more than 100 lx and an mEDI = more than 10 lx). Under laboratory conditions, the applied simulation reached that level ~15 min before the preferred wake time (Ehor = 150 lx, mEDI = 25 lx. The light levels are measured at ±500 mm from the luminaire at a height of 750 mm (participant’s bedside). Results from laboratory spectrometer measurements at different distances and for possible head positions are provided in the Supplemental Material (Excel file). Even though the bathroom is where people may spend some time after waking up and going to bed, this room was not included for privacy reasons.
The residents received an actigraphy device (Philips Actiwatch 2), which they wore on the non-dominant wrist during the entire study (see Figure 2). The wrist-worn actigraph is a small, portable device with accelerometers (piezoelectric motion sensors) that detects physical movement and uses scoring algorithms to translate activity into determination of sleep and wake intervals. The data collection used a 60 s epoch. The device has a built-in illuminance meter, and illuminance data were logged but not used as a measure of ocular light exposure since the device is wrist-worn and not close to the eye.43,44 The device was swapped halfway through the study due to a reduced battery life (30 days maximum). Sleep tracking during the first two weeks of the study (no additional lighting activation) was used as a baseline measurement. Additionally, each Sunday morning, the participants received a link to an online questionnaire (esMaker) regarding their self-assessed well-being/health (7-point Likert scales: ‘Mood’ (sad–happy), ‘Energy level’ (tired–energetic) and ‘Stress’, ‘Sleepiness’, ‘Headache’, ‘Eye issues’ and ‘Dizziness’ (not at all–very much)). Seven questions are included where the two related to measuring mood across the dimensions tension and energy came from literature. 45 Additionally, the participant was able to report potentially interesting/affecting unusual occurrences in their daily lives and made comments/remarks.
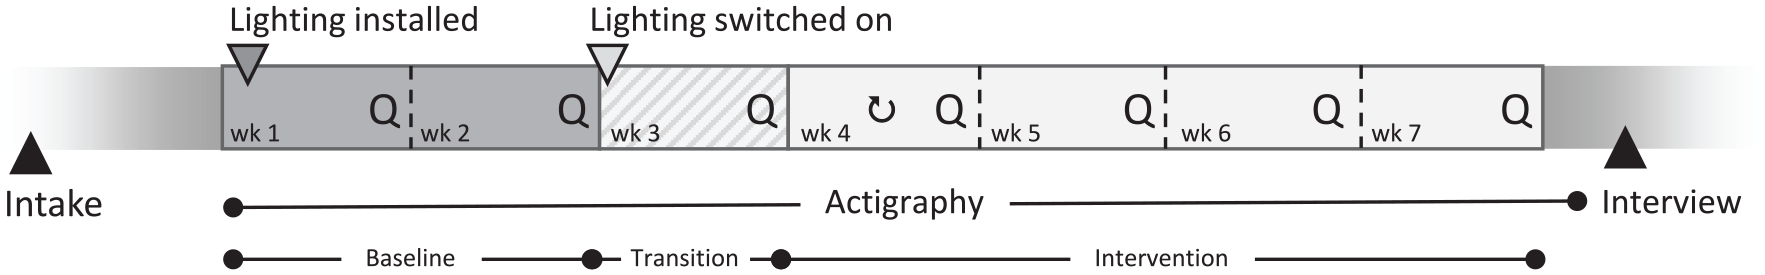
Overview of the study design with the pre-controlled lighting installed in week 1 and switched on in week 3. Actigraphy was ongoing for the entire seven-week period with a switch (
After the two baseline weeks, the questionnaire contained 23 added questions regarding the experience of the lighting scenarios and interaction with other lighting in the apartment to assess the usability and acceptance of lighting control systems. Participants were asked to select a value (scale 1 to 7) for the following statements regarding overall usability experience 46 : The [wake-up lighting (in the bedroom)]/[Work time reminder lighting (in the kitchen)]/[Bedtime lighting (in the living room)] is [Annoying 1 to Enjoyable 7/Does not meet needs 1 to Meets needs 7/Demotivating 1 to Motivating 7/Confusing 1 to Clear 7/Inconvenient 1 to Comfortable 7]. Besides, participants were asked regarding the changed use (Yes/No) of their regular light sources: [I have related light sources that I usually have on]/[I turned on light sources that I usually have off]. Questions ‘Did you notice an improvement in [wake up during the week]/[wake up during the weekend]/[go to bed during the week]/[go to bed during the weekend/[How much did the lighting generally help you get up?]/[How much did the lighting generally encourage you to go to bed?]’ were requested on a 7-point scale (Not at all 1 to Very much 7). A personal semi-structured interview was scheduled at the end of the study period, focusing on deepened information regarding well-being, usability and acceptance.
2.3 Data analysis procedure
The actigraph data were analysed with the Philips Actiware 6 software using the internal major sleep/rest recognition algorithm. Data extracted from the activity/sleep trackers were the start moment of a rest period as the intention to sleep (‘Bedtime timing’) and the moment a participant woke up (‘Wake-up timing’). Chow et al. 47 explained that the algorithm determines the rest interval and, subsequently, the time the participant gets out of bed (rise time). After the rest interval is defined, the software automatically detects the time spent asleep within the rest period with the ‘Wake-up timing’ being the end of that period. Since the actigraph collected illuminance data as well, the data assisted with the determination of the start of the rest period in case the software algorithm did not recognise the start of the rest period. The choice for this moment is motivated by a person going to bed and turning the light off with the intention of going to sleep. In any case, the moment with most activity prior to strongly reduced activity is likely to be the start moment of a rest period (intention to sleep). Similarly, the first moment with strongly increased activity after a (long) period with reduced activity is likely to be the end moment of a sleep period.
Additionally, ‘Sleep efficiency’ and ‘Total sleep time’ were derived. Sleep efficiency refers to the percentage of time a person sleeps in relation to the amount of time a person spends in bed. Sleep efficiency is considered normal when it is 80% or greater. 48 The total sleep time is the total amount of sleep time scored (in minutes) during the total recording time and includes the time from sleep onset (transition from wakefulness into sleep) to sleep offset (transition sleep to wakefulness).
The weekly survey data were exported from esMaker to Excel. One of the survey’s questions concerned whether the participant slept in the apartment or not. If this was not the case, the data for this day were deleted from the survey and actigraphy data sets. The software tool IBM SPSS Statistics 27 was used for the quantitative data analysis. The well-being/health-related variables (from the survey) and the sleep-related variables (from the actigraphy) were inspected for outliers. Values with a standardised Z-score >3.0 or > −3.0 were marked as outliers and were not included in the final analysis. Additionally, as some participants experienced technical start-up problems with the lighting equipment, data collected during the third week of the study were not included in the analysis for all participants. Paired-samples t-tests were used to compare the data for the baseline (weeks 1 and 2) and intervention (weeks 4 to 7). To make a statement about the effect size (percentage variance explained), eta-squared (η2) values were calculated, and the following criteria were used to indicate the size effect: 1% small, 6% medium and 14% large effect. Data were visually inspected to investigate potential progression trends over time.
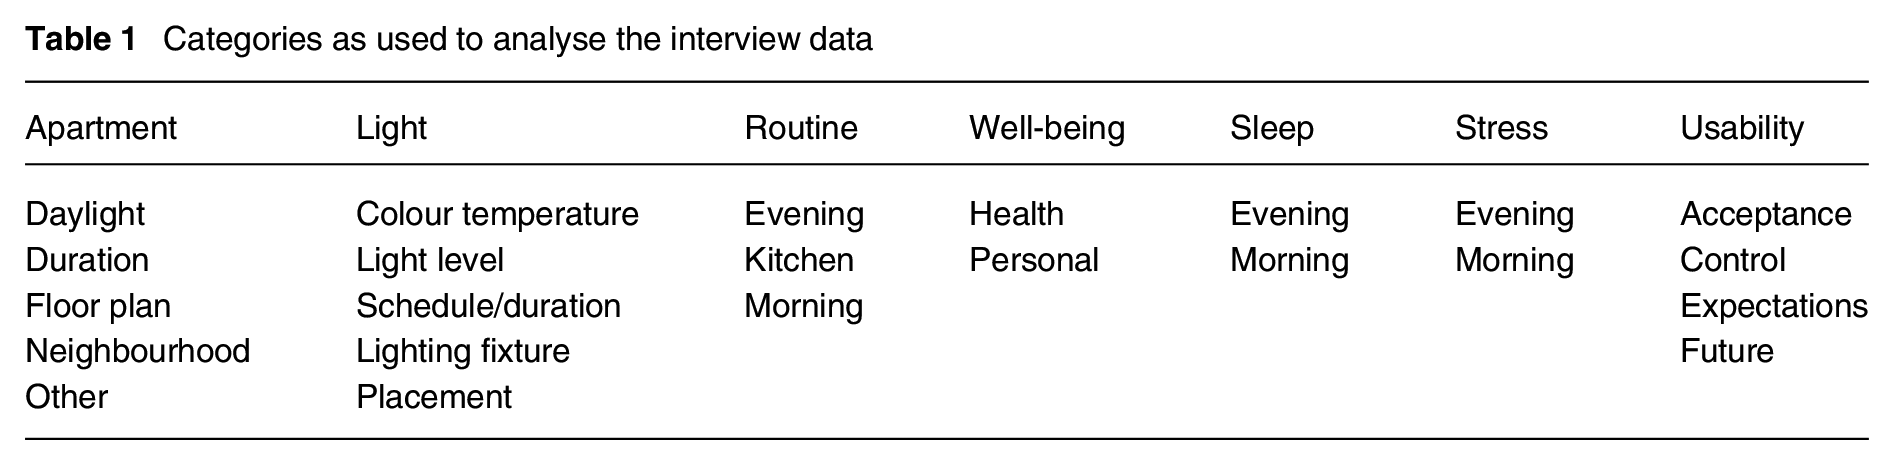
For the qualitative analysis of the interview data, NVIVO 1.7 was used. Firstly, the interviews were transcribed by a professional agency, and subsequently, the relevant text was translated from Swedish to English and categorised using seven predefined categories and sub-categories (see Table 1).
Categories as used to analyse the interview data
3. Results
Of the 14 residents (seven females/seven males, age 33.3 ± 9.0 years), three participants have lived less than a year in their apartment, four participants have lived there between 1 y and 2 y, four participants have lived there between 3 y and 5 y and three participants have lived more than 6 y in their apartment. In addition, two participants shared the same apartment during the study period.
For the quantitative analysis, data for well-being/health, sleep/wake timing and sleep quality were compared for the baseline and intervention periods. The main results are given in the subsequent paragraphs; additional descriptive statistics and the results of performed paired-sample t-tests are provided in the Supplemental Material (Tables A-I to A-VII).
3.1 Well-being/health-related items
Each week, the participants were asked to report their score on seven well-being/health-related items. The data for both periods (baseline, intervention) were checked for normality by looking at skewness and kurtosis values (see Table 2). An acceptable range of −1.5 to 1.5 for skewness and −3.0 to 3.0 for kurtosis was applied. 49 The results showed that skewness and kurtosis for the variables ‘Eye issues’ and ‘Dizziness’ were outside this range, meaning that the data were not normally distributed. Both variables were not included in further analysis.
Descriptive statistics for the seven ‘Well-being/Health items’ during the baseline and intervention period
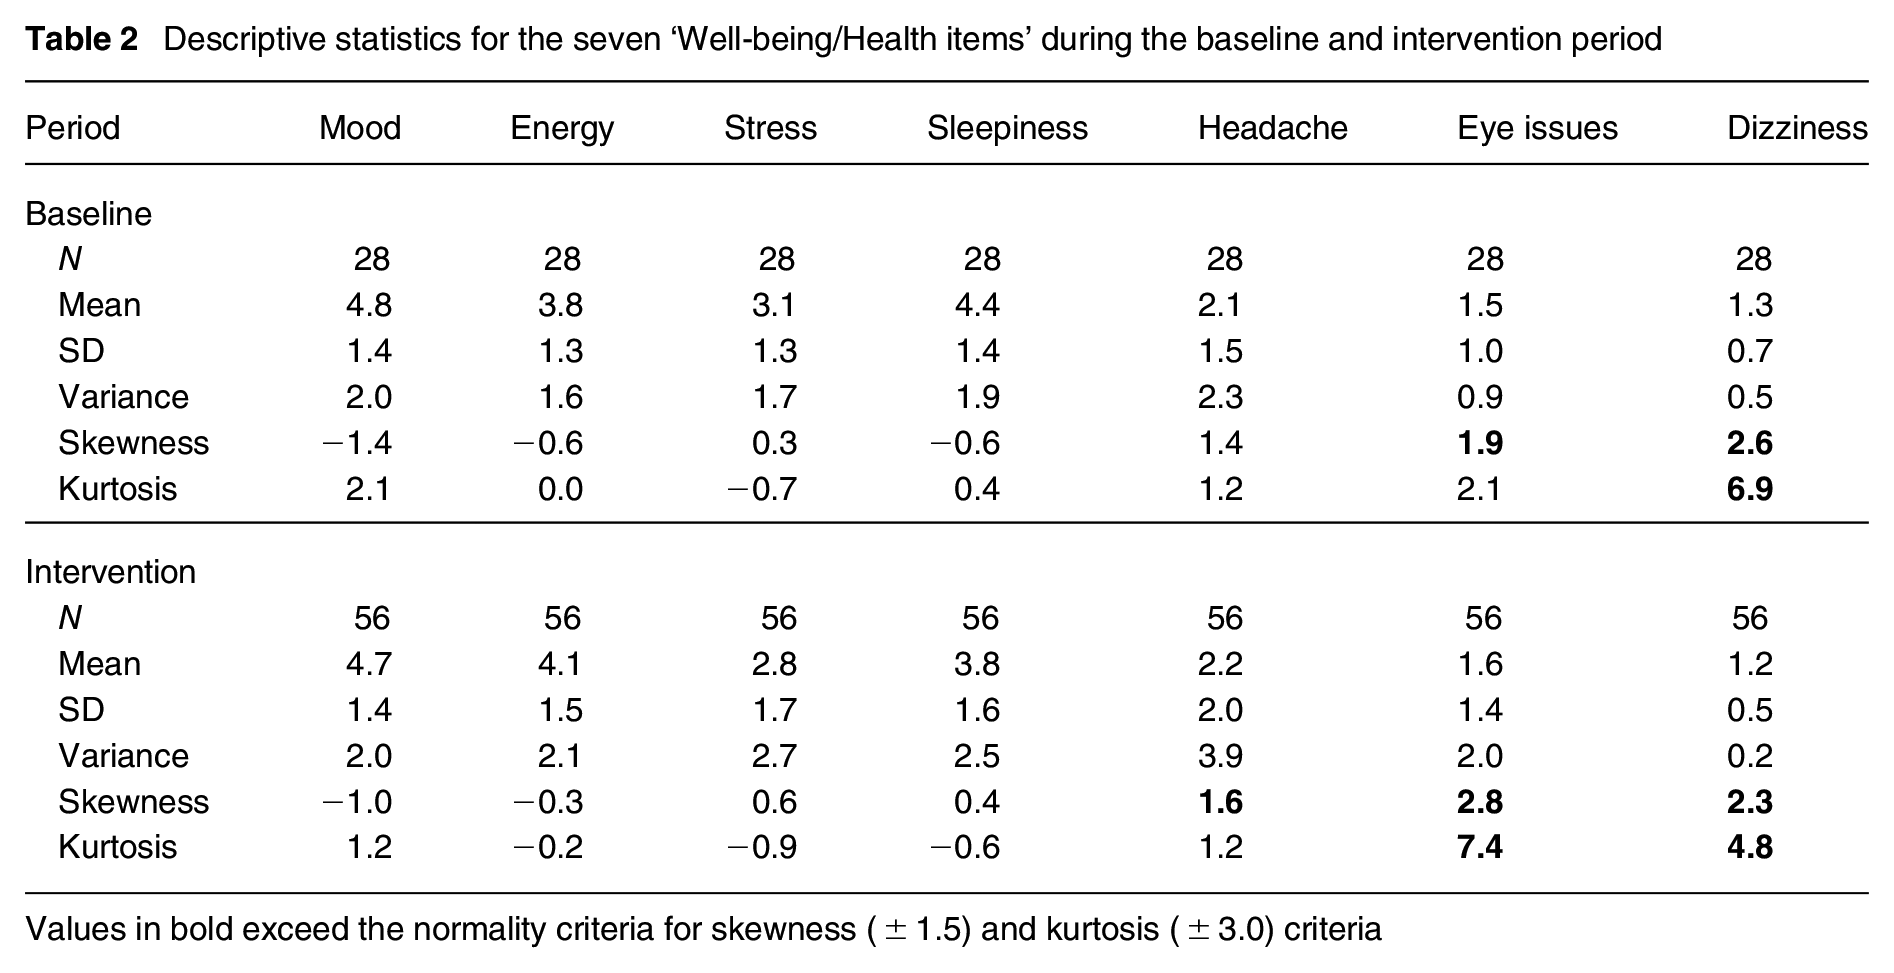
Values in bold exceed the normality criteria for skewness (±1.5) and kurtosis (±3.0) criteria
The average participant’s ‘Energy level’ and ‘Headache’ scores were higher during the intervention than baseline, and the mean scores for ‘Mood’, ‘Stress’ and ‘Sleepiness’ were lower during the intervention. Wilcoxon signed-ranks tests indicated that only the ‘Intervention sleepiness’ (mean rank = 7.6) was rated marginally more positively than the ‘Baseline sleepiness’ (mean rank = 7.3), Z = −1.9, p = 0.05 (exact sig. two-tailed), p = 0.03 (exact sig. one-tailed). For this variable, there were more (N = 11) negative ranks (Intervention sleepiness < Baseline sleepiness) than positive (N = 3). For all other variables, negative and positive ranks were rather balanced. See Table 3 for the results of five well-being/health variables. None of the variables showed a significant difference in the comparison between the baseline and intervention period.
Wilcoxon signed-ranks test results for five ‘Well-being/Health items’ comparing the baseline (Base.) and intervention (Intv.) period
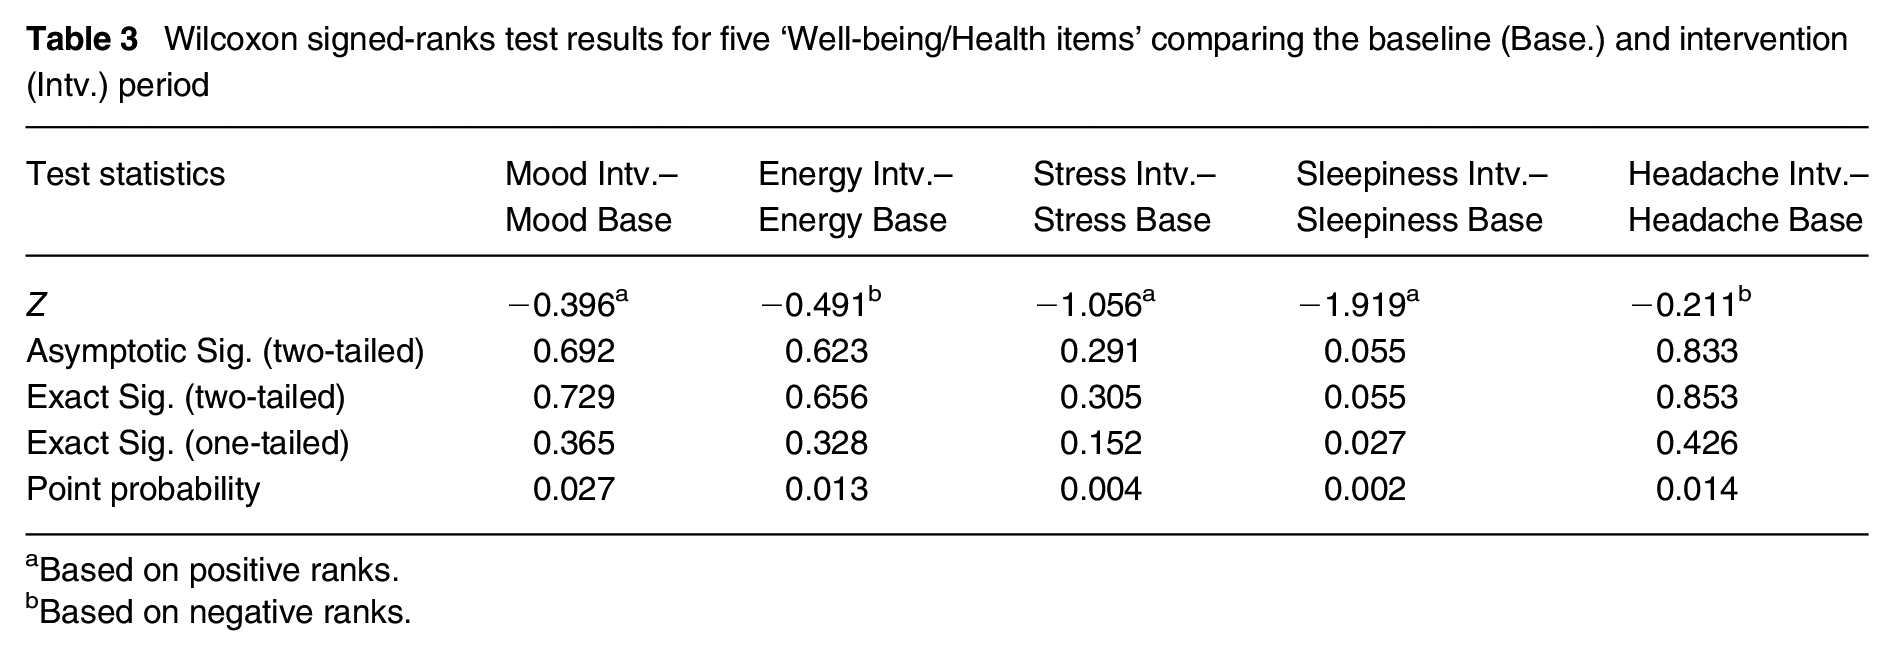
Based on positive ranks.
Based on negative ranks.
Data were visually inspected for changes over time (two weeks baseline, four weeks intervention). Figure 3 shows an example of the items ‘Mood’ and ‘Sleepiness’. The average participant’s ‘Mood’ seems to hover over time around the same value (Mrange = 4.5–5.1). ‘Sleepiness’ shows a similar mean for the baseline (M = 4.4) and subsequently a slight decrease (from M = 4.1 in week 4 to M = 3.6 in week 7).
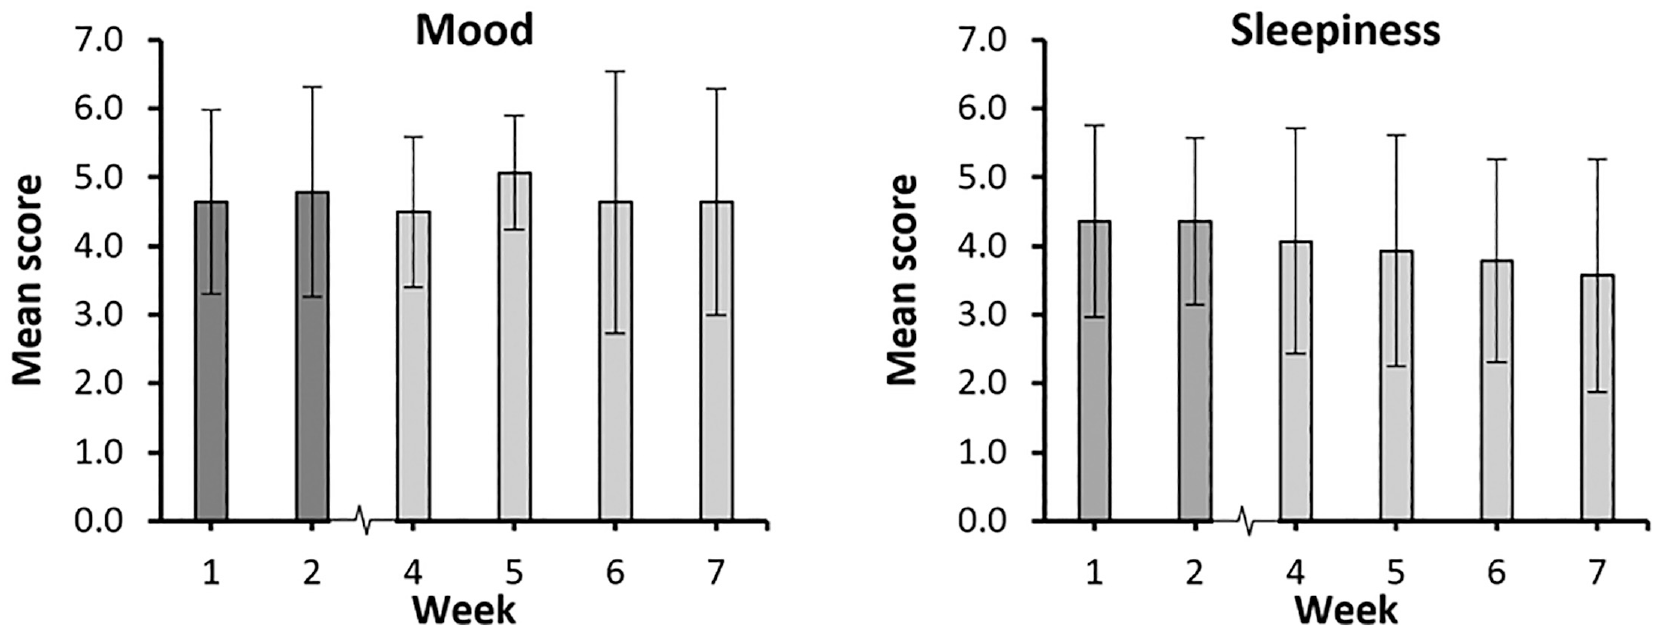
Progression of mean scores (±SD) over time (baseline weeks 1 to 2 and intervention weeks 4 to 7) for ‘Mood’ and ‘Sleepiness’ items (N = 14 participants)
3.2 Sleep performance
Results are reported for wake-up and bedtime timing, sleep efficiency and total sleep time. Unfortunately, sleep latency, an important parameter in a sleep study 50 showing the time in minutes from ‘lights out’ until a person falls asleep, could not reliably be determined.
3.2.1 Wake-up timing
The average wake-up time during the baseline period was 07.03 ± 00.45, and during the intervention, participants woke up slightly earlier (average 06.52 ± 00.40). A paired-sample t-test was conducted to evaluate the impact of the lighting intervention on residents’ wake-up timing. There was a statistically significant advance in wake-up times for Mondays from baseline (M = 6.34 ± 0.48) to intervention (M = 6.09 ±0.42), t(11) = 2.44, p = 0.03 (two-tailed). The mean advance in wake-up time was 0.25 with a 95% confidence interval ranging from 0.02 to 0.48. The eta-squared statistic (η2 = 0.35) indicated a large effect size. The result shows that people wake-up on average 25 min earlier on Mondays. Generally, average times and user group ranges are reported despite results regarding the regularity of a sleep–wake pattern, which may be more appropriate as a rationale for applying dusk/dawn lighting supporting regular sleep–wake rhythms. The baseline–intervention comparison showed that the average wake-up time range during weekdays ((a) in Figure 4) did not substantially change (38 min vs. 39 min), while the average difference (31 min vs. 24 min) in wake-up during weekend days (b) and over the entire week (121 min vs. 111 min) advanced (c), suggesting a slightly more regular wake-up timing during the intervention.
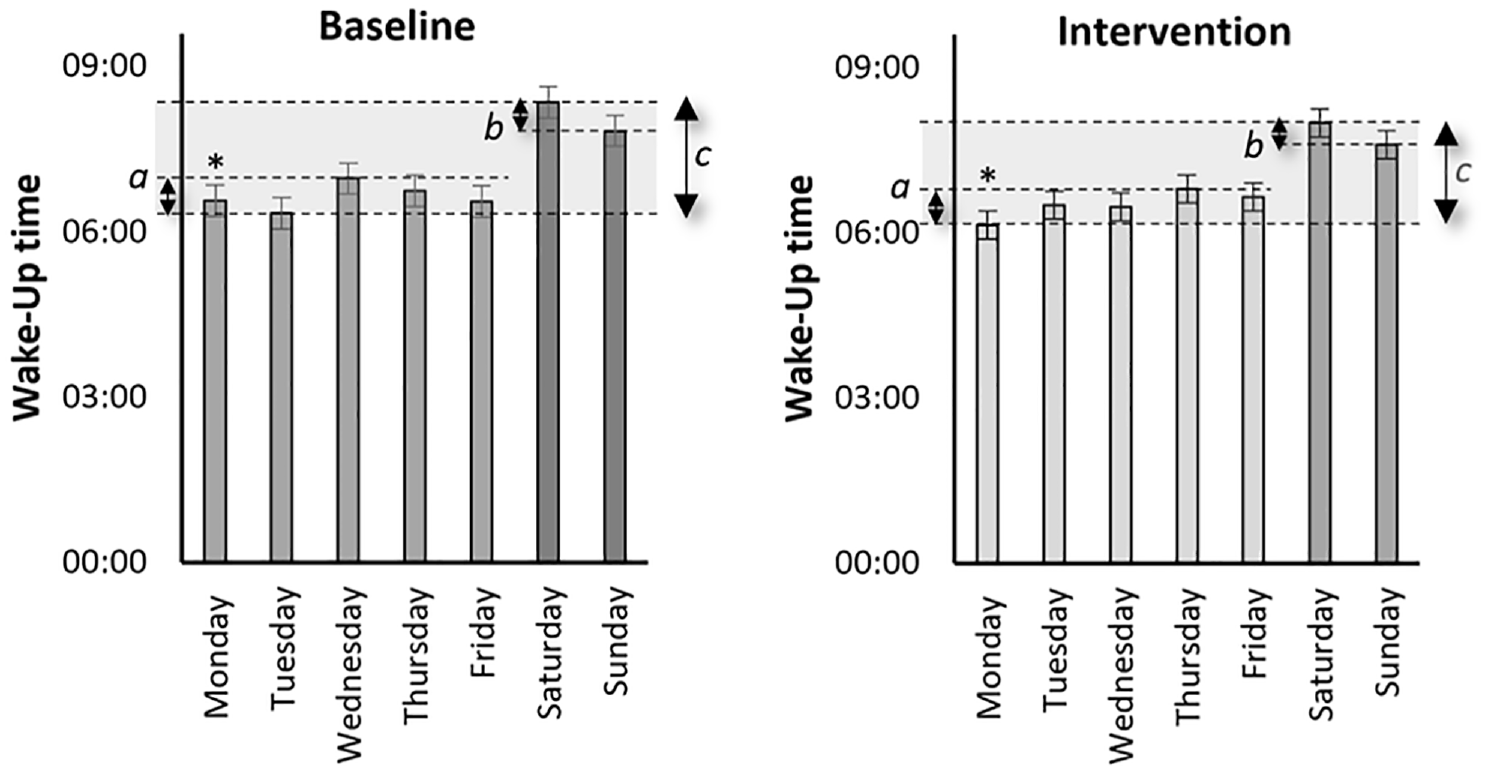
Mean ‘Wake-up time’ (± standard error) during the baseline and intervention period for each day of the week comparing average difference (a) during weekdays, (b) during weekend days and (c) during all seven days
3.2.2 Bedtime timing
The average bedtime during the baseline period was 23.02 ± 00.42. During the intervention, participants went to bed slightly earlier (average 22.55 ± 00.27). A paired-sample t-test for evaluation of the impact of the lighting intervention on residents’ bedtime scores showed no significant differences in scores for any of the days. However, the baseline–intervention comparison for average bedtime (Figure 5) showed that the range during weekdays (a) decreased substantially (124 min vs. 66 min), while the average difference (64 min vs. 62 min) in bedtime during weekend days (b) did not change. Not surprisingly, over the entire week, the bedtime range decreased (124 min vs. 74 min) (c), suggesting a more regular bedtime timing during the intervention.
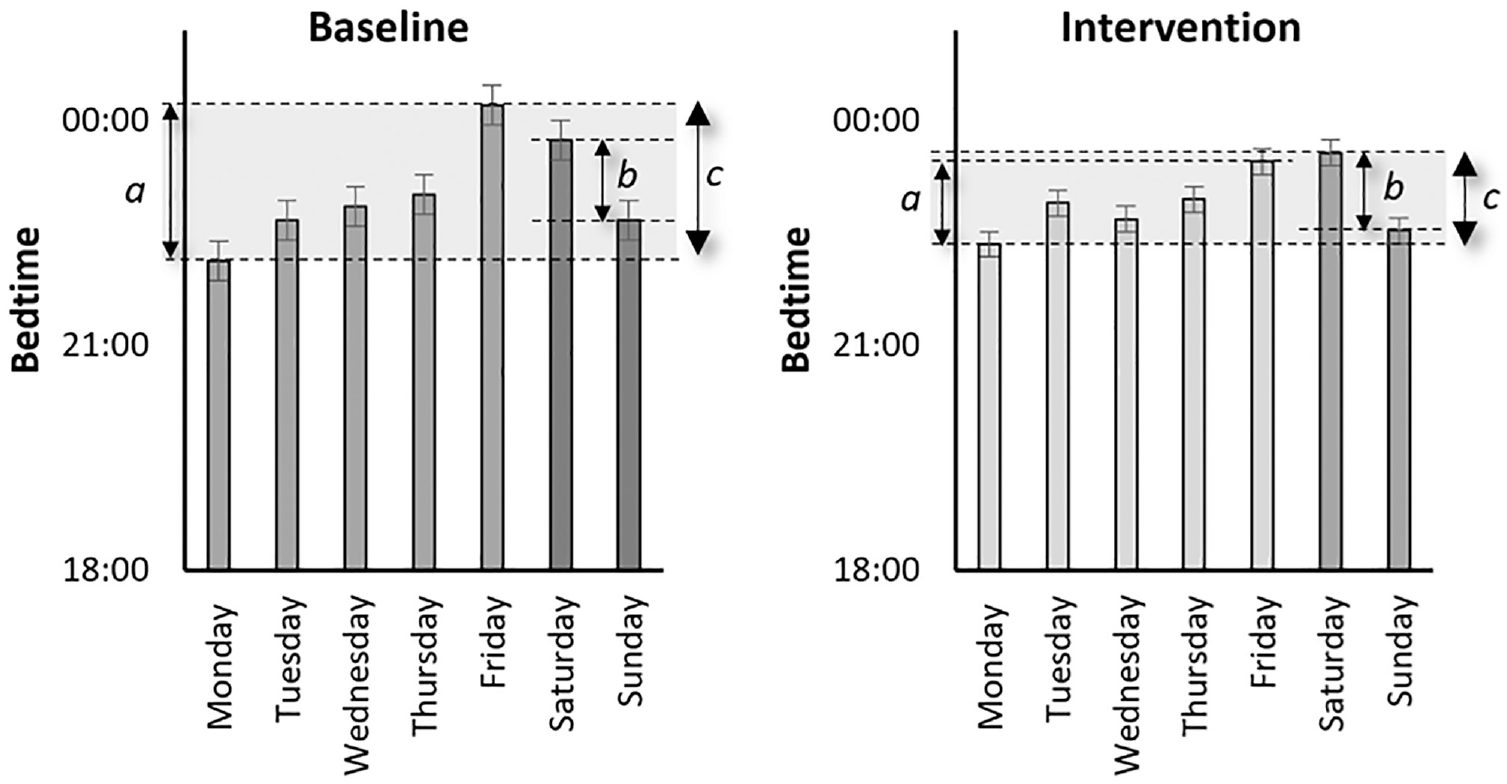
Mean ‘Bedtime’ (± standard error) during the baseline and intervention period for each day of the week comparing average difference (a) during weekdays, (b) during weekend days and (c) during all seven days
3.2.3 Sleep efficiency
The time in bed during baseline and intervention was 08.00 ± 00.02 h and 07.57 ± 00.12 h, respectively, but this may not be indicative of how well someone slept since sleep quality is related to the structure and amount of sleep cycles with its sleep stages. The average sleep efficiency during the baseline period was 87 ± 3%; during the intervention, participants slept about equally efficiently (average 87 ± 2%). A paired-sample t-test for evaluation of the impact of the lighting intervention on residents’ percentages of sleep showed no significant differences in scores for any of the days. The range was slightly more expansive for the baseline (83% to 89%, 7% difference over seven days) than the intervention (85% to 89%, 5% difference), see Figure 6.
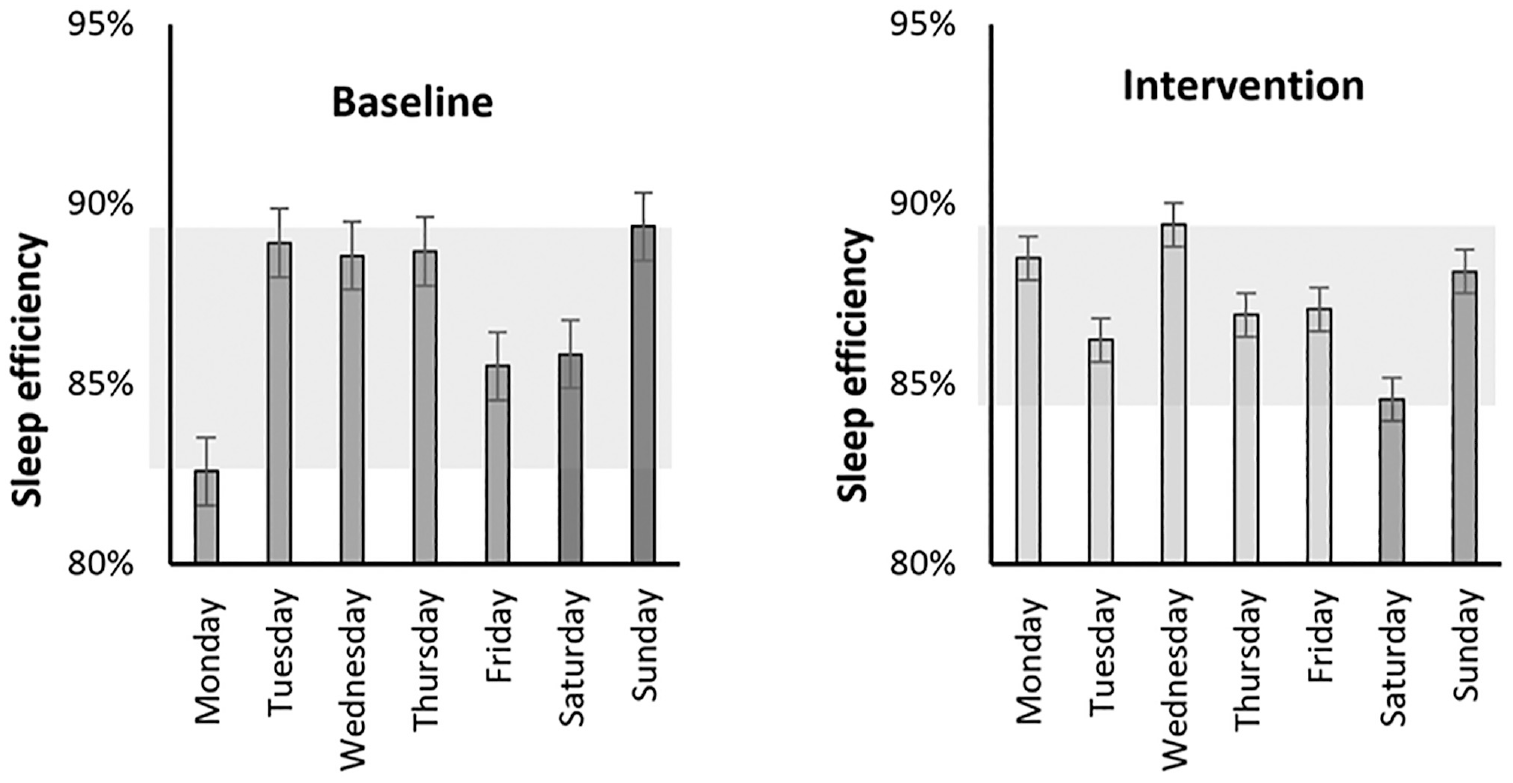
Mean ‘Sleep efficiency’ (± standard error) during the baseline and intervention period for each day of the week. The shaded area shows the sleep efficiency range
3.2.4 Total sleep time
The amount of time spent in bed is an important limiting factor for the total sleep time and, subsequently, the different cycles of sleep stages. The average total sleep time during the baseline period was 405 ± 21 min; during the intervention, participants slept about equally long (average 405 ± 18 min), see Figure 7.
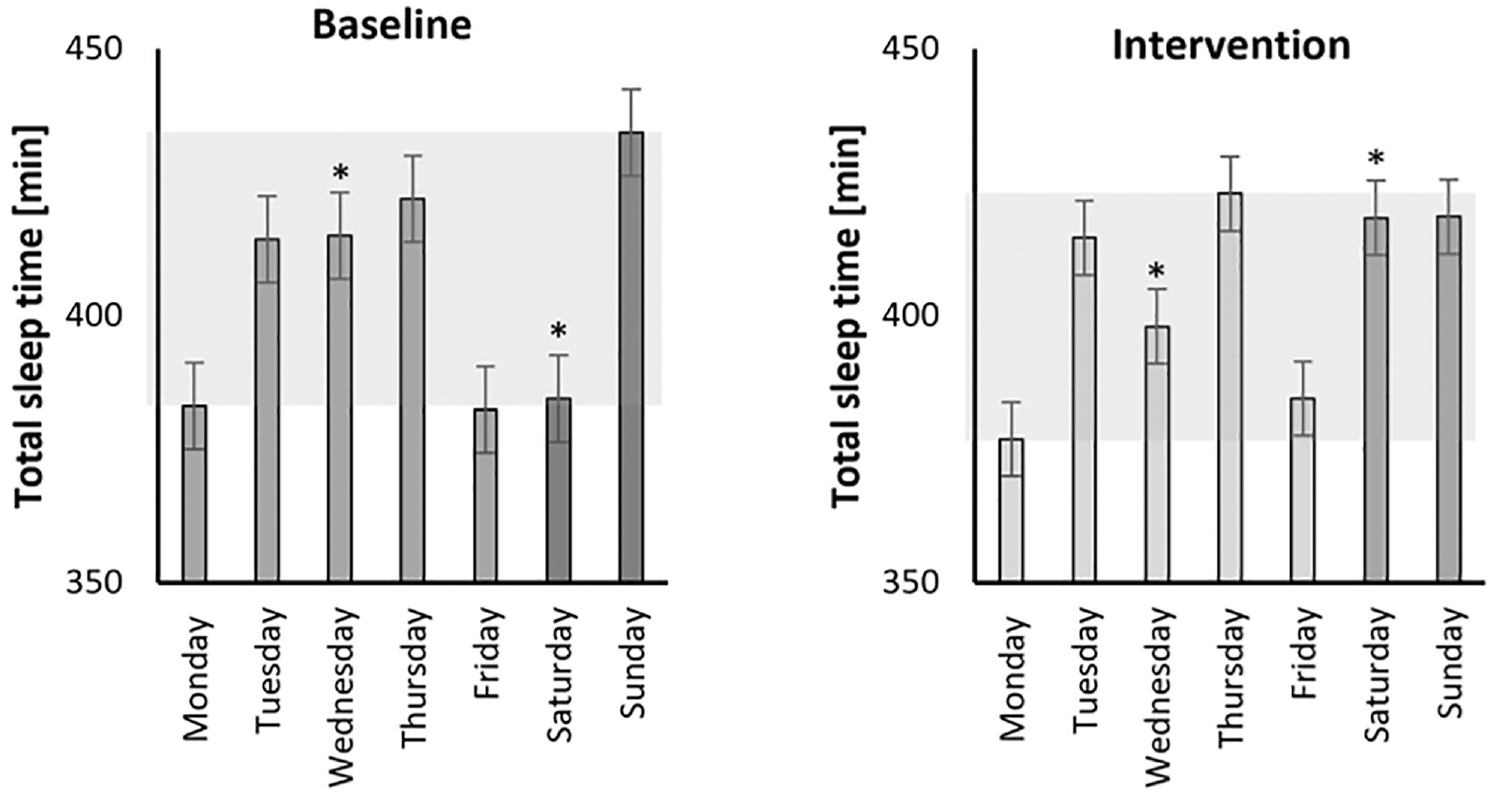
Mean ‘Total sleep time’ (± standard error) during the baseline and intervention period for each day of the week. The shaded area shows the total sleep time range
A paired-sample t-test was conducted to evaluate the effect of the lighting intervention on residents’ total sleep time. Results were significant for Wednesdays and Saturdays, albeit in opposite directions. On Wednesdays, there was a one-tailed marginally significant decrease in scores from baseline (M = 415 ± 37) to intervention (M = 398 ± 50), t(12) = 1.81, p = 0.05 (one-tailed) and p = 0.10 (two-tailed). The mean decrease in total sleep time scores was 17 min, with a 95% confidence interval ranging from −3 min to 38 min. The eta-squared statistic (η2 = 0.21) indicated a large effect size. On Saturdays, there was a one-tailed statistically significant increase in scores from baseline (M = 384 ± 98) to intervention (M = 418 ± 90), t(11) = −1.92, p = 0.04 (one-tailed). Two-tailed, the relationship was marginally significant (p = 0.08). The mean increase in total sleep time scores was 34 min, with a 95% confidence interval ranging from 73 min to −5 min. The eta-squared statistic (η2 = 0.25) indicated a large effect size. The range was slightly more expansive for the baseline (382 min − 434 min, 52 min difference over seven days) than the intervention (377 min − 423 min, 46 min difference).
3.3 Interviews
Fourteen residents were interviewed about their living experience, covering general living situations and their experiences with lighting installations, daily routines, well-being and intervention usability. Most residents, living in their apartments for one to five years, expressed optimism about their living environment. Many appreciated features like apartment size, ground floor/garden access or open kitchen/living room layouts, while some criticised the layout for lacking certain amenities or being impractical. Noise was a concern for those living downtown. Most apartments had good daylight conditions, though some experienced overheating due to prolonged sun exposure in summer.
A more extensive version of the interview results, including resident quotes, can be found in the Supplemental Materials. For 10 of the 14 apartments, the daylight situation and potential was simulated and reported elsewhere. 51
3.3.1 Luminaires and lighting
The researchers provided residents with three uplighters, most favouring the upwards-directed floor lamp for its indirect, glare-free lighting. Participants found the lighting placement effective in distributing light in the room. Some residents swapped luminaires between the kitchen and living room due to a desire for more evening light. Overall, participants showed comparable preferences for ‘warm white’ (~3000 K) lighting, favouring dimmed options, particularly in windows (Swedish people like to have luminaires in the window to account for the dark areas during the dark winter season). Reactions to additional lighting varied; six participants found it pleasant, while two disliked it. Preferences leaned towards warmer colour temperatures and dimmer light levels, although some acknowledged it was the correct colour temperature despite a lack of liveliness.
3.3.2 Lighting scenarios and routines
The morning routine, particularly with the bedroom and kitchen lights, significantly impacted participants. Many woke up peacefully, avoiding the stress of an alarm clock. This positive effect continued throughout the day, leading to better breakfast routines, work preparation, increased endurance for stress, improved focus and a calmer demeanour.
Dawn simulation: Participants generally responded positively to the dawn simulation wake-up routine, citing benefits such as smoother and earlier awakening, increased motivation and improved morning routines. Most found the kitchen dawn simulation satisfactory, facilitating faster preparation and a happier mood. However, some participants found the lights unnecessary, too bright, or disruptive to their routine. Despite differences in opinion, many found the nearly one-hour simulation sufficient, even on weekends, although some still relied on alarm clocks for reassurance.
Work reminder: The kitchen dawn simulation served as a reminder to ‘Go to work’, with seven participants recognising the instant turning off lights. However, five participants either did not notice or did not grasp its significance. Only one suggested using coloured (red) lights as a reminder, while others felt they did not need one.
Dusk simulation: Some participants found the dusk simulation lighting too intense for their evening activities and preferred dimmer conditions. However, others appreciated the calming effect of the dimming, referring to it as a natural sunset. Five participants expressed the need for higher light levels in the kitchen for evening meal preparation. Regarding the evening schedule, many preferred the lights to start upon returning home rather than several hours before bedtime. For many participants, the ‘Go to sleep’ light served as a helpful bedtime reminder, making it easier to maintain a consistent sleep schedule. However, a few residents felt sleepier than before, and some went to bed before the lights turned off due to fatigue or changes in routine. Additionally, the lighting scenario sometimes conflicted with tasks requiring more light, leading participants to use their own lights.
3.3.3 Well-being and health
Participants reported positive wake-up experiences, with some noting specific preferences regarding light intensity. For instance, one participant prefers immediate full brightness to combat morning lethargy, while another is sensitive to light and found gradual increases before wake-up excessive. The lighting aided morning routines and influenced stress levels and daytime motivation. Some participants reported increased focus and calmness at work. Half of the participants felt sleepier or more relaxed in the evening due to the implemented lighting, finding the bedtime reminder helpful; the other half noticed no difference. While a few felt calmer in the evening due to gradual dimming, others found the bright light levels disruptive to sleep. However, some participants were unaffected by light and preferred flexible sleep patterns.
3.3.4 Usability and acceptance
The study investigated the usability of lighting systems, considering factors such as ease of use and specific user needs. While lighting systems are typically designed with specific users in mind, residents in this study were not expected to interact actively with the system. Expectations varied among participants, with some hoping for improved sleep quality, efficient routines and the impact of dark seasons on their day-night cycle.
Personal lighting needs: Residents’ personal lighting needs and behaviour varied significantly. For instance, some participants reported feeling tired in the evening regardless of daytime activities, while others identified themselves as ‘night owls’, staying up late and being more active in the evening. Additionally, some individuals found waking up in the morning challenging, preferring immediate full brightness to combat morning fatigue. Sensitivity to light also differed among participants, with some experiencing headaches and eye strain in darkness, while others were sensitive to excessive light exposure, finding gradual increases before wake-up excessive.
Acceptance: Participants showed high acceptance of the lighting system, provided they could have more control over it post-study and make personal adjustments. Many found the pre-set automation eye-opening, realising that increased or brighter light could lead to a smoother wake-up. A majority expressed intent to continue using programmed lights, particularly to establish a good morning routine. Some recommended controlled lighting, especially for bedrooms, while others preferred manual control. However, some participants had concerns about who should oversee the lighting adjustments for optimal sleep quality. Occasionally, participants felt frustrated when lacking control over the lighting, especially when wanting to sleep longer due to illness. Despite being provided with a remote control – intended for exceptional circumstances – they rarely used it.
Resident-suggested future recommendations: Participants recommended expanding the lighting control beyond light level adjustments. They suggested changing colour temperature and applying specific conditions based on room and weather situations. For instance, residents proposed higher colour temperatures and brighter light levels on darker days, especially in the morning and in areas like the bedroom and kitchen. Conversely, lower colour temperatures and dimmer light levels were recommended for activities like watching TV or in the evening. Some even suggested using cooler white light for cleaning moments.
Regarding the dusk simulation, participants suggested a slower increase in light level at the start and advocated for the lights to stay at maximum brightness for a brief period before dimming gradually. Additionally, there were differing opinions on light levels during dark winter days, with some preferring extra light to combat contrast and others wanting less. Overall, participants recommended starting the dusk simulation earlier, advocating for the lights to turn on as soon as they arrived home.
4. Discussion
Overall, the pilot field study in residential settings investigated the effects of an enhanced lighting control schedule on sleep quality and well-being. Additionally, it explored the usability and acceptance of the applied system. The empirical knowledge that this study generated contributes to a more detailed insight into how dawn and dusk light simulation scenarios work. The novelty of the investigation was to let pre-controlled lighting guide and assist people in an unobtrusive and comfortable light exposure scenario. The investigation included sleep data, subjective assessments of five health/well-being-related variables, and reflections on the lighting systems’ performance and acceptability in real-life situations.
The invention of electric lighting has enabled exposure to high light levels 24/7, which may harm sleep quality and duration. On the other hand, pre-programmed lighting control systems for dusk/dawn simulation can positively affect humans (e.g. Dong and Zhang, 37 Danilenko and Hommes 40 ). The potential of this type of lighting control has been underexplored in the residential area, where people often spend the time when lighting has the most pronounced effects on circadian functioning (i.e. early morning and late evening) at home. Photoentrainment is necessary for maintaining and improving human health and well-being.17,18 Dimming strategies to positively influence user experience are tested in non-residential environments (e.g. Chraibi et al., 52 Gentile 53 ), but only limited in a residential setting (e.g. Hafezparast-Moadab et al., 4 Andersen et al. 54 ).
Objectively gathered sleep data suggested a (slightly) more regular wake-up and bedtime timing during the light intervention compared to the baseline condition in a real-time field application, which was – to our knowledge – not documented in the literature before. Sleep efficiency and total sleep time seem not to have suffered negatively from marginally shifting sleep schedules. Sleep quality is related to the structure and amount of sleep cycles with its sleep stages, and a longer sleep duration may not always mean better sleep; it can be the need for an additional sleep cycle as well. Where previous research has shown positive and significant relationships between (outdoor) light exposure, sleep, mood, stress or energy levels (e.g. Danilenko and Hommes, 40 Burns et al., 55 Bohmer et al. 56 ), there was no significant difference between the baseline and intervention periods in this study’s subjectively assessed well-being/health aspect inquiry. Combining the objective and subjective data suggests that it may have been the timing rather than the quality of sleep that may have been affected by a controlled light strategy. Regular sleep timing positively affects health and well-being, 57 but the shift found is rather subtle, the study duration was relatively short, and (day)light exposure is unknown.
Having a controlling lighting system that nurtures good sleep hygiene may affect not only sleep but also several aspects of both mental and physical health. The average wake-up time during the intervention period was 11 min earlier and, according to the feedback during the interviews, exactly the difference between going through an entire morning routine or not. Starting with having a proper morning breakfast, doing some exercises or having a relaxed preparation before work can indirectly contribute to well-being/health improvement (e.g. Rampersaud, 58 Ruegsegger and Booth 59 ).
The dusk simulation had two purposes: to gradually get the people to feel sleepier and to help them establish a reoccurring time for sleeping. Dimming light in the evening is intended to prepare the body for a period of rest, and only half the participants were affected. Differences in chronotypes 60 or levels of evening activity between the participants can be reasons for this difference. There is a huge difference in the amount of sleep between individuals and it changes as humans age. 61 Most participants experienced the dusk simulation as a reminder to go to bed; making it clearer, easier and more consistent to keep the same bedtime. A consistent rhythm can help to get better-quality sleep in the long run. However, not all participants were entirely satisfied with the experienced light characteristics (too bright, too ‘white’) and the level of control. In the Scandinavian culture, warm candlelights or lamps in the window opening of ~3000 K are commonly used in the evening hours. 34 Variations in light sensitivity 62 or correlated colour temperature preferences 63 between the participants can be reasons for this difference.
In a field study, implementing and testing lighting control scenarios in home environments, various intentional customisation and personalisation decisions are to be expected. 64 Implementing a twilight simulation in real-life implies more personalisation for the dusk compared to the dawn simulation. The morning ritual is probably primarily determined by social restrictions, while people have more freedom and hence more lighting demands in the evening related to, that is, their chronotype, preferences or evening activities.
Studies in non-residential environments have shown that dimming with a fading time of at least two seconds was experienced as acceptable by more than 70% of the participants (e.g. Chraibi et al. 52 ). The gradual increase during the dawn simulation and the two-step dimming down during the dusk simulation were appreciated by many participants with regard to their personal preferences. The sudden turn-off during the ‘going to work’ scenario was not valued. The turn-off was either too abrupt, consistent with the non-residential experiences, or the reminder was unnecessary (i.e. due to flexible work times or family members still at home).
Overall, enhanced lighting control scenarios, including their usability and acceptance, were investigated in the seven-week pilot field study, and generally positive outcomes were obtained that can guide the methodology of a larger-scale and/or more comprehensive field study. The acceptance rate and the number of participants who will continue using the controlled lighting system were very high.
4.1 Limitations
Even though the results may be relevant for real-time field applications of lighting control, several limitations of the pilot study conditions need to be considered. Firstly, the field study was executed as a pilot study with a pre-selected and small group of Swedish residents in one/two-bedroom apartments in winter, including data analysis from 13 apartments and 14 participants. Results may differ if a different population or residential environment is investigated. For example, a household with a wider variety of bedtimes (adults and children), a home organisation with multiple floor levels or a location with fewer dark twilight periods would likely lead to different effects and usability. Besides, the study duration was limited to only seven weeks, including a baseline condition and (a transition to) a period with controlled lighting. Some residents did not sleep at home during all nights of the study, which led to data loss. It would plea for an even longer study duration, which would cause other challenges regarding longer daylight periods or daylight-saving time changes.
Nevertheless, the pilot study included qualitative and quantitative parts testing multiple instruments (e.g. actigraphy, weekly questionnaires, interviews), and the combination of methods was realistic, workable and necessary. Participants were recruited using a database from a large housing company, and initially, over 75 people expressed their interest in participating in the study. The fact that participants were allowed to keep the tested products after the study positively influenced recruitment. A list of predetermined in-/exclusion criteria made the selection of the 15 participants practical and manageable and would certainly work for a field study with a larger sample size.
Secondly, it is not easy to control conditions in field studies, and researchers may have to accept (and report) adjustments due to events happening in everyday life. Despite the restriction in home type and residents, the apartments had different layouts and furnishing, and residents had different wake-up/bedtime preferences, all affecting outcomes. Sleep tracker results showed later and more wide-ranged wake-up and bedtimes than assumed. As expected, the apartments’ different floorplans challenged comparable light exposure. Unexpectedly, several participants requested to have dawn simulation only on weekdays, and some reported sleeping elsewhere on Fridays and Saturdays. Everybody experienced a full dawn simulation, but some people left home soon after wake-up, calling for lighting control customisation. (Un)intentional customisation and personalisation experienced during the study’s planning, implementation and analysis are documented and discussed in Aries et al. 64
Thirdly, light-related confounding factors were not measured continuously and could not be reported. A laboratory comparison of estimated light levels was performed to indicate the light characteristics range. It is unknown how much and how long the participants were exposed to the intervention lighting, how the interaction was with existing light sources in the apartment, and what the residents’ daylight exposure was during the day, nor how often they went outdoors. The day length increased slowly during the chosen study period. The earliest sunrise (07.08 on 25th February) was after nearly everyone woke up, and the latest sunset (17.25 on 10th January) was long before all participants went to bed; hence, there was minimal to no interference by daylight. Curtains in the bedroom or living room could screen incoming daylight, but curtain type and use were not tracked.
4.2 Future research
Research findings highlighted in this work are drawn from a pilot study with a limited sample and duration. Despite the duration of this study being longer than previous studies, future research should include an even longer basic tracking of sleep quality (over months rather than weeks) and include a full actigraphy of repeated measures (at least four weeks) during a second winter season. For improved dose–response control, advanced sleep tracking should include an ecological momentary assessment of ‘sleepiness’ at multiple time points across the day. Sleepiness in the morning is considered a negative outcome, whereas sleepiness in the evening is usually positive. Besides, tracking spectral power distribution values should give insight into the light exposure over the entire day, including the moments at home with dusk/dawn simulation and during nighttime sleep periods (mEDI = max. 1 lx). 16 It may be done during the periods with full actigraphy recording with daylight and electric light measurements in the home and using ambulatory monitoring, but only after reliable wearable spectral tracking devices become available.
The pilot study’s results initiated a debate on whether chronotype differences, light sensitivity variations or correlated colour temperature preferences between the participants can explain differences in outcome. Future studies should include the determination of the participants’ chronotypes, light quality preferences and light sensitivity levels. Alternative future studies can include whether dusk/dawn lighting should be weather-dependent and/or if it should be extended to become a full dynamic system with settings/control scenarios specific for certain tasks (i.e. cleaning, TV-watching) or responding to variable occupancy.
5. Conclusions
The baseline–intervention comparison showed that the objectively tracked average wake-up and bedtime range over the entire week decreased, suggesting a (slightly) more regular wake-up and bedtime timing during the light intervention, which can positively affect health and well-being. Sleep efficiency and total sleep time did not show significant differences with or without controlled lighting. Self-reported health/well-being items did not vary much over the entire study period.
Subjective responses emphasised that the dawn simulation, using bedroom and kitchen lights, had the most noticeable effect as the majority woke up very calmly and peacefully and had more time for morning activities. Even though the dusk simulation was a reminder to go to bed as the dimming down made it clearer and easier to keep a more consistent bedtime, six participants mentioned that the scenario was too bright for the evening.
In this study, the participants were not supposed to interact actively with the system, and their different personal sleep/wake routines were incorporated into the lighting control scenarios. The satisfaction and acceptance of the lighting control were very high, provided the resident would have more control over the lights.
Supplemental Material
sj-docx-1-lrt-10.1177_14771535241287075 – Supplemental material for Application of pre-programmed lighting control scenarios: A mixed-methods pilot study in Swedish residential environments
Supplemental material, sj-docx-1-lrt-10.1177_14771535241287075 for Application of pre-programmed lighting control scenarios: A mixed-methods pilot study in Swedish residential environments by MBC Aries, A Tabbah and G Fischl in Lighting Research & Technology
Supplemental Material
sj-xlsx-2-lrt-10.1177_14771535241287075 – Supplemental material for Application of pre-programmed lighting control scenarios: A mixed-methods pilot study in Swedish residential environments
Supplemental material, sj-xlsx-2-lrt-10.1177_14771535241287075 for Application of pre-programmed lighting control scenarios: A mixed-methods pilot study in Swedish residential environments by MBC Aries, A Tabbah and G Fischl in Lighting Research & Technology
Footnotes
Acknowledgements
The authors would like to thank the participants in the field study for their input, feedback and efforts in facilitating this project. They would like to acknowledge the pleasant and valuable contribution of the facility manager of the real estate company Willhem AB, Mr. Mikael Hyltse and the collaboration with Jönköping Energi. Additionally, they also want to thank Dr. Femke Beute for her assistance during the initial setup of the study. Finally, the authors are grateful for the help of Mr. Stephen McCulloch in programming the communication software, and Ms. Alzoul and Mr. Mikael Pettersson for their help during the preparation and installation of the lighting systems.
Declaration of conflicting interests
The authors declared no potential conflicts of interest with respect to the research, authorship, and/or publication of this paper.
Funding
The authors disclosed receipt of the following financial support for the research, authorship, and/or publication of this article: The SMILE (SMart Illumination in Living Environments) project is funded by the Swedish Energy Agency (project P45185).
Supplemental material
Supplemental material for this article is available online.
References
Supplementary Material
Please find the following supplemental material available below.
For Open Access articles published under a Creative Commons License, all supplemental material carries the same license as the article it is associated with.
For non-Open Access articles published, all supplemental material carries a non-exclusive license, and permission requests for re-use of supplemental material or any part of supplemental material shall be sent directly to the copyright owner as specified in the copyright notice associated with the article.