
Abstract
Good lighting is one of the most important comfort factors in residential buildings. In creating a comfortable and restorative living space, the effects of light, both visual and effects beyond vision, play a crucial role. Daylight is considered an essential factor for indoor environments, which can benefit occupants’ health as well as lower energy use. This study investigated the potential daylight exposure for 10 apartments in Sweden, using metrics to quantify both visual effects and effects beyond vision and to understand the relationship between the light situation in the apartments and well-being metrics collected from occupants during a field study. Computational modelling of daylight conditions for visual effects and effects beyond vision was performed. Statistical analysis was utilised to investigate the possible relationship between the apartments’ daylight potential and the self-reported well-being of the occupants. The results show variations of light exposure for apartments in different seasons. Furthermore, possible relationships between well-being metrics and daylight exposure changes were observed despite being possibly influenced by seasonal light level contrasts.
1. Introduction
It is hard to imagine a world without light. Light affects human life in many ways, whether provided naturally through daylight or artificially created by electric lighting. Several investigations have shown that human physical and psychological health is affected by the lighting conditions in their living environment.1–4 Optimal lighting can, for example, have positive effects on sleep patterns and the body’s circadian system, 1 induce the feeling of happiness or sadness 2 or enhance the antibody response to vaccination. 4 With the Sun being the most crucial energy source for the Earth, daylight has always been a deciding factor for indoor lighting design. 5 However, not all living environments have access to (good) daylight year-round. With the number of buildings rising, cities become denser and reduce access to natural lighting in many areas.6,7 Due to inequality in daylight access, understanding the potential effect on the mental state and social behaviour of people living in dark or light apartments is essential.
Humans need light to see, perceive and understand their surroundings. Light’s amount, timing, spectral composition, direction and duration affect the circadian rhythm, alertness and mood, known as the effects beyond vision.8–10 The human eye has three photoreceptors: cones, rods and intrinsically photosensitive retinal ganglion cells (ipRGCs). While rods and cones regulate vision, ipRGCs link to the suprachiasmatic nucleus (SCN), the body’s master clock, mediating effects beyond vision. 11 IpRGCs help orchestrate circadian rhythms of various physiological processes. Daily rhythms in sleep, physiology, core body temperature and hormonal secretion follow a nearly 24-h cycle. The intrinsic period is genetically determined, and for most humans, the clock will run slightly longer than 24 h. 12 The circadian clock’s intrinsic period is genetically determined, slightly longer than 24 h for most humans. Humans must daily (re)set their circadian clocks to stay synchronised with the Earth’s 24-h rotation, using external cues. Without environmental cues, like low light exposure and no alarm clocks, the biological clock runs freely, leading to a disturbed sleep rhythm. Light is the most essential ‘zeitgeber’ for clock synchronisation. 13
Sleep is one of the most apparent manifestations of the human circadian rhythm. The biological clock’s functioning depends on several variables: light exposure duration, timing, direction and spectral power distribution (SPD). 14 All photoreceptors have different spectral sensitivity, with ipRGCs peaking at 480 nm, making short wavelengths most effective on the sleep–wake system and circadian phase-shifting.15,16 Melatonin, secreted during darkness, indicates a person’s circadian phase. 17 The light transition at dusk and dawn (twilight) affects melatonin synthesis in the body, suppressing melatonin production during the dawn and promoting production during the evening and at night (dusk). During dusk, melatonin levels regulate blood pressure and metabolism, inducing a relaxing state for the body to get ready for sleep. 18 Electric lighting, though weaker than daylight, can be an acceptable replacement,5,14 enhancing indoor illumination when natural light is insufficient.19,20 Natural light offers full-spectrum energy without flicker and is uncontrollable, affected by weather. Electric lighting can have limited SPD, exhibit flicker, but is highly controllable in placement, intensity and colour temperature. 5
Indoor lighting and its effects on people have been well investigated, but studies covering the daylight situation indoors seem to focus more on the occupants’ visual and thermal comfort than on daylight’s effects beyond vision. Concepts, such as glare,21,22 thermal comfort 23 and ways to avoid them, 24 are well investigated. Meanwhile, there are limited studies around human health and effects beyond vision in different daylight situations and/or using novel tunable electric lighting that allows for customisable, scheduled and controlled lighting. Furthermore, studies investigating integrative lighting, combining visual and beyond-vision effects, have been focusing mainly on public environments such as offices, 25 schools26,27 and hospitals.28,29 Interestingly, as previously mentioned, a crucial time for entraining the master clock in the SCN is during twilight (dusk and dawn) when people spend their time at home most days of the year. Many people spend one-third of their time in their homes, 30 which has increased after the COVID-19 pandemic. 31 An international survey of 500 participants in 2020 showed that only 8% of those surveyed spent less than three hours at their residential space, more than half (53%) spent three to eight hours at home and 39% spent more than eight hours. 32 Of the time spent in the residential environment, most time is associated with sleeping, working (especially after the pandemic) and relaxing, making this environment and its (day)lighting conditions critical in regulating the body’s circadian rhythm and phases.
However, with daylight exposure varying with weather conditions, seasonal changes and the apartment’s location, the quantity and quality of daylight entering residents’ eyes will affect them differently based on, for example, the time and duration of exposure. Adamsson et al. 33 found that the mood of their Swedish participants varied with different seasons, and they became more energetic and alert in summer while experiencing lower mood levels during the winter and spring. In such a situation, technological advancements such as a pre-programmed electric lighting system can support a resident in receiving the preferred light exposure throughout the year. Furthermore, new metrics, such as the Circadian Stimulus 34 or the melanopic Equivalent Daylight Illuminance (m-EDI) 35 and software, such as adaptive lighting for alertness (ALFA) 36 and Lark Spectral Lighting 37 have been introduced to simulate and analyse light exposure and (day)lighting conditions and potential effects on the human circadian system. It enables a more precise replication and planning of a real-life situation while considering the effects beyond vision.38,39
Therefore, this study aims to investigate different apartments’ yearly daylight exposure potential and the correlation with the occupants’ self-reported psychological health evaluations (during the winter season). This study is a part of the SMart Illumination in Living Environment (SMILE) project investigating the effects of controlled dusk/dawn lighting on health and well-being. 40 The data were collected in 14 Swedish apartments for eight weeks in winter (when daylight hours are limited in Sweden), with participants filling out a weekly survey about their experience of the lighting system, health and stress levels. The daylight situation in 10 apartments is investigated using 3D modelling and daylighting simulation software considering a standardised weather file for the site. Understanding of the yearly daylight situation in terms of daylight potential (i.e. low/high daylight provision) is analysed in combination with pre-collected participants’ well-being self-assessment in the SMILE project.
2. Method
A quantitative computational modelling approach was chosen, which included the simulation of daylight conditions for visual effects and effects beyond vision. The daylight potential for apartments refers to high or low daylight provision for satisfying the lighting requirements at different times from the primary perspective of integrative human psychological and physiological needs. Statistical analysis investigated the possible relationship between daylight potential and the occupants’ self-assessed well-being.
2.1 Self-assessed well-being
The data related to self-assessed well-being were collected on a weekly base in existing apartments for eight weeks during winter (January to March 2022) as part of the SMILE study. 41 In the SMILE study, data from 13 apartments and 14 participants were included in the analysis (one apartment had two participants, two participants dropped out). The first two weeks were collected when the participants had their regular lighting, and during weeks 3 to 8, additional pre-controlled electric lighting was present in the apartments. The additional lighting was programmed to affect the residents during twilight by dimming up (30 min, bedroom, wake up) and dimming down (3 h, living room, bedtime). Participants received an online questionnaire at the end of each week to report their experiences and well-being with reflecting on the previous week. The questionnaire included the following questions regarding well-being: (1) How did you feel – in general – this week regarding ‘Mood’ [Sad 1 to 7 Happy], ‘Energy’ [Tired 1 to 7 Energetic], ‘Stress level’ [Not at all 1 to 7 Very much] and ‘Sleepiness level’ [Not at all 1 to 7 Very much]; (2) Have you experienced ‘Headache/migraine’ [Not at all 1 to 7 Very much], ‘Eye problems’ [Not at all 1 to 7 Very much] and ‘Dizziness’ [Not at all 1 to 7 Very much]; (3) Were there days you did not sleep at home this week? [Monday, Tuesday, Wednesday, Thursday, Friday, Saturday, Sunday]. The data for days the participants did not sleep at home were removed from the analysis. The Swedish Ethical Review Authority approved the collection of all data (reference number: 2021-03873), and written consent was obtained from all participants.
2.2 Settings and model creation
Ten apartments located in Jönköping, Sweden (57°46′N, 14°09′E) were examined to determine whether they had a ‘high’ or ‘low’ daylight potential. The apartment layouts are shown in Supplemental Material. Current furniture placement is known but not modelled in the simulations because of its considerable impact on simulation time. Some apartments were in the same street, building or area; hence, the apartments were clustered, naming them locations A to D. The remaining three apartments from the SMILE study were not included for time-restricting reasons as they were solely located at three different locations and had a very deviating layout.
The following software was used: Revit 2023 and Dynamo 2.13.1.3887 (Autodesk, Inc., San Francisco, CA, USA), ArcGIS pro 2.9.0 (Esri, Redlands, CA, USA) were used for the model creation. Rhinoceros 7 and Grasshopper 1.0.0007 (McNeill & Associates, Seattle, WA, USA), ClimateStudio version 1.9 (Solemma LLC, Cambridge, MA, USA), Lark Spectral Lighting 2.0.0 (M. Inanici, ZGF Architects LLP, M. Gkaintatzi-Masouti and C. Pierson, Seattle WA, USA; Fall River MA, USA), Honeybee 0.0.66 and Ladybug 0.0.69 (Ladybug Tools LLC, Fairfax, VA, USA) were used for lighting simulations. Lastly, Excel version 2301 (Microsoft Corp., Redmond, WA, USA) and SigmaPlot 15.0 (Systat Software Inc., Chicago, IL, USA) were used for data organisation and statistical analyses. The overall process is shown in Figure 1, including model creation, general and task-specific light simulations, and statistical analysis.
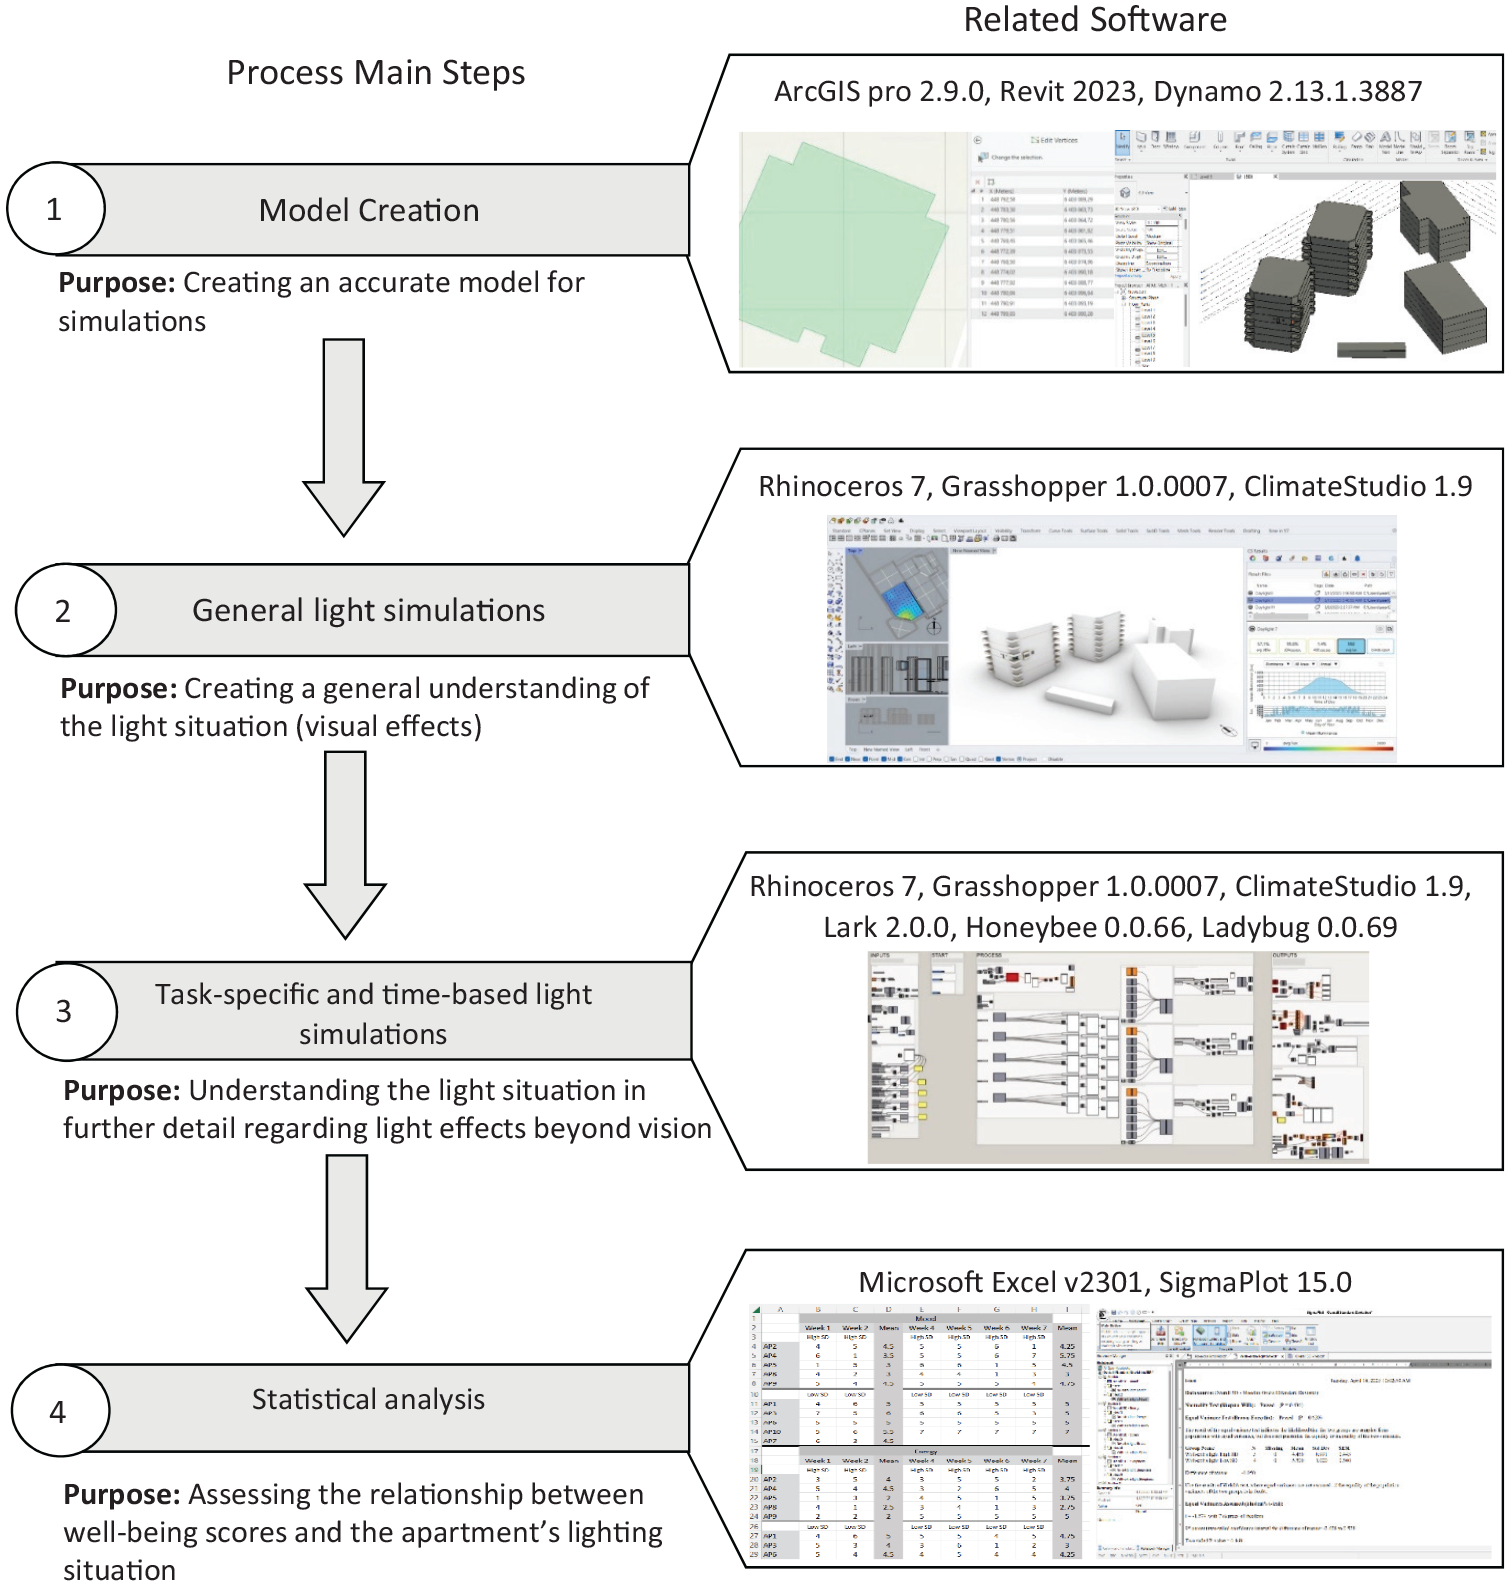
Methodological process of the study, including software and purposes of each process step
To create an accurate model for the building positions, the geographic data of all apartments and their surrounding buildings were collected from SLU GET (Swedish University of Agricultural Sciences Geodata Extraction Tool) service (https://zeus.slu.se), which is a geographical information service provided for universities. Using ArcGIS Pro 2.9.0, the coordinates of key points were gathered in an Excel file and mapped in Revit using a Dynamo script. The apartments and their surrounding buildings were modelled in Revit 2023, using the geographically precise guideline points and according to their actual position towards the true North. Next, the models were exported as ClimateStudio exchange (CSE) files through the ClimateStudio plugin.
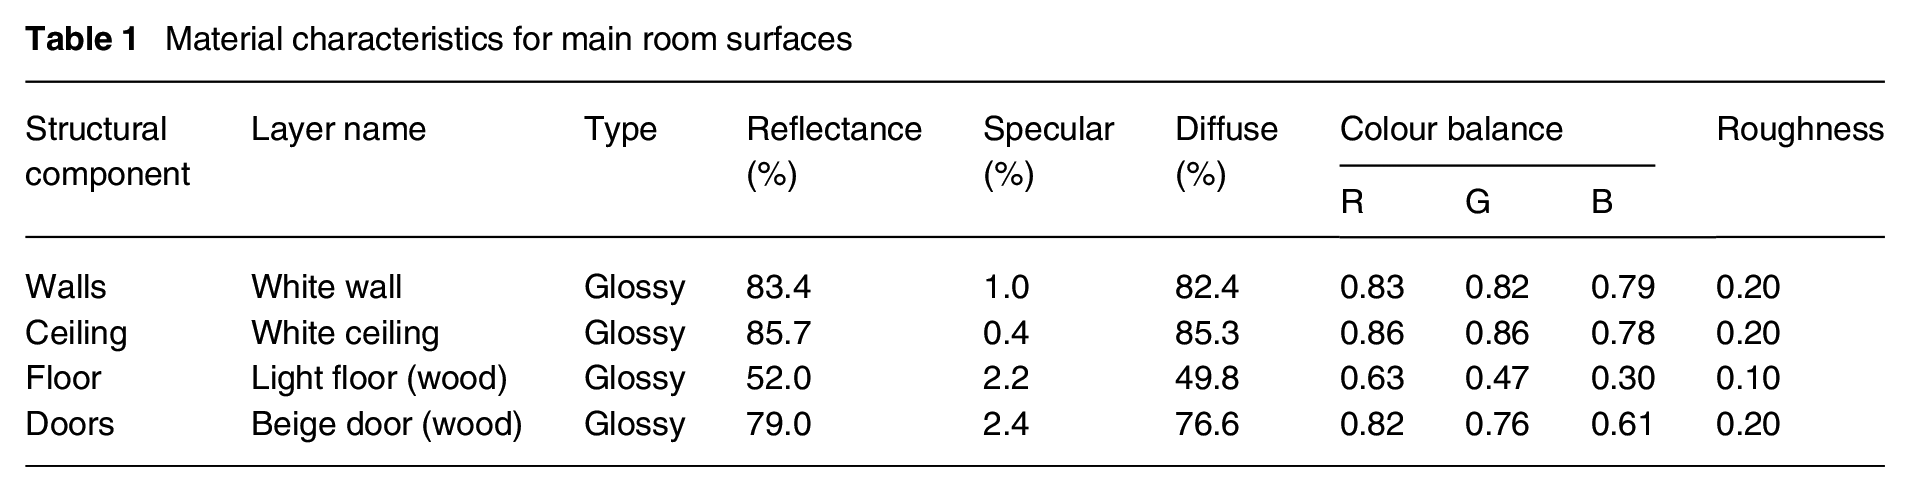
To create comparable results for all apartments, the walls and the ceilings were assumed white with light wooden floors and clear glass windows. The materials characteristics of surrounding surfaces (i.e. walls, floors, ceilings and doors) and the glazing characteristics of glass doors and windows that were set using the material library in ClimateStudio (Solemma LLC, Cambridge, MA, USA) (see Tables 1 and 2) closely resembled the materials in the actual apartments. The relatively low light transmittance of the glazing reflects the triple glazing situation that is common in Sweden for thermal reasons. Each apartment was divided into three main spaces based on room function: living room, kitchen and bedroom, where the number of bedrooms varied between 1 and 2. The sensor point grid was set 0.8 m above the floor and 0.5 m apart to achieve a reasonable resolution for an overview simulation. 42 Additionally, the windows were assumed to have clear glass, without any blinds.
Material characteristics for main room surfaces
Glazing characteristics
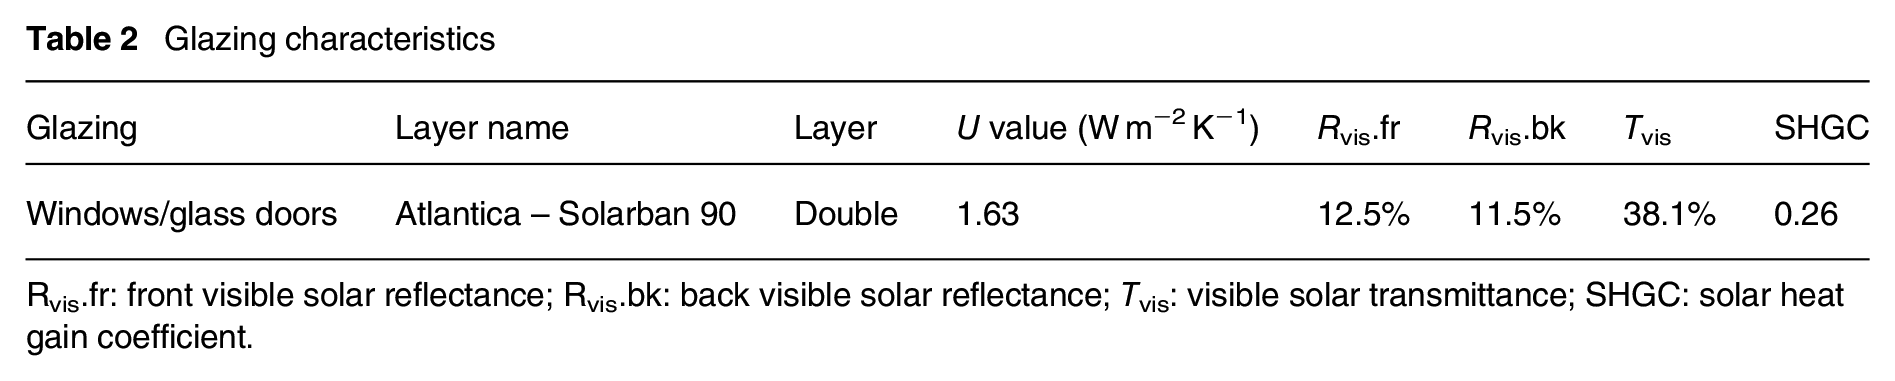
Rvis.fr: front visible solar reflectance; Rvis.bk: back visible solar reflectance; Tvis: visible solar transmittance; SHGC: solar heat gain coefficient.
2.3 Daylight simulation
Light simulations were performed for general daylight conditions and task-specific and time-based daylight situations.
2.3.1 General daylight simulations
Several daylight simulations were done for one year to achieve a high-level understanding of the general daylight situation for the apartments. Even though the current arrangement was known, the general simulation did not include furniture. Utilising the ClimateStudio plugin, the CSE models of the apartments were imported into Rhinoceros 7 and details for the layers and geometry were adjusted through the material library in ClimateStudio that spectral measurements have defined. ClimateStudio’s ‘Daylight Availability’ simulation was applied using weather data for Jönköping (2004 to 2018). Hourly illuminance data for one year were collected to assess visual performance, using metrics Spatial Daylight Autonomy (sDA) and Useful Daylight Illuminance (UDI), as well as visual comfort, using the Annual Sunlight Exposure (ASE) metric. Minimum, target and maximum horizontal illuminance were set to 100 lx, 300 lx and 3000 lx, respectively, based on recommendations found in the literature.43–45 The occurrence of illuminances greater than 3000 lx should not be eliminated and occasionally happen to account for sufficient beneficial health effects. 44 Residential leadership in energy and environmental design (LEED) for homes design and construction, which includes single-family and multi-family buildings, does not include any daylight limitations or recommendations; therefore, the requirements in LEED v4.1 (U.S. Green Building Council, Inc.) were used for the assessments of the results from the simulations. However, none of the modelled buildings were LEED certified. 46
2.3.2 Task-specific and time-based light simulations
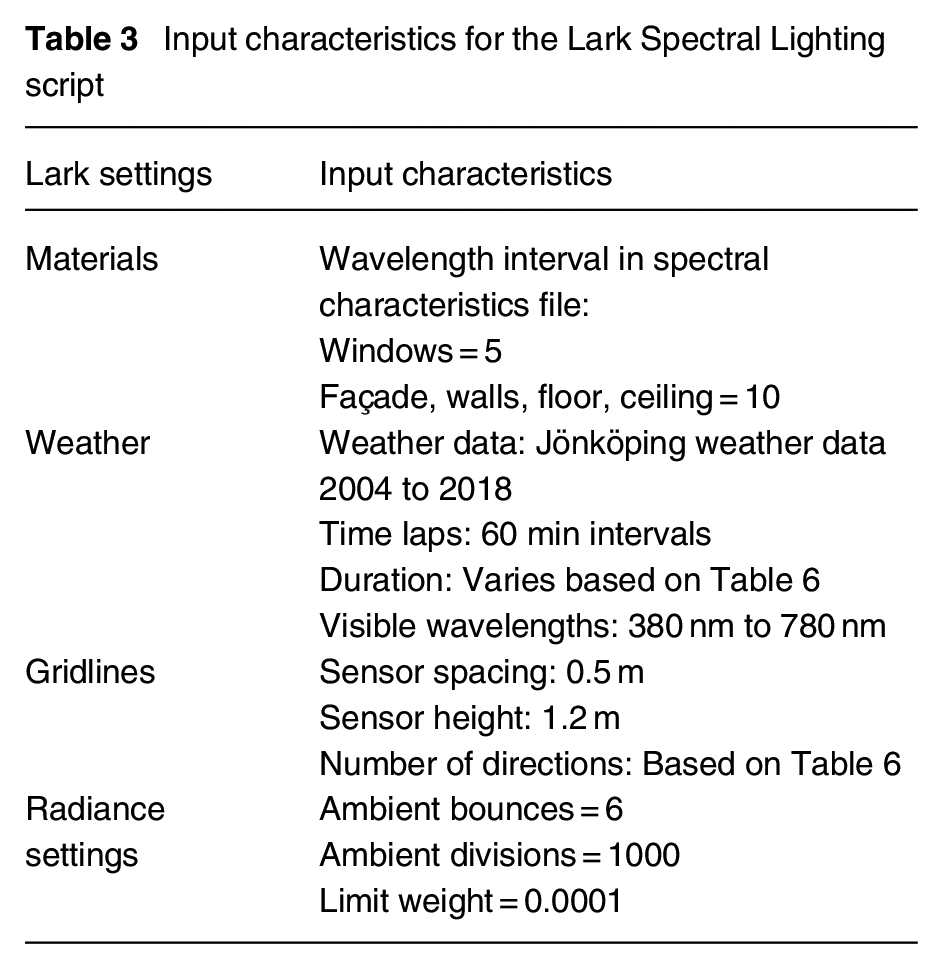
Task-specific and time-based simulations were conducted to assess the lighting conditions in further detail (i.e. effects beyond vision in addition to visual effects). The goal was to understand how much light exposure the participants received during different times of the day throughout the year, using the m-EDI 47 as the metric. The amount of m-EDI received by the participants was calculated using the Lark Spectral Lighting (version 2.0.0) plugin for Grasshopper (version 1.0.0007). Lark Spectral Lighting is a script that uses Honeybee and Ladybug plugins to add colour information to the sky model and produce α-opic equivalent lux for various directions. 38 Despite its long simulation time, it provides the most accurate results compared to alternative software. 48 To reduce the simulation time, the apartments were remodelled in Rhino in a simpler format, avoiding detailed structures such as doors or window frames. The input characteristics for the Lark script are shown in Table 3.
Input characteristics for the Lark Spectral Lighting script
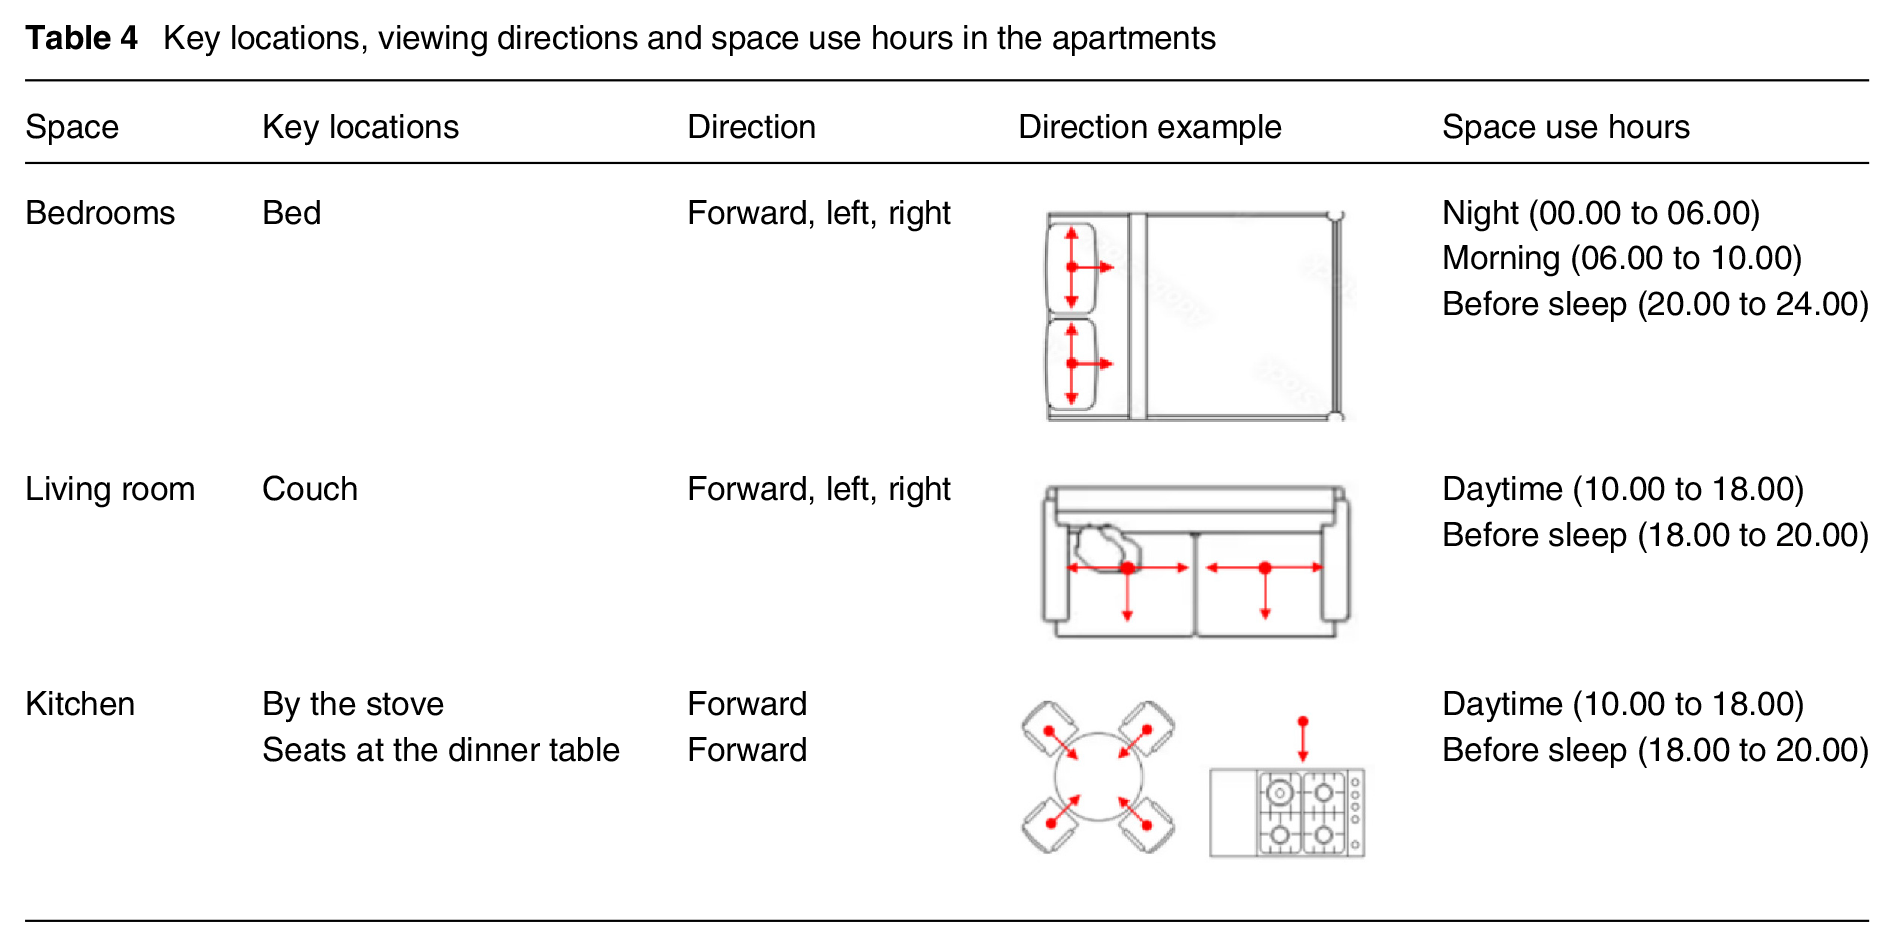
All residents followed a regular behavioural pattern with activity during the day and rest during the night. Main activities executed and assessed in the apartments were presumed as ‘waking up’, and ‘sleeping’ in the bedroom(s), ‘watching TV’, ‘relaxing’ and ‘working’ in the living room, and ‘making food’ and ‘eating’ in the kitchen. Key analysis locations were identified as summarised in Table 4. These key analysis points and surfaces were created as sensor points or grids, and their daylight potentials were investigated based on the activity time using Lark Spectral Lighting and ClimateStudio. The hours shown in the table are based on the model provided by Andersen et al. 49 According to their model, the circadian system’s phase-resetting can occur from 06.00 to 10.00, during which sufficient daylight exposure can set the biological clock to phase-advance in most individuals. From 10.00 to 18.00, a high daylight exposure may increase subjective alertness without significant phase-shifting in the circadian system. Finally, from 18.00 to 06.00 the following morning (before sleep and during the night), light exposure can typically disrupt the body’s circadian cycle by causing phase delay. 49
Key locations, viewing directions and space use hours in the apartments
2.4 Data analysis
The simulation results were collected and summarised in charts, and the 10 apartments were, based on the LEED standard 50 and recommendations by Brown et al., 47 categorised as apartments with either a ‘high’ or ‘low’ daylight potential. Each light measurement was compared to the thresholds as specified in the standard and recommendations to calculate the score of the ‘high’ and ‘low’ potential, and scores of 1 or 0 were given based on whether the targets were reached, with an exception for sDA (score 0, 1 or 2 since the LEED standard awards sDA > 55% and sDA > 75% differently). The sum of all factors was calculated for each room, and an average of all room scores was considered the final score for the apartment. The score for general simulation (out of 4, metrics: sDA (Score: 0 to 2), UDI (Score: 0 to 1) and ASE (Score: 0 to 1)) and task-specific/time-based simulation (out of 7, metric: m-EDI, giving the score 0 or 1 for every seven critical periods, shown in Table 4– Space use hours: Bedroom-Morning, Bedroom-Before-Sleep, Bedroom-Night, Livingroom-Daytime, Livingroom-Before-Sleep, Kitchen-Daytime and Kitchen-Before-Sleep) were considered equally important; therefore, a scaled average of the two was set as the final potential score for the apartments, as can be seen in Equation 1. A daylight potential score above the median (70%) was considered a ‘high’ potential.

Since differences in daylight exposure between apartments were expected for different seasons due to their layout, window dimensions and orientation, the contrast of light received by the apartments throughout the year, measured as the difference between the light exposure amount during bright and darker months, was further investigated using simulation data. The standard deviation for light exposure throughout the year was calculated to showcase this difference. All standard deviations were specified as a percent of the maximum standard deviation for a specific time and room to ensure equal contribution in the final score for different times of the day (morning/during the day, before sleep and night) and different rooms. An average was calculated as the overall standard deviation for each apartment. The apartments were divided by 50% as high and low standard deviations.
Possible self-assessed well-being differences, comparing the high/low daylight potential groups, used the data collected in real-time for eight weeks and was evaluated by a parametric statistical method: paired-samples t-test (equal variance not assumed, significance level p ≤ 0.05). SigmaPlot 15.0 (Systat Software Inc.) was used for statistical analyses. A series of t-tests were also performed for the high/low daylight potential during different seasons.
3. Results
The lighting simulations generated results for general daylight conditions and task-specific and time-based daylight situations. With the results, the daylight potential for each apartment was determined, and this metric was correlated with self-assessed well-being variables from residents.
3.1 General daylight simulations
Table 5 shows the results from the general simulation of the 10 apartments. Table 5 shows the UDI in each room where the UDI is divided into four illuminance ranges: 0 lx to 100 lx (UDI_f, failing), 100 lx to 300 lx (UDI_s, supplemental), 300 lx to 3000 lx (UDI_a, autonomous) and above 3000 lx (UDI_e, excessive). The rooms for each apartment were sorted from lowest to highest UDI_a as it is considered the most desirable range. 45 As seen in the table, in all rooms, AP6 experiences the highest UDI_a: 81.0%, 73.3% and 66.0% for the living room, kitchen and main bedroom, respectively. Apartment AP3 has the lowest autonomous UDI_a for the kitchen (48.2%) and main bedroom (39.5%), and AP9 has the lowest UDI_a for the living room (46.5%).
Data from general daylight simulation
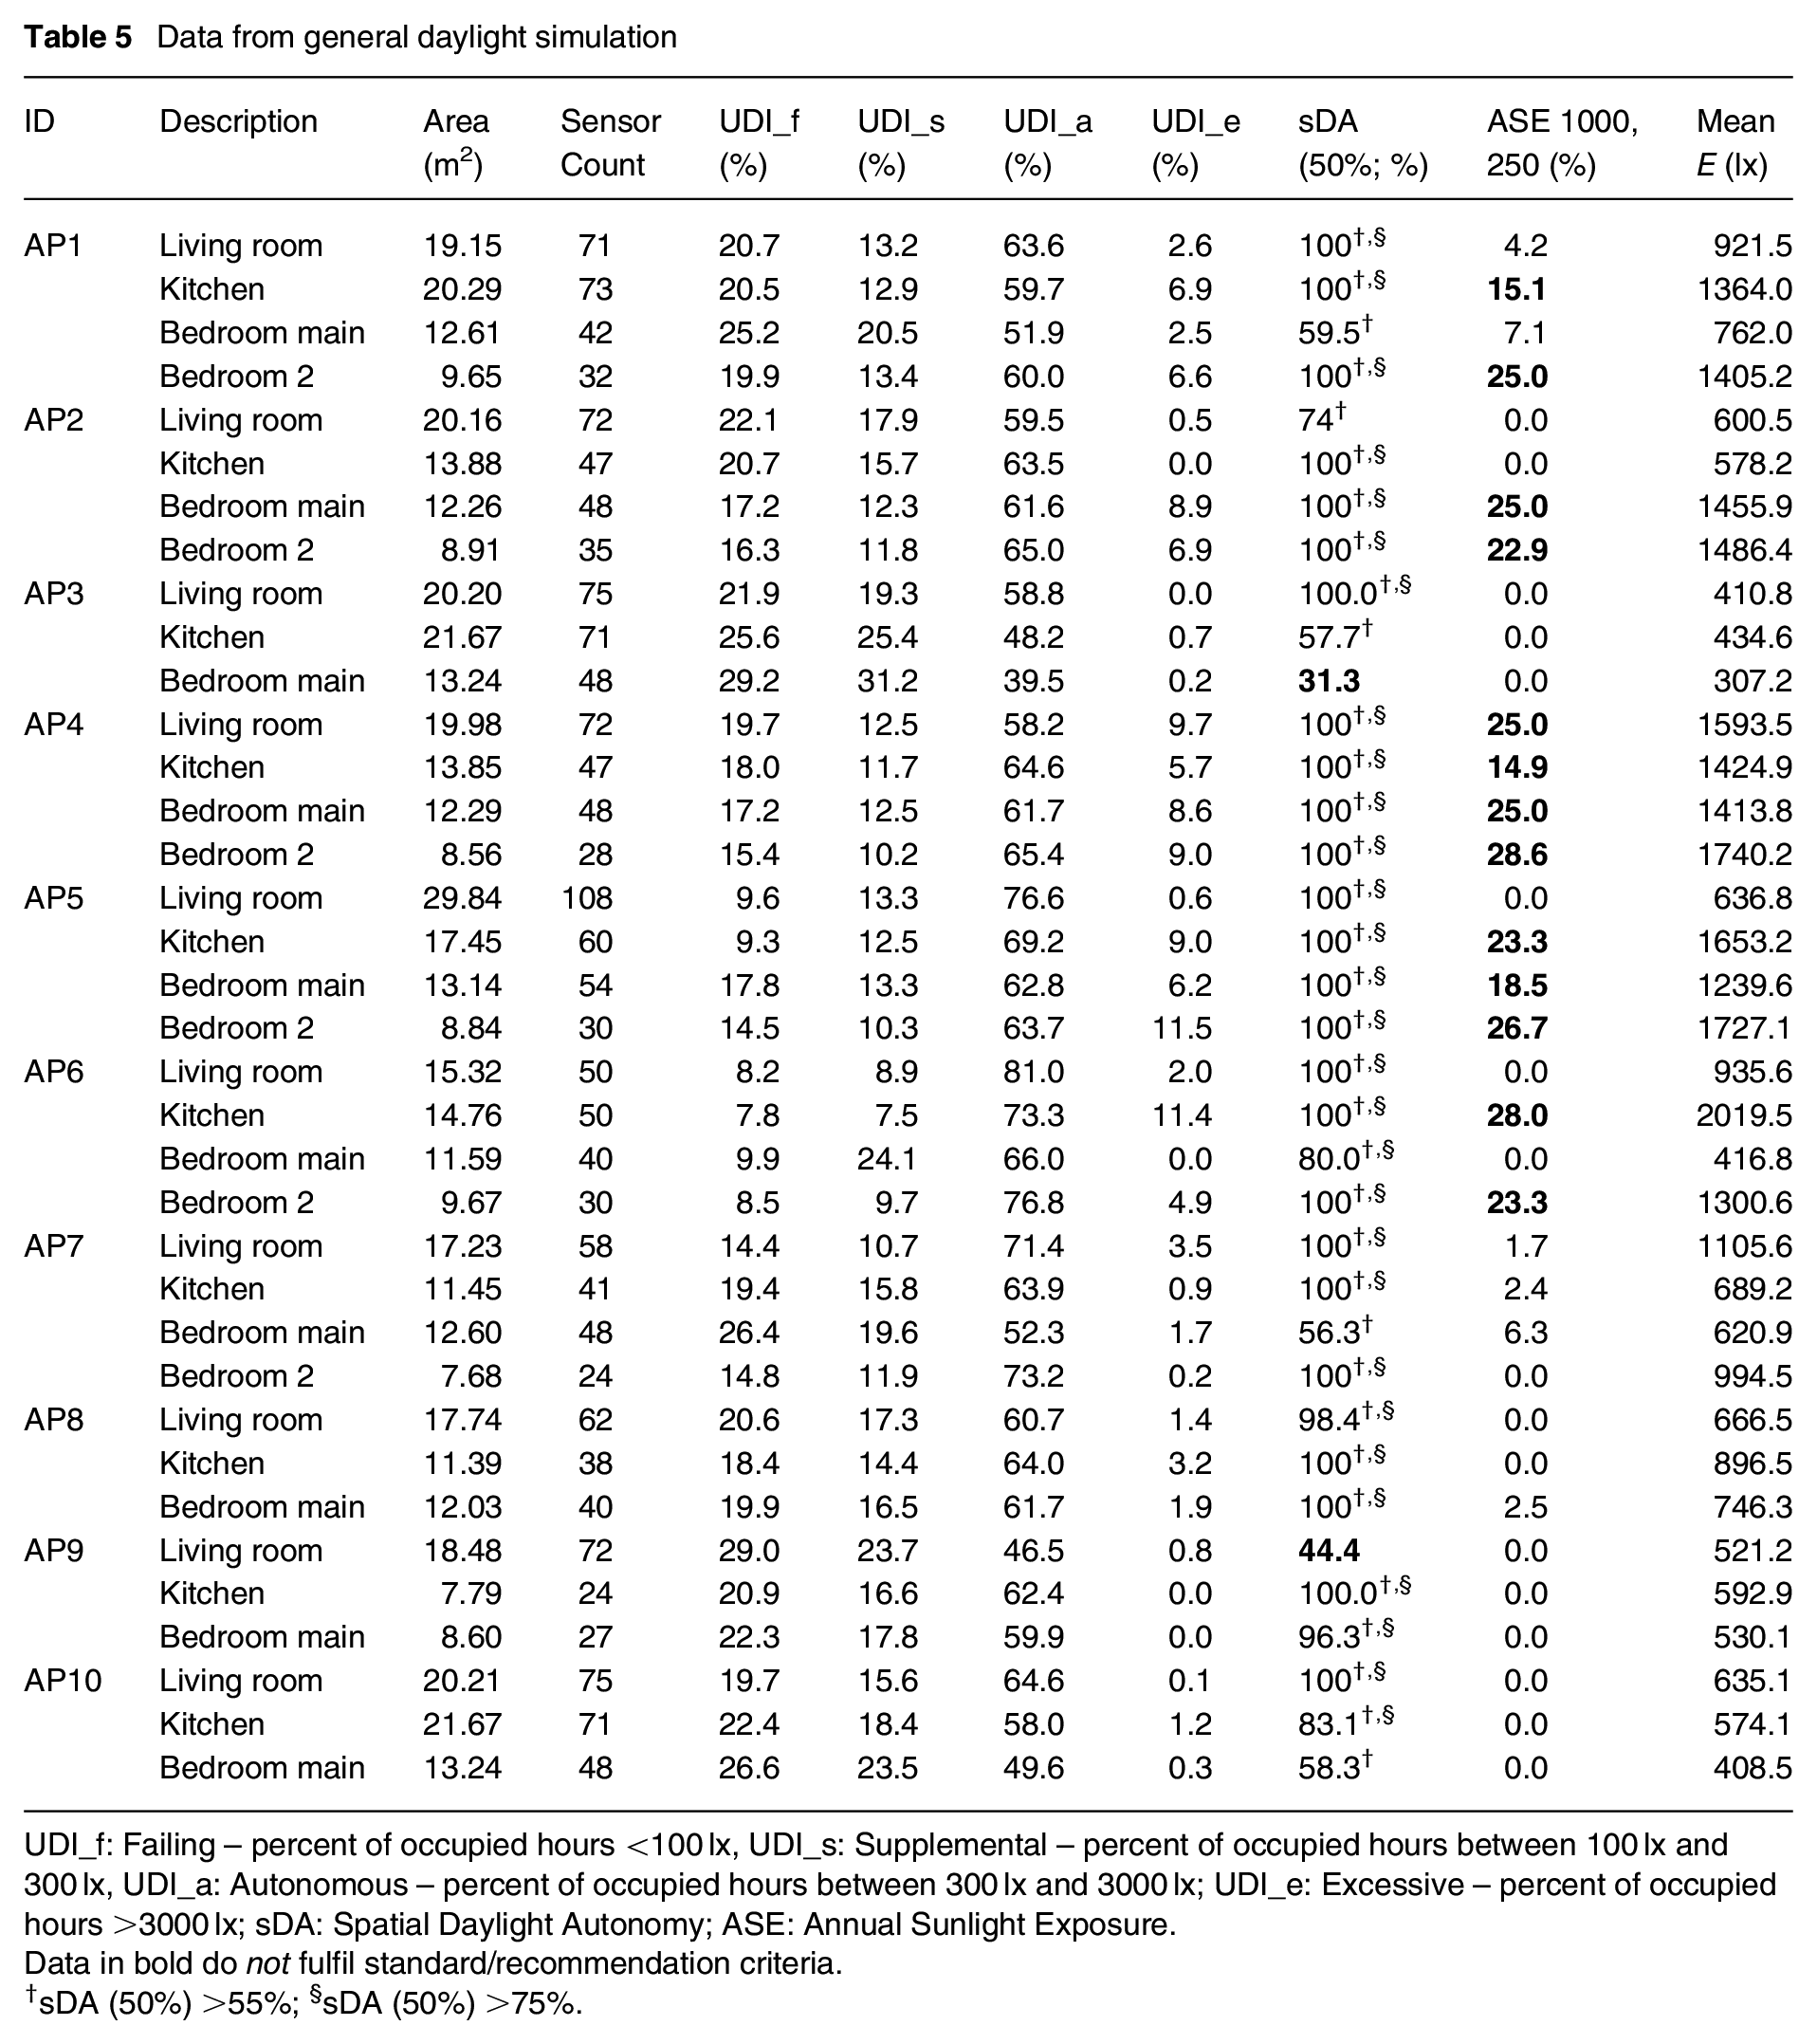
UDI_f: Failing – percent of occupied hours <100 lx, UDI_s: Supplemental – percent of occupied hours between 100 lx and 300 lx, UDI_a: Autonomous – percent of occupied hours between 300 lx and 3000 lx; UDI_e: Excessive – percent of occupied hours >3000 lx; sDA: Spatial Daylight Autonomy; ASE: Annual Sunlight Exposure.
Data in bold do not fulfil standard/recommendation criteria.
sDA (50%) >55%; §sDA (50%) >75%.
The data for ASE and sDA, important daylight measurement factors in LEED v4.1, were compared to the thresholds, and sDA results <55% (50%) or ASE, 250 results >10% are highlighted. According to the LEED standard, the sDA should be more than 55% (for structures other than healthcare, 2 points for sDA > 55% and 3 points for sDA > 75%), and an ASE higher than 10% shows the risk for glare. Based on the results, apartment AP4 is at risk of glare for all specified spaces, AP5 for the kitchen, main and second bedroom, AP2 for both bedrooms, and AP1 and AP6 for the kitchen and second bedroom. The only sDA lower than 55% is measured in AP3 for the bedroom and AP9 for the living room.
Figure 2 shows the results of the average horizontal illuminance by daylight for each apartment on a false colour scale from 0 lx (blue) to ≥3000 lx (red). The colours clearly show the distribution of daylight over the rooms, with high levels close to the daylight openings and a limited amount in the back of most rooms. Additionally, the distribution of average daylight amount for the living room, kitchen and main bedroom over the day is summarised in Figure 3 including four (coloured) sections (night, morning, during day and before sleep). It shows whether the peak daylight hours skew towards morning, evening, or midday or are equally distributed over the day.
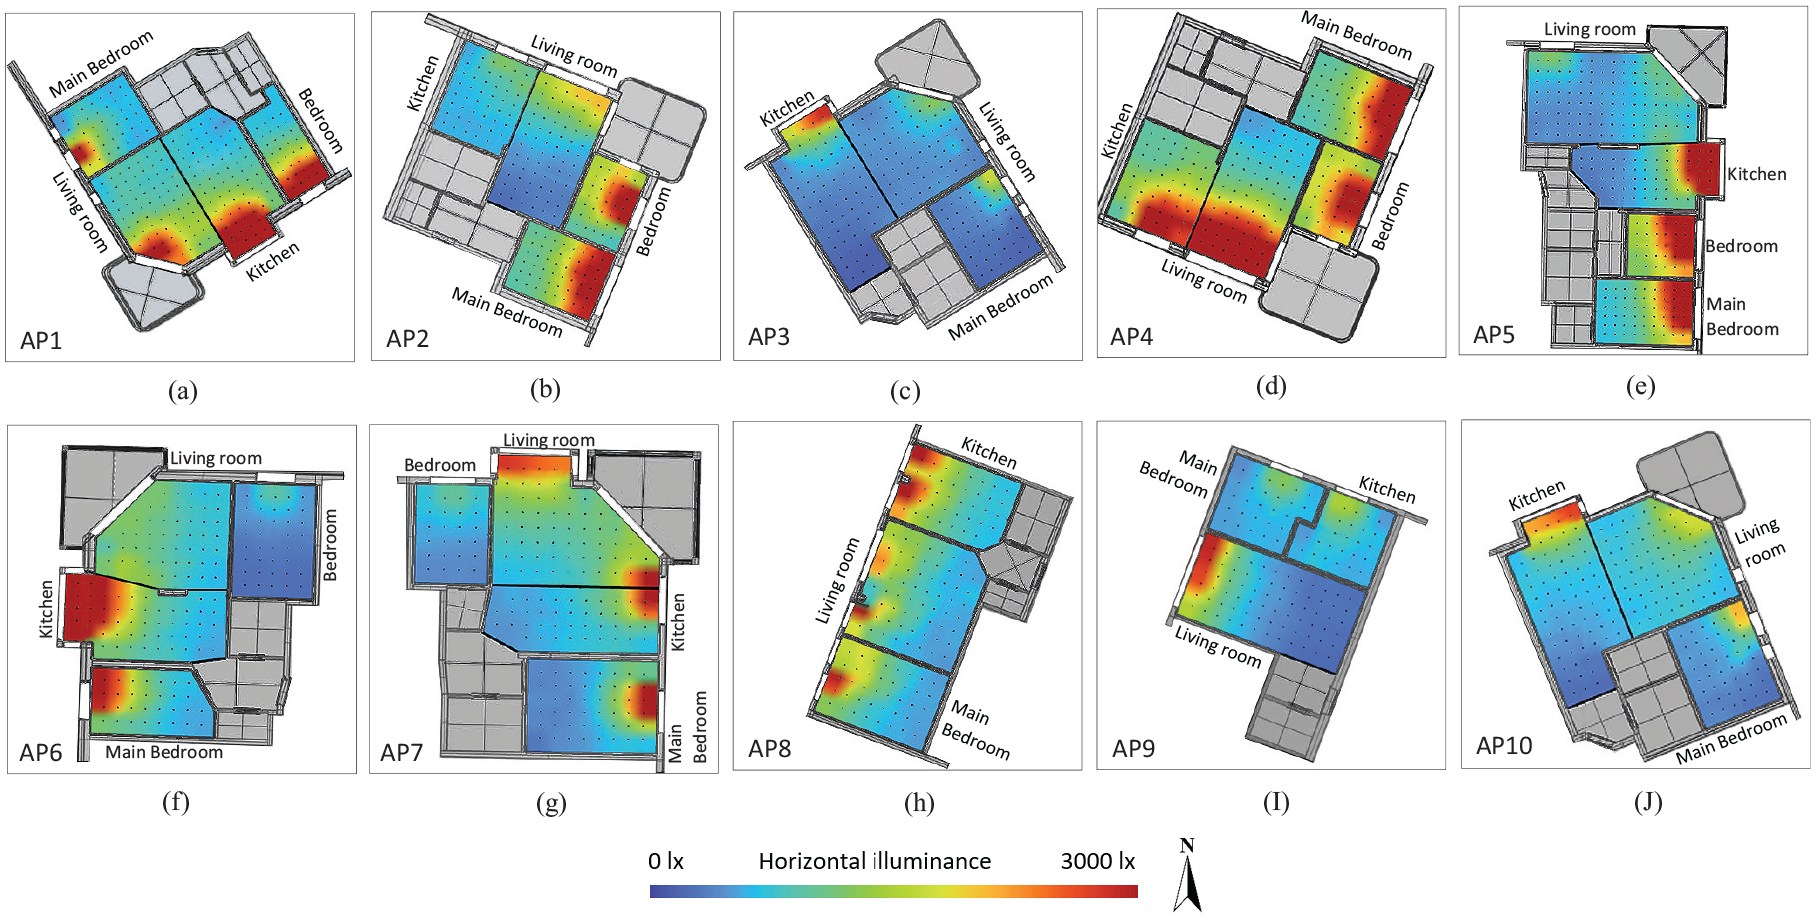
Yearly mean horizontal illuminance per apartment for the investigated rooms (false colour scale from 0 lx to ≥3000 lx; online version shows the figure in colour)
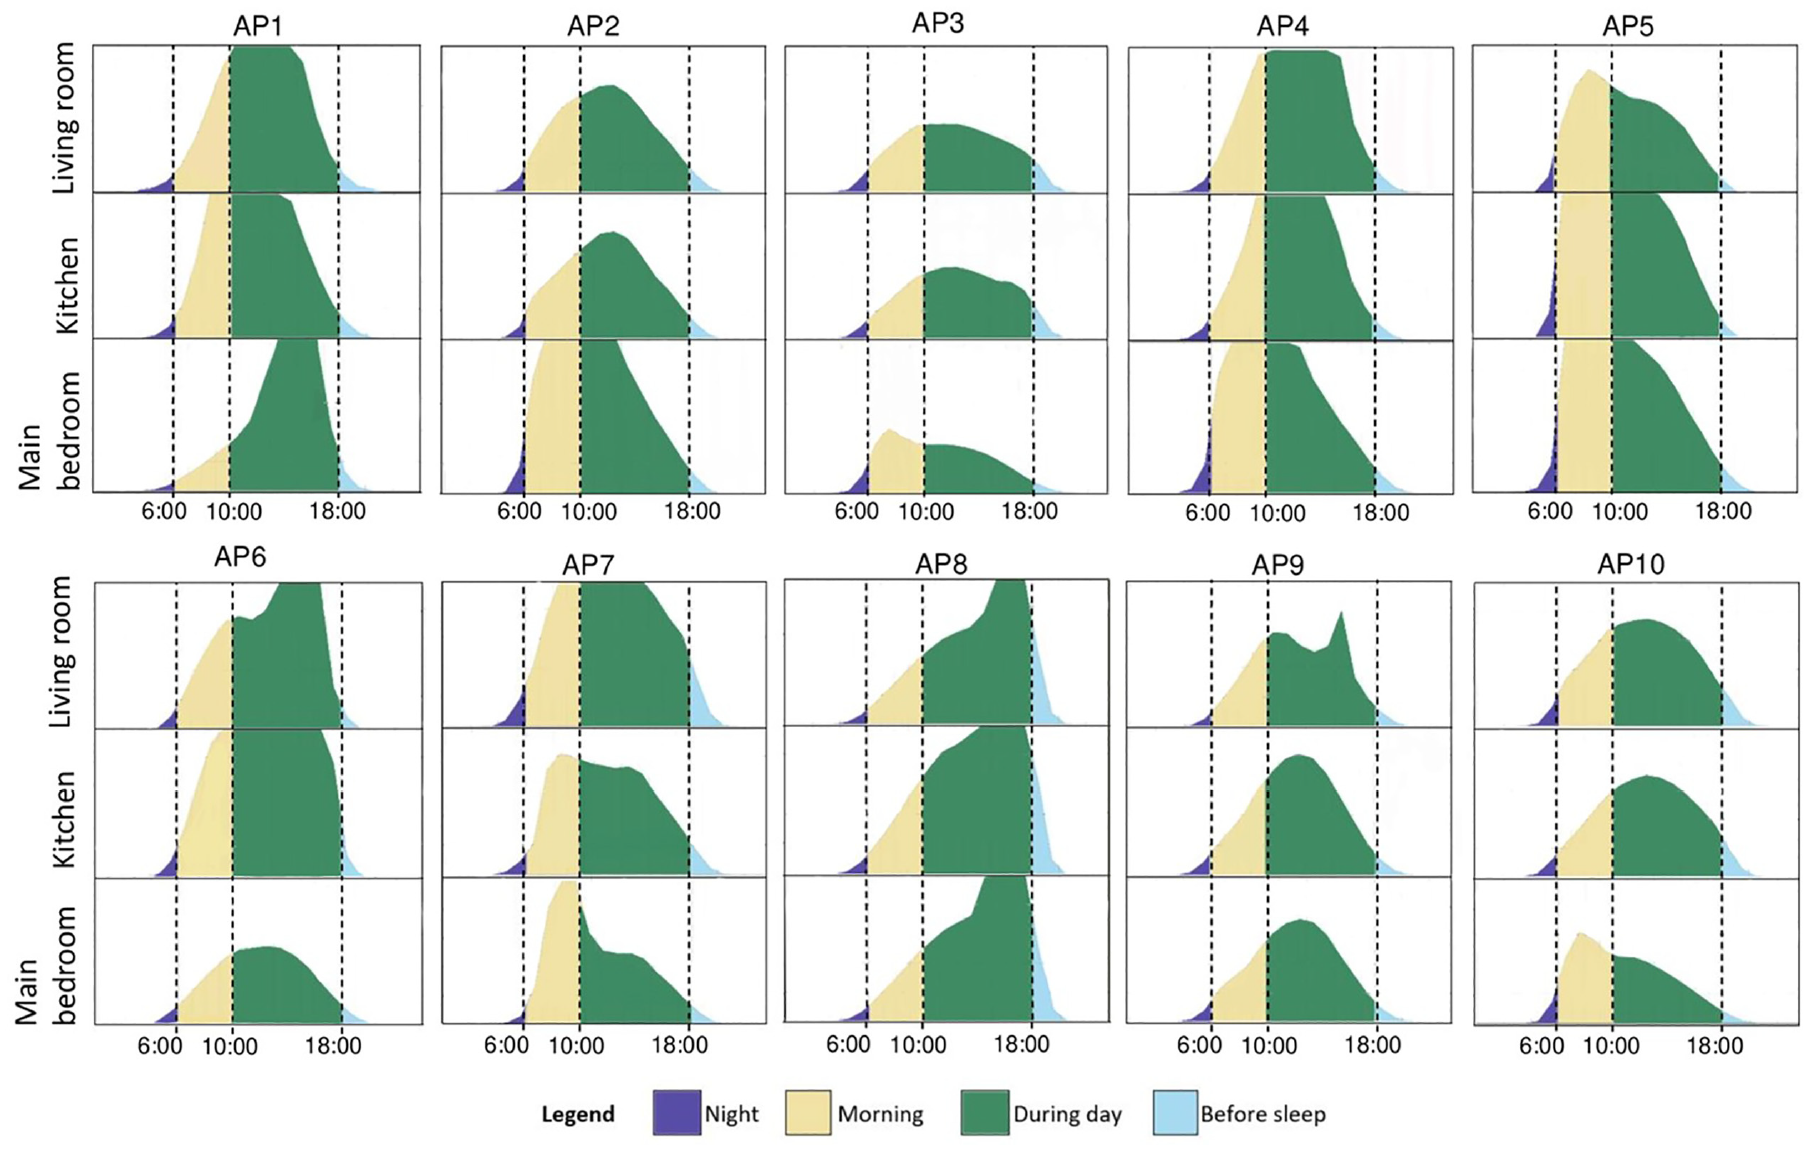
Mean hourly horizontal illuminance for each room and apartment (x-axis = time in hours, y-axis = horizontal illuminance in lux), where the day is divided into four sections: ‘night’ (00.00 to 06.00), ‘morning’ (06.00 to 10.00), ‘during day’ (10.00 to 18.00) and ‘before sleep’ (18.00 to 0.00)
3.2 Task-specific and time-based daylight simulations
The results for one year of simulations regarding effects beyond vision (mEDI in the vertical plane) are displayed in Figure 4. Since the timing of the light exposure is crucial, the results for the bedroom are shown for the morning (06.00 to 10.00) and during the day (10.00 to 18.00) for the kitchen and living room. These moments are typically preferred for light exposure for entrainment and to enhance measures of performance and alertness in day-active people.47,49 The mEDI results differ substantially over the year and between apartments. The winter light exposure is comparable among apartments in contrast with spring, autumn and summer. For the main bedrooms, the difference between the minimum and maximum mEDI ranges from no difference in January and December to a difference of 1715 lx in May (between AP7 and AP2). For living rooms, the difference ranges from 77 lx in December to 2154 lx in April (AP7 vs. AP4). For kitchens, the difference ranges from 206 lx in December to 3262 lx in April (AP7 vs. AP1).
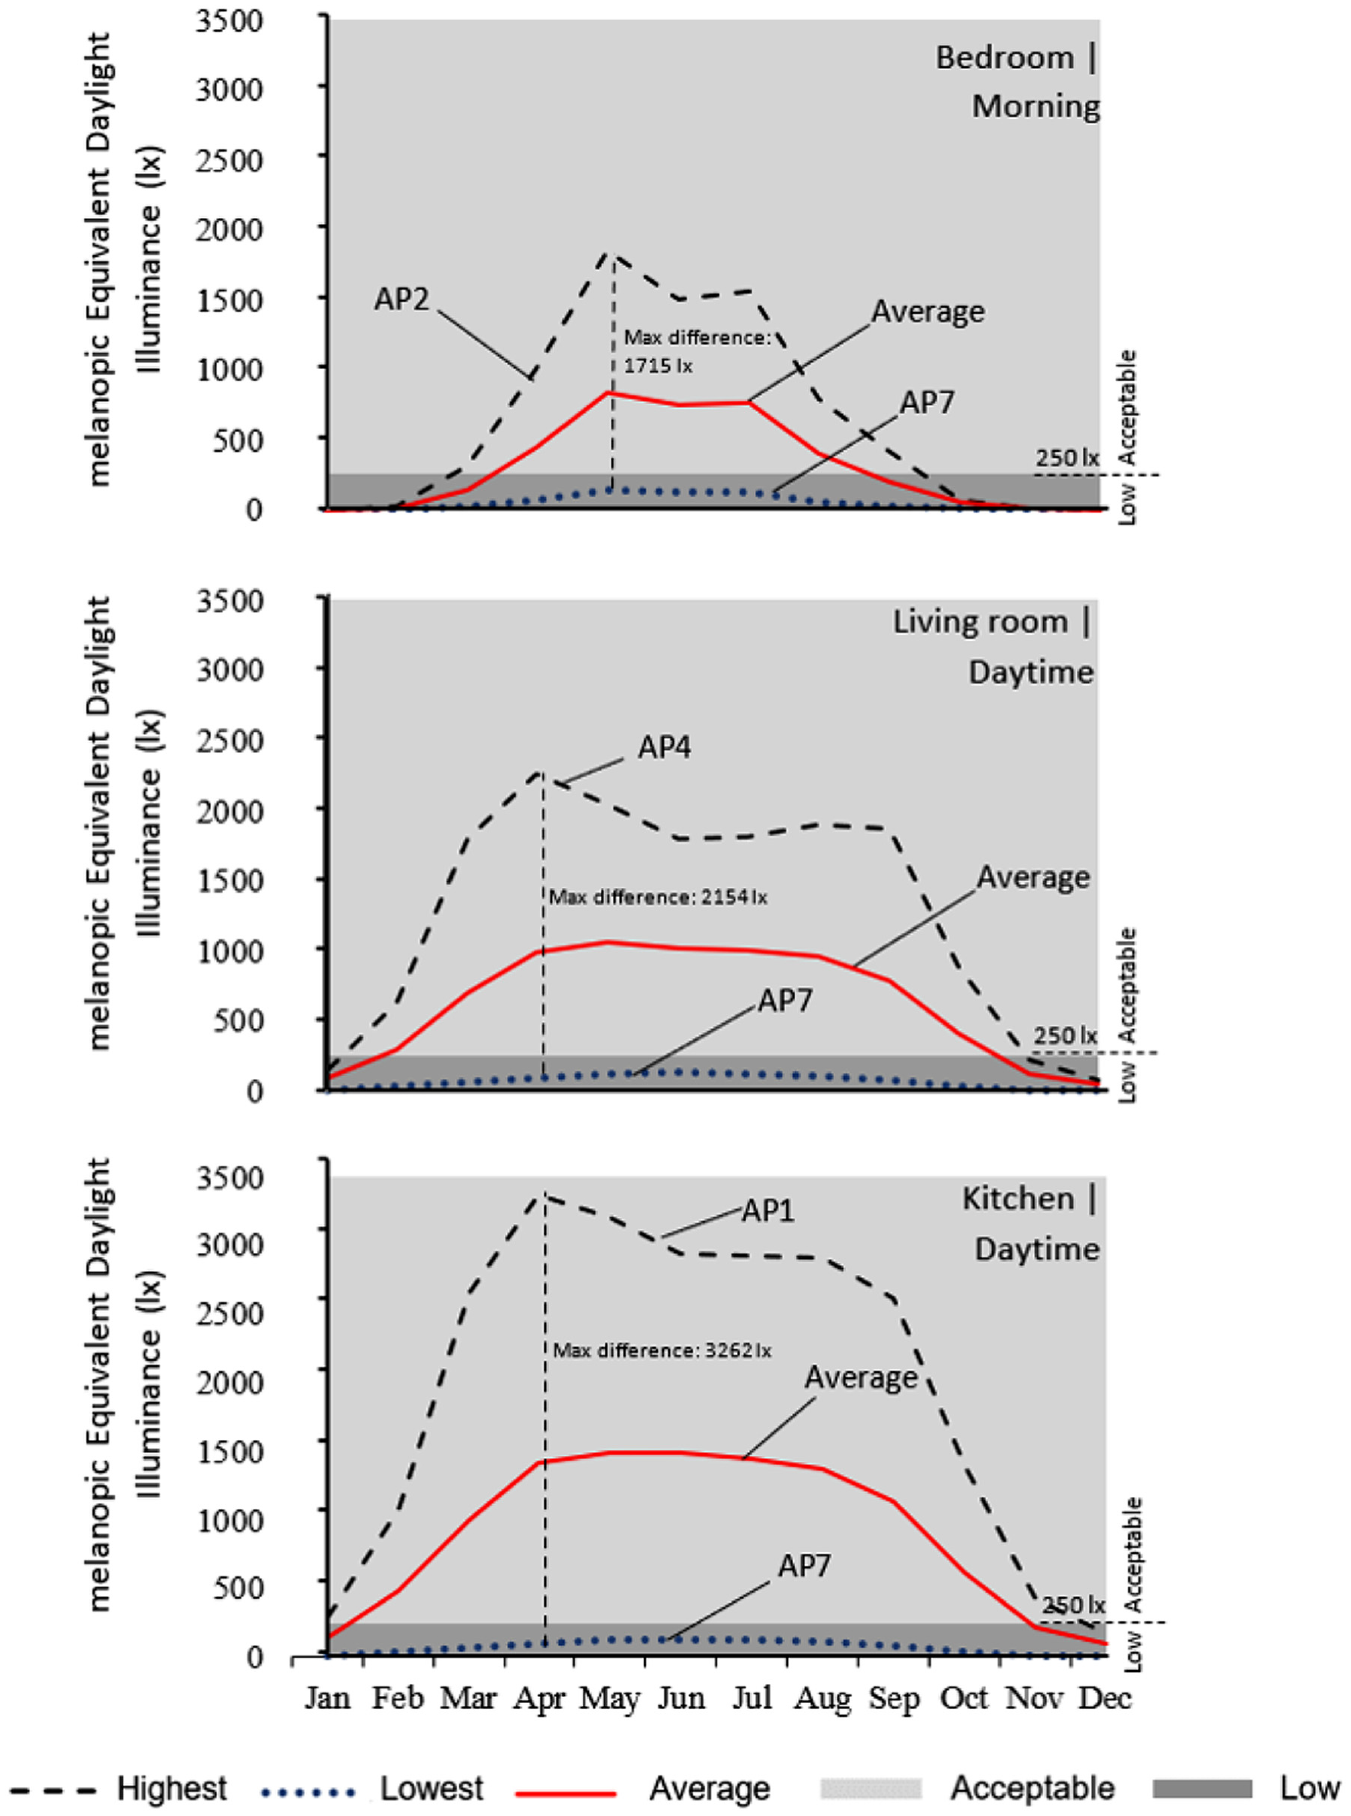
The highest, lowest and average mEDI values for bedroom, living room and kitchen over a year. The lighter background area shows the acceptable mEDI suggested by Brown et al. 47 (>250 lx), and the darker area shows the values that are too low
The simulations for the hours that typically can disrupt the body’s circadian rhythm (before sleep and night) are shown in Figure 5. The results depict that in wintertime (January, February and March), the apartments’ light exposure is a lot more similar compared with other seasons, akin to the simulations for morning and during the day. The contrast between light exposure for apartments before sleep is minimal from September to March, whereas this contrast becomes more prominent from March to September, peaking in June at 1370 lx for the kitchen and 1506 lx for the living room (AP7 vs. AP8). The maximum difference between the light exposure at night is observed from April to August, peaking at 11 lx in June for AP7 and AP5.
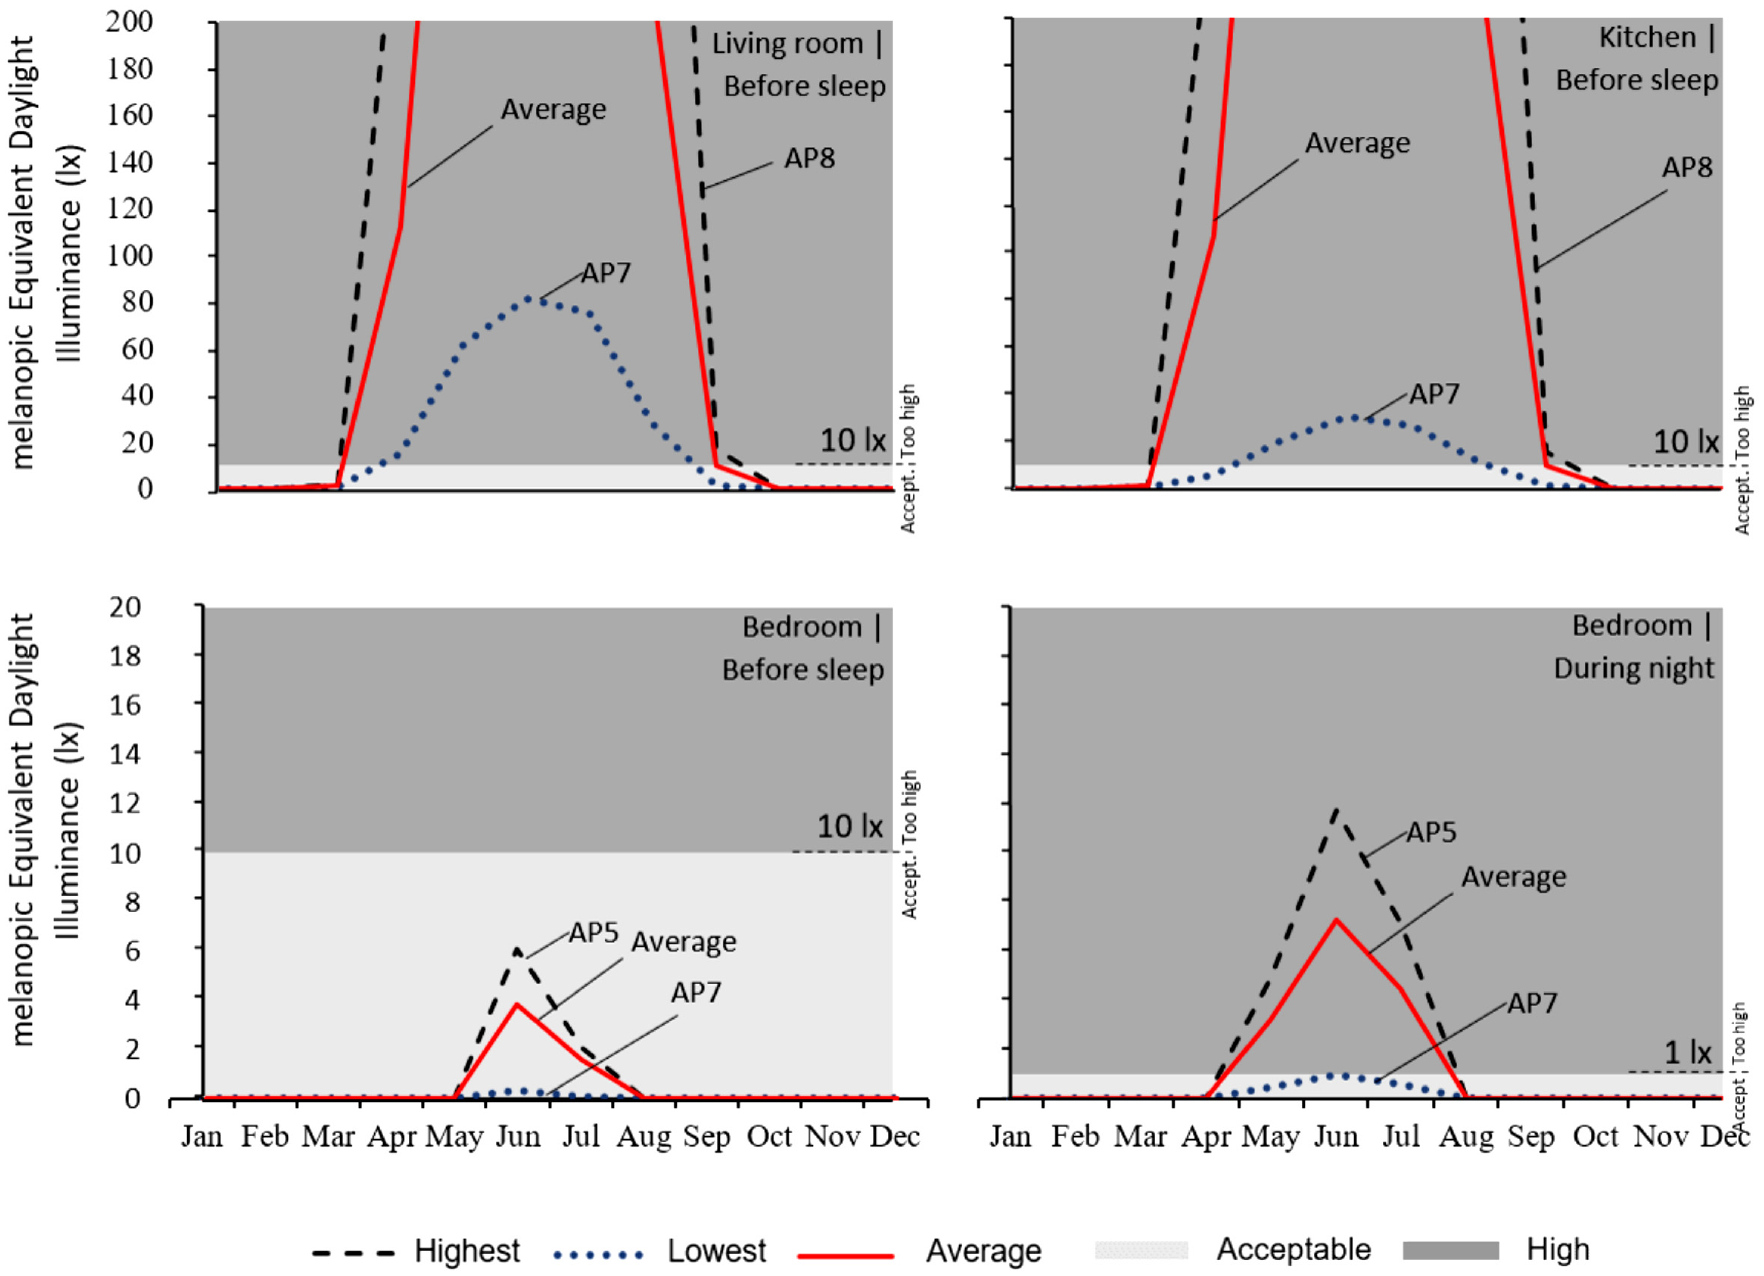
The highest, lowest and average mEDI for bedroom, living room and kitchen during different months. The lighter background area shows the acceptable mEDI range suggested by Brown et al. 47 (<10 lx before sleep and <1 lx during the night), and the darker area shows when the mEDI levels are too high. Note the difference in vertical axes between the top and bottom figures for visibility purposes
3.3 Daylight potential
The final scores acquired from the comparison of simulation data with LEED v4.1 and recommendations by Brown et al. 47 can be seen in Table 6. As can be seen, apartments with both low (AP3) and excessive (AP4) daylight exposure are considered to have low daylight potential since the mEDI metric (measurements during the night and before sleep) and ASE metric prevent apartments with excessive daylight from gaining high scores.
Subdivided and overall daylight potential scores for each apartment
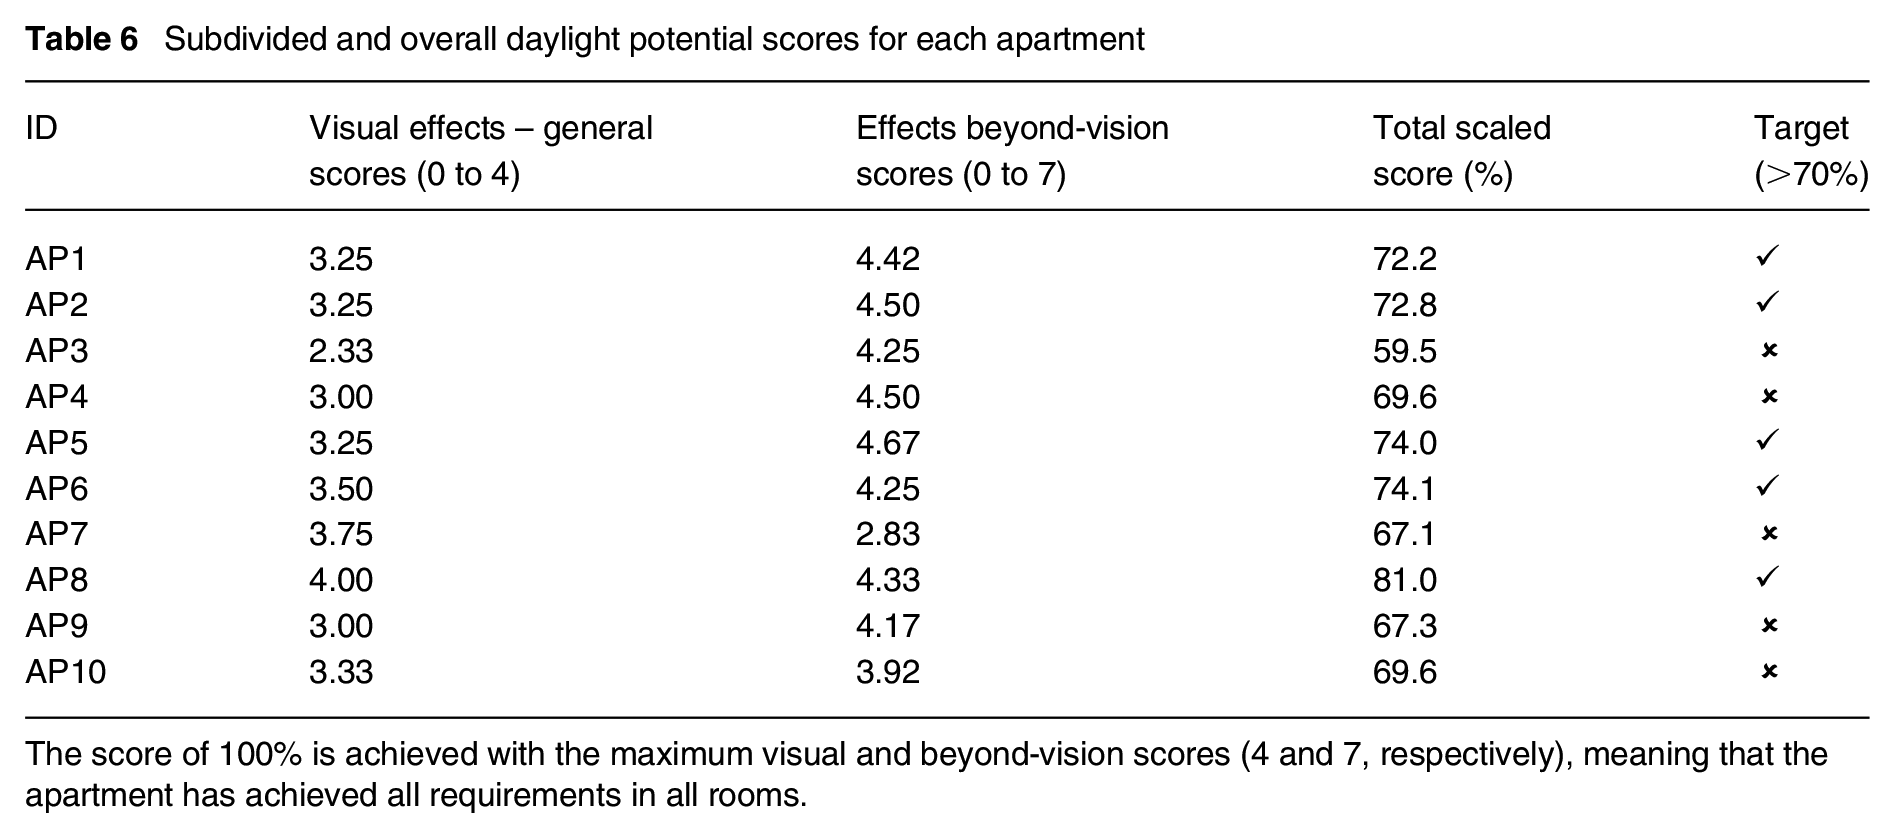
The score of 100% is achieved with the maximum visual and beyond-vision scores (4 and 7, respectively), meaning that the apartment has achieved all requirements in all rooms.
Based on the results from scoring the daylight potentials in Table 6, apartments AP3, AP4, AP7, AP9 and AP10 have been categorised as having a ‘low daylight potential’ in contrast to apartments AP1, AP2, AP5, AP6 and AP8, which were deemed ‘high daylight potential’. Figure 6 shows the daylight potential scores as a total score (left) and a ratio between visual and beyond-visual effects (right). The ‘visual effects’ scores mainly revolve around 49% to 59% (except for AP7), whereas the ‘beyond-visual’ scores vary from 41% to 51%, indicating a slightly more prioritising role from a visual effect perspective.
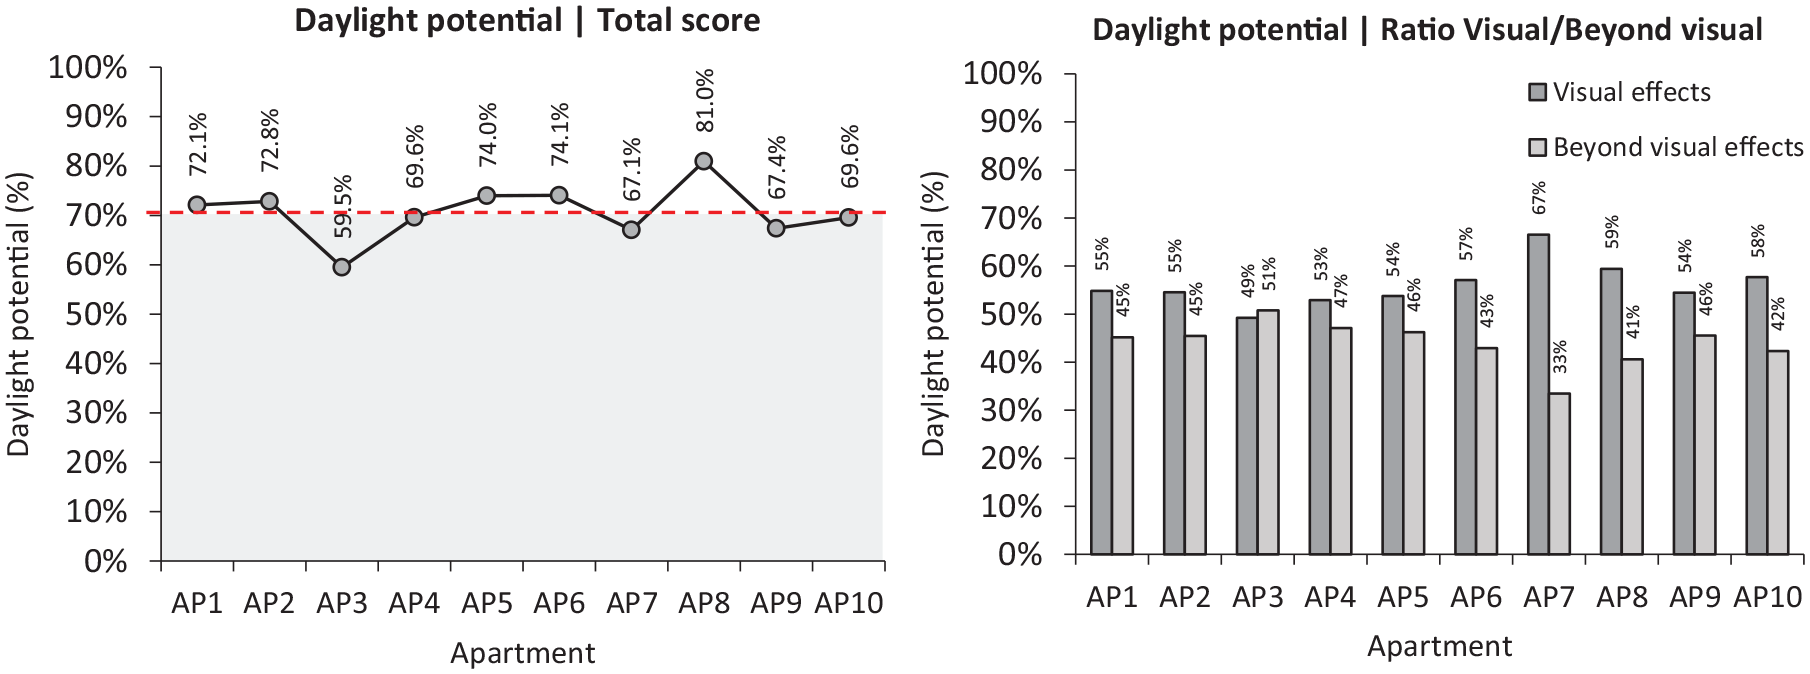
Total daylight potential scores (left) and comparison of scores focusing on visual and beyond-visual effect simulations (right)
Excessive light exposure is observed during summer, even though it varies between different apartments for periods that typically can cause disruptions for the circadian system (time ‘before sleep’ and ‘during the night’). Due to early sunrise at higher latitudes in summer, occupants wake up with the sun in the sky, in contrast to winter when occupants wake up before dawn, receiving little to no daylight exposure. The apartments that receive more daylight in the morning – in the bedrooms facing east – such as AP5, AP2 and AP4 – are prone to more contrasting daylight exposure between winter and summer. Figure 7 shows the distribution of mEDI in different apartments for different rooms and ‘critical’ periods.
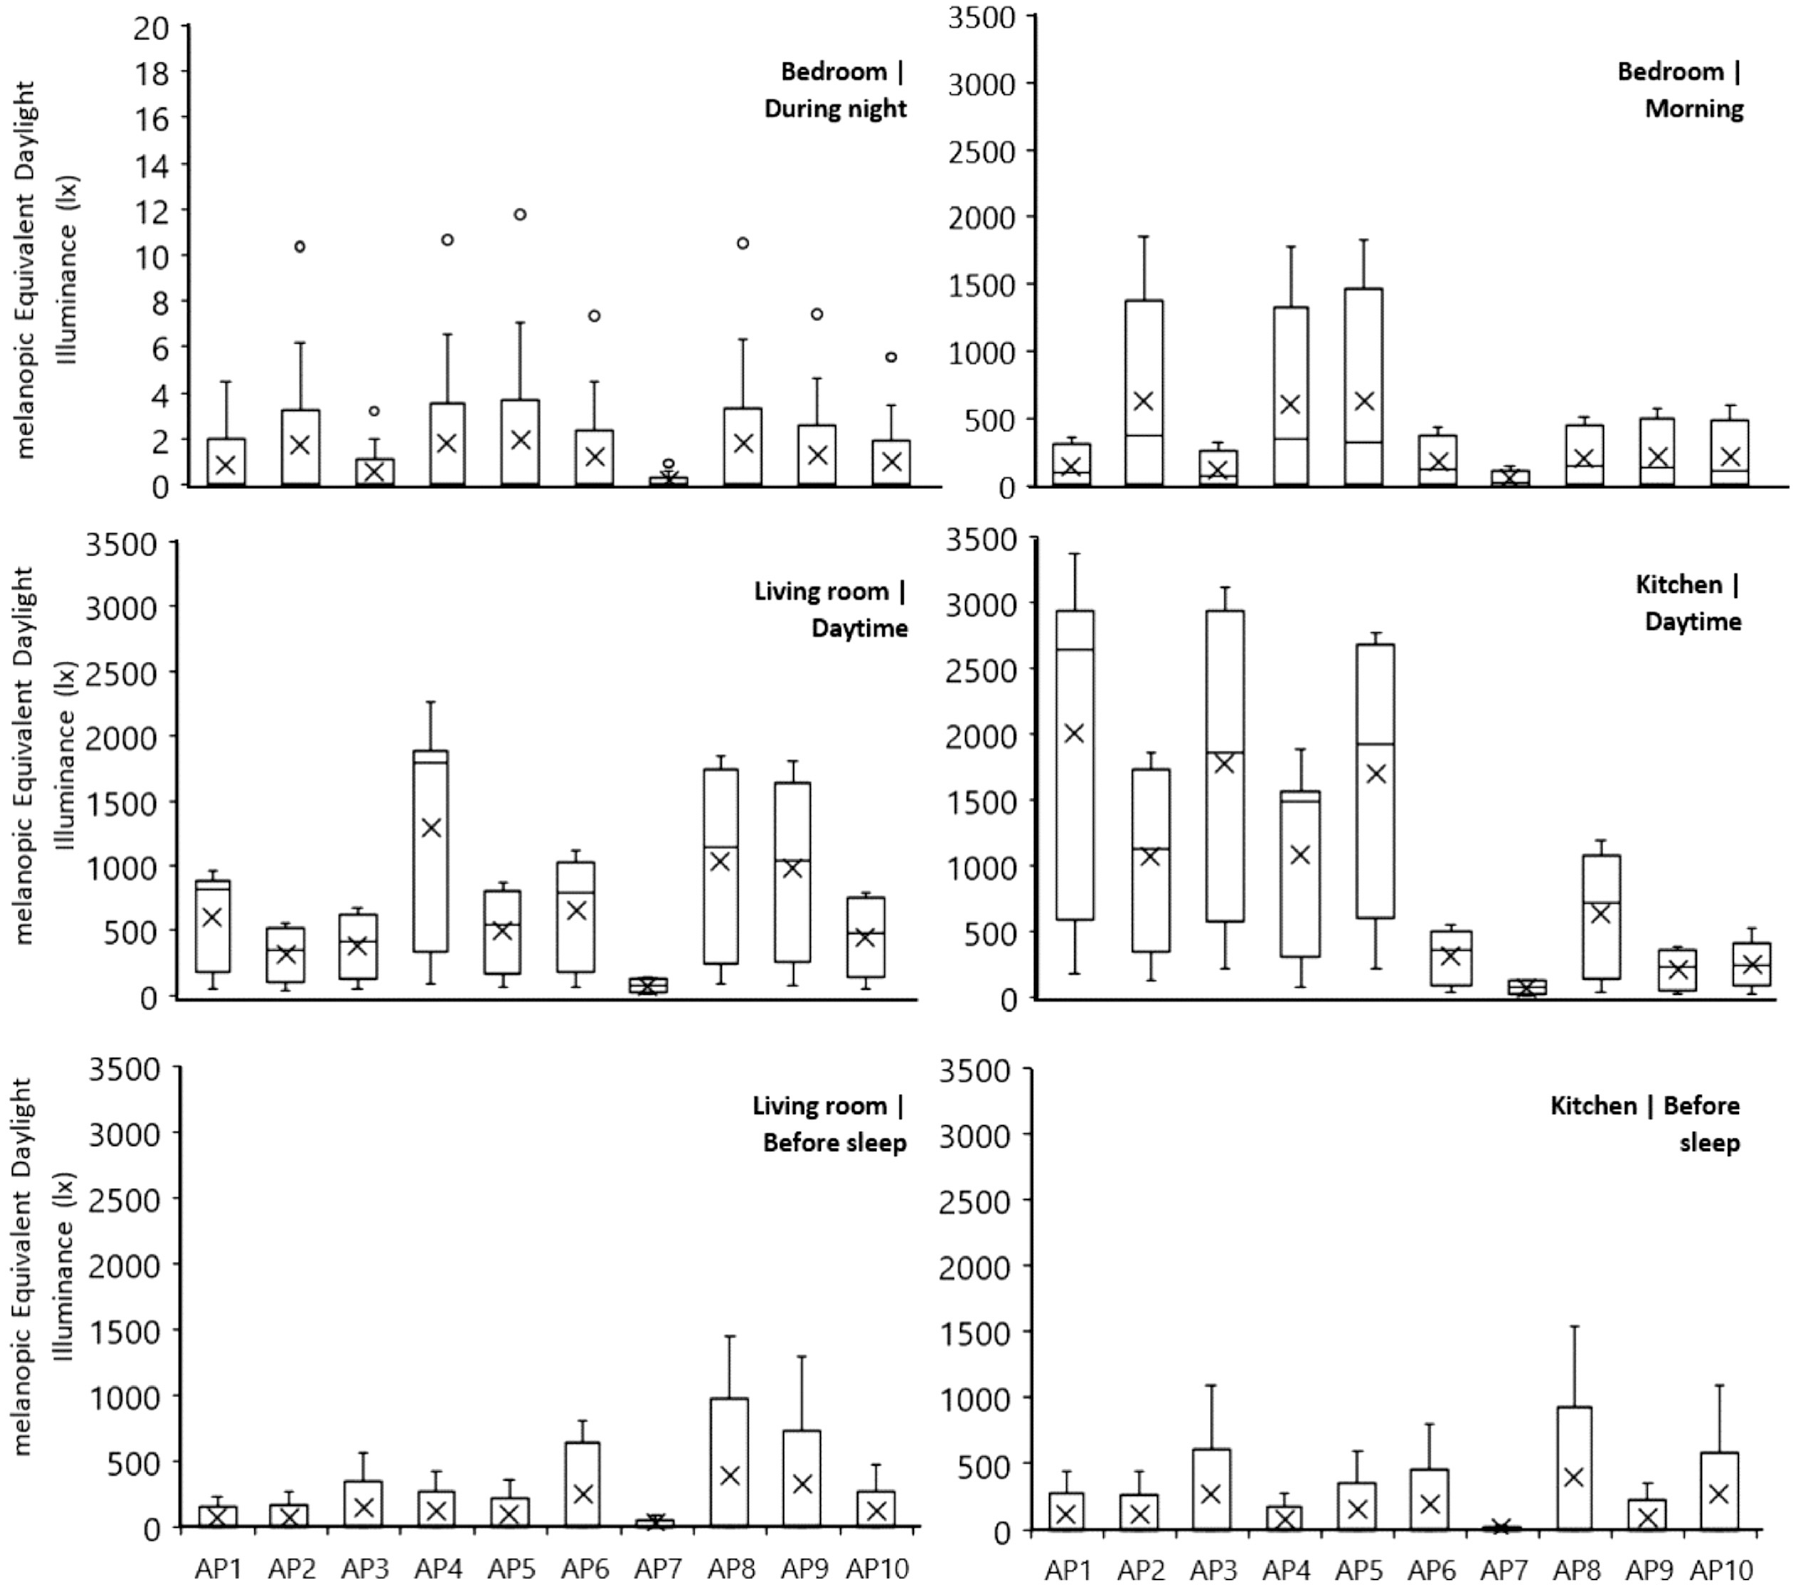
Boxplots of m-EDI distributions for one year for each apartment during crucial hours for specific rooms, with the bottom of the box = lower quartile (Q1), line inside the box = median (Q2), top of the box = upper quartile (Q3), x = mean, whiskers stretch to minimum and maximum, and scattered dots show outliers. Note the difference in vertical axes between the top left figure and other figures for visibility purposes
Although the m-EDI has very different values for different apartments in the morning and during the day, the daylight potential score results seem to change based on differences in time (months) rather than apartment characteristics (e.g. window sizes, placement of windows and their orientation). Table 7 shows how the scores in summer and winter are comparable, more prominently in January, December, November, May, June and July. The explanation lies in the large contrast between daylight during winter and summer at higher latitudes, resulting in all apartments either ‘failing’ or ‘passing’ the recommendations by Brown et al. 47
Detailed potential scores in different months (0 to 7 scale), with 7 being the highest possible score
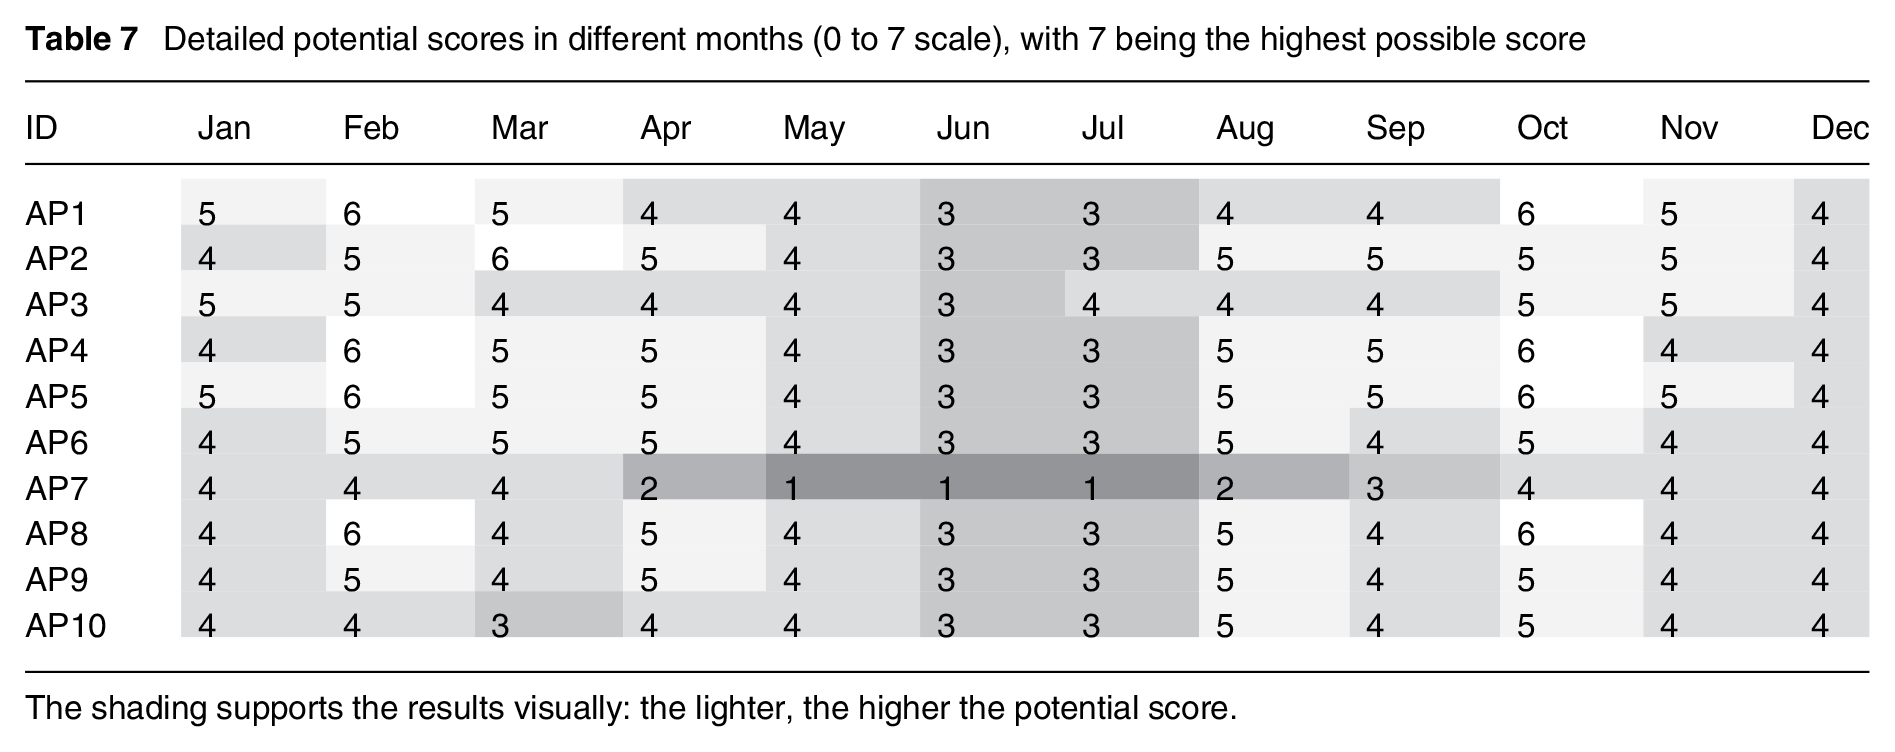
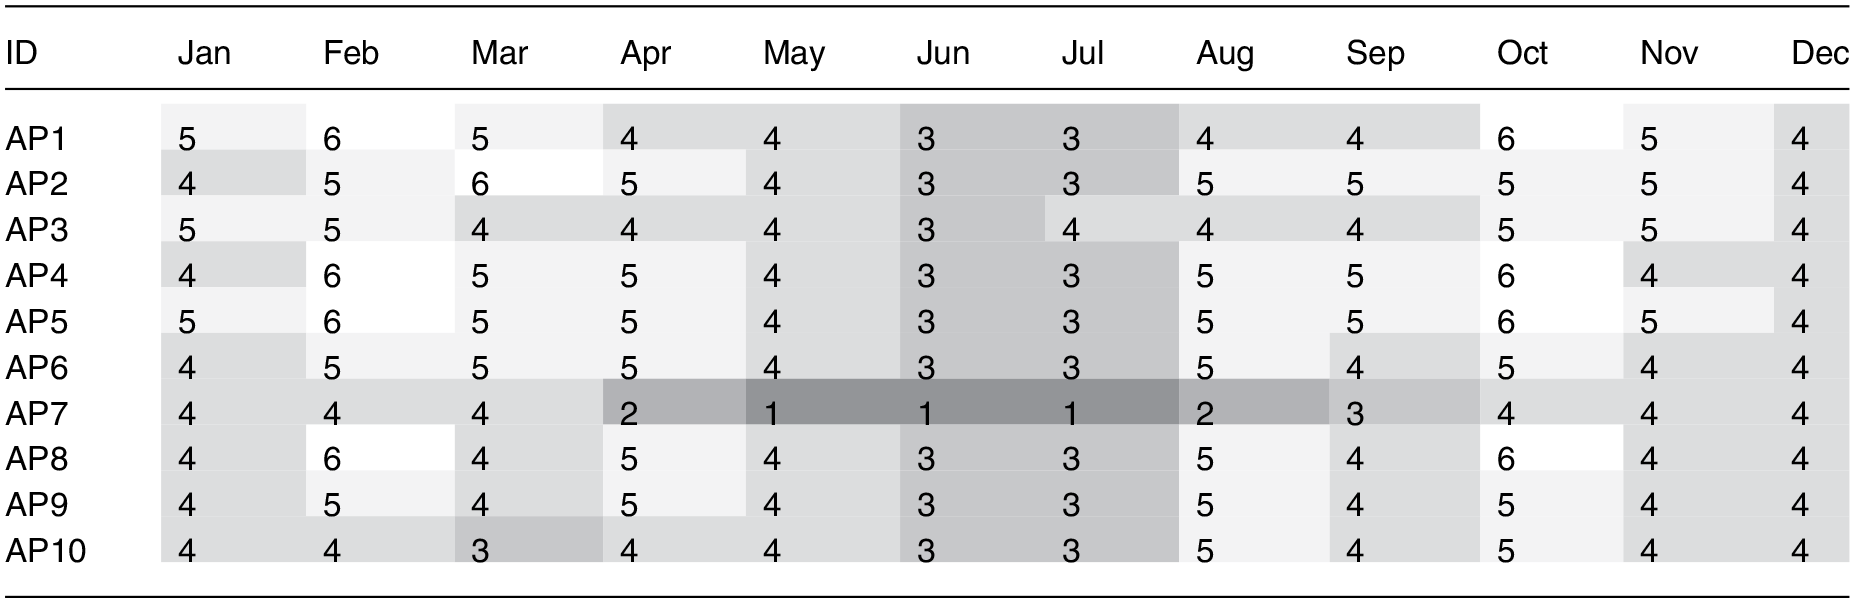
The shading supports the results visually: the lighter, the higher the potential score.
3.4 Daylight potential and well-being
According to the p-values collected from the paired-sample t-tests performed on the general well-being score, little to no relationship could be found between apartment daylight potential scores and the collected well-being metrics (Table 8).
Paired-sample t-test results between low and high daylight potential apartments
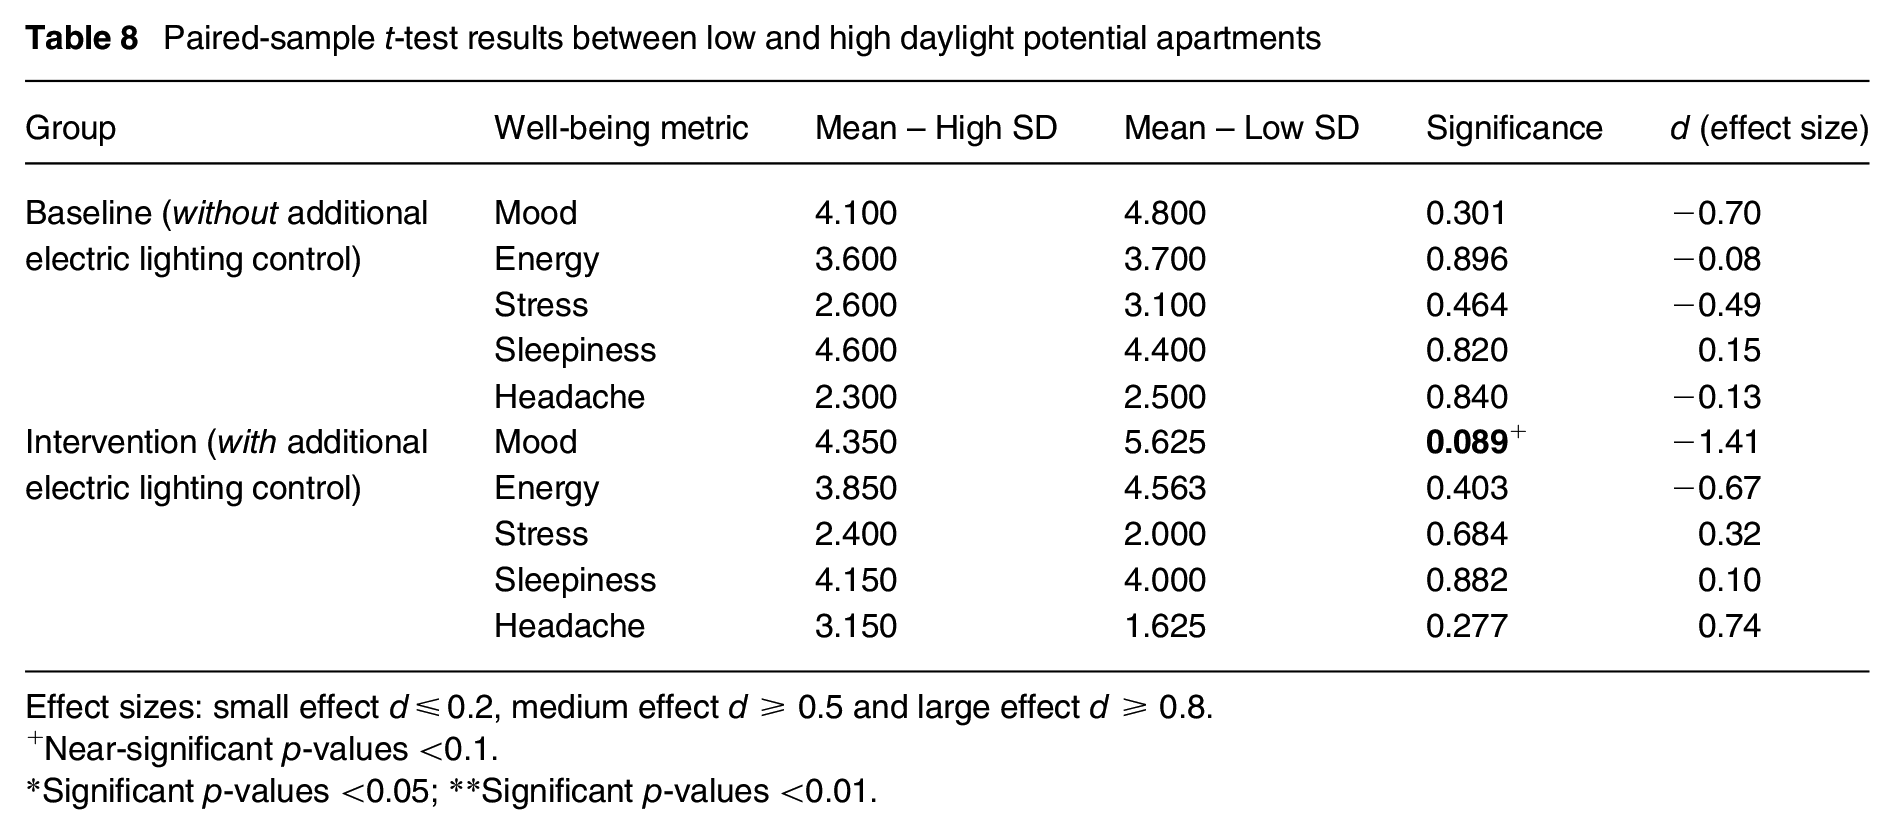
Effect sizes: small effect d ≤ 0.2, medium effect d ≥ 0.5 and large effect d ≥ 0.8.
Near-significant p-values <0.1.
Significant p-values <0.05; **Significant p-values <0.01.
However, the results from the paired-samples t-tests performed on the standard deviations of the well-being scores show a very significant difference (p = 0.009 < 0.001) for ‘mood’ and a near-significant difference (0.05 < p = 0.069 < 0.1) for ‘energy level’. The mean value for apartments experiencing a lower deviation in light exposure (M = 5.2, SD = 0.758) is higher than apartments with significant changes in the yearly daylight exposure (M = 3.7, SD = 0.570). The higher standard deviation values show that the apartment is experiencing a larger contrast between the daylight exposure for the dark and bright months of the year.
Comparing the situation during Baseline (without additional lighting control) with the Intervention (with additional lighting control) suggests that the application of controlled electric lighting eliminated the significant differences in self-assessed well-being scores. See both Tables 8 and 9. It should be noted that the study is a pilot study with a small sample size and potentially not enough statistical power, which increases the risk for Type II errors.
Paired-sample t-test results between apartments with low and high Standard deviation (SD) in light exposure
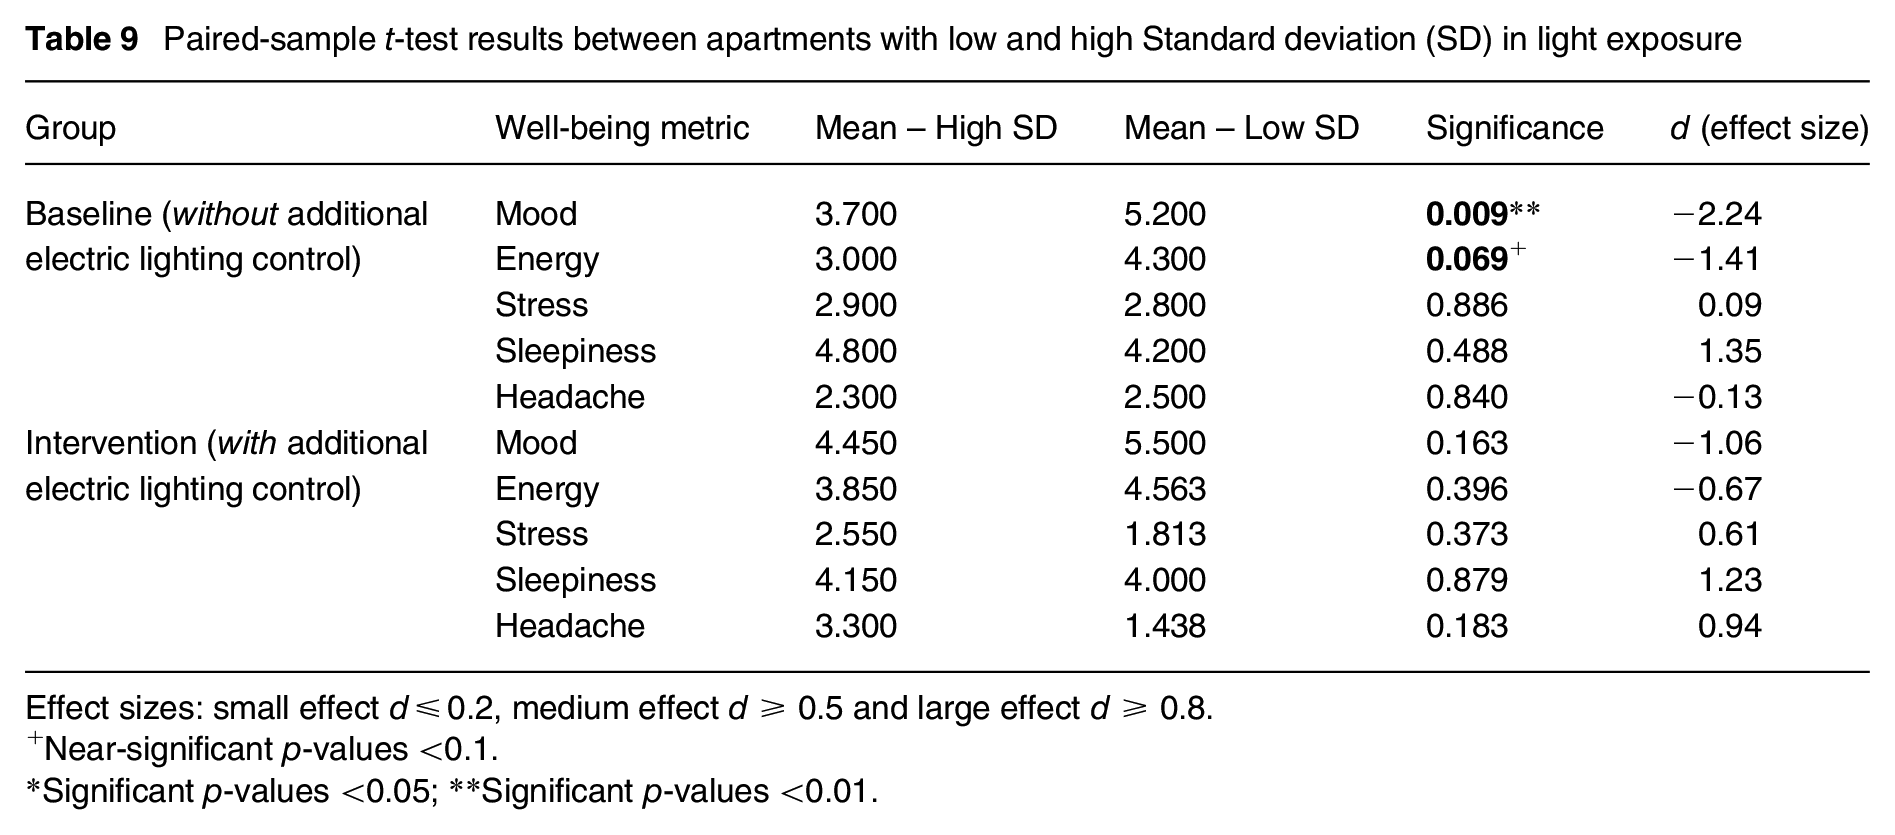
Effect sizes: small effect d ≤ 0.2, medium effect d ≥ 0.5 and large effect d ≥ 0.8.
Near-significant p-values <0.1.
Significant p-values <0.05; **Significant p-values <0.01.
4. Discussion
The study investigated different apartments’ yearly daylight exposure potential and the correlation with the occupants’ self-reported psychological health evaluations during winter. The results show variations of light exposure for apartments in different seasons, which will be discussed in general and for seasonal differences.
4.1 Difference between daylight potential scores
Previous studies (e.g. Dogan and Park, 51 Kong et al. 52 ) tried to quantify the ideal daylight situation in residential buildings based on different seasons. However, the used metrics only consider visual comfort and do not include effects beyond vision. In this study, both visual effects (general) and effects beyond-vision (task-specific, time-based) scores were included and were considered equally important.
Understanding the lighting situation in different apartments and quantifying whether an apartment has ‘high’ or ‘low’ daylight potential is challenging. As shown in several studies, there are many factors which affect daylight exposure in a residential environment: location, layout and orientation of the apartment, window characteristics and placements, surrounding buildings and factors that are highly dependent on occupants, such as choice of shading/window covering and furniture layout.52–54
In this study, the location of all apartments is at a latitude of 57°N. A major difference can be noticed between the light received from the North, North-East and North-West, compared to light received from the East, West, South-East and South-West. It can be observed that spaces with windows generally facing North receive less intense daylight in comparison to rooms facing South, East and West, which is in line with an investigation by Dubois and Flodberg 55 studying lighting situations at high latitudes. Apartment AP3 receives the highest amount of daylight from the North, resulting in the apartment generally being exposed to less daylight and a ‘low’ daylight score. In contrast, AP4 receives the largest daylight portion from the South, which, according to prior studies, is the direction most prone to excessive light and glare at higher latitudes. 55 It resulted in metrics such as ASE contributing to a lower general score for this apartment, placing it as the second apartment with the lowest daylight potential.
The layout of the apartments contributes to spaces being generally brighter or darker and the time when each space receives peak daylight. For living rooms, several apartments (AP1, 2, 3, 4, 7, 9, 10) receive the daylight peak around noon, whereas for one (AP5), the daylight peaks early in the morning and for two (AP6 and AP8), it peaks in the late afternoon. For the kitchen, similar apartments (AP1, 2, 3, 4, 6, 9, 10) receive daylight peak around noon, and for two (AP5 and AP7), the daylight distribution is skewed towards the morning. For AP8, the peak happens in the late afternoon, similar to the living room. Generally, most apartments (AP2, 5, 9, 7, 10) receive most of the daylight in the morning. Apartments AP6 and AP9 reach the daylight peak around noon, and apartments AP1 and AP8 receive most daylight in the late afternoon.
Regarding circadian rhythms and phase-shifting, how (day)light exposure affects the human body is relative to when and how long eyes are exposed. Excessive daylight exposure in rooms before sleep and during the night can cause disruptions in the body’s sleep–wake cycle since it may cause a phase delay.47,49 Therefore, daylight peaking in the late afternoon, particularly in the bedroom, contributed to lower scores regarding effects beyond vision. It explains why AP8 has low task-specific/time-based scores despite maximum general daylight. Most adults will not go to bed in the afternoon, but young children may go to bed already around 18.00 and can be strongly affected. Akacem et al., 56 found that melatonin secretion of small preschool children (3 years to 5 years) responded strongly to an increase in light level. In the follow-up study, the children were exposed to 1 h of bright light exposure after dim light exposure before habitual bedtime. 57
Certain differences in daylight potential score cannot be explained by location, floor plan or window organisation. Nevertheless, the lighting situation in an apartment can affect tenants’ decisions for furniture placement. Prior studies by, for example, Kong et al. 52 and Day et al. 58 showcased the complex relationship between the occupant, daylighting design and occupant decisions influencing manual shading or furniture placement. Visual inspection of furniture arrangements in the current situation showed that occupants in darker environments (i.e. AP3) placed their furniture in a way that exposed them to as much daylight as possible, with furniture facing the windows. On the contrary, in a brighter apartment (i.e. AP7), most furniture is placed to face away from the windows.
Nonetheless, it should be noted that furniture placement is not only affected by the daylight situation in the apartment; factors such as spatial limitations, accessibility, electrical outlet placements and thermal comfort can be deciding factors for furniture placement. Residents can use shading or curtains to limit thermal discomfort or glare, and not raising blinds or opening curtains influences exposure later. It opens the discussion for future studies to investigate how interior renovations and the use of (sensor-driven) control can increase the daylight potential in apartments, affecting both visual and effects beyond vision.
4.2 Monthly daylight situation in different apartments
The difference in light exposure between apartments during the day and in the morning is comparable in winter, specifically for January and December, whereas in spring, summer and autumn, the difference between light exposure for all apartments increases. The task-specific/time-based daylight simulation results are comparable in winter, when it is generally dark, and in summer, when it is generally brighter. This consistency may explain why no difference was found when correlating the apartments’ daylight potential and self-reported well-being in the first two weeks of the field study. Another contributor to this lack of correlation might be the need for a scaled average in scoring apartments that is tailored to each well-being factor. Different health factors might be more sensitive to different light metrics. For example, ‘sleepiness’ can be more affected by mEDI in the bedroom than ASE; therefore, this paper calls for future research on this topic. During this period, there was no additional electric lighting. In the second part of the field study, additional electric lighting during twilight (dusk/dawn) may have positively affected the well-being experience. However, this cannot be the entire explanation as the results from the t-test show a significant difference in ‘mood’ and a near-significant difference in ‘energy level’ between the groups when looking at the standard deviation of light exposure over a year for both the Baseline period. The significant p-values for ‘mood’ and the near-significant relationship for ‘energy level’ are no longer significant after installing pre-programmed lighting control. The experience of a generally more significant contrast between the daylight exposure for the dark and bright months of the year contributes to some well-being experience, but additional electric lighting may have reduced the contrast.
A previous study by Adamsson et al. 33 indicated a significant seasonal variation in ‘mood’ between winter and summer, with summertime showing higher mood ratings. Furthermore, in line with the results, a study by Davoodi et al. 59 showed how the perceived seasonal daylight situations by the occupants, measured in other seasons, are varied from the ones measured during the actual season. It can explain the results acquired in this project, knowing that the self-assessed well-being survey was taken only during winter when less light exposure is provided to the tenants. Overall, the lower ‘mood’ scores in the reported results with lower light exposure changes can be explained by several justifications. The occupants of the apartments with lower daylight changes – also including apartments that receive an overall less daylight exposure – might have generally spent more time outside. Furthermore, the overall mood and energy level during winter months can be affected by the amount of daylight exposure the tenants experienced during summer. Besides, it seems that, next to circadian rhythms, humans have circannual rhythms, 60 which need to be considered.
4.3 Limitations
Several limitations of the simulation study conditions need to be considered. The study compared only 10 pre-selected apartments based on their largely comparable floor plans. All apartments were located in the same geographical location. A larger variation of apartments and locations may have given different results. A different geographical location would have influenced the daylight availability during the preferred exposure hours. Sweden experiences long photoperiods during the summer and short ones during the winter, whereas, for example, a location in Southern Europe has more equal periods throughout the year.
In this study, the survey filled out by the occupants was during winter when the daylight potential and the daylight exposure of different apartments were most similar, making it difficult to distinguish a correlation between the survey and the simulation results. Besides, the sample size in this study is small, and a similar investigation with a larger group of people with a repeated moment of questioning may have given a larger spread in answers. Additionally, no data were collected on occupants’ behavioural patterns to understand the exact light exposure during the survey and how much time was spent indoors, which can be different for each occupant, even though often much higher in winter rather than in summer. No weighting was or could be applied (yet) to rank visual over beyond-visual (or reverse) contributions to the daylight potential. In fact, reported well-being scores can be caused by visual or beyond-visual cues or a combination of both.
Furthermore, there are some limitations associated with the daylighting simulations that were performed. Due to the need for shorter simulation times, the surrounding buildings were omitted, and the resolution of some parts of the geometry was reduced, affecting the accuracy of the results. Moreover, the SPD of the sky dome was set to the CIE standard illuminant D65, the default choice in the Lark plugin, not exactly reflecting the spectral properties of the changing sky conditions throughout the year for the actual context. Besides, not only visual and beyond-visual light conditions, but also for example, the experienced visual comfort, including glare, affects human health and well-being. Metrics to assess discomfort or disability glare are currently not included.
All metrics, including those used in the LEED standard, sDA and ASE, are based on certain assumptions and, therefore, associated with uncertainties which can aggregate. Although ASE can be used as a single metric for taking both glare and excessive temperatures into consideration, direct sunlight can be beneficial in residential buildings 61 as exemplified by requirements in, for example, the European standard EN17037:2018+A1 2021. 62 Therefore, other metrics specifically focusing on glare in daylit environments, such as Daylight Glare Probability, 63 should be assessed and compared with the metric used in the current study. Moreover, the time of excessive UDI in this study was rather low (0% to 11.5%), suggesting that the high values of ASE may overestimate the issue of glare in the apartments.
The main metrics used within this paper were based on the LEED standard 50 and recommendations by Brown et al., 47 for a more comprehensive study, metrics from other standards such as the (new) daylight standard, BREEAM or other national standards can be included in the investigation. Metrics for assessing daylight provision in residential buildings, stated in standards such as the standard EN 17037:2018+A1 202162 and BREEAM-SE (v6.0), 64 should be evaluated in a future study. For example, EN 17037:2018+A1 202162 requires that a room fulfils certain illuminance levels for certain parts of a room and for a certain time in relation to the time of daylight hours at the site (300 lx for 50% of the room area and 100 lx for 95% of the room area, for 50% of fraction of daylight hours).
Another possible limitation associated with the current study is that the perimeter points of the simulation grid have not been excluded, in contrast to the recommendation in EN 17037:2018+A1 2021. 62 It means that the impact of high values, close to window, as well as low values, close to walls further into the room, has not been excluded in the simulations.
In the current study, a weather file in the ClimateStudio software was used for the daylight simulations. Using the Copernicus Atmosphere Monitoring Service 65 would have offered data for the actual weather conditions for the period when the participants conducted the subjective assessments of their well-being.
5. Conclusions and suggestions for future research
This project investigated the daylight potential in 10 different apartments and explored the relation between the (yearly) light situation in the apartments and the self-reported well-being metrics collected from the occupants in wintertime.
The daylight exposure and potential of the apartments are different based on their location, layout and window characteristics, indicating the amount and distribution of daylight as well as the time and duration of when daylight is available in the space. However, furniture placement is a contributing factor to daylight exposure. Furthermore, a high daylight exposure does not always mean a better daylight potential, as both apartments with ‘low’ and ‘high’ daylight exposure received low scores.
The study indicates that, at high latitudes with significant differences in daylight availability between different seasons, the variations of light exposure for apartments are more similar in winter than in spring and summer. Furthermore, a possible correlation between the apartments with ‘low’ and ‘high’ daylight exposure changes during a year shows a statistically significant relation with ‘mood’ and a notable correlation with the occupants’‘energy level’. In winter, apartments with lower yearly daylight changes show higher self-reported ‘mood’ and ‘energy level’ scores.
The findings suggest further investigation, with surveys filled out during summertime and behavioural patterns of occupants monitored. Possible future studies can be comparable field studies where results of the surveys are reported and compared during different seasons with a larger sample, a more considerable variation in resident typology, an investigation on the possible increase in daylight exposure for apartments with changes in the interior design or window properties (e.g. increase in visual transmittance of the glazing), and by studying the relationship between daylight potential of apartments and the time occupants spend outside.
Supplemental Material
sj-docx-1-lrt-10.1177_14771535241268606 – Supplemental material for Daylight potential of Swedish residential environments: Visual and beyond-vision effects and the relationship with well-being assessment
Supplemental material, sj-docx-1-lrt-10.1177_14771535241268606 for Daylight potential of Swedish residential environments: Visual and beyond-vision effects and the relationship with well-being assessment by E Rastegari, MR Adamsson and MBC Aries in Lighting Research & Technology
Footnotes
Acknowledgements
The authors would like to thank the participants in the field study for their input.
Declaration of conflicting interests
The authors declared no potential conflicts of interest with respect to the research, authorship, and/or publication of this article.
Funding
The authors disclosed receipt of the following financial support for the research, authorship, and/or publication of this article: The SMILE (SMart Illumination in Living Environments) project is funded by the Swedish Energy Agency (project P45185).
Supplemental material
Supplemental material for this article is available online.
References
Supplementary Material
Please find the following supplemental material available below.
For Open Access articles published under a Creative Commons License, all supplemental material carries the same license as the article it is associated with.
For non-Open Access articles published, all supplemental material carries a non-exclusive license, and permission requests for re-use of supplemental material or any part of supplemental material shall be sent directly to the copyright owner as specified in the copyright notice associated with the article.