
Abstract
Light absorbed by sensitive artwork may cause irreversible damage. Optimising the spectral power distribution of light sources to minimise absorbed light can reduce damage while maintaining the colour appearance of the artwork. Previous absorption-minimisation studies used optimisation methods without comparing their performance. Here, three-channel LED-augmented reality projector spectra were optimised for 24 colour samples using a brute-force (BF) and multi-objective genetic algorithm (MOGA). The BF search and MOGA performed similarly in achieving optimal results, reducing both light absorption and energy consumption by almost half. However, MOGA was 2.5 times faster than BF in finding optimal solutions. The results indicate that an LED RGB projector can be used to illuminate museum artefacts to reduce light absorption and energy consumption, with the caveat of perceptible colour shifts in some of the colour samples. Future research will investigate observers’ subjective evaluations of artwork under optimised lighting.
1. Introduction
Lighting is an important environmental factor in museums and galleries due to its role in initiating vision for people, causing damage to artwork and consuming energy.1–5 Despite the complexity of designing lighting for museums and galleries, there is a dilemma between visibility and damage to art. When light falls on the surface of an artwork, it is reflected, transmitted (if the surface is transparent or translucent) or absorbed. Depending on the type of the material and its responsivity to exposure, light can cause both visual changes (e.g. saturation, hue, yellowing or darkening of the material) and non-visual changes (e.g. increase in brittleness). The ideal conditions to prevent damage to artwork would be the total lack of environmental factors (darkness), which would negate the display of art. This conflicting relationship underlines the trade-off between visual appearance and damage in conservation and museum lighting applications.
The International Commission on Illumination (CIE) recommends categorising commonly found museum materials into four categories based on their responsivity (irresponsive, low responsivity, medium responsivity and high responsivity) and limiting light exposure to control damage. 6 Although this approach is not universally recognised or adopted, it provides a coarse approach to protect artwork. According to the Grotthuss-Draper law, only the light absorbed by a substance can cause chemical change or damage and not all the light falling on the substance will necessarily cause chemical change since some of the light can be re-emitted in the form of heat or light. 7 The energy from the absorbed photons can raise molecules’ ground energy state to a higher excited energy state. 8 Most of the excited molecules will rapidly return to their ground state, re-emitting the absorbed energy as radiation of the same or lower energy or as heat. A small portion of excited molecules undergoes irreversible changes, leading to chemical alteration and degradation or they promote such reactions in other molecules of the material. 8 Thus, the amount of light absorbed by the material and hence the deterioration depends on the energy of the radiation, exposure, the spectral absorbance properties of the colourant and the sensitivity of the material.6–10 Energy of the radiation or source spectrum effects have been historically quantified using the Harrison damage curve, which indicates that the energy in shorter wavelengths has more potential to cause damage compared to the energy in longer wavelengths. 7 For example, if red and blue pigments are exposed to ultraviolet B (UVB), the red pigment under UVB will be damaged more than the blue pigment since most of the incident lower wavelength radiation will be absorbed by the red pigment.2,9,11–13
Damage to highly responsive materials (e.g. low-grade paper, textiles, watercolours on rag paper) can be reduced by optimising the light source spectrum to the reflectance factor of the material so that there will be a minimum light absorption and maximum reflection. 14 Integrity of the appearance of the artwork is another crucial consideration in the display of art. Historically, many artists painted under daylight or lamps that operated on the principle of incandescence, such as kerosene lamps (e.g. kerosene lamps). Today, the museum environment is very different due to modern light sources (i.e. solid-state devices) that emit spectra different from incandescent or daylight. The changes in lighting equipment can be challenging for conservators, museum lighting designers and curators to balance the needs of conservation and visibility, and successfully deliver an artist’s original intent.1,15–20
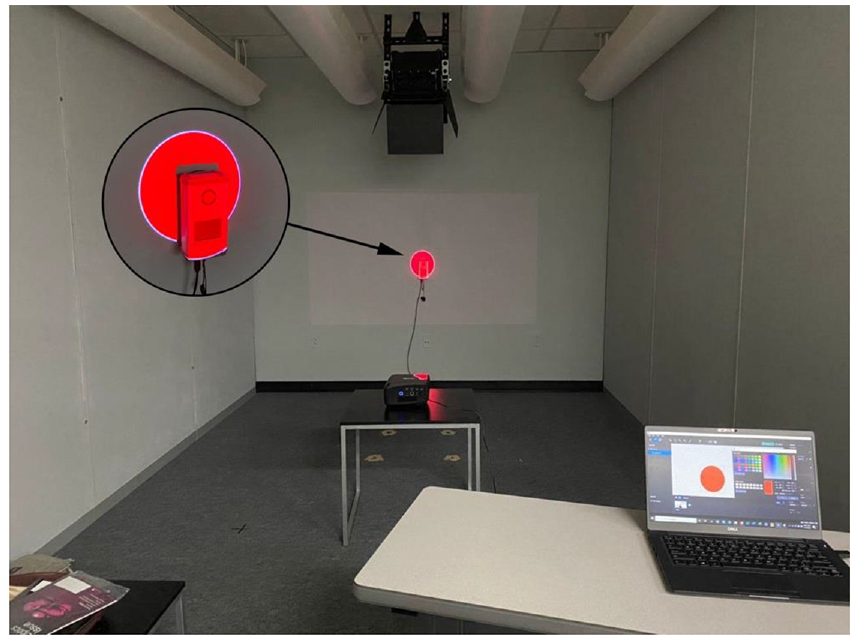
Based on the understanding of the effect of light on art, researchers proposed mathematical models and tool,21–30 investigated the optimisation of theoretical and commercially available spectra for conservation using different techniques.11,14,31–37 Among many lighting technologies used to optimise light source spectra, multi-primary LED light projectors offer advantages in spatial and spectral optimisation over traditional architectural light sources (Figure 1). In recent years, several researchers used multi-primary (e.g. RGB) light-emitting projectors to address museum lighting challenges, such as reducing damage or increasing visual comfort and interest.11,31,32,36,38–41 Results suggest that energy consumption (EC) and damage caused by lighting could be reduced by half if spectrally and spatially optimised light is projected onto light-sensitive artwork without causing perceptible colour shifts in its appearance. Despite the potential for damage reduction, some researchers found limitations in the energy savings due to the low device efficiency but confirmed colour enhancement gained by projection mapping.41–43 It should be noted that the optimisation method uses spectral reflectance as a proxy for damage based on current scientific understanding, and does not consider other chemical processes that might affect damage to pigments.
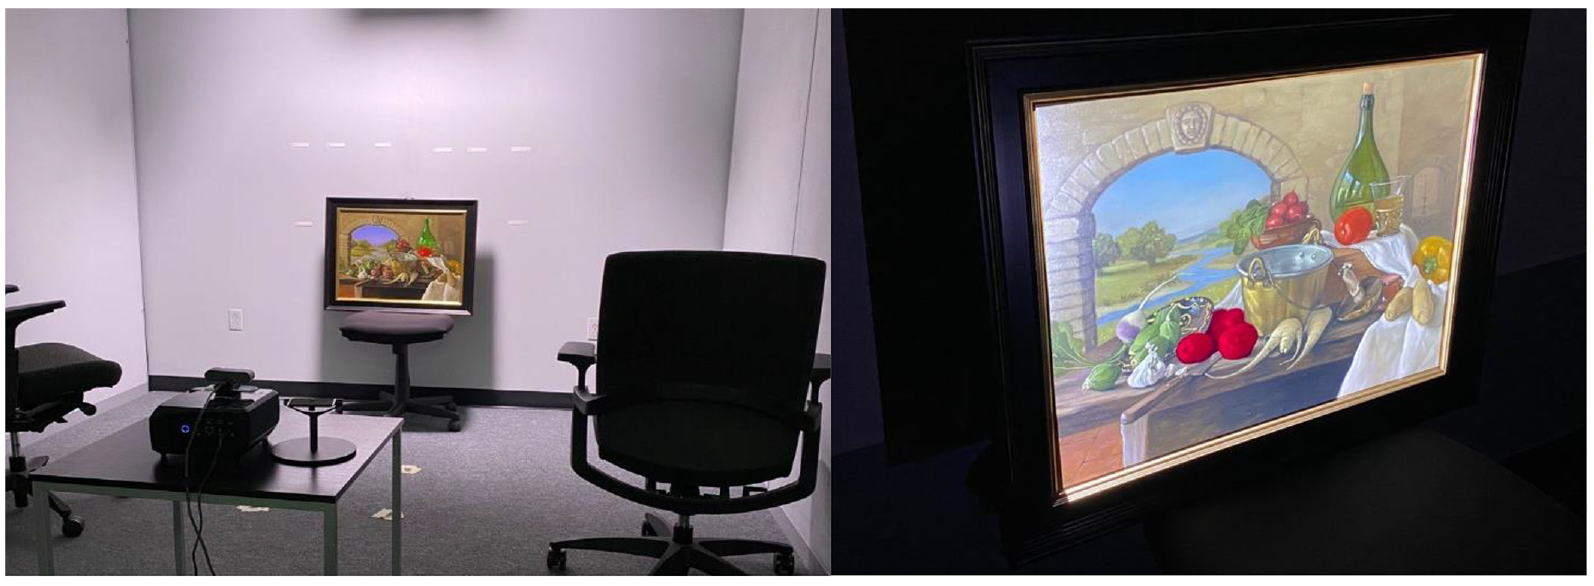
Projectors can be used to emit spatially and spectrally tailored light to a painting. (Left) A painting is illuminated with both ambient illumination and an augmented reality (AR) projector. (Right) The same painting is illuminated with an AR projector without any ambient illumination to enhance the saturation of the brown vegetables next to the knife
Despite the growing interest in virtual restoration and damage prevention for artwork through augmented reality (AR) and projection mapping tools,43–47 the performance of optimisation techniques has not been systemically analysed. In this study, an RGB LED AR projector is used to generate test spectra to illuminate 24 colour samples without causing a change in the appearance of the painting or increasing light absorption in the painting that can lead to photochemical deterioration. Here, the material-specific sensitivities are not taken into account, and instead, only the absorbed energy is used as a proxy measure of damage caused by light. Three target parameters (light absorption, colour difference and EC) are operationalised to optimise the spectral power distribution (SPD) of the RGB projector in an absorption-minimisation approach using a brute-force (BF) search and multi-objective genetic algorithm (MOGA). 48 The performances of these two methods are systemically compared in terms of time and optimal solutions.
2. Background
Irradiance (incident radiant flux per unit area, unit: W m−2) and duration of exposure (unit: h) are two factors that contribute to the total absorbed energy and thus the magnitude of photochemical action. Radiation of short wavelengths is likely to cause more photochemical action since it has greater energy per photon than longer-wavelength radiation. On the other hand, infrared (IR) radiation increases the surface temperature of an object, which may result in surface hardening, discolouration and cracking from accelerated chemical reactions. 7 To prevent damage, the CIE recommends filtering UV and IR radiation along with restricting the illuminance to 50 lx or lighting exposure to 150 000 lx h year−1 for medium responsivity materials and light exposure to 15 000 lx h year−1 for high responsivity materials. 6
In comparison to the effects of irradiance and exposure time, the effects of light source spectrum and object responsivity are more complex and intertwined due to the significant effect of the spectrum on visual perception. While short-wavelength energy is more damaging for artwork, filtering out energy in visible wavelengths can significantly reduce the visual quality of the artwork. Therefore, past research studies focused on identifying the optimal wavelength compositions to balance the visual and conservation needs. For example, Thornton
40
identified three spectral regions (around peaks at 450, 540 and 610 nm) that produced similar colour rendering as daylight illuminant but with higher relative luminous efficacy values. Thornton proposed designing light source spectra to maintain or enhance the colour-rendering properties of lighting while providing reduced irradiance compared to broad-spectrum sources. In the museum lighting context, Cuttle
11
suggested that it is possible to match visual satisfaction achieved from an incandescent source with just three-peak spectral bands with significantly less irradiance. Cuttle conducted an experiment which demonstrated that a practical light source for museum lighting could be developed that could deliver equal visual satisfaction at the same illuminance level as incandescent while keeping incident irradiance significantly low. Later, Berns
34
investigated the feasibility of designing a three-primary LED source that yields the same colour rendering as the CIE Daylight 6500 K (D65) illuminant and evaluated the colour appearance of acrylic paints under three-peak optimised light sources against the CIE D65 reference illuminant. The optimised spectra yielded reduced damage from irradiance with the average colour difference ΔE00, avg < 1.0, and luminous efficacy of radiation (LER) was between 279 lm W−1 and 340 lm W−1. Schanda et al.
49
optimised a combination of four LEDs (red, green, blue and warm white) to illuminate 26 pigments of a painting as seen under daylight. The optimal solutions provided an average colour difference of
Based on the absorption-damage correlation, Miller
52
proposed a metric (reflected energy matching factor) that quantifies the match of the illumination colour to the reflected colour of an artefact. The reflected energy matching factor was designed to be proportional to the lifetime of the object under a light source compared to the daylight. However, matching light source spectra to reflected light (RL) spectra can cause large colour shifts in the appearance of the artwork. In response, Durmus and Davis31,53 proposed detecting the spectral reflectance functions of an object and optimising the incident SPD for each colour to minimise the absorption while maintaining the visual appearance of the object. In addition, the absorption-minimisation approach also considered the energy consumed by light sources – a topic which is gaining increasing interest and importance in the museum environment.54,55 In their computational study, the colour appearance of 15 reflective samples was compared under test SPDs and reference SPD. Test SPDs had a base of two single wavelengths which were the starting points, and a single wavelength was iteratively added to each side of these starting points creating a larger bandwidth. The bandwidth of starting points was variable within the visible spectrum in odd intervals of 1 to 410 nm and not overlapping each other. The energy savings of up to 44% were achieved without any perceptible colour shifts. In a following study, visual experiments were conducted where observers did not find any difference in the naturalness and attractiveness of the objects under optimised test SPDs and reference phosphor-coated white LED spectra.
56
Abdalla et al.
57
added an element to the relative peak intensity of test spectra by dimming the spectral peaks at three levels: 70%, 40% and 10%. The study concluded that the light source with a custom theoretical SPD can be generated to minimise damage by reducing the amount of light absorbed (56%) by pigments and increasing its chroma (
Most of the absorption-minimisation studies have used customised theoretical test SPDs that are not commercially available. The exceptions include utilising solid-state lighting devices (including RGB LED projectors) and digital image processing to develop a point-to-point light distribution to reduce the damage to cave art and painting.33,58 Similarly, Durmus and Davis 59 optimised seven narrowband LEDs for damage, colour quality and energy efficiency using MOGA for five single-hue oil paintings. Gargano et al. 33 used four methods based on film slides and digital video projectors to test the ageing of medium and highly sensitive materials (e.g. drawing paper with pigments in an acrylic binder and acid-free paper with watercolours, respectively). Here, we compare the performance of the two most widely used and successful optimisation methods in artwork conservation studies: a BF search and a MOGA.
3. Methods
Since the quality of LED light varies widely and can have elevated rates of damage, the transition from incandescent lighting to LED lighting for museums is not prevalent. 60 Although LEDs are being widely accepted, the incandescent light source is still considered a benchmark for its colour-rendering quality, warm appearance and full spectrum nature. 4 The standard illuminant A, representing a typical tungsten filament lamp, is widely used as a reference in colourimetry (e.g. colour rendition metrics, such as CRI and TM-30). Therefore, the CIE standard illuminant A, scaled to match the total power output of the AR LED projector (Lightform LF2), was used as the reference light source. The tabulated spectral reflectance functions of 24 Macbeth ColourChecker samples (Figure 2) were used in the optimisation process to represent several colours used in paintings.
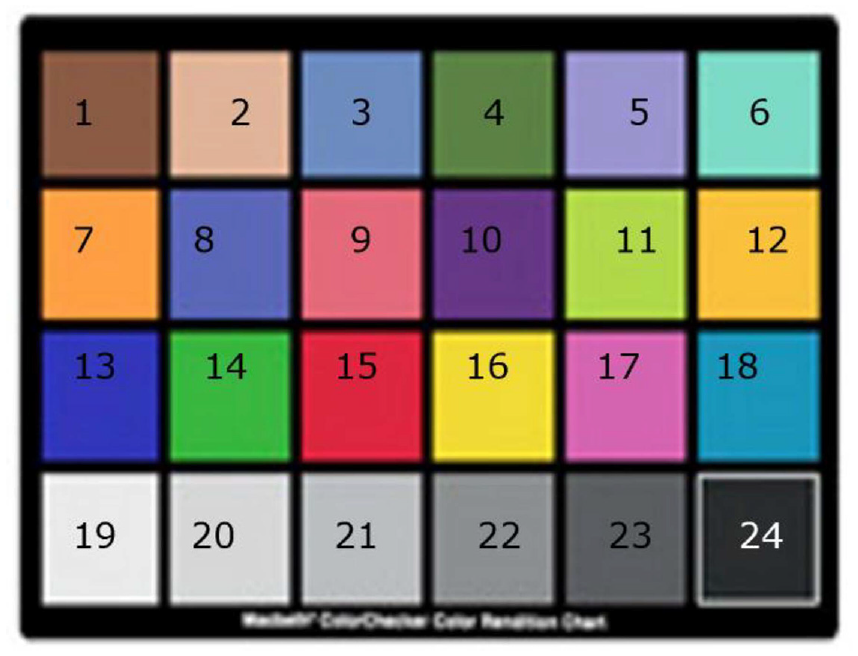
Macbeth ColourChecker colour samples
A computational algorithm was developed to generate test SPDs using the limits of the projector software control (between 0 and 255 values for each channel). The spectral output of each RGB channel of the projector (Figures 3 and 4) was measured at full output (255) using a calibrated Gigahertz-Optik S-BTS256 spectroradiometer (Figure 5). Test SPDs were then mathematically scaled to calculate intermediary levels between 0 and 255. This study was conducted in the Department of Architectural Engineering at Pennsylvania State University in April 2021.
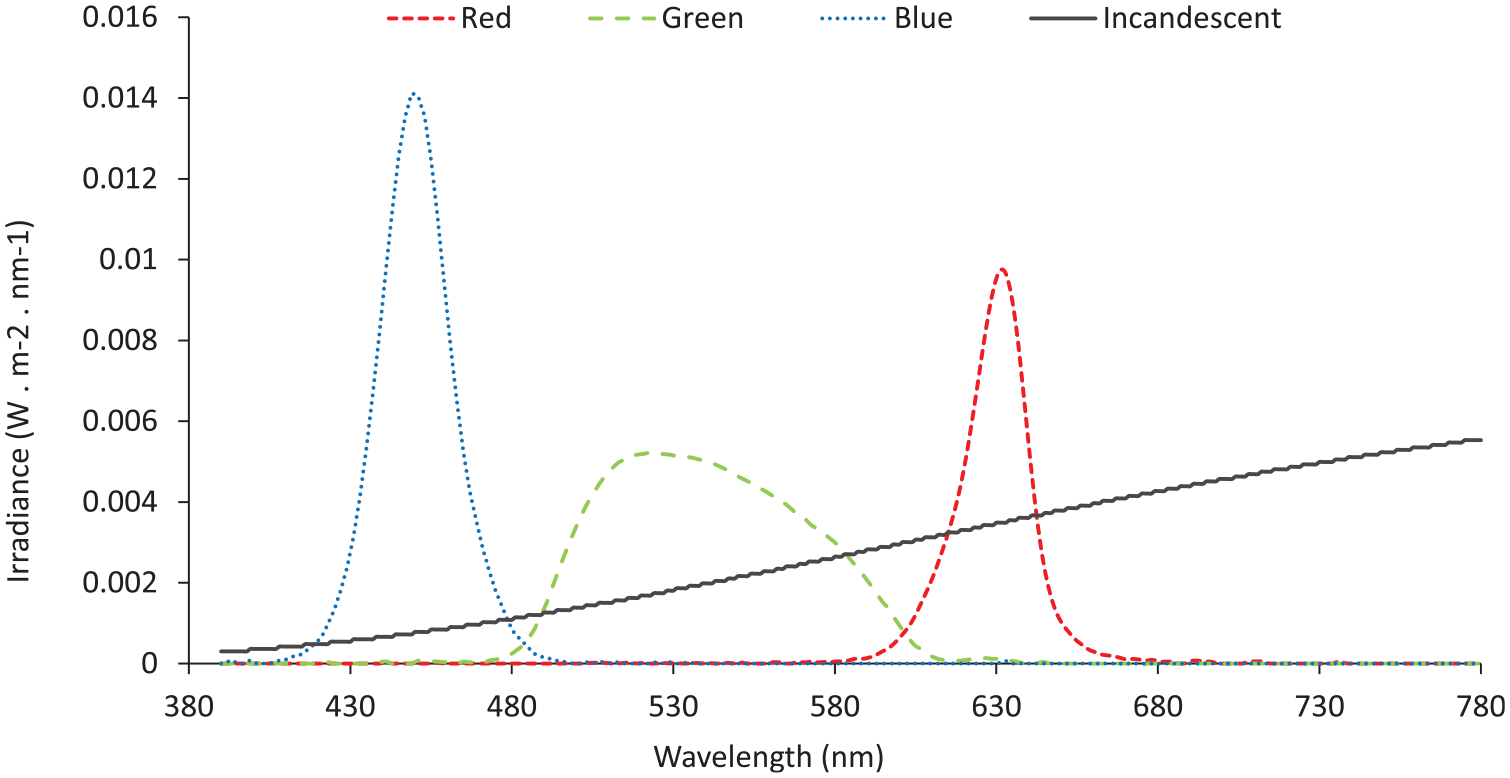
The RGB projector spectra showing the red (dashed line), green (long dashed line), blue (dotted line) primaries and the scaled standard illuminant A (straight line) used as reference
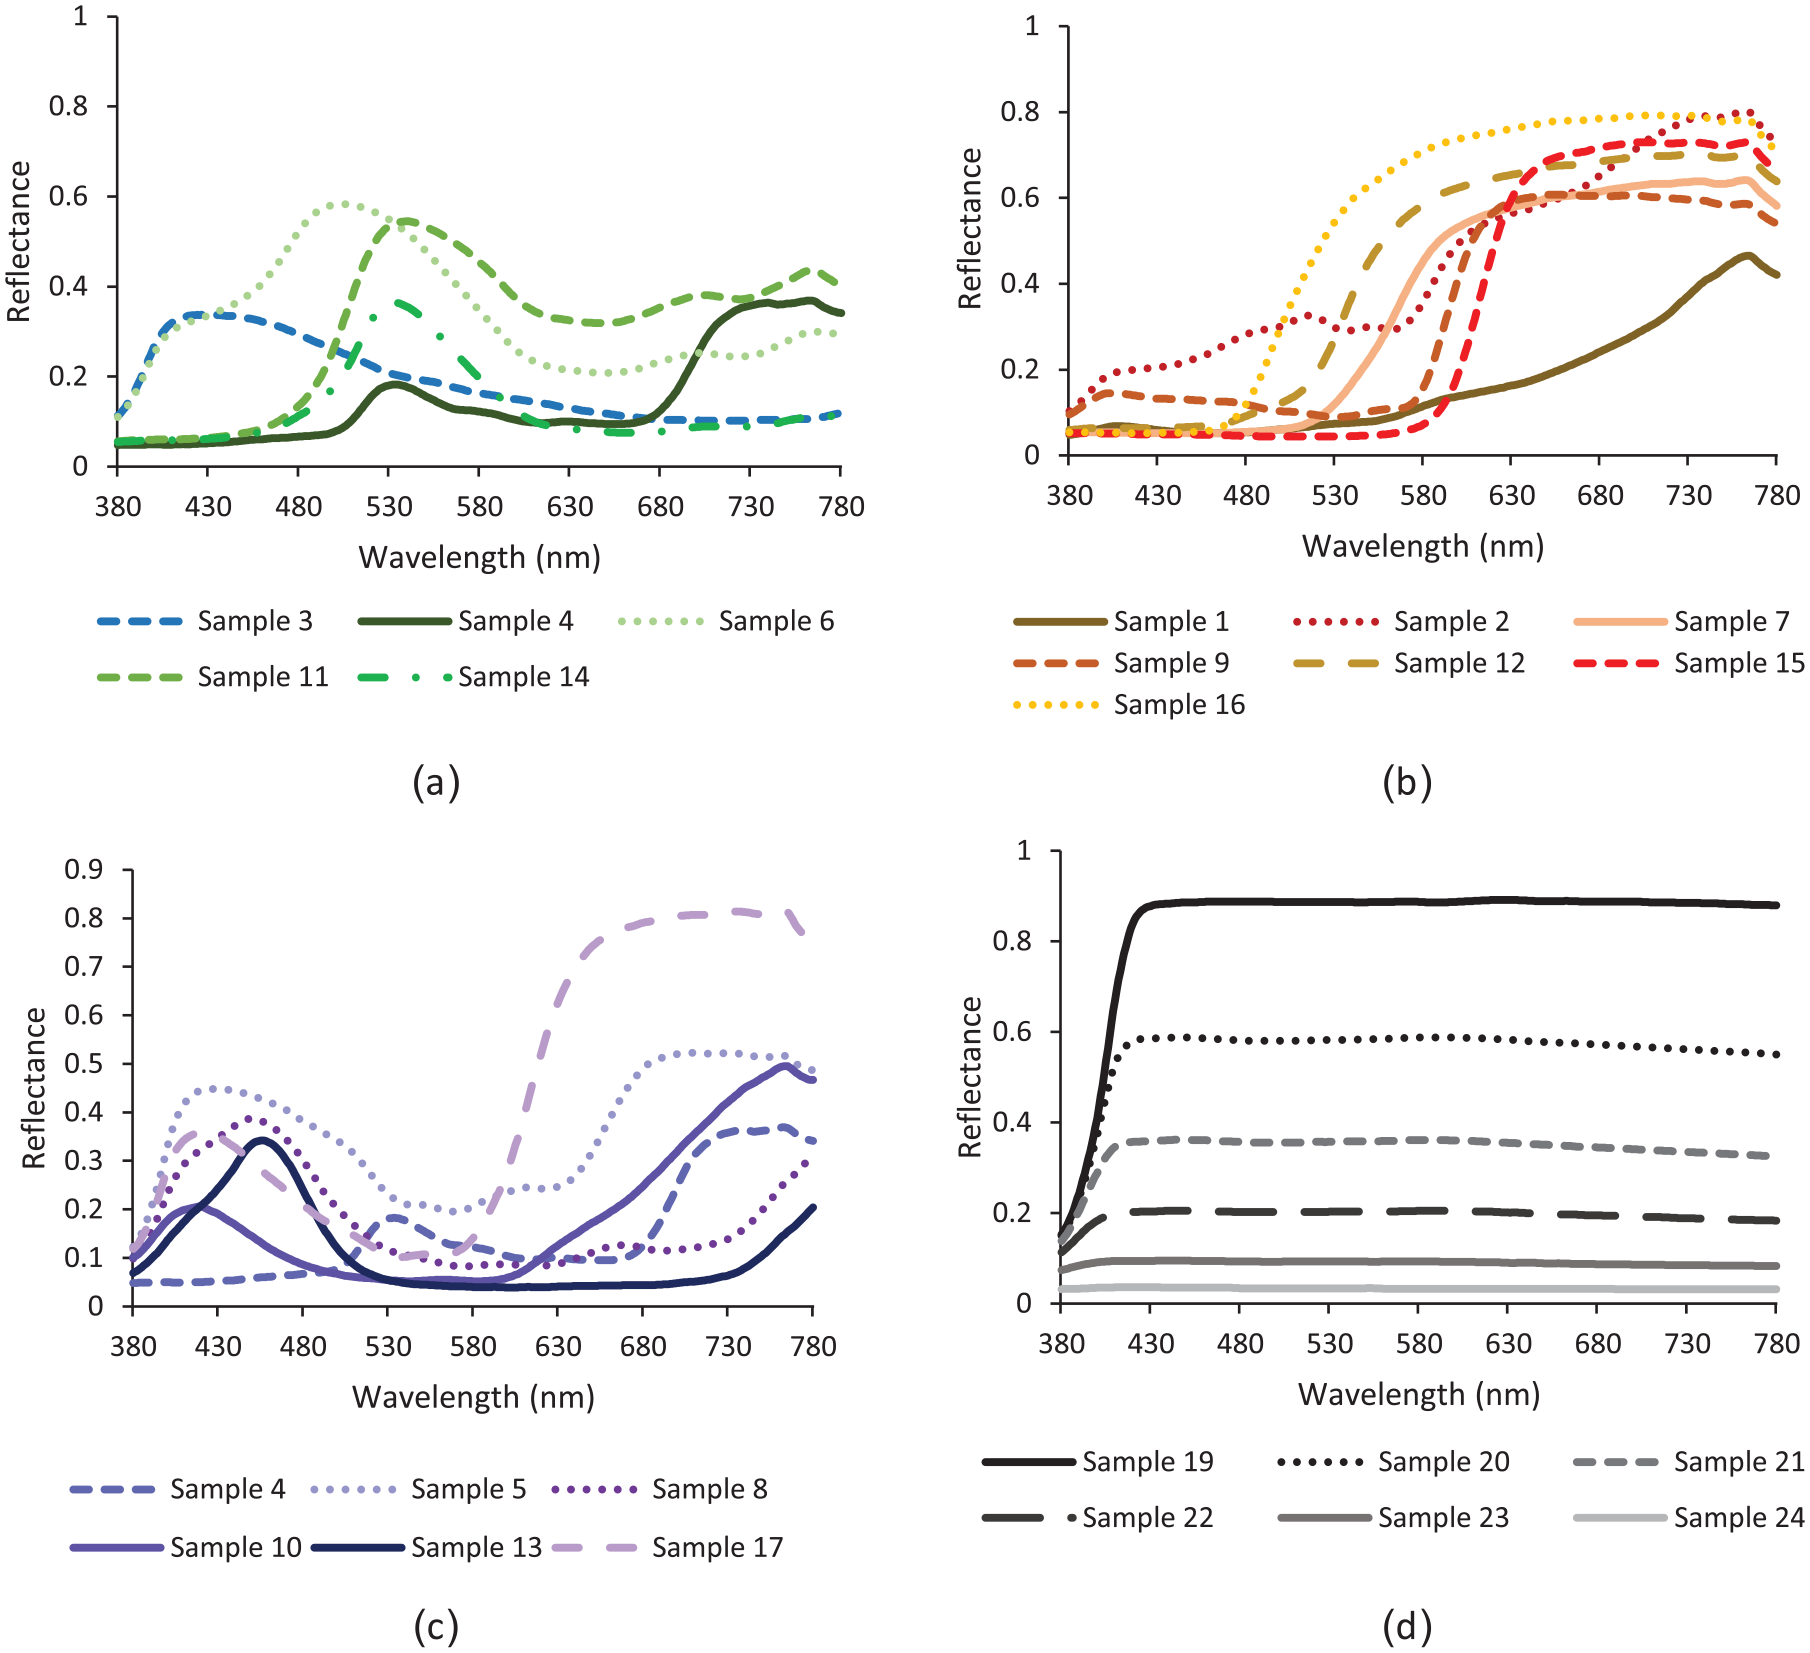
The spectral reflectance functions of the Macbeth ColourChecker samples are divided into four groups: (a) peak, (b) plateau, (c) peak + incline and (d) plain
RGB projector spectra were measured in the Lighting Lab using a calibrated (July 2020) spectroradiometer (Gigahertz-Optik S-BTS256)
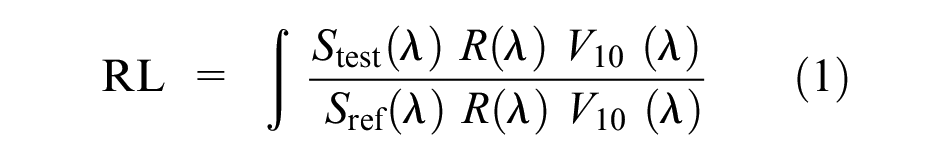
The RL ratio between the test and reference illuminant (i.e. the amount of RL from each sample under reference and test light sources) was kept similar to prevent luminance-based colour appearance phenomena, such as Bezold-Brücke hue shift 61 and the Hunt effect. 62 Maintaining the RL between test and reference conditions aims to ensure that reductions in absorbed light are not the result of reduced brightness. Total light reflected from a colour sample under a test SPD and a reference illuminant was set nearly equal, with a ±10% margin. The RL ratio was calculated as shown in Equation (1):
where
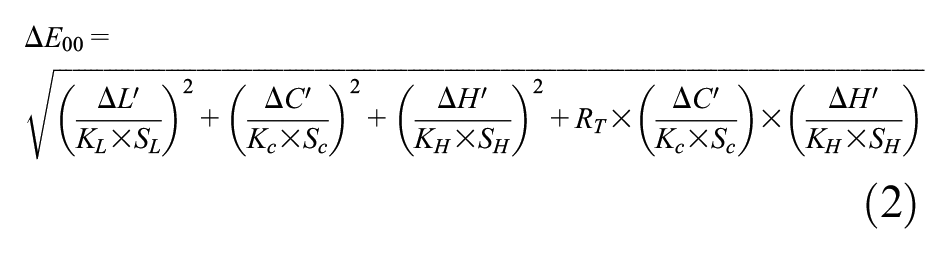
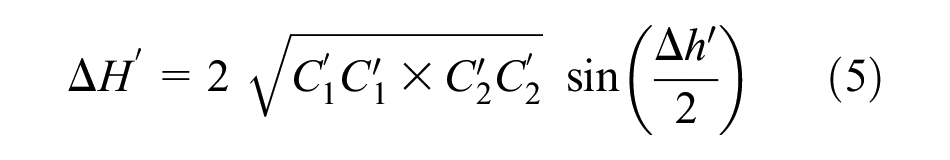
The optimisation was performed using two different methods: BF and MOGA. First, a BF search was performed to identify the optimal SPDs for each colour sample. The colour difference (ΔE00), light absorption and EC calculations were performed using MATLAB®. The time required to perform the calculations for each sample was also recorded. The data from the BF approach needed further filtering to find the optimum solutions and hence required more total time, which was not taken into consideration in this analysis. The colour difference (ΔE00) and hue (
where


where
Light absorption (A) was calculated as the ratio of the light absorbed by the sample under a test SPD to the light absorbed by the sample under the reference incandescent illuminant (Equation (6)) as a proxy of damage to artwork:
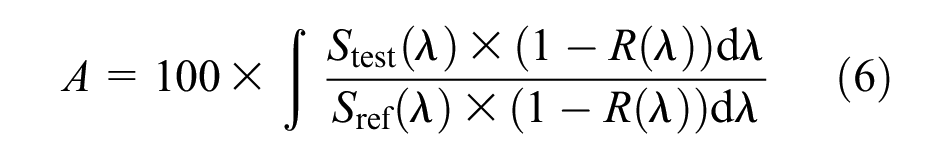
where
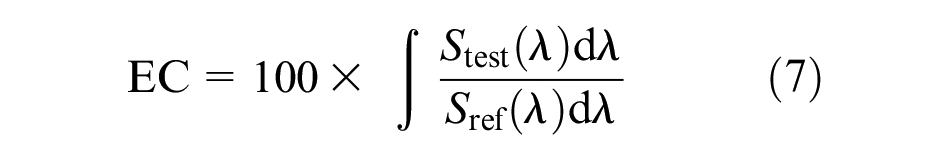
Both A and EC were compared to the reference incandescent illuminant and reported as a percentage. In the BF search, the two constraints were limited to A < 100 and EC < 100. The MOGA works on a population using a set of operators that are applied to the set of points in the design space. The set of points is referred to as the population, and the initial population is generated randomly by default. The next generation of the population is computed using the non-dominated rank and a distance measure of the individuals in the current generation. A non-dominated rank is assigned to each individual using relative fitness. 67 ΔE00, A and EC are the fitness functions with brightness ratio as a non-linear constraint. This optimisation problem can be stated as shown in Equation (8):

Subject to: A < 100
EC < 100
0.9 ≤ RL ≤ 1.10

where f(xi) is the minimisation function for objectives, subscript i denotes the number of channels (RGB).
The parameters in spectral optimisation studies are often in a trade-off relationship although they can exhibit more complex relationships. For example, energy efficiency is often found to be inversely related to colour rendition metrics,42,59 but adding more parameters to the optimisation process can significantly change the direction of this relationship. 31 Also, the order of the parameters can significantly affect the output, highlighting the importance of the number and order of the target parameters. 49
The optimisation in genetic algorithms continues until a group of solutions satisfying the minimum criteria is found, the fitness of the highest-ranking solution reaches a plateau or a fixed number of generations is reached. Zhang et al. found that for a polychromatic object, the energy-saving ratio of spectra increases as the number of generations increases from 1000 to 100 000 and hits a plateau after a 100 000-step evolutionary process. 35 Similar observations were found in this study at 400 generations and thus used as a constant variable throughout the study. The optimum results for each sample were recorded based on the lowest colour difference as the first criterion, followed by absorption and energy efficiency. The total time required by MOGA to find the optimum solution for each sample was also recorded, and the results were compared with the BF method.
4. Results
The optimised test SPDs resulted in 52% to 54% light absorption and 45% to 47% EC compared to the reference incandescent light source. However, there was a slightly noticeable colour difference of ΔE00 = 2.6 compared to the reference incandescent illuminant. The test illuminant is optimised to reduce emitting unwanted energy at a certain wavelength that is absorbed by the painting. This approach also reduces the energy consumed by the light source. Hence, A and EC were found to be directly proportional. Colour difference results for individual samples indicate an inverse relationship between colour quality and light absorption, where absorption increases with the decrease in the colour difference between samples under test and reference illuminant. The results are reported and analysed under four main topics as mentioned below. The dataset on which this paper is based is too large to be retained or publicly archived with available resources. The data that support the findings of this study are available from the corresponding author, upon reasonable request.
4.1 Colour difference
Results indicate that the optimisation process behaves differently for different colour samples. The average colour difference for BF was ΔE00,min = 2.4 without any constraints, whereas for MOGA average ΔE00,min = 2.8 when A and EC constraints were applied. When the data from the BF method was filtered for the least colour difference, 13 out of 24 colour samples had a colour difference below or equal to JND, whereas nine colour samples had ΔE00 between 1 and 5, and for the other four samples colour difference was ΔE00 > 5, as shown in Figure 5. The colour difference higher than JND for other samples might be due to utilising only three LED channels (RGB) to match the colour appearance while keeping the luminance the same from both reference and test illuminant. When the test SPD was optimised using MOGA for least ΔE00, A and EC, the average colour difference (ΔE00,MOGA,avg = 2.8) increased by 0.4 on average, whereas ΔE00 for colour sample 18 had a significant ΔE00 increase of 4. Colour samples 6, 7, 12, 14 and 18 had the highest colour differences under optimised SPDs. On the contrary, colour samples 13 and 24 had very low colour difference (ΔE00 = 0.04 and ΔE00 = 0.08, respectively). An independent samples t-test was conducted to compare minimum ΔE00 from BF and ΔE00 for optimised SPD from MOGA, and no significant difference was found (t(46) = 0.6855 < 2.014, p = 0.05).
4.2 Light absorption
On average, the minimum A for all colour samples in BF was 35% of the absorption caused by the reference illuminant with a large colour difference ΔE00,avg = 24. Filtering the BF data for minimum colour difference (ΔE00,avg = 2.45) increased the average A to 54%. When MOGA optimised test SPDs for ΔE00,min, A and EC, the average A was 50% and the colour difference was ΔE00,avg = 2.87. Light absorption in MOGA and BF for minimum colour difference ΔE00,min as compared to minimum absorption Amin in BF increased significantly as ΔE00 decreased. The minimum absorption Amin in BF, light absorption at ΔE00,min in BF and A from optimised SPD from MOGA for each sample and their corresponding ΔE00 were plotted for the comparison, as shown in Figure 6. The results for sample 6 were exceptionally different. Absorption A at minimum ΔE00 for colour sample 6 decreased significantly with MOGA without any significant change in ΔE00. However, when light absorption for 24 colour samples under BF (at ΔE00,min) and the MOGA method was compared using an independent-samples t-test, no significant difference was found (tA(46) = 0.6387 < 2.014, p = 0.05).
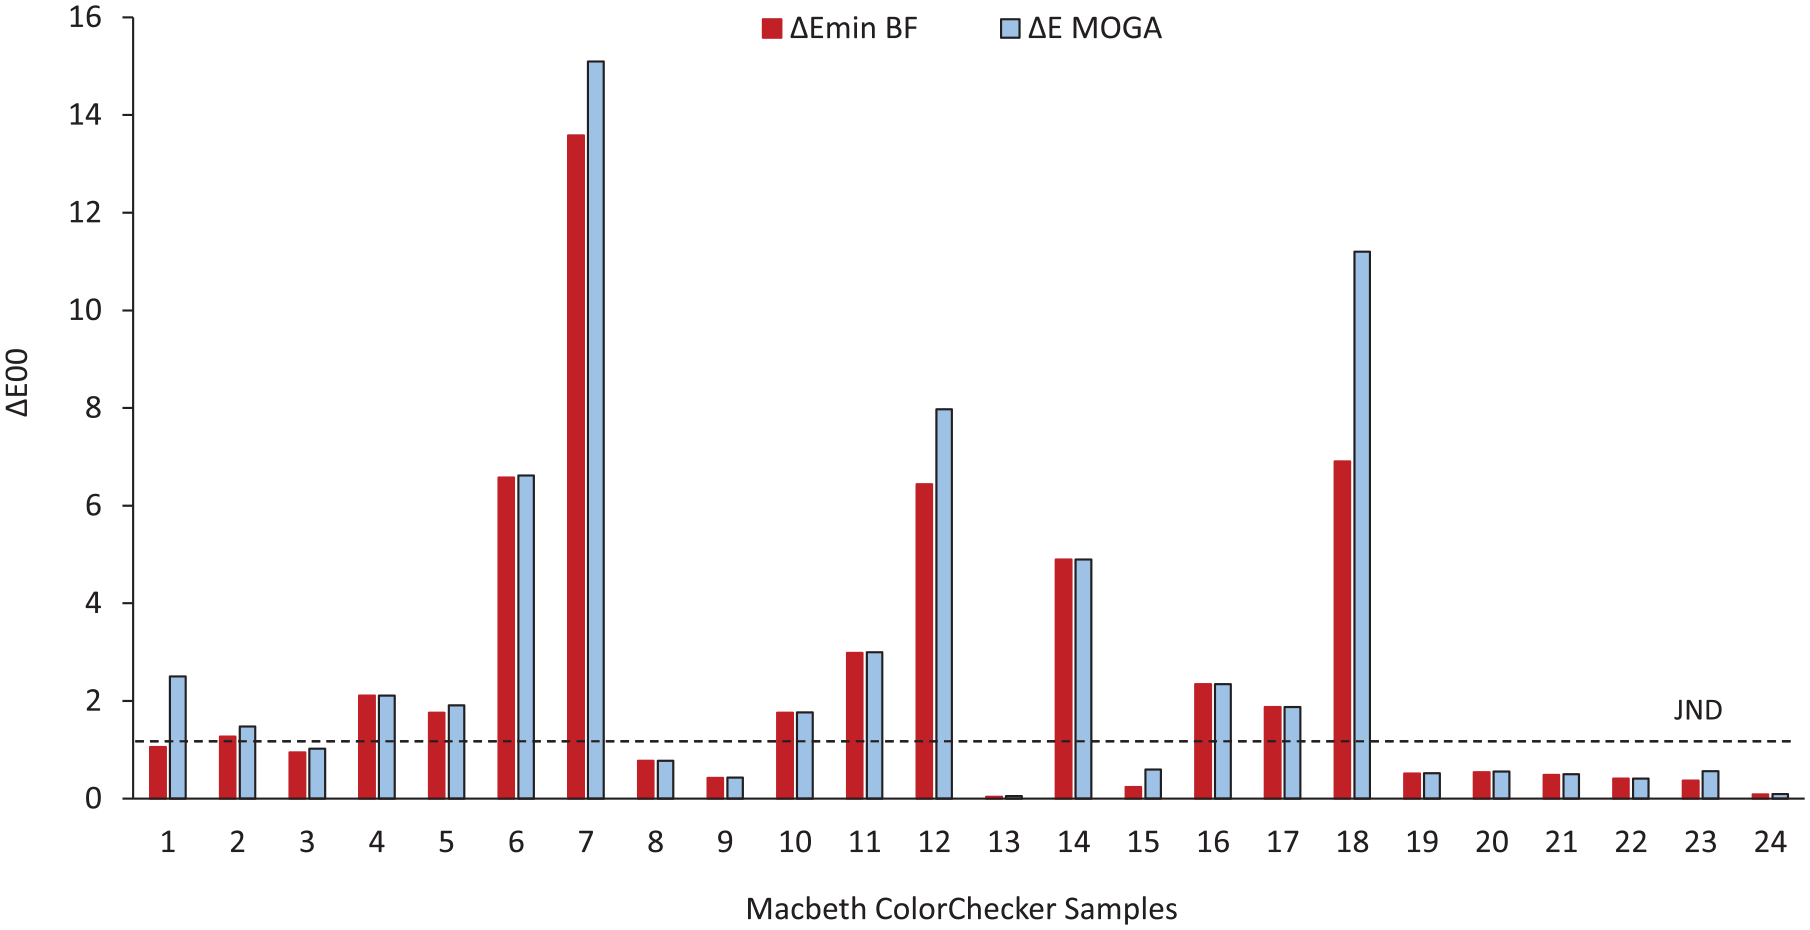
The minimum colour difference (ΔE00) between reference and optimal test SPD under linear BF method (blue columns) and MOGA method (orange columns). JND is considered ΔE00 = 1. 10
4.3 Energy consumption
The ECmin, EC at ΔE00,min in the BF method and EC under the MOGA method highlighted an inverse relationship with colour difference ΔE00, as shown in Figure 7. An average of 31% ECmin in BF for all colour samples was found for the corresponding ΔE00,avg of 24. Furthermore, for ΔE00,min of each sample (ΔE00,avg = 2.45), the EC increased to 46%. Whereas, with MOGA, the average EC was 44% for corresponding ΔE00,avg of 2.87. For colour sample 1, although the A in MOGA (51%) decreased by 7% as compared to A in BF (58%) at ΔE00,min with a slight increase in ΔE00 (1.0), instead of decreasing, EC in MOGA increased by 10%. This behaviour was unusual compared to all other colour samples. An independent samples t-test between EC in BF (at ΔE00) and EC from MOGA showed no significant difference (tEC(46) = 0.6065 < 2.014, p = 0.05).
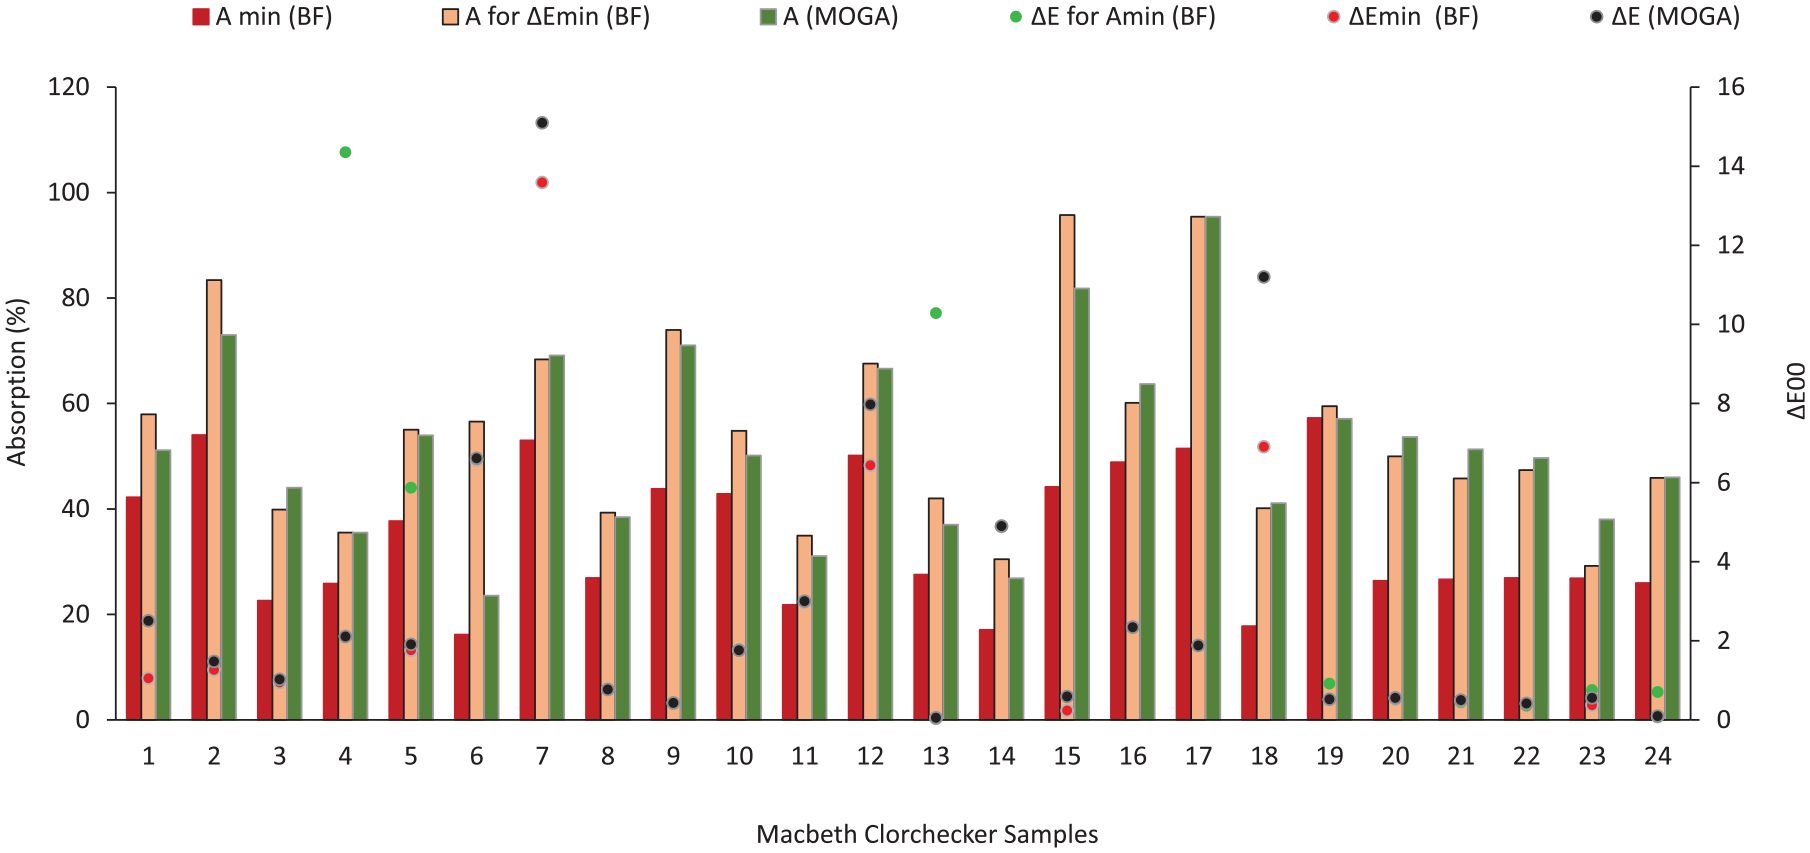
Comparison of minimum light absorption (Amin; red column, left axis) without colour difference constraint (ΔE; green dot, right axis), light absorption (A; orange column, left axis) at minimum colour difference (ΔEmin; orange dot, right axis) and optimised A by MOGA (green column, left axis), along with corresponding colour difference (black dot, right axis) for these situations for 24 Macbeth ColourChecker samples
4.4 Optimisation time
The time (t) required to find the optimum solution for each sample is one of the crucial factors as it may impact the convenience of using optimised SPDs to illuminate the artwork. The time factor mainly depends on the complexity of the calculations, the programming language, the efficiency of the code and the processing power of the computer. To ensure a fair comparison of the time required to generate the optimal test SPDs using BF and MOGA methods, all computations were performed on the same computer (RAM – 13.9 GB, AMD Ryzen 5 3500U, 2.10 GHz) by keeping the computation environment constant throughout the study. The full-step BF optimisation on average took 45 min, which is more than twice the time registered by MOGA (19 min) to find the optimum solution, as shown in Figure 8. In the BF search, the time required to manually filter all the data to find the optimal solution (approximately 10 min per sample) was not considered. Considering the additional time needed for manual filtering BF data, MOGA has significantly outperformed the BF process in terms of offering the most optimal solution with the least time required for every sample. The average difference in time between both methods was 27 min.
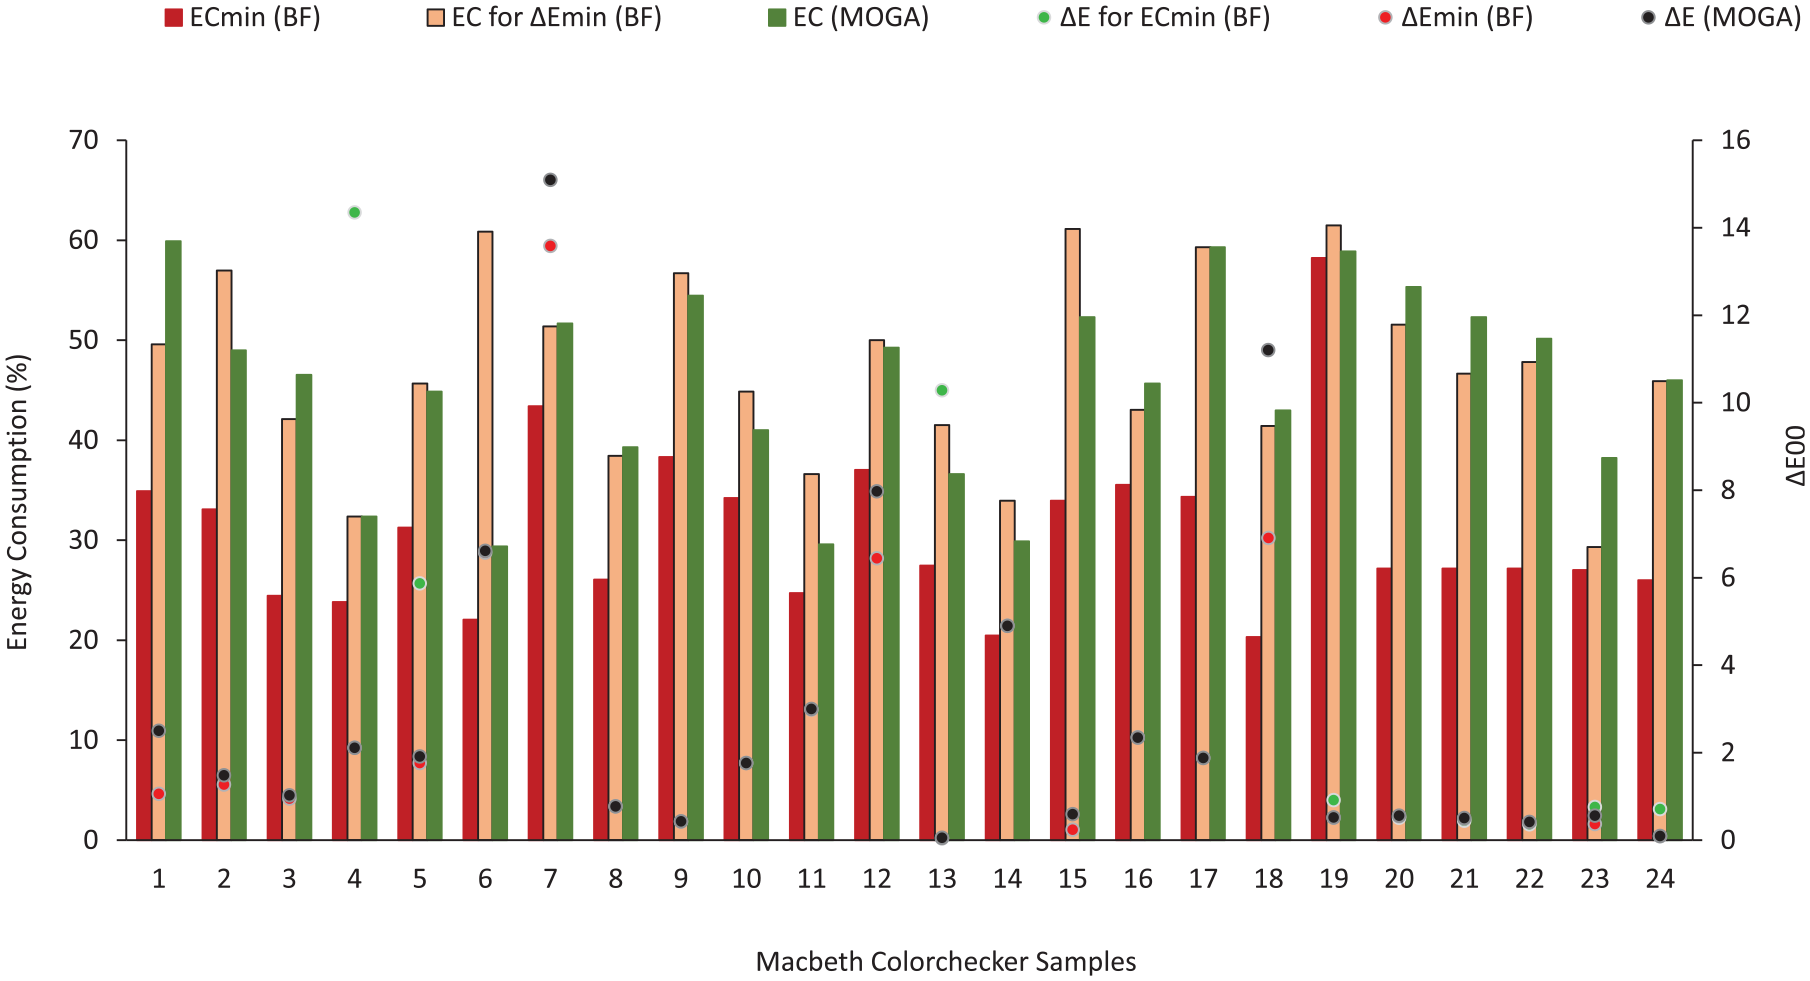
Comparison of minimum energy consumption (ECmin; red column, left axis) without colour difference constraint (ΔE; green dot, right axis), EC (orange column, left axis) at minimum colour difference (ΔEmin; orange dot, right axis) and optimised EC by MOGA (green column, left axis), along with corresponding colour difference (black dot, right axis) for these situations for 24 Macbeth ColourChecker samples
Achromatic colour samples (samples 19 to 24) had the highest number of optimal solutions. A large number of total optimal solutions indicated that it is easier to illuminate achromatic samples. This finding supports results from a previous study.
59
However, with the constraint of equal luminance from test and reference illuminant and optimising spectra for minimum A and EC, the achromatic samples consumed the most time (tavg = 22 min) compared to other samples (tavg = 17 min) (Figure 9)
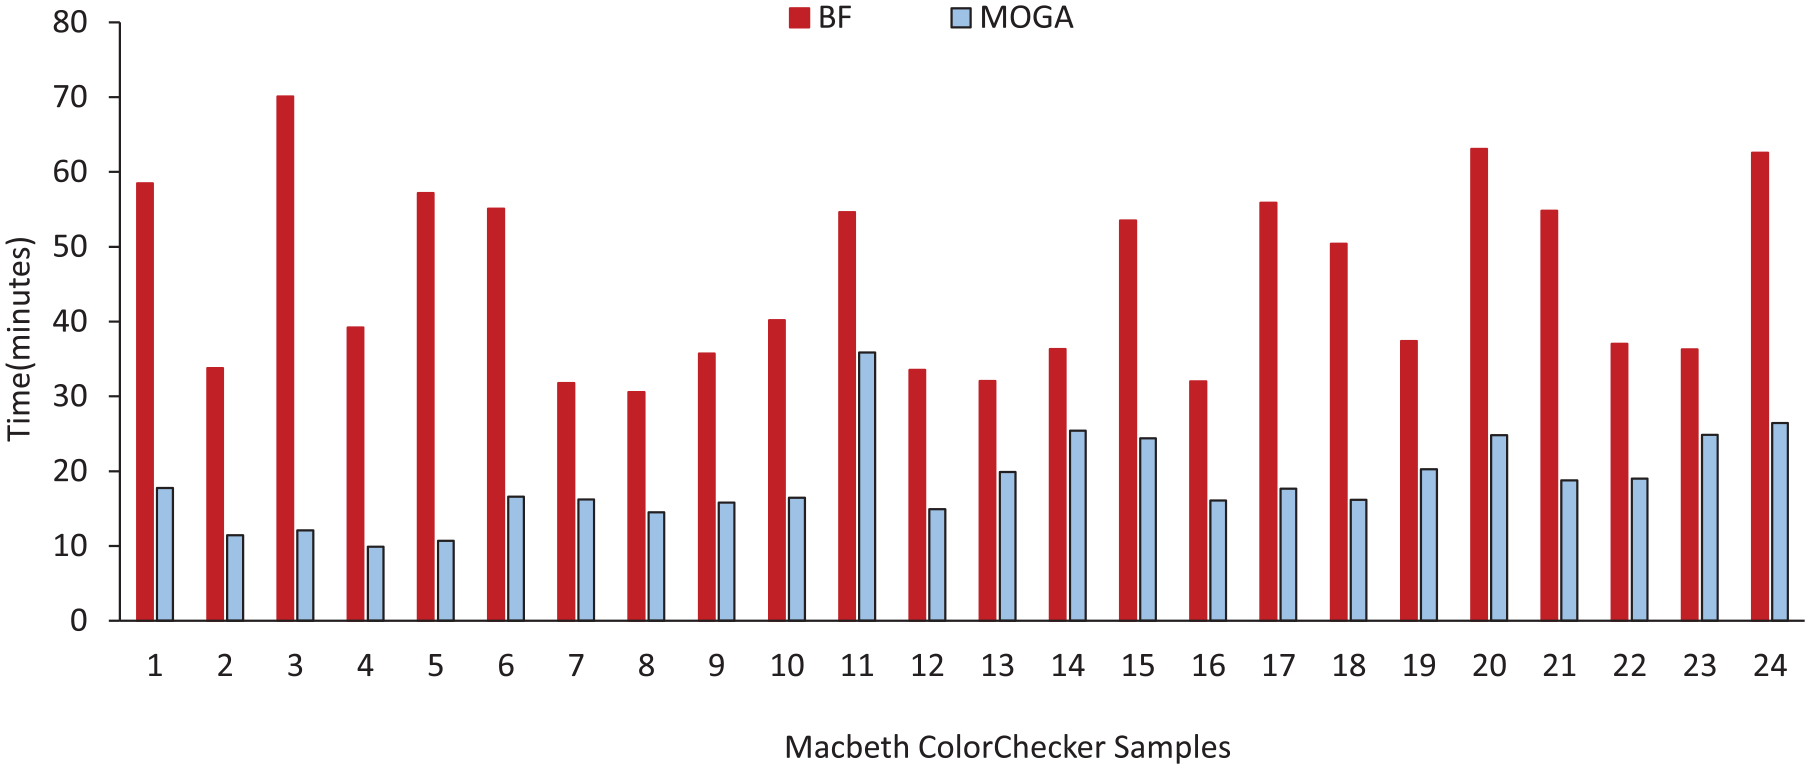
Optimisation time (t) comparison between BF (blue columns) and MOGA (orange columns) methods
5. Discussion
In all, 24 colour samples from the Macbeth ColourChecker chart were used to represent the colours of artwork in museums. Test SPDs generated from an RGB LED projector were optimised for three objective parameters: colour quality, damage potential and EC using BF and MOGA methods. BF performs the calculation for every single possible test SPD that can be created using all available channels and their dimming levels in the light source. Thus, BF gives the best possible solution with the caveat of the highest processing time. BF method has the highest accuracy, and its results can be reproduced. MOGA performs the calculation by initially selecting a random sample from the population and computes the next generation using a non-dominated rank and a distance measure of the individuals in the current generation. Thus, MOGA is quicker in computing the acceptable solution within the given constraints but not as accurate as BF. The results obtained from MOGA can vary with every iteration.
In this study, MOGA successfully optimised the spectra to keep the colour appearance of 13 colour samples below a JND compared to the reference SPD (a scaled incandescent illuminant A). Colour differences for the remaining 11 colour samples were above the noticeable threshold (ΔE00 = 1.0). Results suggest that a three-channel RGB LED can be used to render the colour appearance of almost 50% of the colours when ambient light is not considered. Other colour samples showed smaller (1.0 < ΔE00 ≤ 5) and medium-to-high (ΔE00 ≥ 5) appearance differences. Colour difference results between BF and MOGA were not significantly different (t(46) = 0.6387 < 2.014, p = 0.05), highlighting the accuracy of MOGA in finding optimal solutions for minimal colour shifts.
When BF data were filtered for the Amin with ECmin and equal luminance constraints, light absorption prevention was up to 65% and energy savings were 69% compared to reference incandescent illuminant but the colour difference (ΔE00) was unacceptably high (ΔE00,avg = 25). When ΔE00 was prioritised over A and EC, light absorption prevention was 45% on average and 53% of energy can be saved while maintaining lower colour shifts (ΔE00,avg = 2.45). In MOGA, minimising ΔE00 was the priority, and A was second, which was followed by EC. The average light absorption reduction of 48% and 54% energy savings was achieved with ΔE00,avg = 2.84. When the total light absorption and EC under BF and MOGA were compared for all colour samples, no significant difference was found (t A (46) = 0.6387 < 2.014, tEC(46) = 0.6065 < 2.014, p = 0.05). This result was surprising because BF data were only filtered for the ΔE00,min for comparison purposes and the corresponding A and EC were compared.
Although there were other constraints (EC and luminance), a strong relationship between colour difference and absorption was recorded within each colour sample. A similar trend was observed in EC results because it is directly proportional to light absorption. However, this relationship was not found to be significantly strong across the data, due to the differences in the spectral reflectance factor, hue and chroma shifts. For colour sample 1, EC increased with an increase in ΔE00 and light absorption decreased in MOGA, but this was not true for the BF method. However, when A and EC were considered for all 24 colour samples, a strong correlation was found between A and EC within the BF method at minimum A (p < 0.00001), within the BF method at minimum ΔE00 (p < 0.00001) and MOGA (p < 0.00001).
Data analysis shows that MOGA performed significantly better than the BF method in terms of computational time, and similar in terms of all three objective parameters (ΔE00, A, EC) of the study. The time required to find the optimal solution for each colour sample and all 24 Macbeth ColourChecker samples under MOGA optimisation (tavg = 19 min) was significantly shorter than the BF method (tavg = 46 min).
6. Conclusion
Light is needed to appreciate artwork, but optical radiation absorbed by surfaces can cause irreversible damage to light-responsive materials. Reducing light absorption by projecting spatially and spectrally optimised light can reduce damage to the artwork without causing perceptible colour shifts. However, the computational time and effort to optimise the light source spectrum for each pigment on a painting can be tremendous. This study utilised a BF and MOGA to optimise three-channel AR LED projector spectra to minimise the optical radiation absorbed by 24 colour samples and energy consumed by lighting.
Results suggest that light absorption and EC can be nearly halved if the RBG projector spectra are optimised for object reflectance. Colour difference results indicate that using only three channels could be insufficient to minimise the colour difference below JND for all the colour samples. The failure to illuminate certain samples (e.g. samples 7, 12, 18) below one JND indicates the complexity of spectral optimisation to meet competing criteria, especially for surfaces with non-smooth reflectance curves. Lighting systems with more than three channels are commercially available and can be used to generate a vast number of spectra. While the increasing number of LED channels in a lighting system will increase the computational time and complexity to identify optimal solutions, 67 algorithms have been developed to reduce the time and resources to complete these calculations. 68
The spectral and spatial optimisation of light output for museums is inherently a physical and computational process. The light projection approach requires physical measurements of pigment reflectance and light source spectra. The projection systems should ideally be carefully characterised and calibrated in laboratory conditions for better accuracy. The computational requirements include using scientific coding languages to precisely optimise the projector’s light output.41,42,44,65 Therefore, the performance of the optimisation techniques is critical to the success and adoption of this approach. The results of this study indicate that the MOGA optimisation method was equally efficient in maintaining the colour quality, reducing light absorption and EC. The MOGA was also 2.5 times faster than the BF method in finding the optimal solutions.
This study is not without limitations. The methods and results presented here are aimed to be universal but might hold only for the spectral characteristics of the light source used in this study. Similar to previous optimisation studies, this study assumes a linear response curve from the LED devices. However, LEDs may exhibit spectral shifts when dimmed due to aging, warm-up or variations in junction temperature. 69 Different types of loop systems70–72 and curve-fitting corrections 73 can help overcome the spectral shifts caused by dimming. Additionally, the visual perception of artwork under spectrally and spatially optimised light should be systematically investigated. While the proposed study uses spectral reflectance as a proxy, materials’ chemical properties can affect the accuracy of the optimisation results. Future research will consider materials with similar reflectance characteristics (Figure 4) (i.e. similar perceived surface colours) but different chemical compositions and photo sensitivities and investigate observers’ subjective evaluations of artwork under optimised lighting.
Footnotes
Acknowledgements
A version of this work was presented at the CIE 2021 Midterm Session.
Declaration of conflicting interests
The authors declared no potential conflicts of interest with respect to the research, authorship, and/or publication of this article.
Funding
The authors received no financial support for the research, authorship, and/or publication of this article.