
Abstract
To achieve energy saving and safe driving in a tunnel, this work proposes a tunnel intelligent dimming control and energy consumption monitoring system. Firstly, a dynamic predicted tunnel traffic volume is established to optimize the timeliness of the system tunnel traffic volume. Secondly, a backpropagation neural network-based dimming control model is constructed, in which the luminance outside the tunnel, traffic volume and vehicle speed serve as the input, and the luminance inside the tunnel is the output. This model is then combined with the established integrated closed-loop control model of the tunnel internal and external luminance to achieve continuous dimming control of the tunnel. Finally, an energy consumption monitoring system is designed with an energy monitoring unit. The designed system was implemented and tested for 63 days in the Yongtaiwen–Chayuanli (China) tunnel. Experiment results show that the designed system can automatically control the luminance of the tunnel lighting according to the luminance measured outside the tunnel, traffic volume and vehicle speed, thus achieving continuous dimming control. This significantly reduced the power consumption (by approximately 65%) whilst ensuring the safety of tunnel traffic.
1. Introduction
Road tunnel lighting is the key to ensuring driving safety. With the development and maturity of LED lighting technology, tunnel lighting has entered the era of intelligent dimming. However, many tunnel lighting systems currently experience energy waste.1,2 Thus, a new intelligent LED light source tunnel intelligent lighting system that is safe and energy saving needs to be developed.
Various methods and techniques have been proposed to improve operational energy efficiency to improve tunnel lighting effectiveness, travel comfort, safety and to save electrical energy, thereby minimizing the energy consumption of road tunnels. 3 In general, they can be divided into four categories. The first category is the introduction of natural light sources in the tunnel. This approach includes extending the threshold zone beyond the road tunnel, using sunlight to supplement electrical lighting in daylight conditions.4–8 Cantisani et al.6,7 presented analytical methodologies to calculate the luminance on the road pavement in presence of pre-tunnel lighting and verified that the presence of tunnel front lighting can reduce the energy consumption of tunnel lighting. The second category is the decrease in the luminance requirements through forestation of surroundings and special pavements.9–13 Peña-Garcia et al. 12 proposed a method to reduce the perimeter luminance of tunnel entrances by planting climbing plants around the entrance doors of road tunnels. The third category is extensive research and improvement of tunnel luminaires.14–16 On the basis of the visual characteristics of the driver17–19 and the visual environment in the tunnel, a series of numerical calculation guidelines has been developed. 20 Avotins et al. 16 found that the application of LED replacement high-pressure sodium(HPS) luminaires provided energy savings of up to 47% for street lighting. All three methods reduce energy consumption by means of additional systems or hardware upgrades.
The fourth category is the use of intelligent control methods21–26 to regulate the luminance of luminaires in tunnel lighting systems. Such methods are the most common and effective way of reducing energy consumption through internal optimization of the system. Yang et al. 23 proposed a fuzzy control method for a tunnel lighting control system. Simulation results show that the fuzzy system had a notable energy-saving effect and good adaptability. However, their focus was on simulation and lacked application in practice. Qin et al. 24 proposed an incremental Proportional-Integral-Derivative(PID)-based energy-saving control system that features adaptive lighting; when a vehicle is in the tunnel, the light brightens, and when no vehicles are in the tunnel, the light dims. As the vehicle approaches the tunnel, the luminance is adjusted based on input signals from external ambient luminance, climatic conditions and traffic volume. However, they did not elaborate on their proposed control mechanism and algorithm process. Zhao et al. 25 used an adaptive fuzzy control strategy to adjust the internal luminance of the tunnel to meet the basic requirements of tunnel lighting with changes in the luminance outside the tunnel, traffic volume and vehicle speed, thus reducing the energy consumption significantly. However, they did not optimize the tunnel traffic volume obtained by the system, and timeliness issues may arise. Qin et al. 26 used a K-means clustering algorithm to divide the daily traffic distribution into six time periods to optimize traffic timing and proposed a dynamic luminance adjustment method to distinguish the operating strategies under different time periods. The regulation method provided good energy savings while improving the sustainability of the lighting system. However, their classification of the daily traffic distribution in the tunnel is too simple and did not take possible contingencies into account.
To meet the above challenges and improve the tunnel lighting effect, travelling comfort, safety and energy saving, this work studies a tunnel lighting control system with intelligent dimming and energy consumption monitoring, including the establishment of a dynamic predictive modelling of tunnel traffic volumes, optimizing the timeliness of the system tunnel traffic volumes and constructing a dimming control model based on backpropagation (BP) neural network with the luminance outside the tunnel, traffic volume and vehicle speed as inputs and the luminance inside the tunnel as outputs. The integrated closed-loop control model of the luminance inside and outside the tunnel is combined to achieve continuous dimming control inside the tunnel.
2. Design basis and control method
2.1 Overall system design
The system includes two parts: intelligent lighting dimming and energy monitoring. The intelligent dimming of tunnel lighting includes the establishment of dynamic predictive modelling of tunnel traffic, BP neural network-based dimming control model and closed-loop control model of luminance inside and outside the tunnel through the optimization of the traditional highway tunnel dimming system to vary the luminance in the tunnel from the luminance outside the tunnel, traffic volume and vehicle speed to achieve lower energy consumption and intelligent control. Tunnel lighting energy monitoring includes energy consumption statistics, trend analysis, Energy Management Contracting (EMC) forecasting, reference illuminance measurement and other modules. With the use of a smart metre installed in each circuit, the energy consumption data are integrated and uploaded, the information is aggregated and analysed and the tunnel energy consumption is monitored and analysed. Accurate monitoring of lighting energy consumption provides a basis for EMC transformation, an improved dimming model and optimization of energy-saving measures. 27
2.2 Intelligent dimming control design
The lighting control model is the core of tunnel lighting control. 28 A series of steps, including design documents, on-site testing, runtime correction and periodic retesting, is required to obtain data, such as tunnel overview, reasonable vehicle speed, luminance outside the tunnel and traffic volume. 22 The determination of the model is a process of gradual optimization and refinement. The final lighting control model can correctly describe the relationship between the luminance inside and outside the tunnel, the dynamic change of the traffic volume and the vehicle speed. 29
2.2.1 Tunnel traffic volume model based on stochastic modelling
The car detector detects the number of vehicles that pass through and obtains their total number, the accumulated traffic volume after half an hour is the traffic volume of the tunnel during this period. However, if the tunnel traffic volume of the first half an hour is used to determine the current tunnel traffic volume, then the timeliness will be relatively poor. Therefore, the real-time traffic volume data of this period of time can be calculated by using the mathematical statistics method and establishing a real-time calculation mathematical model. Model building includes the following steps:
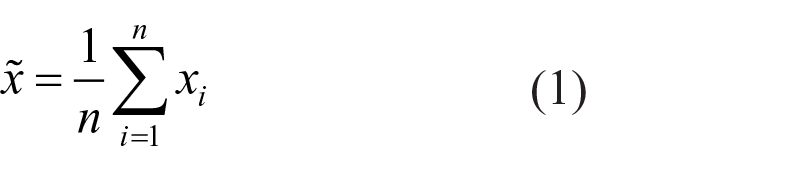
To calculate the traffic data of a certain time period, such as the data of the first 10 days of the same time period, the data of the first 10 days of last year before and after the same time period, the data of the first 10 days of this year and other data related to the time period, the weight is set according to the size of the correlation. A number of data is taken as one group, which is divided equally into several groups by the random sampling procedure, and the arithmetic mean of each group of data is taken as the sample value to obtain x1, x2, . . ., xn.
Then, the average value of the sample values
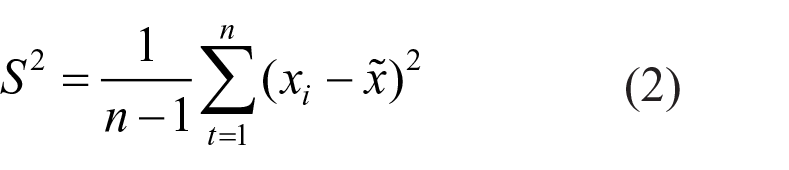
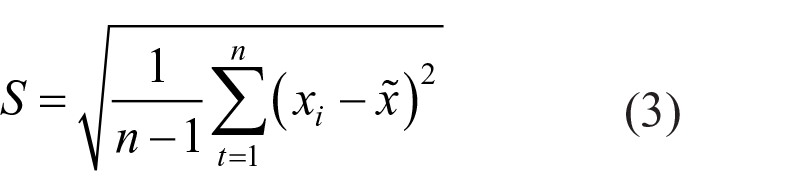
2. On the basis of the theory of the central limit of the sampling mean, a large amount of sampling data are used, which conform to the normal distribution. The input data of the controller should conform to the overall mean μ of the current situation when the overall standard deviation σ should be equal to the sampling standard deviation S. Therefore, with the use of the above sampling mean and sampling standard deviation value S, the overall mean must fall within the confidence interval with 90% or 95% certainty.
3. The confidence interval is used as the scale to compare and adjust with the average of the current measured data. The current measured data are obtained by the linear regression of the current traffic flow data for the first half hour, 1 hour, and one-and-a-half hour. The controller automatically detects whether the data fall into the confidence interval for comparison and automatically adjusts it as the current traffic control data.
Finally, the mathematical model is embedded in the controller, and all calculations are performed in the mathematical model calculation programme embedded in the controller. The mathematical model of the controller collects raw data and then transports, compares, judges and executes the resultant data, aside from performing computations.
2.2.2 Dimming control model based on BP neural network
The traditional tunnel lighting luminance calculation is based on the designed hourly traffic volume and design speed. The transition zone’s luminance is proportional to the threshold zone’s luminance. Thus, the exit zone’s luminance is proportional to the interior zone’s luminance. We usually determine the luminance reduction coefficient of the threshold zone (Table 1) and the luminance of the interior zone (Table 2) by using the look-up table method, and then we obtain the luminance of each tunnel lighting section in proportion. 22 Given that the reduction coefficient and luminance are discrete fixed values, achieving continuous dimming and meeting the lighting requirements of any scenario based on this calculation basis is difficult. In this work, we attempt to use BP neural network to fit the reduction coefficient and interior zone luminance to achieve continuous optimization of luminance calculation. The input of the dimming control model of the BP neural network is the luminance outside the tunnel L20(S), the tunnel traffic volume N and vehicle speed V. The BP neural network starts with the set of training set input samples passed in from the input layer, processed layer by layer by each hidden layer, and passed to the output layer. If the output of the output layer does not match the expectation, then the error is passed back as an adjustment signal layer by layer, and the connection power matrix between neurons is processed to reduce error. After repeated learning, the error is finally reduced to an acceptable range, and the corresponding tunnel internal luminance Lin can finally be outputted according to the external input parameters. The BP neural network dimming control model can improve the uniformity of tunnel lighting, improve the safety and comfort of the tunnel driving environment and effectively prevent power wastage caused by redundant design parameters. Given that tunnel lighting often uses HPS lamps, which have a long start-up time and long life, turning them on or off frequently is harmful. Therefore, dimming control based on real-time L20(S), N and V BP neural network is well suited for tunnel lighting.
Luminous reduction coefficient of highway tunnel’s threshold zone*
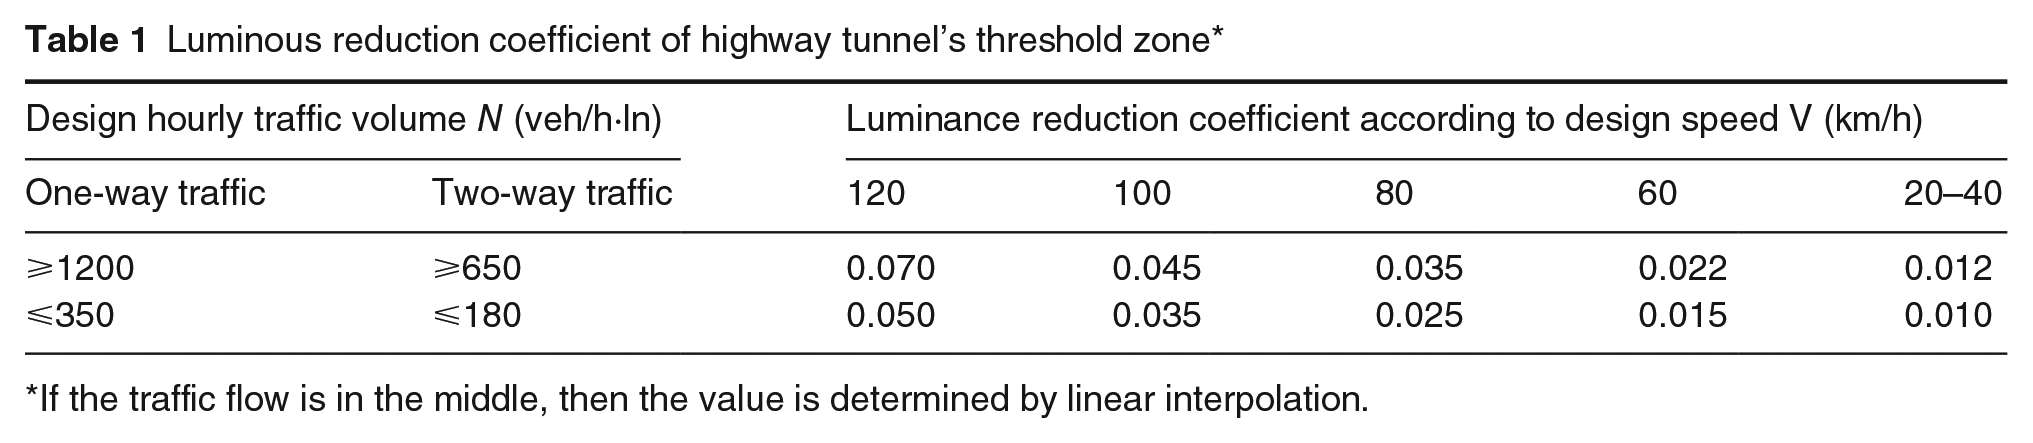
If the traffic flow is in the middle, then the value is determined by linear interpolation.
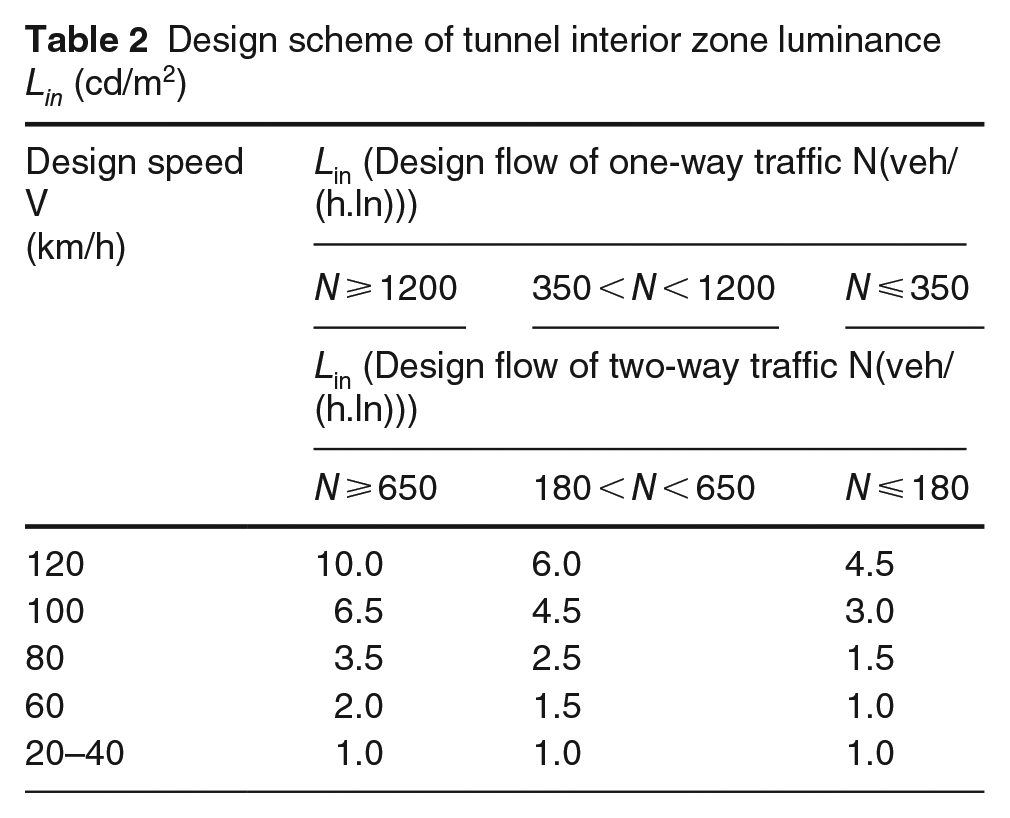
Design scheme of tunnel interior zone luminance Lin (cd/m2)
The threshold zone is taken as an example to establish a dimming model. According to the Guidelines for Design of Lighting of Highway Tunnels, 21 the threshold zone of a highway tunnel should be divided into two lighting sections: TH1 and TH2. The luminance of the lighting sections can be calculated by Equations (4) and (5).
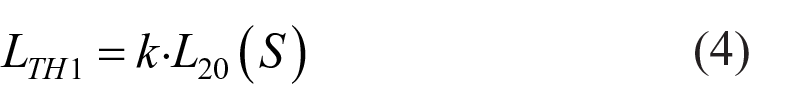
where LTH1 is the luminance (cd/m²) of the entry segment TH1; LTH2 is the luminance of entry segment TH2 (cd/m²); k is the luminance reduction coefficient of the threshold zone and L20(S) is the luminance outside the tunnel (cd/m²).
L20(S) is the real-time data collected by the luminance meter outside the tunnel. The luminance reduction coefficient k value of the threshold zone is shown in Table 1. The traditional method is based on the corresponding fixed parameter (design speed) and the tunnel traffic volume to look up the table. Finally, the luminance of the threshold zone is calculated.
On the basis of the original method, the data in the table are used as the training set, and the reduction coefficient k in the middle part is fitted using the BP neural network algorithm, including the following steps:
A sample is taken from the training set, and the information is inputted into the network.
The actual output of the neural network is obtained by forward layer-by-layer processing of the connections between the nodes.
The error between the actual output of the network and the desired output is calculated.
The error is backpropagated to the previous layers layer by layer, and the error signal is loaded onto the connection weights according to certain principles so that the connection weights of the whole neural network are transformed to the direction of error reduction.
The above steps are repeated for each input–output sample pair in the training set until the error of the whole training sample set is reduced to meet the requirements.
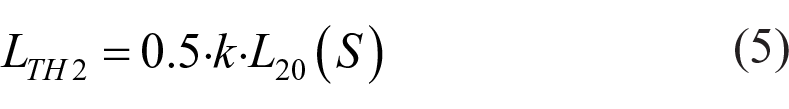
The BP neural network turns the discrete sample data into a continuous function for continuous optimization of the luminance calculation. The result is shown in Figure 1. The darker colour in the graph represents a higher value. This instance is evident for tunnel traffic N less than or equal to 350 veh/(h·ln) and N greater than or equal to 1200 veh/(h·ln). The reduction coefficient k runs in a single curve and only increases with V. The trajectory is a smooth curve. For a tunnel traffic volume N greater than 350 veh/(h·ln) and N less than 1200 veh/(h·ln), the trajectory of the reduction coefficient k is relatively complex. Different tunnel traffic volumes N correspond to the different trajectories of the smooth curve, and the reduction coefficient k increases with the tunnel traffic volume N and the vehicle speed V. After V becomes greater than or equal to 120 km/h, the output of the reduction coefficient k is related to the tunnel traffic volume N. The output of the reduction coefficient k is constant at 0.05 for N less than or equal to 350 veh/(h·ln), 0.07 for N greater than or equal to 1200 veh/(h·ln) and linear with N for N greater than 350 veh/(h·ln) and less than 1200 veh/(h·ln), with the range of k between 0.05 and 0.07. The use of the traditional table look-up method is compared to determine the reduction coefficient. The transition of the fitted luminance reduction coefficient k becomes smoother and achieves continuous optimization of the luminance calculation, and the energy-saving effect of the fitted control is better than that of the traditional discrete control method. Thus, the fitting effect can ensure a comfortable driving environment and energy saving.
Fitting diagram of the luminance reduction coefficient k under different tunnel traffic volumes and driving speeds
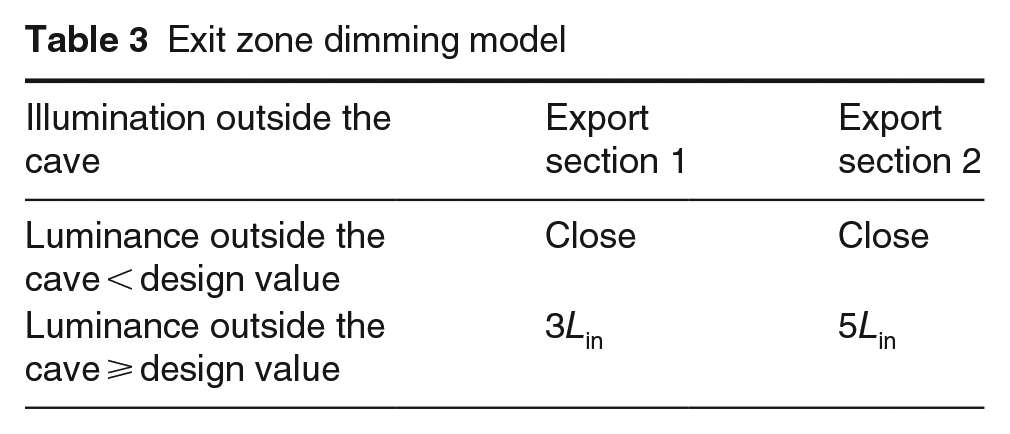
For the interior zone and the exit zone dimming model, according to the Guidelines for Design of Lighting of Highway Tunnels, 21 the interior zone lighting luminance table Lin (cd/m2) is shown in Table 2, and the exit zone dimming model is shown in Table 3. The exit zone and interior zone dimming models are linear. Thus, they only need to fit the interior zone dimming model. The interior zone luminance cannot be lower than 1 cd/m2, which is why constraints are added in the programme. Table 2 presents the training set. The results after the BP neural network is run are shown in Figure 2. For the tunnel traffic volume N less than or equal to 350 veh/(h·ln) and N greater than or equal to 1200 veh/(h·ln), the interior zone luminance Lin is running in a single curve, the interior zone luminance Lin only increases with V and the trajectory is a smooth curve. For the tunnel traffic volume N greater than 350 veh/(h·ln) and less than 1200 veh/(h·ln), the trajectory of the interior zone luminance Lin is relatively complex, and different tunnel traffic volumes N correspond to a smooth curve with different trajectories. The interior zone luminance Lin increases with the tunnel traffic volume N and vehicle speed V. After making V greater than or equal to 120 km/h, the output interior zone luminance Lin is related to the tunnel traffic N. The output of interior zone luminance Lin is constant to 4.5 cd/m2 for N less than or equal to 350 veh/(h·ln), and the output of interior zone luminance Lin is constant to 10.0 cd/m2 for N greater than or equal to 1200 veh/(h·ln). The output of the interior zone luminance Lin is linear with N for N greater than 350 veh/(h·ln) less than 1200 veh/(h·ln), ranging from 4.5 cd/m2 to 10.0 cd/m2. Moreover, the interior zone luminance Lin is greater than or equal to 1 cd/m2 regardless of the tunnel traffic volume N and the vehicle speed V. The transition of the interior zone luminance Lin becomes smoother after fitting, and ensuring the minimum luminance of the interior zone. In addition, compared with the traditional discrete control method, the fitted control has a better energy-saving effect. Thus, the fitting effect can ensure a comfortable driving environment and enhance energy saving.
Exit zone dimming model
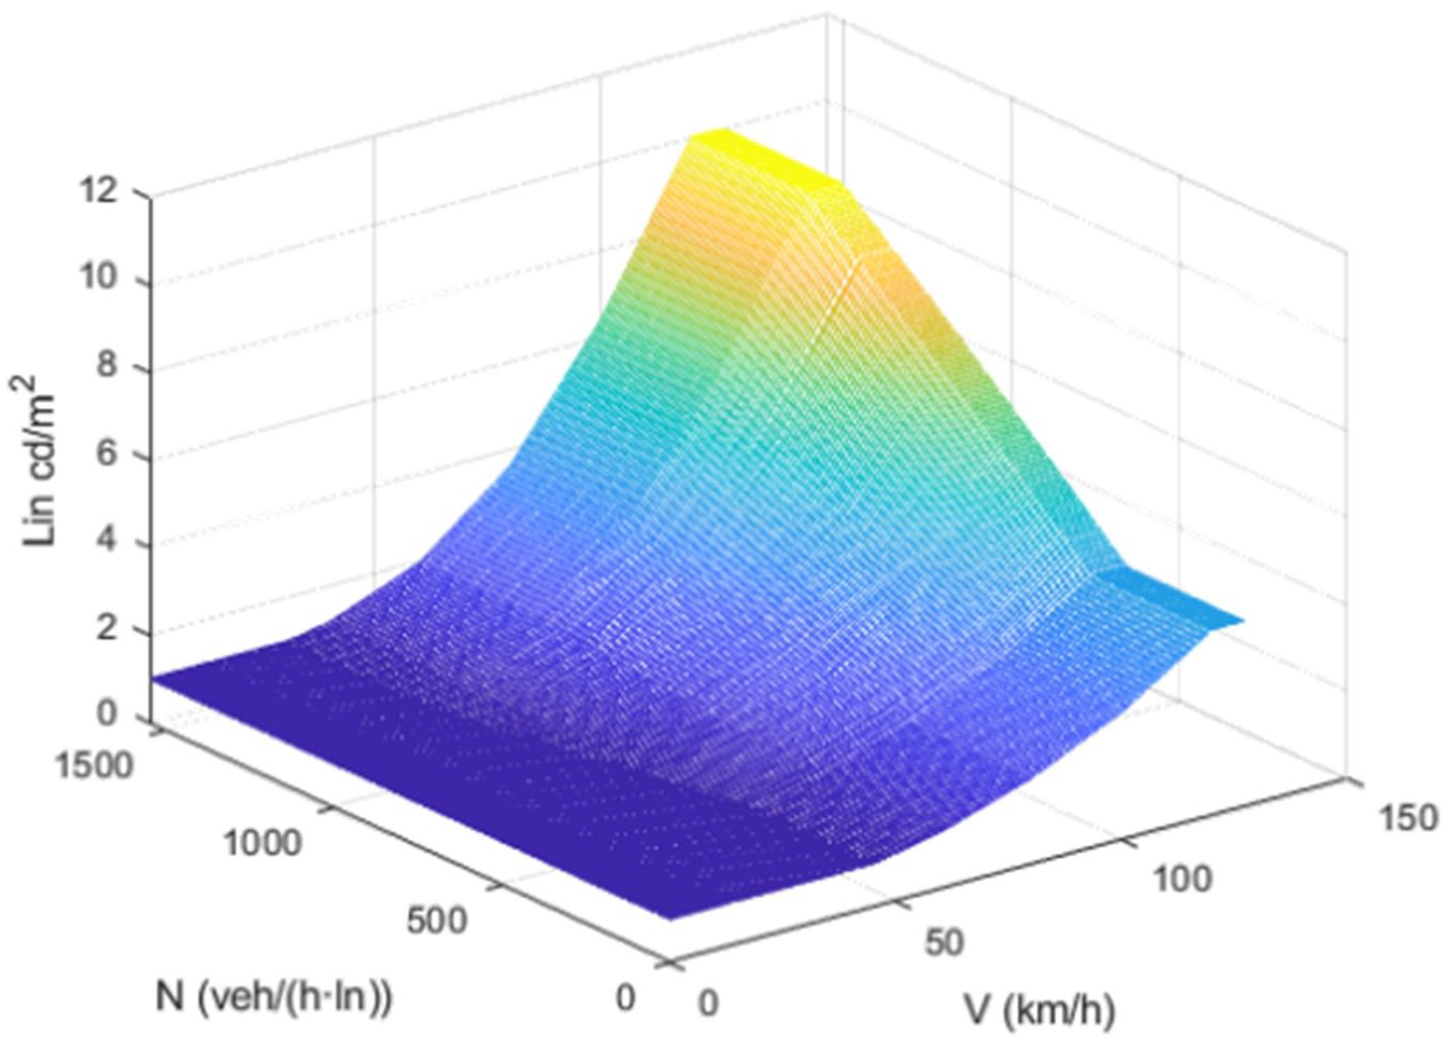
Fitting diagram of the interior zone illumination luminance Lin (cd/m2) under different tunnel traffic volumes and vehicle speeds
For the data processed by the BP neural network, the output of this neuron can be quickly obtained according to the input parameters. The continuous optimization of the sample values is not a complex process, but the adjustment via neural networks allows the intelligent control of dimming to be reflected.
2.2.3 Closed-loop control model
On the basis of the luminance outside the tunnel, tunnel traffic volume and tunnel vehicle speed, the dimming model calculates the theoretical luminance of each segment in the tunnel. The relationship among different tunnel dimming control signals and the luminance in the tunnel varies because of the differences in the characteristics of various brands of LED lamps and the arrangement of tunnel LED lamps. Thus, multiple combined tests must be performed on different lighting circuit combinations and dimming signals on the spot to obtain a control function of the dimming signal and the luminance in the tunnel.
Different dimming signals are outputted for each illumination segment and each illumination loop for the in-tunnel illumination test. To ensure the accuracy of the dimming model, 100%, 75%, 50%, 35%, 20% and 10% dimming signals were tested. According to the dimming signal ratio and the measured illuminance value, the dimming curve is fitted, and a model of the dimming signal (duty cycle) and illuminance is established. After the dimming model is established the illuminance in the tunnel needs to be measured, and the accuracy of the dimming model must be checked. Finally, the illuminance value is converted into a luminance value to complete the dimming signal model. The specification luminance in the tunnel is calculated every 30 minutes by acquiring the tunnel structure, number of lanes, linearity, vehicle speed, traffic volume and luminance outside the tunnel data. The luminance in the tunnel and dimming signal model are used to calculate the duty cycle of the dimming signal. The controller issues a dimming command according to the calculated duty ratio and performs closed-loop dimming control. After the model is established, the light fade of the LED lamp and the vibration of the tunnel cause the angle of the lamp to change as the use time increases, and the exhaust gas pollution, the line ageing and other factors will change the dimming result. Therefore, the dimming model should be calibrated periodically to ensure safe and efficient lighting control.
2.3 Intelligent dimming control system design
The intelligent dimming control system, including the field acquisition device, the lighting control host and the LED dimming control device, is shown in Figure 3. The lighting control host connects the ground magnetic detector, the microwave vehicle inspection device, the dual-luminance metre and other field acquisition devices through the control bus. At the same time, it connects each single lamp controller through the power carrier host, collects the real-time status of each LED lamp, controls the luminance output and sets the emergency manual control mode to prevent the tunnel lighting from being out of control due to system failure.
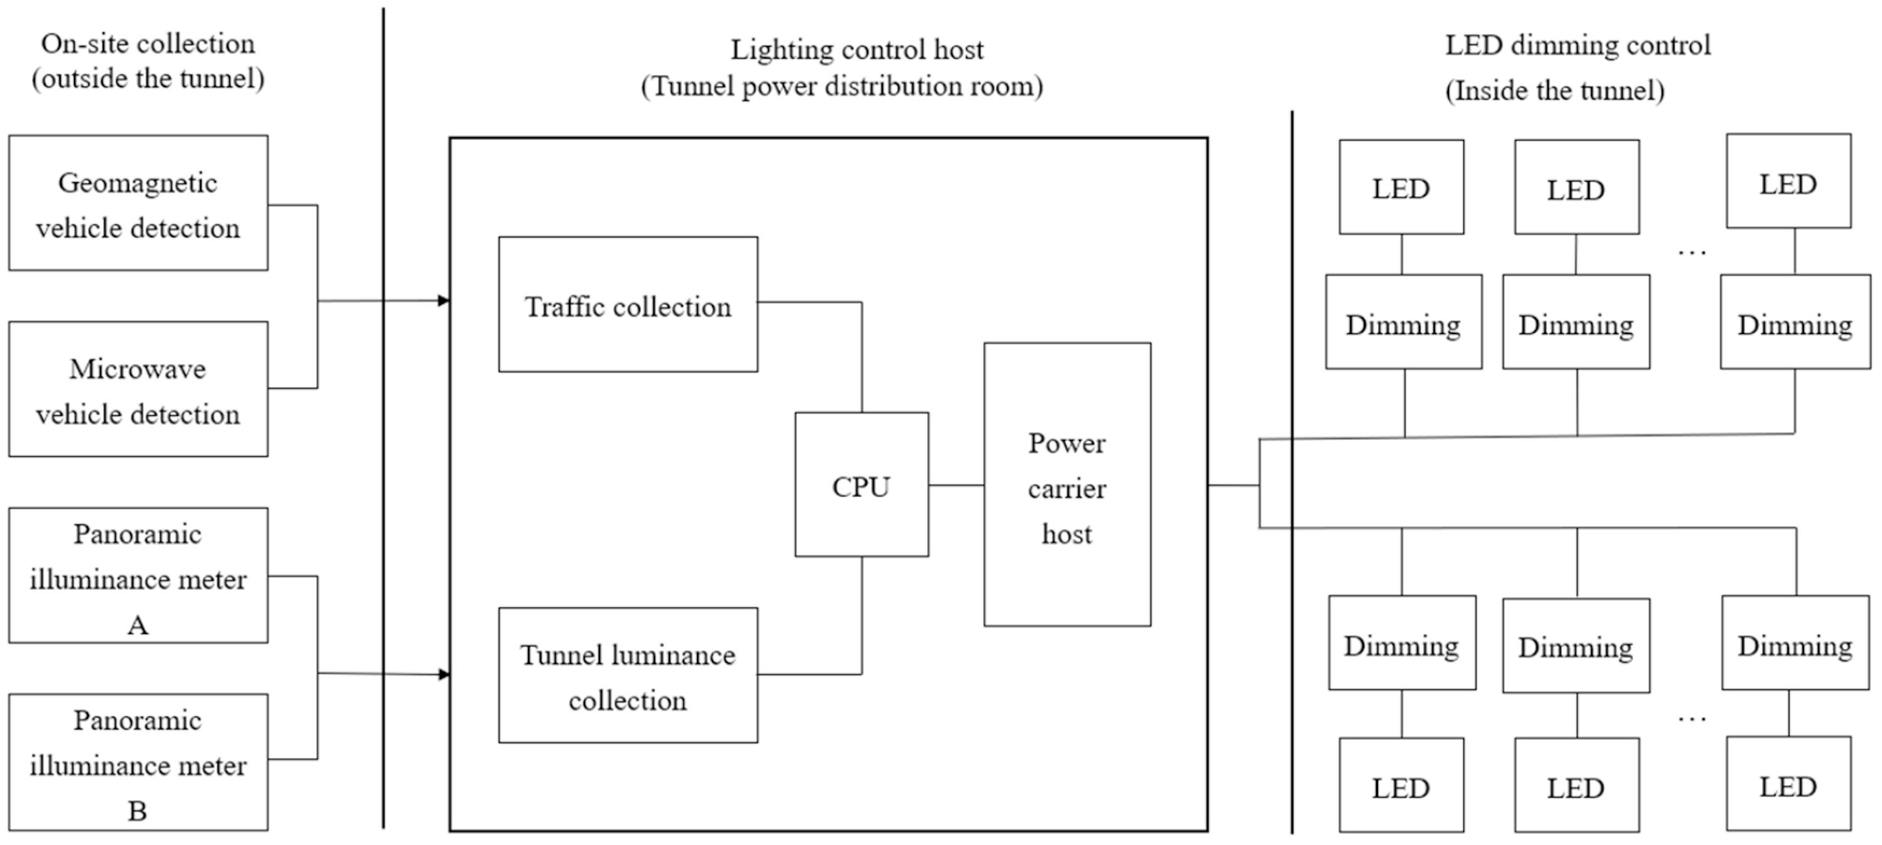
Intelligent dimming control system block diagram
During the design process, the strong and weak electricity separation methods are adopted to avoid the interference of strong electricity to weak electricity. The specific structure is shown in Figure 4.
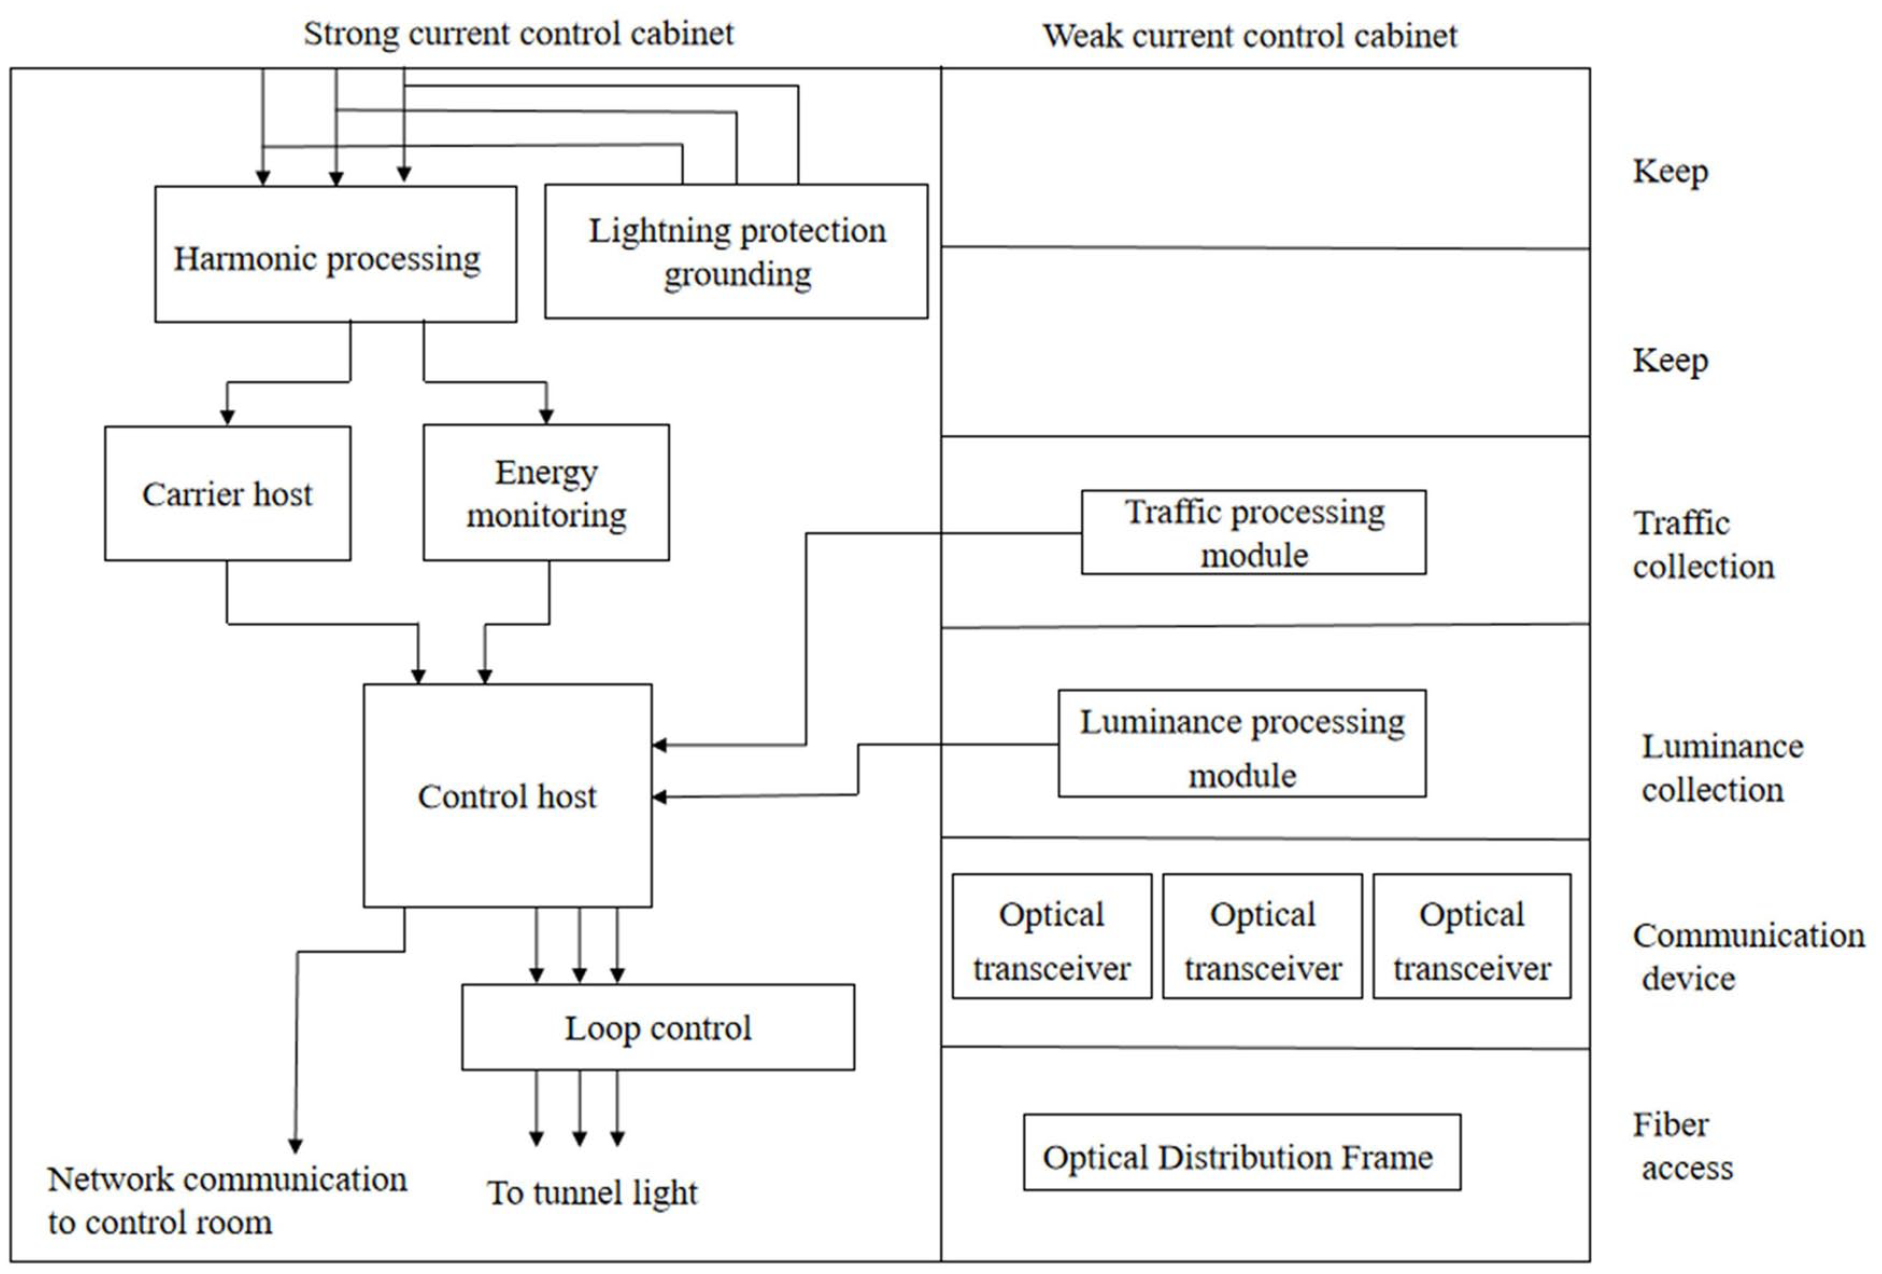
Structural diagram of tunnel lighting efficient energy-saving controller
The energy-saving control system performs dimming control on the inner section and the basic section of the tunnel lighting circuit (excluding the emergency circuit) by adopting 0–10 V, pulse-width modulation, and 485 bus, according to the illumination control model established by multiple control parameters, such as tunnel luminance, traffic volume and vehicle speed. The lamp realizes 10%–100% luminance adjustment output. During an abnormal event, such as a fire, a traffic accident or a natural disaster, the corresponding emergency mode is automatically switched according to the type of the event to ensure efficient and safe escape and rescue.
The intelligent dimming control system combines two control modes: a mode based on the loop timing control system, and based on this mode, the LED lamp dimming control mode under different working conditions is realized. The loop timing control system makes full use of the original loop control system, and the LED lamp dimming control is a supplement to the loop timing control. When the weather changes, the outside luminance detector detects the luminance of the tunnel, and the vehicle detector and the geomagnetic sensor identify the short-term traffic volume change and dimming through the preset control strategy to achieve adaptive lighting.
2.4 Energy monitoring system design
2.4.1 Energy monitoring system master architecture
The tunnel energy monitoring information system consists of four basic components: data acquisition subsystem, information processing subsystem, information transmission subsystem and information release subsystem. The working principle is presented as follows: firstly, through the data collection subsystems of each service area, tunnel and toll station and according to certain rules, the information is sent to the central control unit through the data transmission network. Then the central control unit analyses and processes the information, stores it in the database server and distributes it to the information distribution subsystem to provide information services.
2.4.2 Energy monitoring and measurement unit
The energy monitoring and measuring unit collects energy consumption with the lighting circuit as the smallest unit. Then, it uses the existing network of the tunnel upload the energy consumption data to periodically, conducts information aggregation analysis in the tunnel monitoring room, counts the energy consumption and compares and analyses the energy-saving efficiency before and after the energy-saving renovation, thus achieving energy consumption monitoring and analysis functions.
The detection channel used by a single metering unit is a 16-loop, 3-phase energy metre. The metre used is a mutual-inductance meter that supports the DL/T-645 standard communication protocol of the Ministry of Power and provides an RS485 communication interface, have metering licence access qualification, and the measurement accuracy is 1 level; the accuracy of the current transformer is 1 level. The unit has an Advanced RISC Machines (ARM) micro-processing system that performs front-end processing on energy consumption data to reduce data traffic. Data can be stored locally for 1 month. Touch screen display is supported, and energy consumption reading display, smart metre, collection host and server clock timing synchronization are provided. The metering unit is equipped with power supply and signal lightning protection functions. The line layout is neat and tidy. The box is treated with galvanized sheet or spray and has a wall thickness of 2.0 mm. Data collection supports large concurrent energy consumption collection, and the data are stored in a relational database.
3. Application and results
3.1 Field implementation
The pilot tunnel of this project is the double line of the Yongtaiwen–Chayuanli (China) tunnel. The pilot reform is mainly used for safe, energy-efficient renovation of the tunnel. To reduce the time of road closure, the projects that take a long time and do not require the closed road to be constructed are set aside and completed before the closed road is constructed. The main operations include the completion of the luminance metre foundation and microwave vehicle inspection foundation production in advance. The project team enlisted technical personnel to enter the site in advance and complete the installation of energy metering cabinets, transformers, communication transmission equipment and acquisition hosts. After completing previous work, the road is closed to build a lighting control system. The lighting control system is mainly composed of lighting PLC + power carrier equipment. The lighting fixtures in the tunnel are arranged in bilateral symmetry, and the installation height of the lamps is 6.1 m above the ground. The left hole is not transformed with LED lights but adopts HPS lamp as the light source. A dimming controller is installed, which automatically switches and controls the lighting loop according to the design document and the ambient luminance outside the tunnel, and an energy metering cabinet is installed. The right hole is the implementation of the intelligent lighting transformation of this system, using LED lamps as the light source.
After the system’s hardware facilities have been installed, the system software needs to be debugged. The first step is the modelling of the dimming model, which needs to detect the luminance inside and outside the tunnel. The luminance outside the tunnel is measured by the luminance metre installed outside the tunnel. The luminance metre is installed 1 stopping sight distance away from the hole at a height of 1.5 m. The value is the average luminance within the detection range of 20°. The luminance value in the tunnel is the average luminance converted from the average illuminance measured by the illuminance metre. The average illuminance measured by the centre layout method divides each section into 10 × 5 grids, measures the centre of each grid and then takes the average value. After luminance detection inside and outside the tunnel is completed, the dimming curve is calculated according to the dimming proportion and the measured luminance value, and the intelligent dimming model is established. Afterwards, the luminance in the tunnel needs to be measured to check the accuracy of the dimming model. Figure 5 shows the fitting diagram of luminance detection in the tunnel.
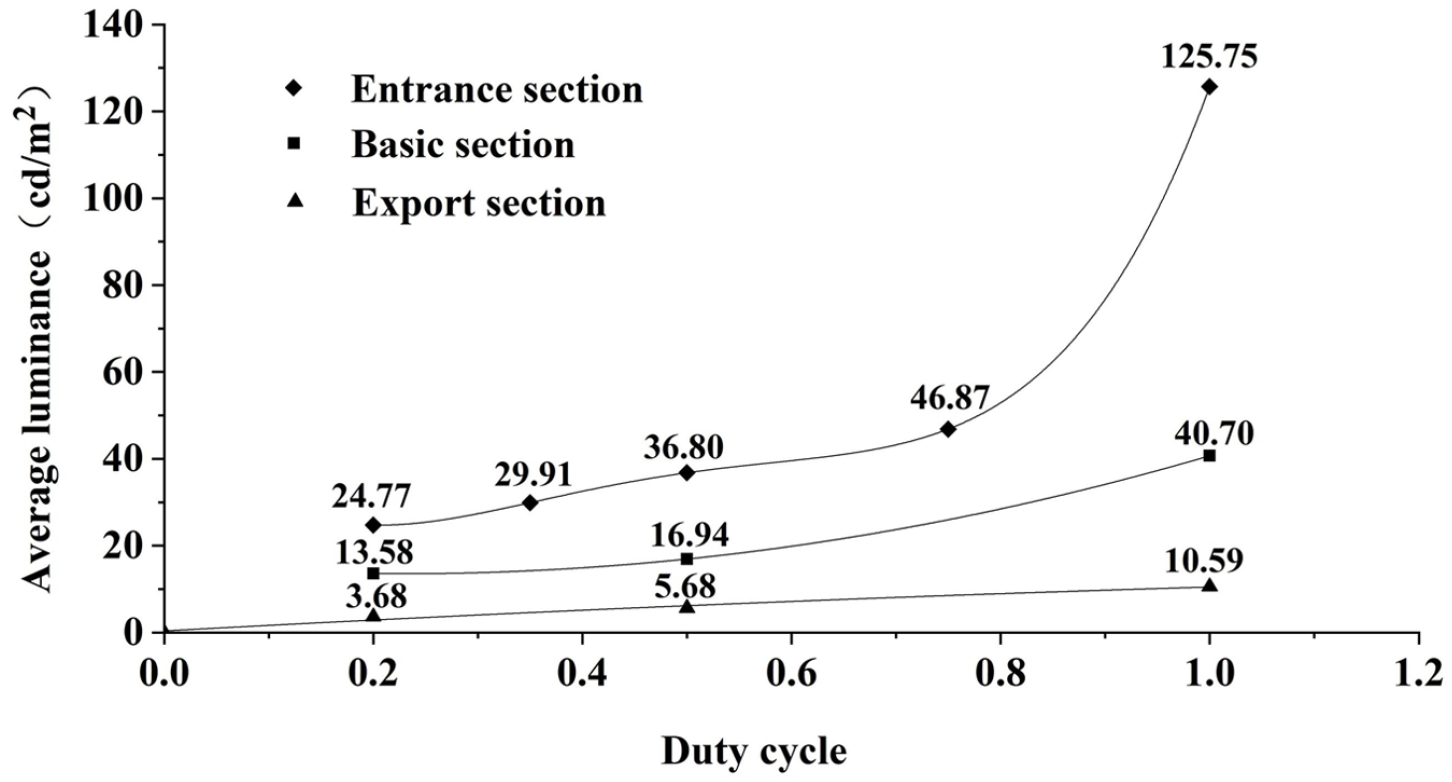
Fitting map of luminance detection in the Chayuanli tunnel
After the modelling is completed, the system software needs to be debugged and refined. The system software is mainly divided into lighting control software and energy detection platform software. The lighting control software is debugged and improved mainly to modify the software function according to the opinions of the on-site management personnel. The modifications are as follows: the circuit name is customized according to management habits, and the colours of the sodium lamp circuit and the LED lamp circuit are distinguished. Energy platform debugging mainly includes communication debugging, virtual serial port mapping, acquisition software installation and energy platform layout.
3.2 Operation result
After software debugging, the entire tunnel intelligent dimming control and energy consumption monitoring system can meet the expected normal operation. The intelligent lighting control system switches between several operating modes:
Intelligent mode: Automatic dimming control according to the luminance outside the tunnel, traffic volume and vehicle speed, where lights automatically open or close according to the loop without manual operation.
Manual mode: Manual switching of lights.
Emergency mode: The basic light is fully open, and the threshold zone and the high pole light are turned on according to the daytime and nighttime conditions.
The lighting control system can also view the single-light node information and can query historical traffic information. The target dimming scheme can be changed manually by setting the dimming parameters in the system settings. The energy consumption monitoring platform can perform functions, such as reporting statistics and chart analysis on the detected data.
After the completion of the pilot implementation, the lighting energy consumption data of the tunnel double tunnels were collected. The analysis and comparison of the energy consumption data for 63 consecutive days and the comprehensive energy-saving rate after the transformation reached 65%, as shown in Figure 6.
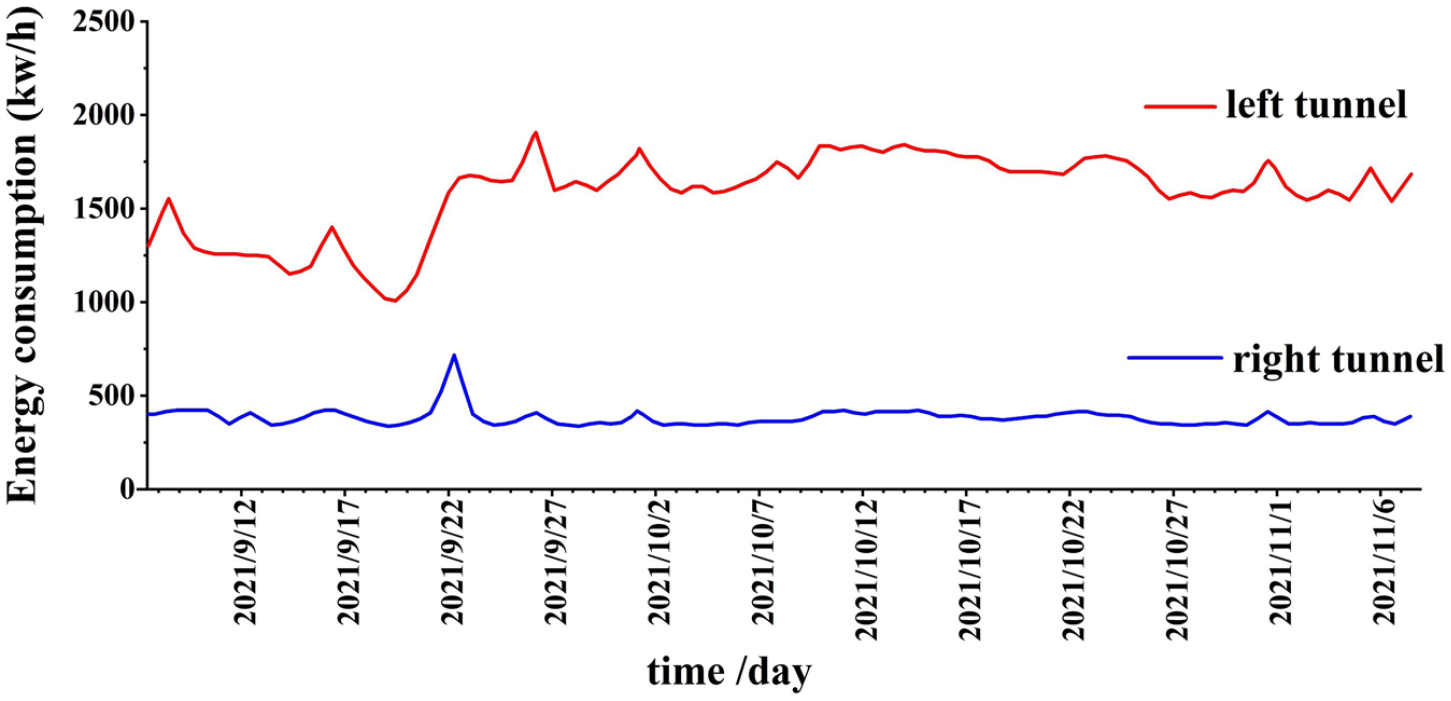
Comparison of the daily energy consumption in the left and right tunnels
3.3 Discussion
The variation of the reduction coefficient in the threshold zone of the tunnel under the control of the traditional method is shown in Table 1, and that under the control of the BP neural network is shown in Figure 1. The variation of the luminance of the interior zone of the tunnel under the control of the traditional method is shown in Table 2, and that under the control of the BP neural network is shown in Figure 2.
Tables 1 and 2 show that when the tunnel traffic volume N is constant, under the control of traditional methods, both the reduction factor k in the tunnel threshold area and the brightness in the tunnel result in stratified lighting, thus having difficulty ensuring that the tunnel lighting meets the requirements. For example, in Table 2, when N = 1200 veh/(hlh), the luminance in the tunnel is 6.5 cd/m2 for all speeds in the range of 80–100 km/h and 10.0 cd/m2 for all speeds in the range of 100–120 km/h. This control method is not reasonable because the design values are usually higher than the actual values and the calculated luminance values are too high, thus possibly leading to high energy consumption in the tunnel. In addition, the design values for this method are segmented discrete values, which do not meet the requirements for continuous dimming of LED lighting. As can be seen from Figures 1 and 2, the curve under BP neural network control increases with speed on the premise of ensuring tunnel safety, with different speeds corresponding to different output values, thus achieving continuous optimization of output value control, meeting the requirements of continuous dimming of LED lighting and improving the tunnel lighting effect and driving comfort. At most speeds, the luminance under the control of the BP neural network algorithm is much less than that under the conventional lighting design. Evidently, tunnel lighting saves energy when the tunnel lighting is low, which also demonstrates the significant energy-saving effect of the BP neural network control model over the conventional control.
When the speed V is constant, Table 1 shows that for the traditional method control, the reduction coefficient k in the threshold zone of the tunnel is set by linear interpolation and therefore overlaps with the effect of the BP neural network control in Figure 1. Table 2 shows that the traditional method control of the tunnel interior luminance is controlled in layers according to the tunnel traffic volume and cannot adjust the luminance according to the actual traffic volume and vehicle speed. From the curve of the BP neural network control in Figure 2, the luminance varies linearly with the tunnel traffic volume, and the control is more intelligent.
In summary, the intelligent dimming model based on BP neural network designed in this work can automatically control the luminance of the lighting in the tunnel according to the real-time measurement results of the luminance outside the tunnel, tunnel traffic volume and traffic speed. The use of this system can ensure the safety of tunnel traffic while minimizing the consumption of manpower and electricity for tunnel lighting.
4. Conclusion
The tunnel intelligent dimming control and energy consumption monitoring system developed in this work demonstrates pertinence and practicability. Using the dynamic predictive modelling of tunnel traffic, BP neural network-based dimming control model and integrated closed-loop control mathematical model of luminance inside and outside the tunnel for intelligent dimming, the constructed tunnel lighting system model improves the accuracy and rationality of on-demand tunnel lighting, providing technical support for the construction of an economic, safe and energy-efficient intelligent lighting system. The embedding of the energy consumption monitoring link provides an effective basis for the management department’s scientific energy management decision-making and ensures that energy management projects for promoting tunnel lighting energy-saving renovations are implemented scientifically and reasonably. The feasibility and performance of the system were proven by actual application in a tunnel, and the comprehensive energy-saving rate after the transformation reaches approximately 65%. The system provides a basis for the implementation of tunnel energy saving and safety transformation and the development and testing of other electromechanical systems in tunnels. Moreover, it accelerates the improvement of tunnel lighting and other electromechanical systems with significant application prospects.
Footnotes
Declaration of conflicting interests
The authors declared no potential conflicts of interest with respect to the research, authorship and/or publication of this article.
Funding
The authors disclosed receipt of the following financial support for the research, authorship and/or publication of this article: This work was supported by the National Natural Science Foundation of China (NSFC) (Grant No. 61904168) and Fundamental Research Funds for the Provincial Universities of Zhejiang (Grant No. 2021YW19, 2021YW75).