
Abstract
Pedestrians need to be able to evaluate other people to support their feeling of safety. While past studies have thus investigated the degree to which road lighting supports facial identity and facial emotion evaluations, it is not yet known whether the face is the most important visual cue. Following a pilot study that indicated the importance of the ability to see the face and hands of other people, an experiment was conducted in which test participants evaluated safety when shown photographs of an approaching person in night-time scenes. These photographs displayed variations in the exposure or concealment of the face and hands. Two procedures were used, category rating and paired comparisons. The results suggest that the face is a more important visual cue than the hands for pedestrians’ evaluations of the intent of other pedestrians after dark.
1. Introduction
The decision to walk rather than to use some other form of transport or to avoid a journey altogether, requires that pedestrians are safe and feel safe. Safety is promoted by meeting the needs for pedestrians to detect potential trip hazards 1 and to be seen by drivers in sufficient time to avoid a road traffic collision. Pedestrians with the ability to see the way ahead, to see who may be approaching, and to see potential escape routes to refuge will feel safer. 2 Therefore, to be safe and to feel safe, pedestrians need to be able to recognise the details of their environment. After dark, road lighting supports this by offsetting visual impairment due to darkness.
One aspect of feeling safe is the ability to evaluate other people in the environment, 3 referred to here as interpersonal evaluations, and supporting this task after dark is one reason for installing lighting in subsidiary roads.1,4,5 The cues which might contribute to interpersonal evaluations include body posture, hand gestures, eye contact and facial expressions of emotion,6–10 but it is not known which, if any, plays the more dominant role.
Previous studies investigating the effect of changes in lighting on interpersonal evaluations have tended to assume that the face is the important cue. In some studies this has been operationalised as facial identity recognition.3,11–21 More recent work has instead considered facial emotion recognition as conveyed by facial expression.22–27 However, an assumption of either approach, that the face is the critical visual cue, has yet to be verified.
A pilot study 28 was conducted to explore different potential visual cues for interpersonal evaluations to determine their relative influence. These cues, informally suggested by a technical committee reviewing guidance for pedestrian lighting, were the gender and number of people encountered, their relative direction of walking, the light direction (front lit or back lit), and whether the face and hands were concealed or exposed. Participants observed images of actors portraying this range of visual cues in a night-time urban scene and evaluated safety using a category rating scale. The results confirmed expectation that a lower level of safety is reported when observing single males, with hands and face partially concealed, and when the other person is backlit and walking towards the observer. Exposure of the face and hands was suggested to be the more significant factor because the difference between the two levels (exposed vs partially concealed) was greater than the differences for any of the other cues. However, the pilot study image obscured the face and hands simultaneously so it was not possible to determine whether the hands or the face was the more important cue.
This paper reports a further experiment carried out to compare the influence of the face and hands on evaluations of perceived safety, thus to identify which is the more important visual cue. Four variations each of face and of hand exposure were portrayed by actors to establish the degree to which these influenced the safety evaluations. A second procedure (paired comparisons) was added to offer verification of results obtained using category rating. This experiment sought to compare the importance of the face and the hands, by varying the degree to which these features were concealed. It was hypothesised that greater differences in evaluations with changes in concealment would suggest this to be the more important visual cue.
2. Method
2.1 Apparatus
Images of actors embedded in night-time scenes were projected onto a laboratory wall (Figure 1) and test participants were required to evaluate their feeling of safety when observing each scene. The laboratory lighting was switched off and daylight from the window obstructed using curtains, thus providing a dim ambient light level to simulate walking after dark.
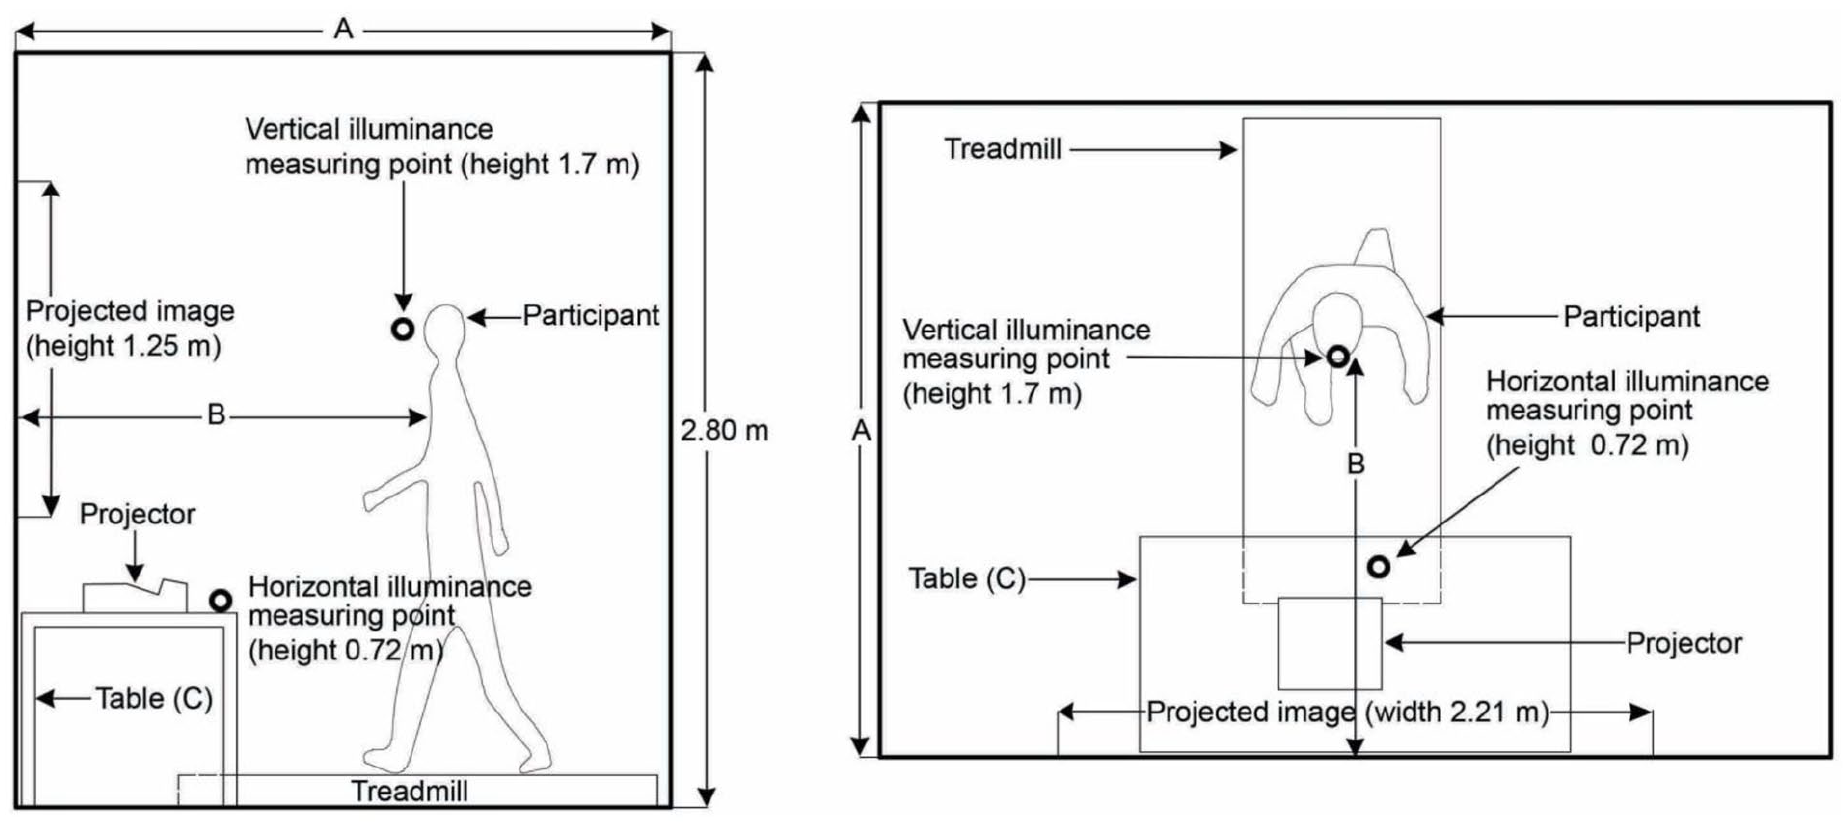
Diagram of the apparatus: section (left) and plan (right). Dimensions: A = 2.43 m (laboratory length from front to back wall). B = 1.5 m (from the projected image to the participant). C = table dimensions; L = 1.6 m, W = 0.80 m, H = 0.72 m. The vertical centre of the projected image was aligned with typical eye level of a standing adult
Walking is associated with the brain activity of executive cognitive functioning. 29 To simulate the cognitive demand of walking 30 participants walked upon a treadmill during trials. The treadmill speed was set to 2.5 km/h at the start of each trial, and test participants were instructed to change this, if required, to reach a comfortable walking speed. As a result, walking speeds during the experiment ranged from 1.5 to 3.5 km/h.
As the acoustic environment may affect mood and decisions, 31 a recording of street sounds was played during trials. This comprised mainly the sound of wind with a few passing vehicles; it did not include any attention-attracting sounds such as those of animals, people shouting, phone ringing or music.
2.2 Test images
Test participants were instructed to evaluate perceived safety when observing images of an approaching pedestrian. The targets for these evaluations were established by embedding photographs of actors into photographs of night-time scenes. The actors were four students of different nationalities and genders (Table 1). They were asked to display a range of hand and/or face exposures, with a neutral facial expression, and to hold a static position – right leg forward and left leg behind, as if walking, head facing straight forward.
Information about the actors used to create the test images
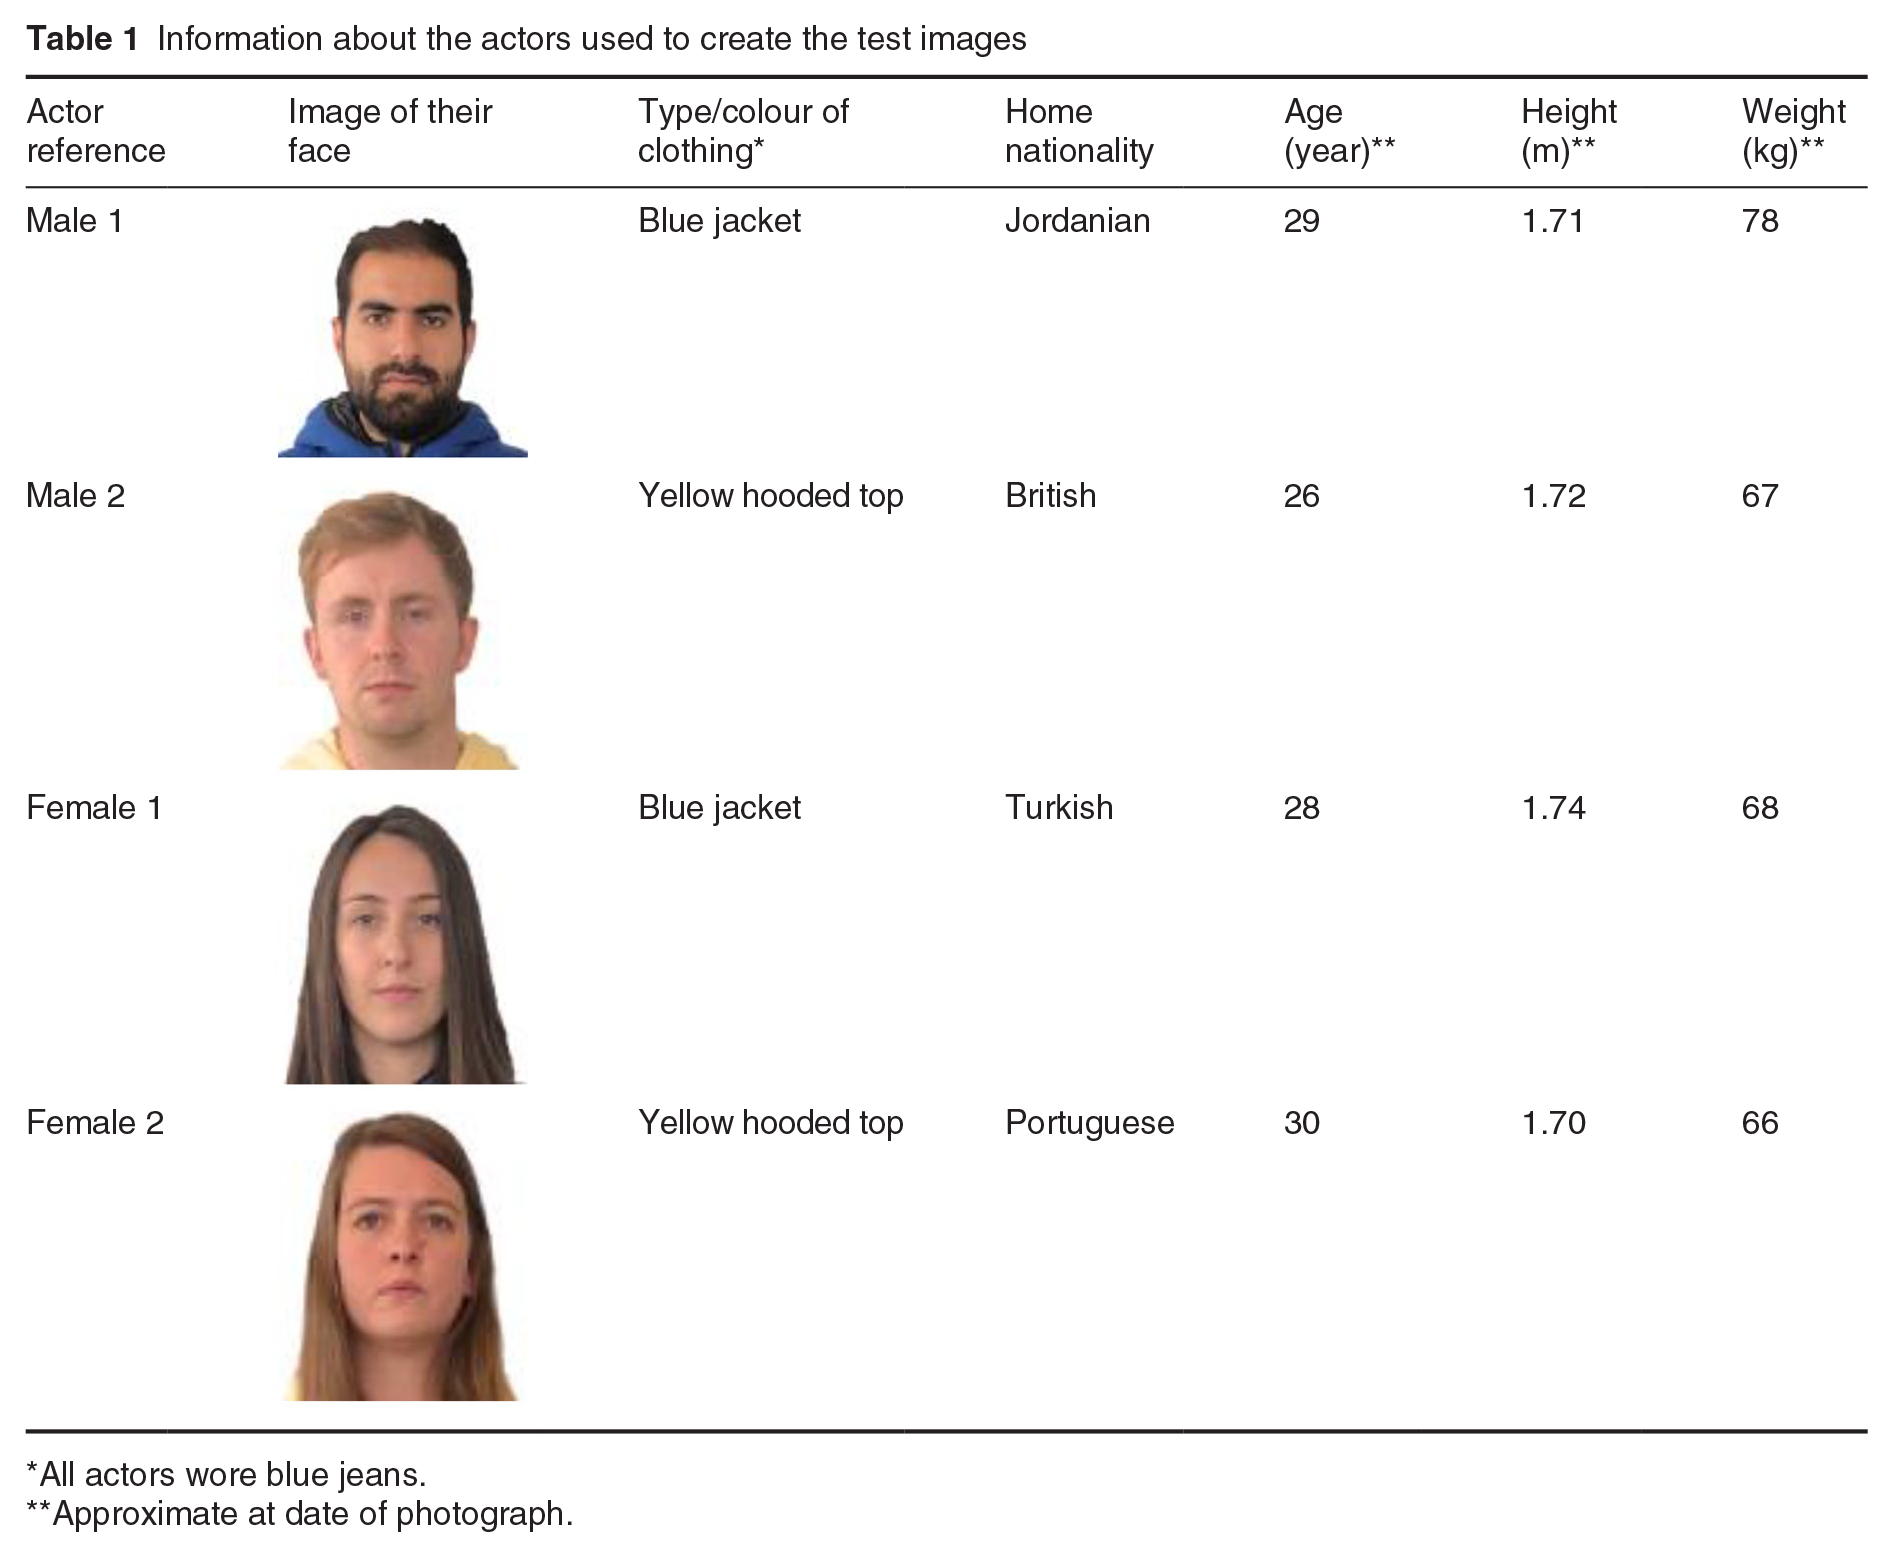
All actors wore blue jeans.
Approximate at date of photograph.
Two background scenes were used to enable subsequent determination of whether this influenced the safety evaluations – a brightly lit road, dominated by High Pressure Sodium (HPS) lamps (as previously used in the pilot study 28 ), and a back alley dimly lit by LEDs.
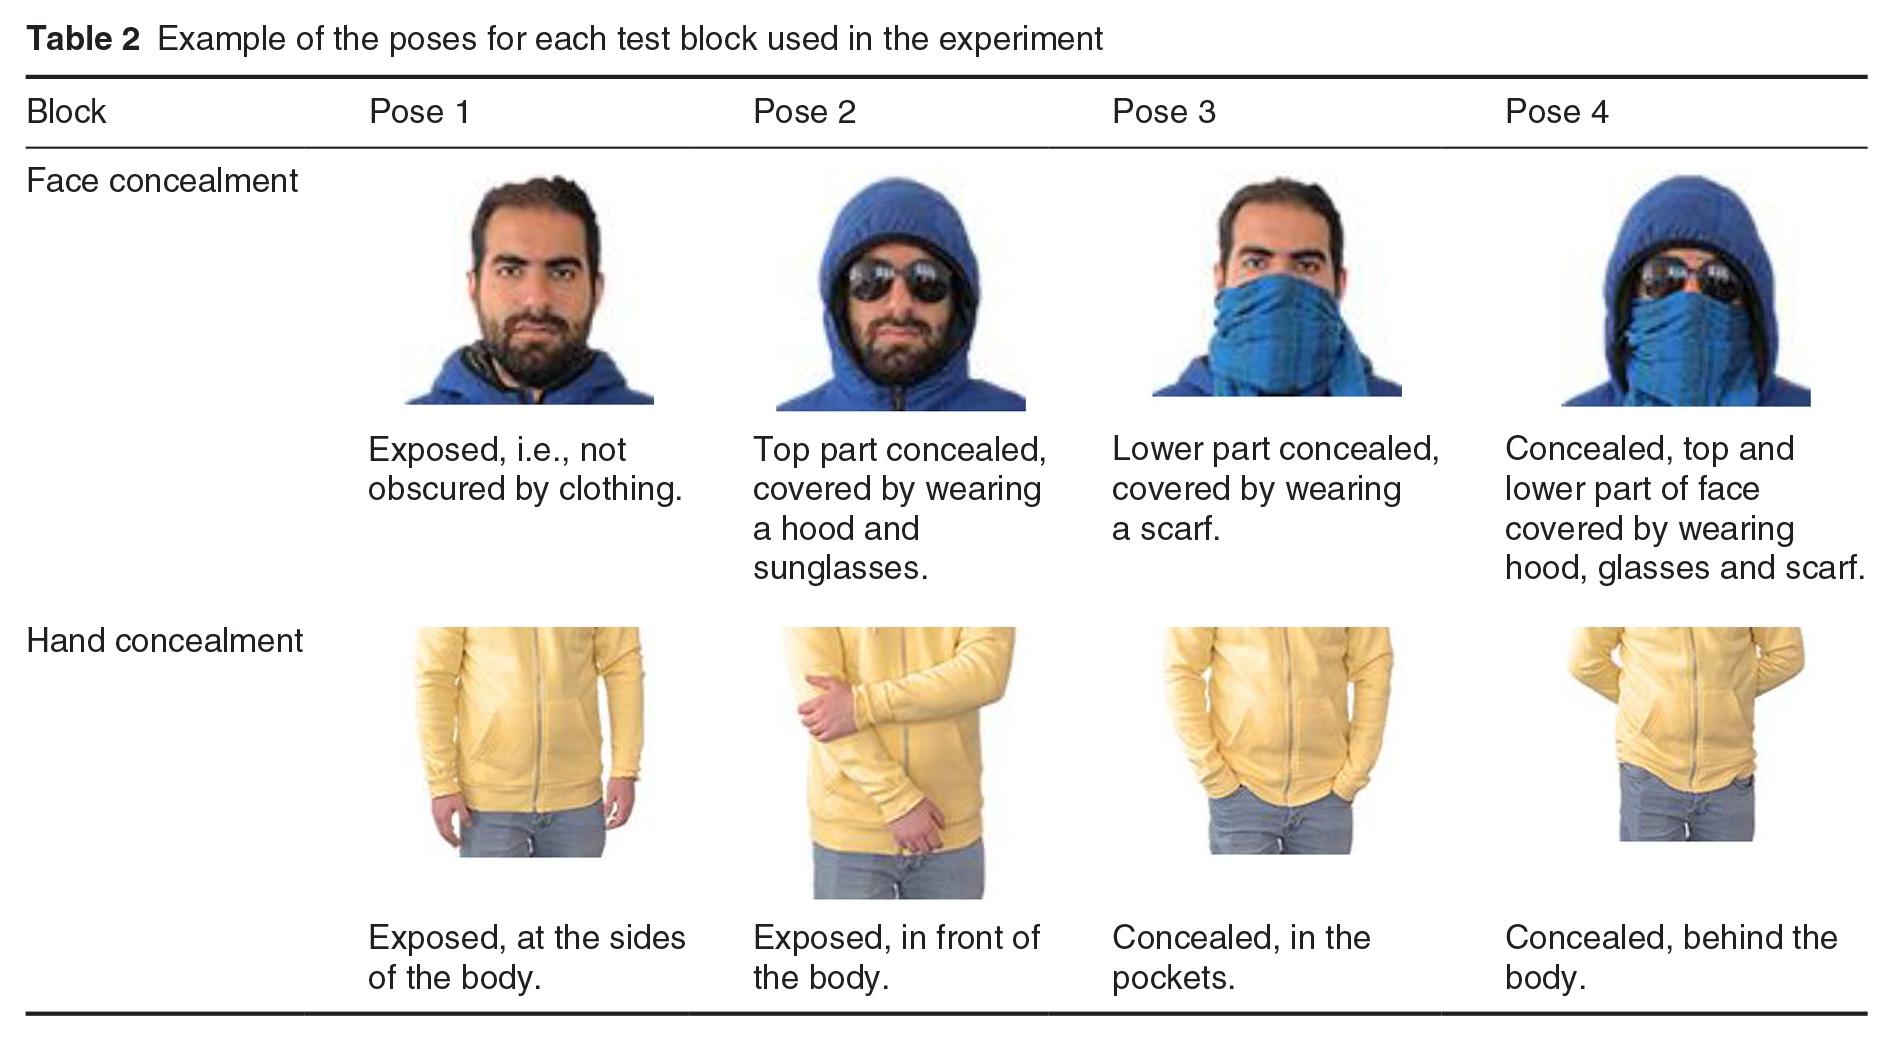
There were three blocks of trials, evaluating separately the influence of face concealment, hand concealment, and face and hand concealment combined (mixed concealment). Note that results of the mixed block are not included in this paper. In each block, the four actors each portrayed the four levels of concealment as shown in Table 2. The face block, for example, therefore included 16 test images. An example of a final image of an actor embedded into the background is shown in Figure 2.
Example of the poses for each test block used in the experiment
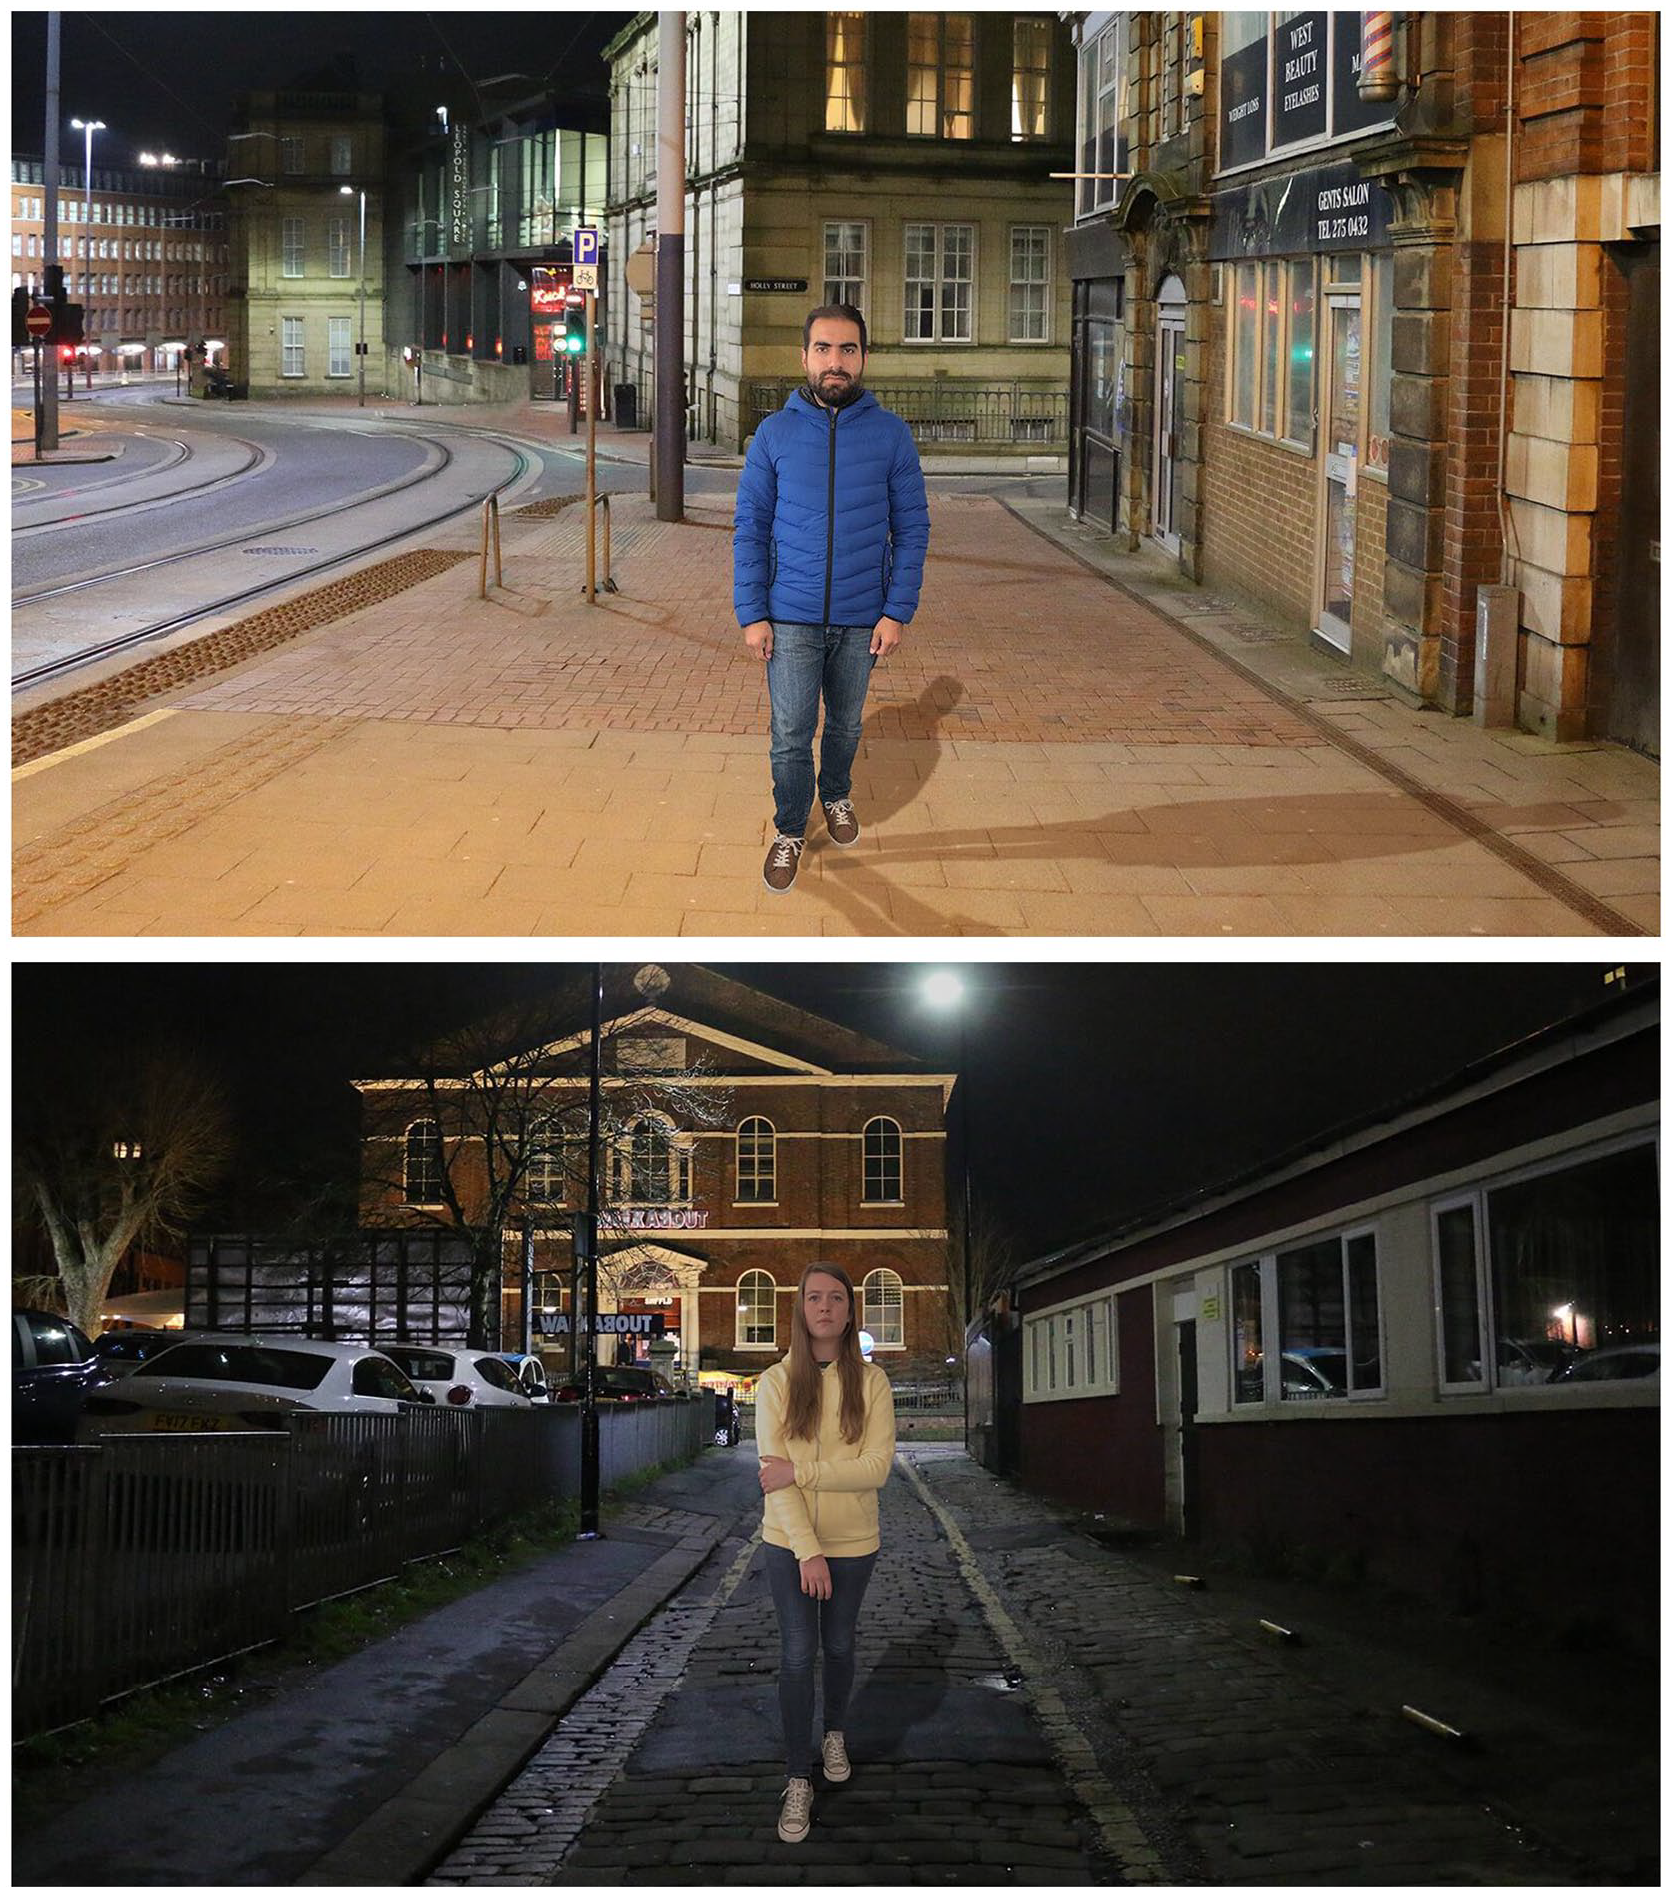
Example of a test image. Top: pose 1 in the face block and the hands block used in background scene 1, shows male 1 with exposed face and hands. Bottom: pose 3 in the hands block used in background scene 2, shows female 2 with concealed hands in pockets
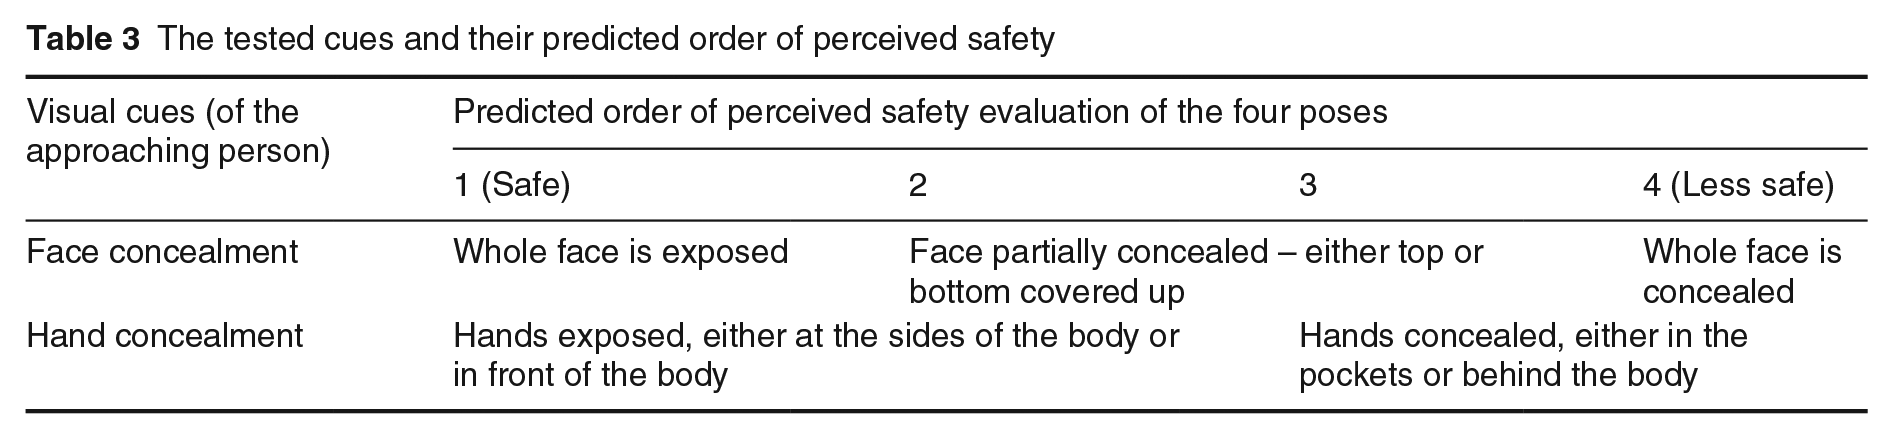
The importance of the face and the hands for evaluations of interpersonal safety was explored by varying the degree to which these features were concealed. It was hypothesised that greater differences in evaluations with changes in concealment would suggest a more important visual cue. The predicted outcomes are shown in Table 3.
The tested cues and their predicted order of perceived safety
The test images were projected onto a white wall giving a projected image of resolution 1920 × 1080 pixels, 2.21 m width and 1.25 m height. The actors in the images were scaled to subtend an angle of 24° at the observer’s eye, representing observation of a person of height 1.7 m at a distance of 4 m.
The test environment was set up to promote a level of visual adaptation similar to that of an outdoor situation. Background scene 1 provided a vertical illuminance of about 18 lx at the observers’ eyes (21 lx horizontal illuminance: Figure 1 shows measurement locations) while background scene 2 provided a vertical illuminance of about 4 lx (5 lx horizontal). These conditions were chosen to target approximately representative levels of luminance adaptation, but we do not expect a change in light level (within the range of conditions expected to be encountered in road lighting) to significantly affect relative responses for the different poses.
2.3 Procedure
While the experiment had three pairs of blocks (face, hands and mixed), this paper includes, for brevity, only the results for two blocks (face and hand concealment) as shown in Tables 2 and 3. An experimental session comprised six blocks (3 blocks × 2 procedures), separating variations of face concealment, hand concealment and the mixed block, with each evaluated using two procedures, category rating and paired comparisons. Block order was randomised. Each test participant evaluated all target combinations, with both procedures, within a single test session. At the start of each test session there was a period of 20 minutes to allow adaptation to the low light level during which time the researcher described the experiment, followed by practice trials to reinforce their understanding of the instructions.
For the category rating procedure, the 16 images within each block were shown individually, for 0.5 seconds, the typical duration of visual fixation upon other pedestrians. 32 After observing an image, participants were asked: How safe would you feel in this situation? Responses were given using a six-point rating scale (extremely unsafe, very unsafe, slightly unsafe, slightly safe, very safe, extremely safe), subsequently they were numbered 1–6 for analysis. We used an even number of points to avoid the middle option and hence created a forced choice scale. 33 We used six points as this is suggested to be greater than the minimum needed (five) for the assumption of continuous data. 34 A sample image is shown in Figure 3. In addition to the 16 test images per block there were a further four repeated images, chosen at random from the 16 test images, thus giving 20 images, observed in a randomised order. The repeated images were included to test for order effects and for any unexpected difference. 35
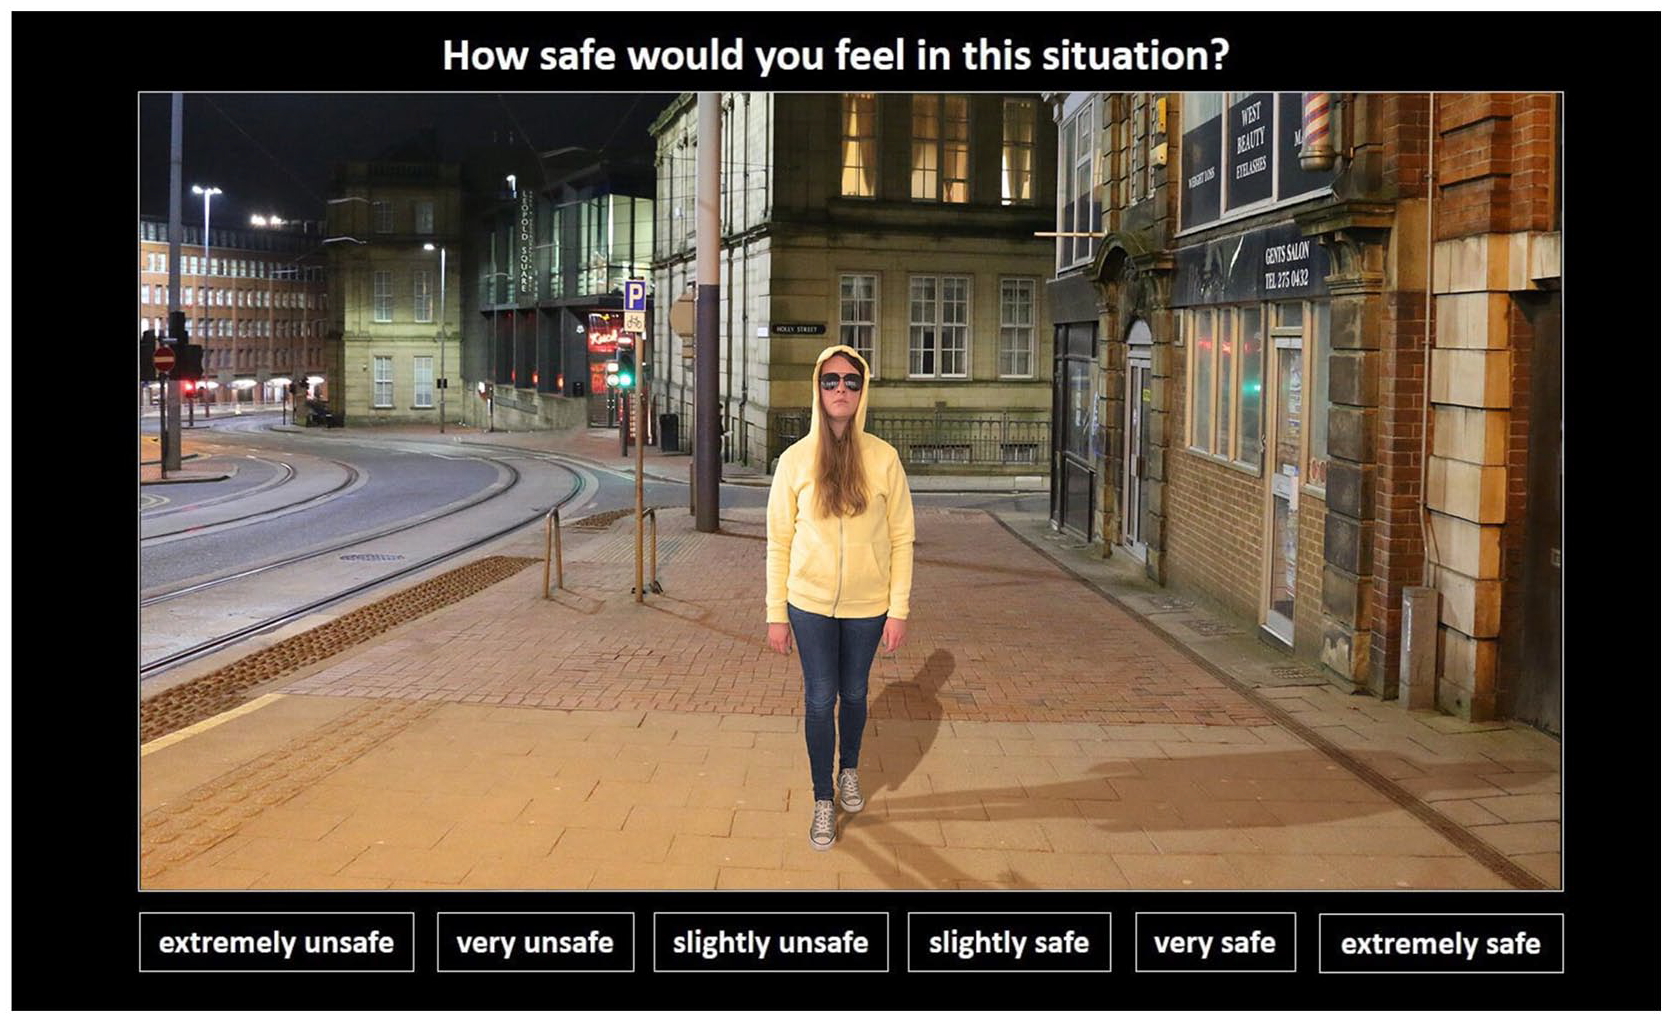
An example of a category rating test image. This is pose 2 in face block, female 2 with top part of the face concealed
For the paired comparison trials, two images were displayed side by side, viewed simultaneously for an unlimited duration, from which the participant was instructed to identify: Which situation would make you feel safer? This was a forced choice; the equally safe response was not permitted. The 16 test images were shown in all 120 possible combinations. A sample image is shown in Figure 4. Following onset of a given pair, there was a 2-second delay before the response options appeared on screen and the response buttons became active. This was done as a precaution against rapid responding without first inspecting the images. After giving a response, there was a 2-second interval before onset of the next image pair. Eight null-condition pairs were included to check for position bias, in which the left and right scenes were identical, giving a total of 128 pairs of images in each block.
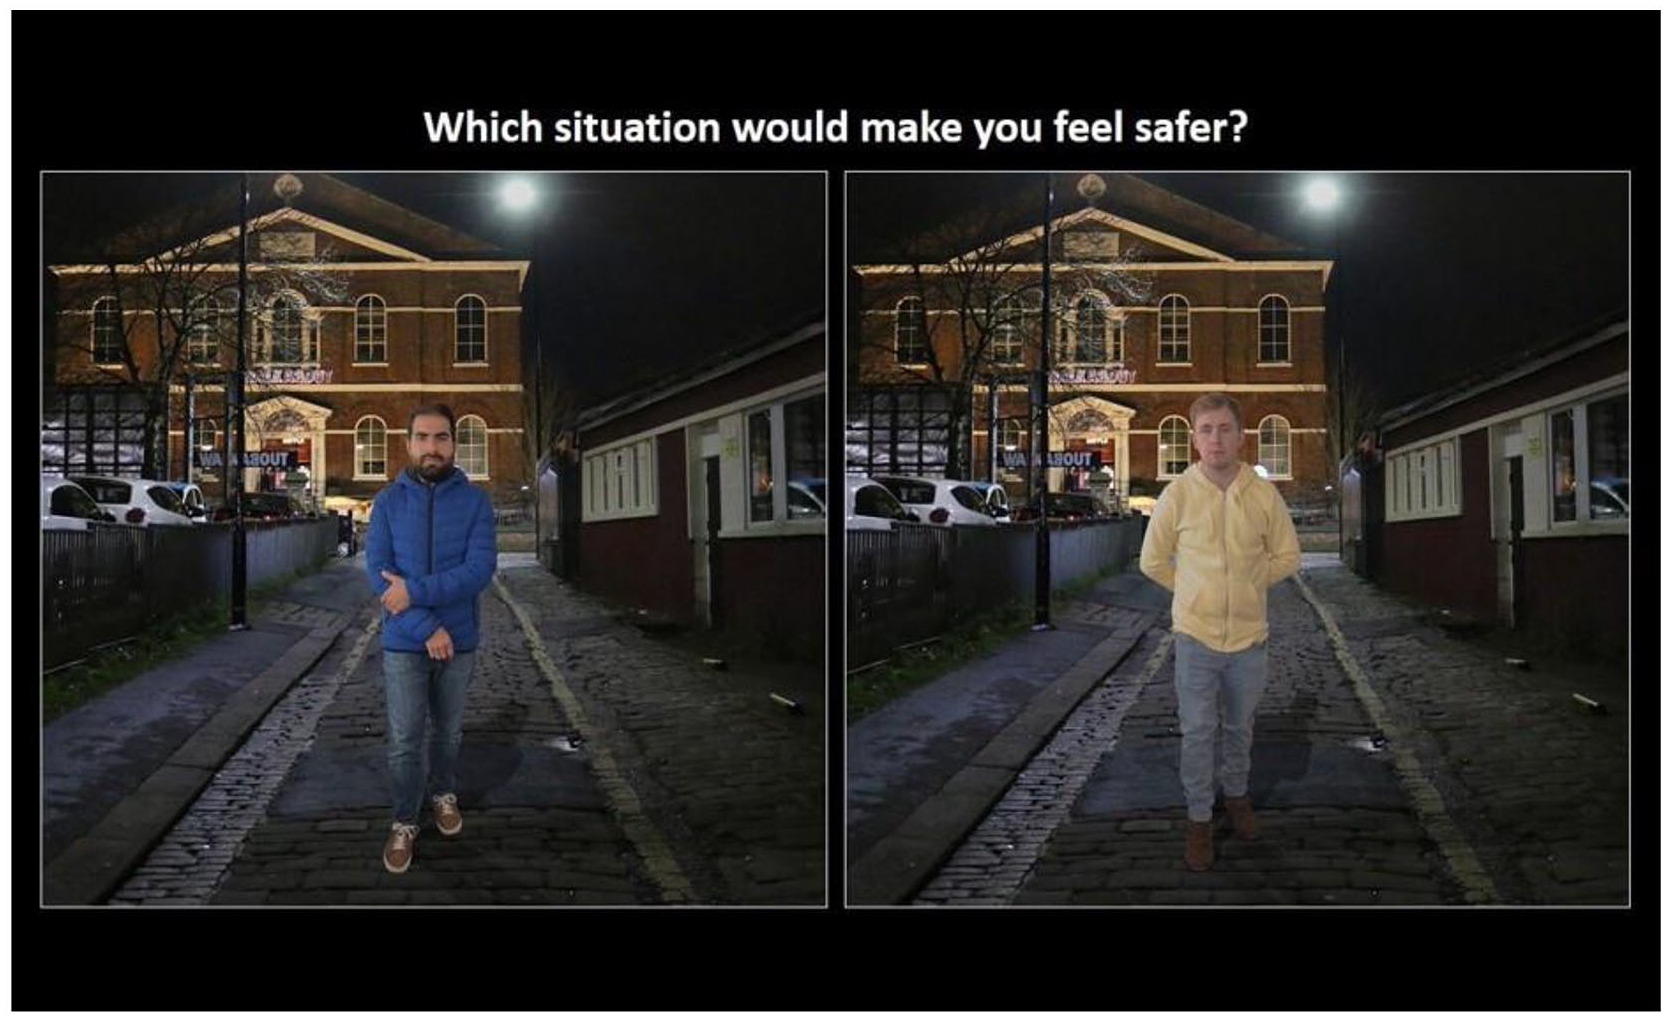
Example of a paired comparison test image. This is for the hands block: Left: pose 2, male 1 with hands exposed in front of the body. Right: pose 4, male 2 with hands concealed behind the body
2.4 Participants
Forty-four test participants were recruited for this experiment, with an equal gender balance, and an age range of 18 to 34 years. Participants were required to have reasonable eyesight including normal colour vision and normal or corrected-to-normal visual acuity as screened at the beginning of the experiment using a Landolt ring acuity chart and the Ishihara colour test plates, illuminated by a D65 daylight-simulating lamp. Participants provided written consent in accordance with the protocols approved by the University of Sheffield Ethics Review Committee.
3. Results
3.1 Results: Category rating
Four steps were used to determine whether the data were normally distributed: comparison of the mean and median measures of central tendency, graphical representations of the data, measures of dispersion (skewness and kurtosis), and the Shapiro–Wilks and Kolmogorov–Smirnov tests. These did not suggest that the data were drawn from a normally distributed population. Figure 5 therefore shows the median ratings and interquartile range for each actor in each pose of face and hands blocks. These data suggest that changes that involved concealment of the face led to greater differences in perceived safety than did changes in concealment of the hands.
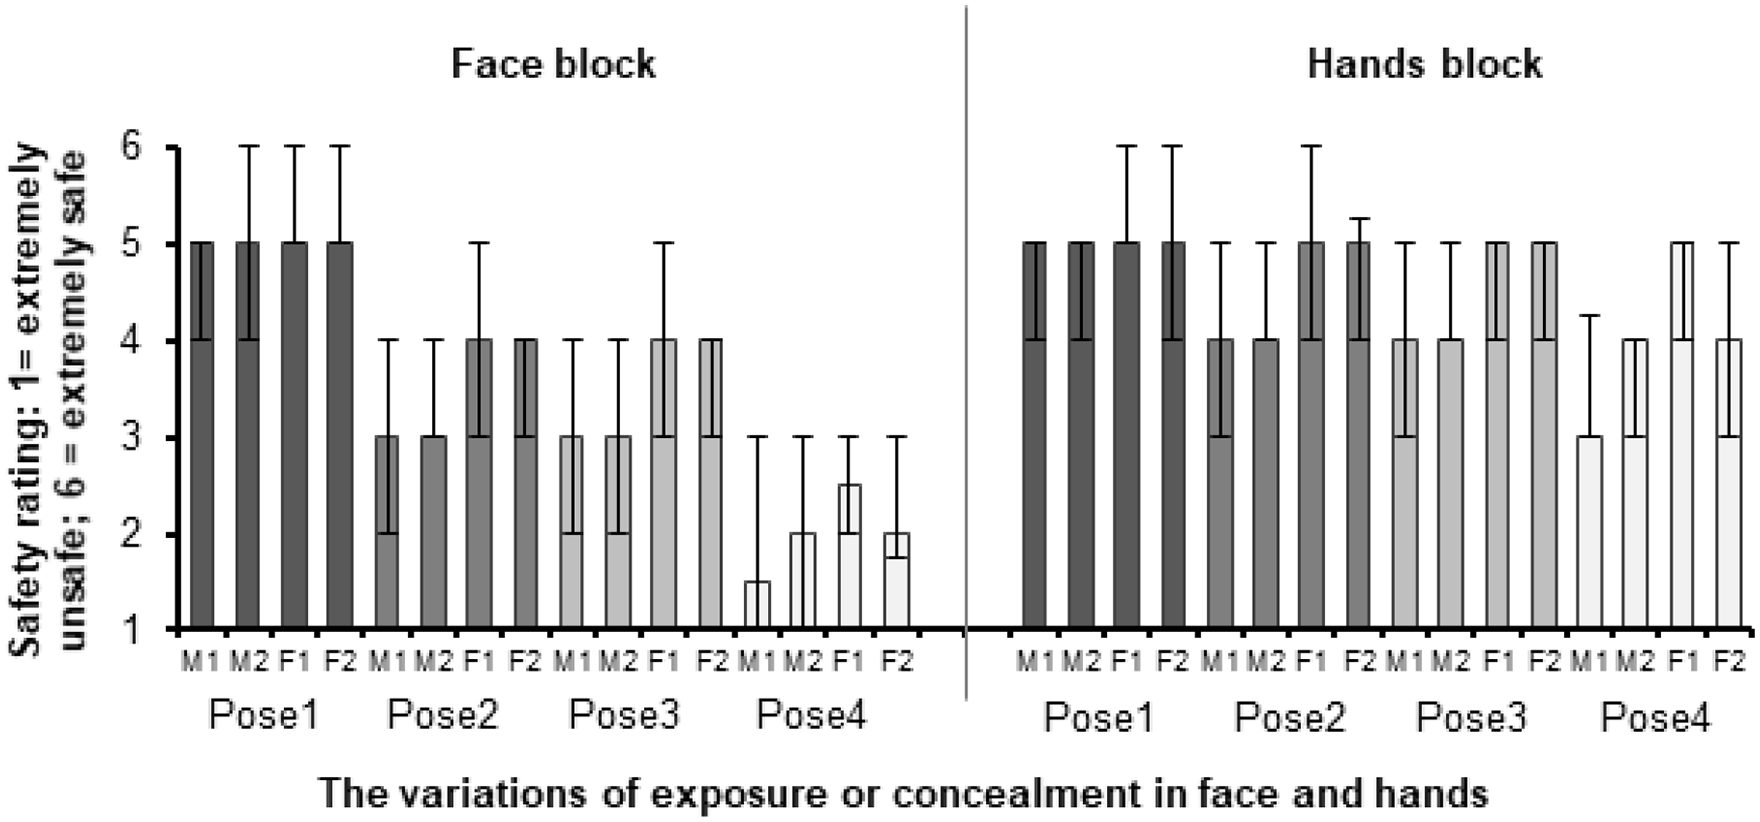
Median ratings of safety for each actor in a pose for both blocks. Error bars show the interquartile range. The poses are illustrated in Table 2
The results were first analysed to check for order bias, comparing ratings given on the first and second evaluations of identical images. Each of the 44 test participants evaluated four repeated pairs in each of two blocks, giving in total 352 repeated evaluations. In 232 (71%) of these trials the same rating was given in both evaluations of the same test image. Of the remaining 120 trials, the first and second evaluations led to the safer rating on similar numbers of trials (59 safer on first trial, 61 safer on second trial). Differences between first and second evaluations were not significant (Wilcoxon test, p > 0.05), suggesting that any order effect was negligible. In any case, the test images were presented in a randomised order to offset order effects. Subsequent analyses used ratings of the first observation of the repeated images.
Each of the four target actors was embedded into two different background scenes, with each scene evaluated by a different sample of 22 people. The Mann–Whitney test for independent samples did not suggest a significant difference (p > 0.05) between the evaluations given in each scene. This conclusion was consistent for both blocks. Therefore, the data were reorganised as one set of 44 test participants and the background scene was ignored.
Within each block there were 16 target images (four actors each displaying four poses). The Friedman test suggested significant differences (p < 0.001) in evaluations for these 16 images, for both the face and hands blocks. For a given pose, the Friedman test suggested significant (p < 0.001) differences between the four actors. For a given actor (and also for all actors considered together), the Friedman test suggested significant (p < 0.001) differences between the four poses, for both the face and hands blocks.
Differences between each pair of poses were then tested using the Wilcoxon test. These differences were not consistent between actors. The subsequent results will discuss separately these poses’ differences for both blocks. Table 4 shows the significance of differences between poses and the effect size of those differences. The effect size was estimated using Cohen’s d, calculated between all combinations of the four poses. 36
The significance of differences and the effect size between each pair in both blocks found using category rating. Differences were tested using Friedman test and were consistent for the four actors except where shown
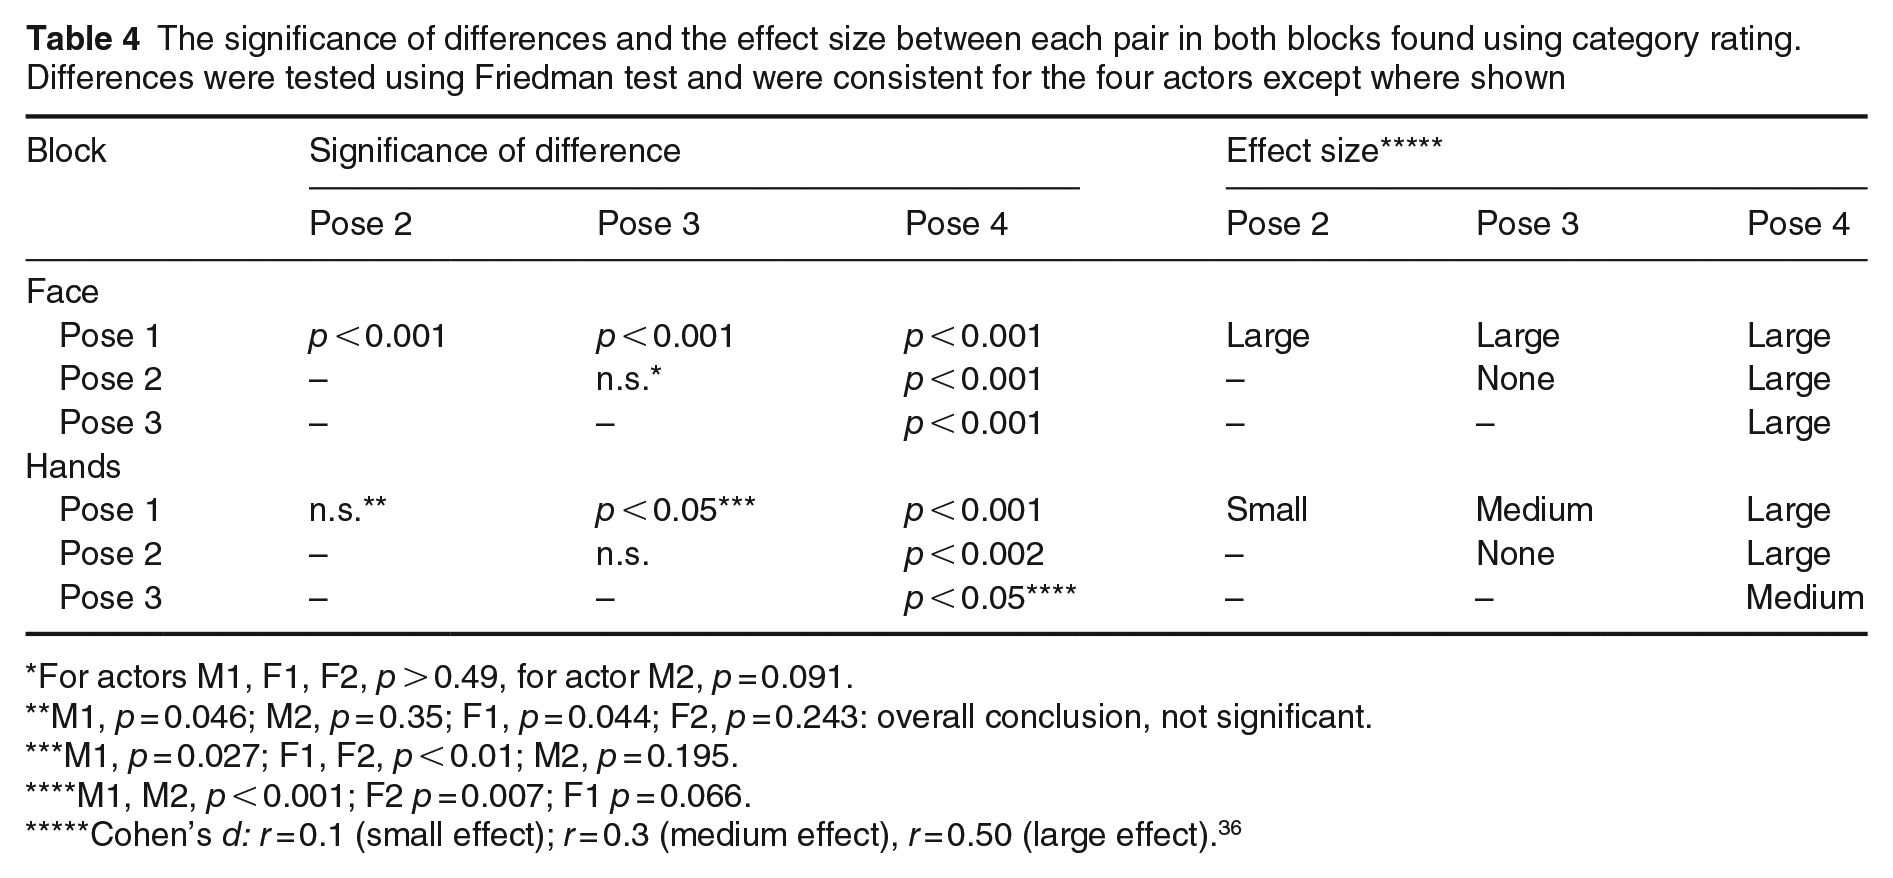
For actors M1, F1, F2, p > 0.49, for actor M2, p = 0.091.
M1, p = 0.046; M2, p = 0.35; F1, p = 0.044; F2, p = 0.243: overall conclusion, not significant.
M1, p = 0.027; F1, F2, p < 0.01; M2, p = 0.195.
*M1, M2, p < 0.001; F2 p = 0.007; F1 p = 0.066.
**Cohen’s d: r = 0.1 (small effect); r = 0.3 (medium effect), r = 0.50 (large effect). 36
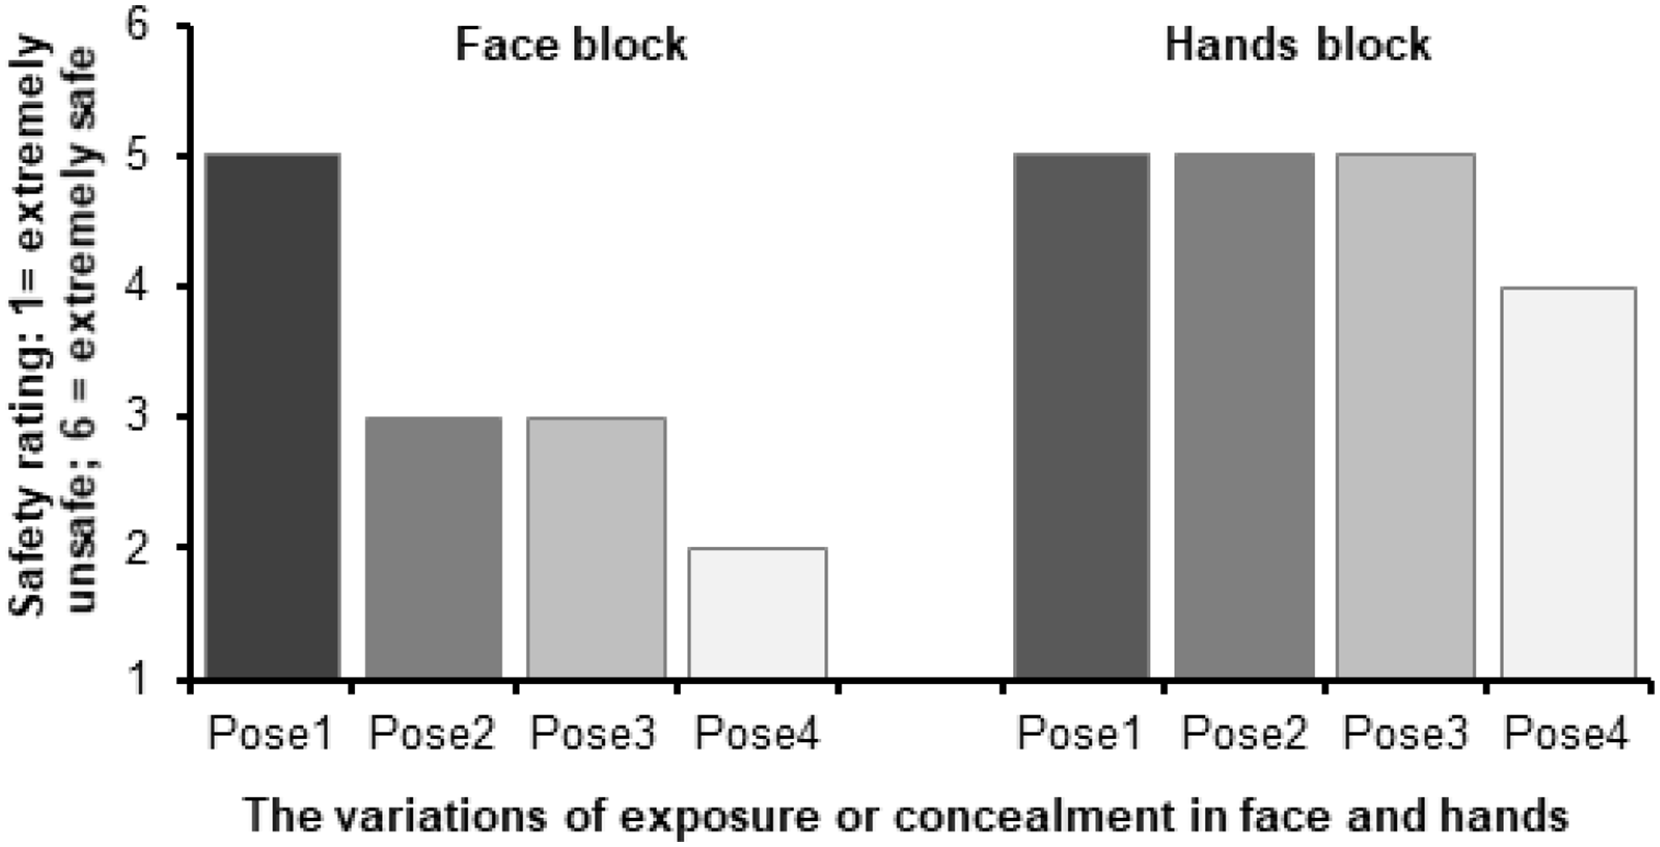
Increases in face concealment led to a gradual reduction in ratings of safety (Figure 8). The rating for pose 1 (face exposed) was significantly higher than for any other pose; the rating for pose 4 (face covered) was significantly lower than for any other pose. Differences between median ratings of poses 2 and 3 were not suggested to be significant (Table 4). These differences are suggested to be a large effect except between poses 2 and 3 where the effect size is negligible.
Changes in hand concealment led to smaller changes in safety evaluations than did changes in face concealment (Figure 8). The same median rating (5) was found for poses 1–3 (hands at side, in front, in pocket). Comparison of poses 1 and 3 suggested a significant difference with large effect, but the other comparisons (1 vs 2 and 2 vs 3) were not suggested to be significant differences and were small and negligible effect sizes (Table 4). A lower median rating found only for pose 4 (hands behind the back) was suggested to be significantly different to all the other poses with a large effect, except between poses 3 and 4 with a medium effect. Poses 3 and 4 presented the hands concealed rather similarly (in pockets and behind back), and suggested a significant difference with medium effect. This suggests that hands behind the body are perceived as more menacing than other hand locations.
3.2 Results: Paired comparisons
For the 16 test images, the maximum possible number of votes for each image was 660 votes (each paired with 15 other images × 44 participants). Figure 6 shows the percentages of evaluations in which the pose was stated to be the safer of the two. A lower percentage indicates a pose was considered to be less safe. Analyses of the paired comparison results used the percentages of votes across all four actors for a given pose as shown in Figure 7. Comparison of Figure 7 with Figure 8, which shows results of the category rating procedure averaged across the four actors, indicates that paired comparisons and category rating led to similar trends.
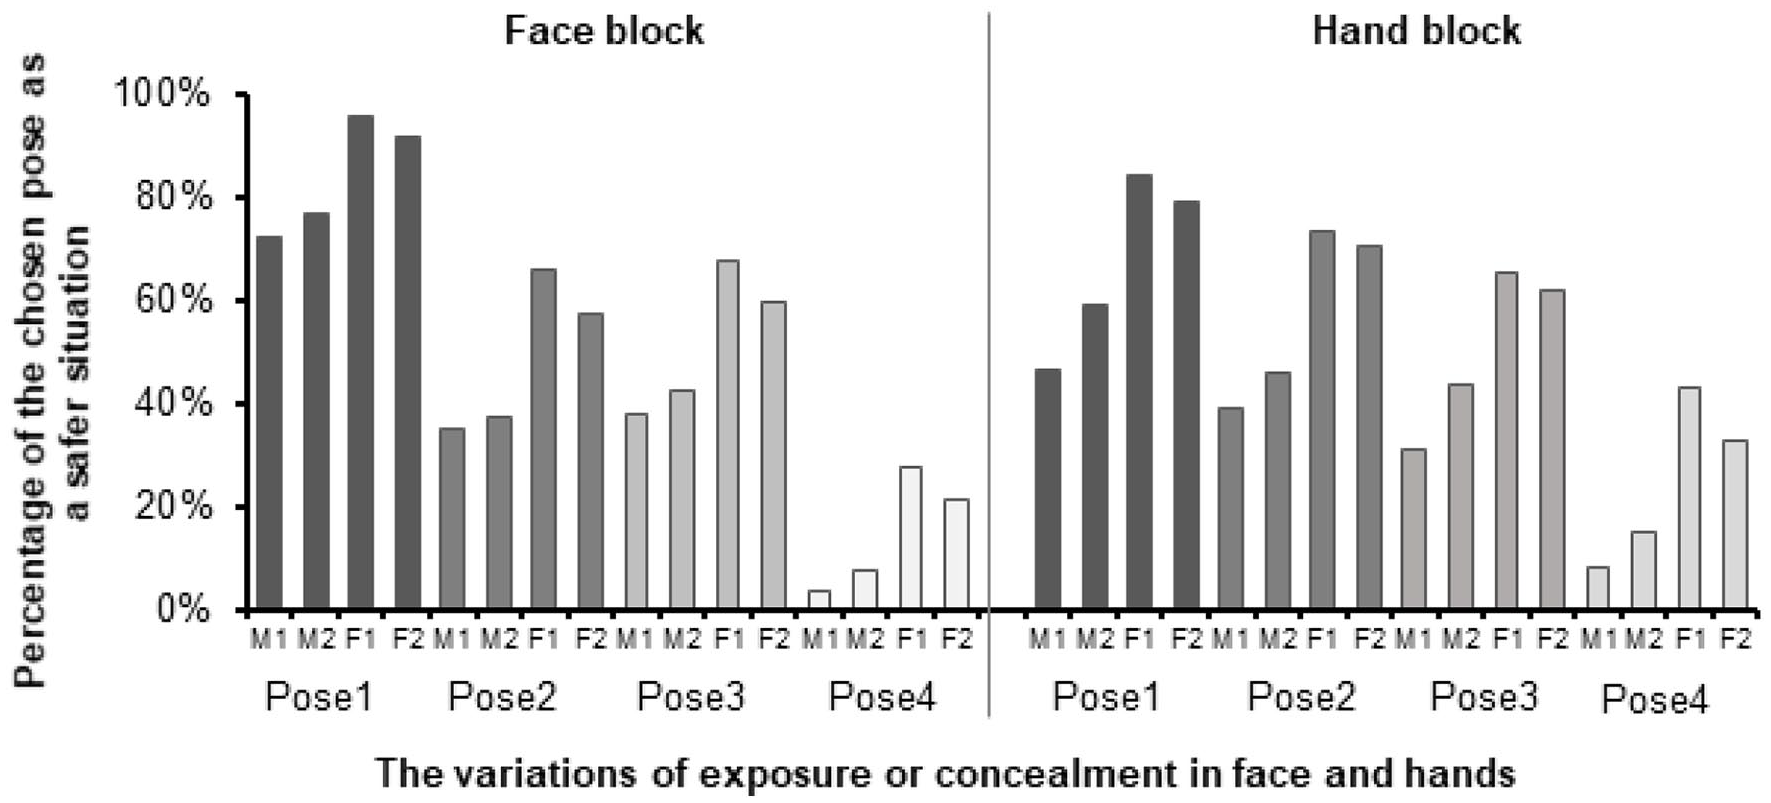
Percentage of votes for each pose as the safer, for each actor and both blocks. The poses are illustrated in Table 2
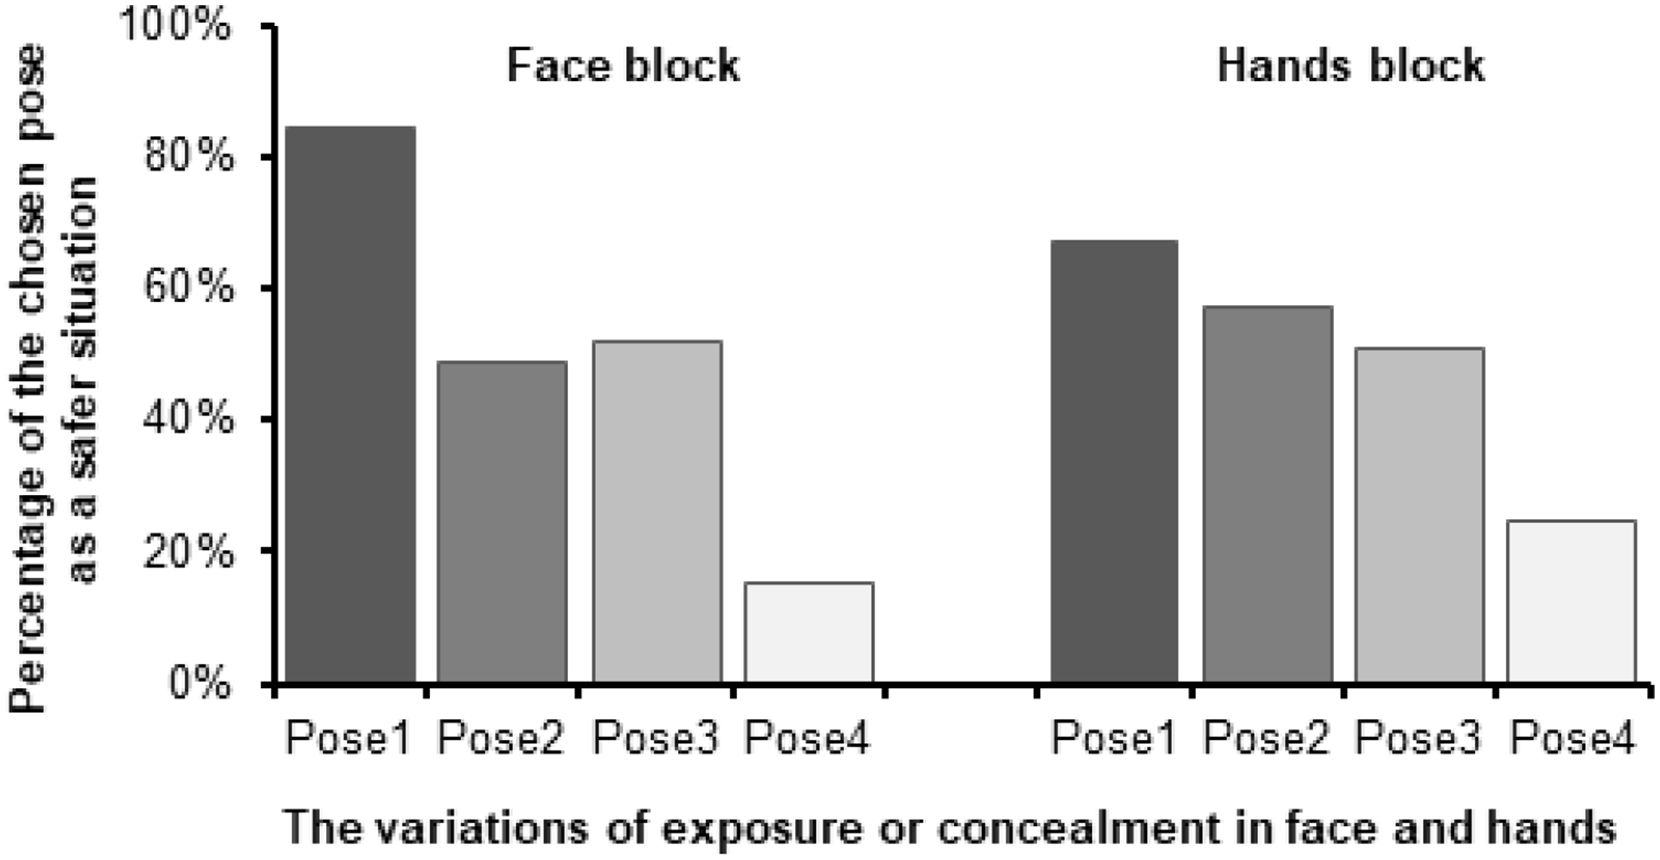
Percentage of votes for each pose as the safer, for each block. The poses are illustrated in Table 2
Median safety rating for each pose across all actors and for each block. The poses are illustrated in Table 2
In both blocks of trials, there were eight null-condition pairs. If position bias was not a significant factor, then the left and right images would each be identified as safer in 50% of the null-condition trials. In fact, the right-hand image was considered safer in 63% of null-condition trials in the face block and 66% of the hands block, suggesting a tendency to indicate the right-hand image more frequently than the left-hand image. The Z-test suggests that bias to the right-hand image in null-condition trials is significant (z = 9.02, p < 0.05).
However, while the null-condition trials revealed a significant bias towards the right-hand image, this trend was not revealed between images within the main data. In the main data, the right-hand image was considered safer in 49% of main trials in the face block and 51% of the hands block, and the Z-test does not suggest a significant bias (z = −34.25, p < 0.05) to the right-hand image in the main data trials. In any case, image position was randomised to offset position bias as recommended. 35
Two background scenes were used, each used in trials by a different sample of 22 test participants. Comparison using the Mann–Whitney test did not suggest a significant difference between the background scenes. In further analyses, the data were reorganised as one set of 44 test participants and the background scene was ignored.
The percentages of votes for an image being considered safer are shown in Figure 7: the significance of differences between poses are shown in Table 5, these being determined using Dunn-Rankin Variance Stable Rank Sums (VSRS). 37 Face concealment shows a gradual reduction in votes for being the safer situation as the face changes from fully exposed (84%) to fully concealed (15%) (Figure 7). The Dunn-Rankin test did not suggest significant difference between (pose 3) top-concealed and (pose 2) bottom-concealed faces, but differences between the other poses (1 vs 2, 1 vs 3, 1 vs 4, 2 vs 4, 3 vs 4) were suggested to be significant (p < 0.01) (Table 5). In summary, pose 1 where the face was not concealed was suggested to be significantly safer than either of poses 2, 3 or 4, where the face was at least partially concealed by clothing.
Significance of differences between poses found using paired comparisons, in the face and hands blocks, as determined using Dunn-Rankin VSRS
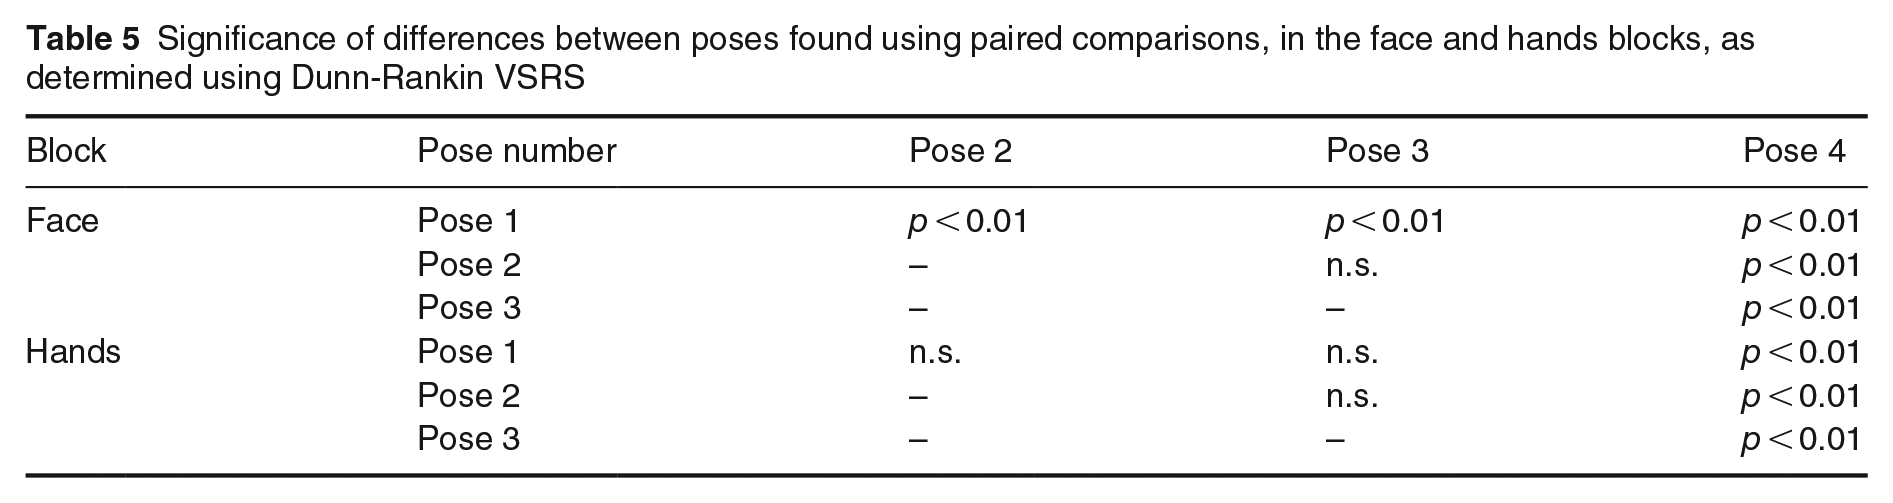
Hand concealment shows (Figure 7) a slight and gradual reduction in safety votes as the hands changed from being fully exposed (67%) to fully concealed (25%): when hand exposure was reduced by placing the hands in pockets or behind the body, the feeling of safety was reduced. Poses 2 and 3 received similar numbers of votes for being the safer situation, with a difference between them of only 6%. The Dunn-Rankin test suggested significant difference (p < 0.01) between pose 4 (hands behind) with all the other hands positions (side, front, pocket). Differences between poses 1 and 3 were not suggested to be significant (Table 5).
Figures 5 and 6 suggest an effect of gender, with the female actors being evaluated as safer than the male actors, confirming the findings of the pilot study. 28 This difference is expected because males are considered to be more fearless and fear provoking than females.38,39
4. Limitations
We note here three limitations of the experiment. First, the current results may be influenced by the nature of the images shown to subjects in trials. For example, test participants may have reported the covered face as less safe than the exposed face because they thought that was the expected response. This is an example of participant bias, where participants adjust their behaviour in relation to what they perceive to be the experimenter’s expectations. 40 A further experiment is therefore being planned where evaluations of other people will be explored using eye tracking instead of subjective evaluation.
Second, the current results were obtained from a young test sample (18–34 years) and should be verified in further work with groups who might respond differently to the young, for example, the elderly, and people with impaired mobility. Compared with the young, the elderly are more likely to have reduced visual function, reduced physical mobility and as pedestrians they are at greater risk of fatality from road traffic crashes and express greater vulnerability to personal attack.41–44 Using a broader sampling group also promotes data which better represent society. If, for example, the elderly place greater emphasis on visibility of the hands for their safety evaluations than do the young, then this might change the conclusion of which (the face or hands) is the more important visual cue.
Third, this work was conducted in a laboratory with target images projected onto a screen: further research is needed to determine the extent to which the evaluations can be generalised to those made in real outdoor settings. The differences in these settings include degree of insecurity imposed by the actors and the environment and image characteristics of the observed scenes.
5. Conclusion
This paper investigates the visual cues used by pedestrians when evaluating how safe they feel when encountering other people when walking after dark. Following the findings of a pilot study, an experiment was conducted to compare safety evaluations associated with changes in the degree to which other people’s faces and hands could be seen, rather than being concealed by clothing. It was proposed that changes in face or hand concealment would lead to larger changes in safety evaluation for the item more critical to the safety evaluation. The experiment used two procedures (category rating and paired comparisons) for evaluating safety with a series of actors in poses with different degrees of hand and face concealment. Evaluations of safety reduced as the face and hands became more concealed, and this change was greater for the face than for the hands. It was therefore concluded that the face is a more important visual cue than are the hands, and this conclusion was drawn from the results of both procedures. This supports the assumption in previous lighting research that the face is an important visual cue for the interpersonal evaluations necessary for a pedestrian to feel safe.
Footnotes
Declaration of conflicting interests
The authors declared no potential conflicts of interest with respect to the research, authorship, and/or publication of this article.
Funding
The authors disclosed receipt of the following financial support for the research, authorship, and/or publication of this article: This work was funded by Al-Baha University, Saudi Arabia.