
Abstract
In a three-day field study among 61 university students, we collected data on self-reported light-emitting screen activities (watching TV/series and using social media) and other behaviours (physical activity and food intake) during the 2 hours before bedtime and examined interrelations with self-reported sleep duration and quality. Students spent on average 19 minutes on screens using social media and 29 minutes watching TV/series before going to bed. Linear mixed model analyses revealed that a 10-minute increase in pre-bedtime social media use was associated with a significant decrease in sleep duration of 7 minutes, while 10 extra minutes of watching TV/series tended to increase sleep duration by 3 minutes. Physical activity and food intake before bedtime, and total screen time in bed were not significantly related to sleep duration. Subjective sleep quality was not significantly correlated with any of the investigated pre-sleep activities. In line with previous research, these findings suggest that the influence of pre-bedtime light-emitting screen use on sleep duration might be (partly) attributable to differences in screen activities. Discriminating between various types of screen activities is important when researching and developing recommendations for pre-bedtime behavioural strategies that are supportive for sleep, (school) performance and health.
1. Introduction
The increased use of light-emitting screens before bedtime, especially in adolescents and young adults, 1,2 is expected to be an important contributing factor to sleep disturbances. 3–5 It is known that light exposure in the evening (close to bedtime) can suppress melatonin production, delay sleep timing and decrease total sleep duration. 6,7
To date, several controlled experimental studies have investigated the effects of using light-emitting devices before bedtime on circadian phase shifting, melatonin production, core body temperature (CBT) and sleep quality. 8–14 Overall, these studies indicate that extensive screen use before bedtime (2 to 5 hours) and more blue-rich evening light exposures increase melatonin suppression, core body temperature and time to fall asleep, and decrease next-morning levels of alertness. It should be noted that realistic light measurements of different types of regularly used light-emitting devices show that the illuminance (measured at eye level) as produced by the screen usually remains below 50 lux in a sitting position, while using the screen in a lying position can result in higher illuminances due to the smaller viewing distance. 15,16 In addition, the recently CIE developed melanopic equivalent day light illuminance (EDI) values (at eye level) of mobile phone screens typically remain below 50 lux at a viewing distance of 150 mm. 17 They may only show slightly higher illuminance and melanopic EDI values in case of uniform white screens at maximum brightness settings. 17
In experimental studies where screen illuminance at the eye was below 20 lux 18,19 no significant effects of screen exposure on evening melatonin levels were found. Moreover, Rångtell et al. 20 found similar increases in melatonin concentrations when reading a self-luminous tablet peaking in the blue part (458 nm) of the light spectrum (∼102 lux at eye level) or reading a physical book (∼67 lux at eye level) in the evening (21:00–23:00) for participants who were exposed to sufficiently bright light levels during the 6.5 hours prior to the reading (∼569 lux at eye level). In addition, polysomnography sleep indicators (i.e. sleep onset latency, total sleep time, wake after sleep onset and sleep stages) were also not different between the two conditions. Other studies have also revealed that increased light exposures earlier in the day can attenuate the disruptive effects of evening light exposure on melatonin, circadian rhythms and sleep. 20–22 These findings suggests that the photic light history during the day may prevent the potential light-induced sleep-disrupting effects of screen use in the evening.
In most laboratory studies the type of device and the activities conducted on the devices are fixed. However, light-emitting screen use in real-life is likely to be more intermittent, with light emission that is more variable in intensity and spectrum compared to controlled screen use in laboratory experiments. Furthermore, various types of devices are typically used across the evening (i.e. phone, laptop, tablet, TV), and the activities executed on these devices are not restricted. Moreover, some screen activities can be seen as more passive (i.e. watching or reading) while others are more active (i.e. chatting, gaming, posting, or reacting to online content). It has been hypothesised that certain pre-sleep screen activities can induce cognitive hyperarousal (i.e. being mentally active and alert) 23,24 and may also play an important role in evoking sleep-disturbing effects. 25,26 This hypothesis is corroborated by a recent large-scale survey study conducted in the Netherlands 27 which reported that, in adolescents (N = 662), watching more TV during the hour before bedtime was associated with significantly longer sleep duration (i.e. on average 20 minutes longer per night). In contrast, spending more time on the computer, smartphone or tablet during the hour before bedtime was associated with a later bedtime and shorter sleep duration. Of these devices, smartphone use was associated with the largest decrease in sleep duration (i.e. on average 35 minutes shorter per night). While their intervention study 27 (N = 55; adolescents aged 12–18 years) revealed that blocking screen-related blue light exposure could reduce sleep complaints and improve daytime functioning, the findings of their survey suggest that – in addition to these light effects – various types of pre-sleep screen activities may have different relationships with total sleep duration. Lastly, a recent intervention study in adolescents (N = 183; aged 12–19 years) revealed that reducing total screen time for 2 weeks after 21:00 significantly correlated with earlier sleep onset time and increased sleep duration. 28 However, their analysis revealed that this improvement was only established by reducing computer screen time (i.e. video games, watching online videos and social media) but not by reducing screen time spent on watching TV, which did not explain any variance in sleep duration.
Although light exposure close to bedtime is considered to be an important and major sleep-disturbing factor, other pre-sleep behaviours such as food intake and physical activity can also affect sleep timing and/or quality. 29–35 With respect to food intake, eating close to bedtime may create a circadian feedback loop from peripheral tissues (i.e. organs) to the brain which can potentially affect sleep-wake timing. 36–38 This mechanism may become more relevant in case of irregular and/or low-amplitude light-dark cycles.
Physical activity close to bedtime can compromise sleep directly (i.e. by increasing CBT) or indirectly (i.e. by strengthening the influence of light exposure on shifting of the circadian melatonin rhythm). 33,39 However, this has only been established in highly controlled laboratory studies. A recent review did not find support for the hypothesis that evening exercise in general negatively affects sleep, 40 only vigorous exercise ending 1 hour or less before bedtime was found to significantly reduce total sleep duration via increased sleep onset latency (SOL).
Earlier studies investigating the relationship between pre-bedtime screen use and sleep indicators were either conducted by means of a single retrospective survey or executed under highly controlled laboratory conditions. These experiments typically involved fixed and continuous screen use, at (close to) maximum screen brightness settings, in dim surroundings, and often applied a dim light adaptation period and/or a constant routine protocol. The current 3-day field study collected data from healthy university students in real-life situations on self-reported pre-bedtime light-emitting screen use distinguishing between passive use (watching TV/series) and active use (using social media), and other pre-bedtime behaviours (physical activity and food intake) and examined interrelations between these parameters and self-reported sleep duration and quality. Based on previous findings from van Kerkhof et al., 27 we hypothesised that during the 2 hours before bedtime, (i) more social media usage on a light-emitting device is associated with decreased self-reported sleep duration and quality, and that (ii) watching more TV/series is associated with increased self-reported sleep duration and quality. In addition, we explored to what extent other pre-bedtime behaviours (i.e. physical activity and food intake) were correlated with self-reported sleep duration and sleep quality.
2. Method
2.1 Design
The current observational study employed an Experience Sampling Method (ESM) protocol of three consecutive days during which participants completed a daily diary between 09:00 and 13:00 by means of their mobile phone. The daily diary was administered using a momentary assessment smartphone application (MetricWire, Canada) and contained questions on sleep timing and quality during the previous night (dependent variables). It also probed social media usage, watching TV/series, physical activity and food intake during the 2 hours before going to bed, and screen use in bed (independent variables). The study protocol was approved by the internal ethical board of the Eindhoven University of Technology.
2.2 Participants
Sixty-one undergraduate students of the Eindhoven University of Technology participated in the study. Of these participants, 27 were male and 34 were female, with a mean age of 21.6 (SD = 0.21, range 20–27).
2.3 Measurements
2.3.1 Chronotype
Participants’ chronotype score was examined using the Munich Chronotype questionnaire (MCTQ). 41 Chronotype scores (i.e. midsleep on free days corrected for sleep debt on school or work days) were calculated using the formula described by Roenneberg et al. 42
2.3.2 Sleep timing and quality
Items from the Consensus Sleep Diary (CSD) 43 were used to assess sleep timing. These items included: time of going to bed, time of going to sleep (referring to the time participants started trying to go to sleep), minutes needed to fall asleep, number of awakenings, the total duration of all awakenings in minutes, wake-up time, alarm use (yes/no), and time of getting out of bed. Regarding sleep quality, three items on a scale from 1 to 7 were used. One item probed overall sleep quality (very bad (1)–very good (7)), one probed how easy-difficult it was to fall asleep last night (very easy (1)–very difficult (7)), and one probed how refreshed participants felt after waking up in the morning (not at all refreshed (1)–very refreshed (7)).
2.3.3 Social media use and watching TV
Social media usage and TV/films/series watching during the previous evening were measured by asking participants the total number of minutes they spent on each of these activities during the 2 hours before going to bed. Social media use was specified as using a social media app on a laptop/computer, smartphone, or tablet. The most popular social media apps were given as an example in the question (i.e. WhatsApp, Facebook, Snapchat, Instagram and similar platforms). In addition, the cumulative number of minutes of screen use in bed was measured with one item. This item included all types of screen use (i.e. watching TV and social media use, as well as laptop, tablet, and phone use for other purposes).
2.3.4 Physical activity
Physical activity was measured by asking the number of minutes people were physically active during the 2 hours before going to bed. Being physically active was specified as doing some form of sports, including biking or walking outside, or using a fitness device for more than 5 minutes at once.
2.3.5 Food intake
Food intake during the 2 hours before bedtime was measured by first asking whether participants ate or drank something other than water or tea (without milk and sugar) during the 2 hours before bedtime (Yes/No). In case they answered yes, they were able to specify what they ate in an open question. Moreover, all participants were asked to provide the latest time that they ate or drank something (other than water or tea) during the previous day.
2.4 Procedure
All participants in this study were students from a course on quantitative research at the Eindhoven University of Technology. Participants were invited to a meeting room at the main building of the university where they read and signed an informed consent form and received instructions about installing the ESM application on their phone. Participants all received the instructions one day prior to the start of the first morning questionnaire. During the instruction meeting, they also completed a demographic questionnaire and the MCTQ. Participants all received a unique ID number which they reported in each of the three morning questionnaires. The morning questionnaire included all items described in Sections 2.3.2 to 2.3.5. During the subsequent three days, participants received a message at 09:00 on their phone to complete the morning questionnaire, with a reminder (when needed) to fill in the questionnaire at 11:00. When no questionnaire data was received at 13:00, the message was taken down and the data were considered missing. Data collection occurred during three consecutive days from 19 to 21 December 2019 or from 7 to 9 January 2020.
2.5 Statistical analysis
The dependent variable sleep duration represented the time difference between the self-reported time of going to sleep and the self-reported time of waking up minus self-reported SOL and the total time awake. A sleep diary value was coded as missing when an illogical entry was received. For instance, when the reported time of going to bed was later than the reported time of going to sleep; or in case of obvious reporting errors (for instance when 10:30 was reported as ‘time of going to bed’ while a 24-hour reporting scale was asked for). Sleep quality was the average of ratings of overall sleep quality and ratings of how refreshed participants felt after getting up (Cronbach’s α = 0.72). When easiness to fall asleep was also included in this variable, Cronbach’s α was much lower (0.58).
The primary independent variables were the duration (in minutes) of (i) social media use and (ii) watching TV, both during the 2 hours before bedtime. Secondary independent variables were the duration of physical activity (in minutes) during the 2 hours before going to bed and time of last food intake. Specifically, for food intake analyses were conducted using a dichotomous variable of food intake during the 2 hours before bedtime (Yes/No), as well as a continuous variable specifying the amount of time (in minutes) between time of last food/drink intake and the time of going to go sleep. For the variable reflecting the time of last food/drink intake, the time of going to go to sleep instead of going to bed was used in the calculation, as there were a couple of cases in which a participant reported food intake after getting into bed but before going to sleep. Two values in this variable were set to zero since food intake was reported a couple of minutes after the time of going to sleep. Lastly, the total time (in minutes) of screen use in bed (on any device) was also investigated as a secondary independent variable.
Before conducting the main analyses, correlations between the independent variables were examined to check for multicollinearity. When no significant correlations were found between predictor variables, independent variables were tested in the same model to compare the relative strength of each predictor on self-reported sleep duration and sleep quality.
Linear Mixed Model (LMM) analyses in SPSS version 23 were used to investigate the interrelations between self-reported pre-sleep activities and sleep duration and sleep quality. Due to the nested data, participant ID was added as a random intercept in each model. Each analysis was corrected for chronotype value (except for food intake due to collinearity), measurement day (day 1, 2, or 3), and measurement period (December vs. January) by including them as covariates in the analyses. When a significant relationship (p < 0.05) or a suggested trend (p < 0.1) between one of the pre-sleep activities and sleep duration was found, explorative LMM analyses were conducted with the other sleep timing indicators as dependent variables (i.e. time of going to bed, time of going to sleep, SOL, total time of awakenings, wake-up time and time out of bed) to examine which aspect of sleep timing was mostly affected by the activity. Full statistics of the (explorative) analyses were only reported in case p < 0.1.
3. Results
3.1 Descriptive statistics
Means, standard deviations, minimum and maximum values of the dependent and independent variables
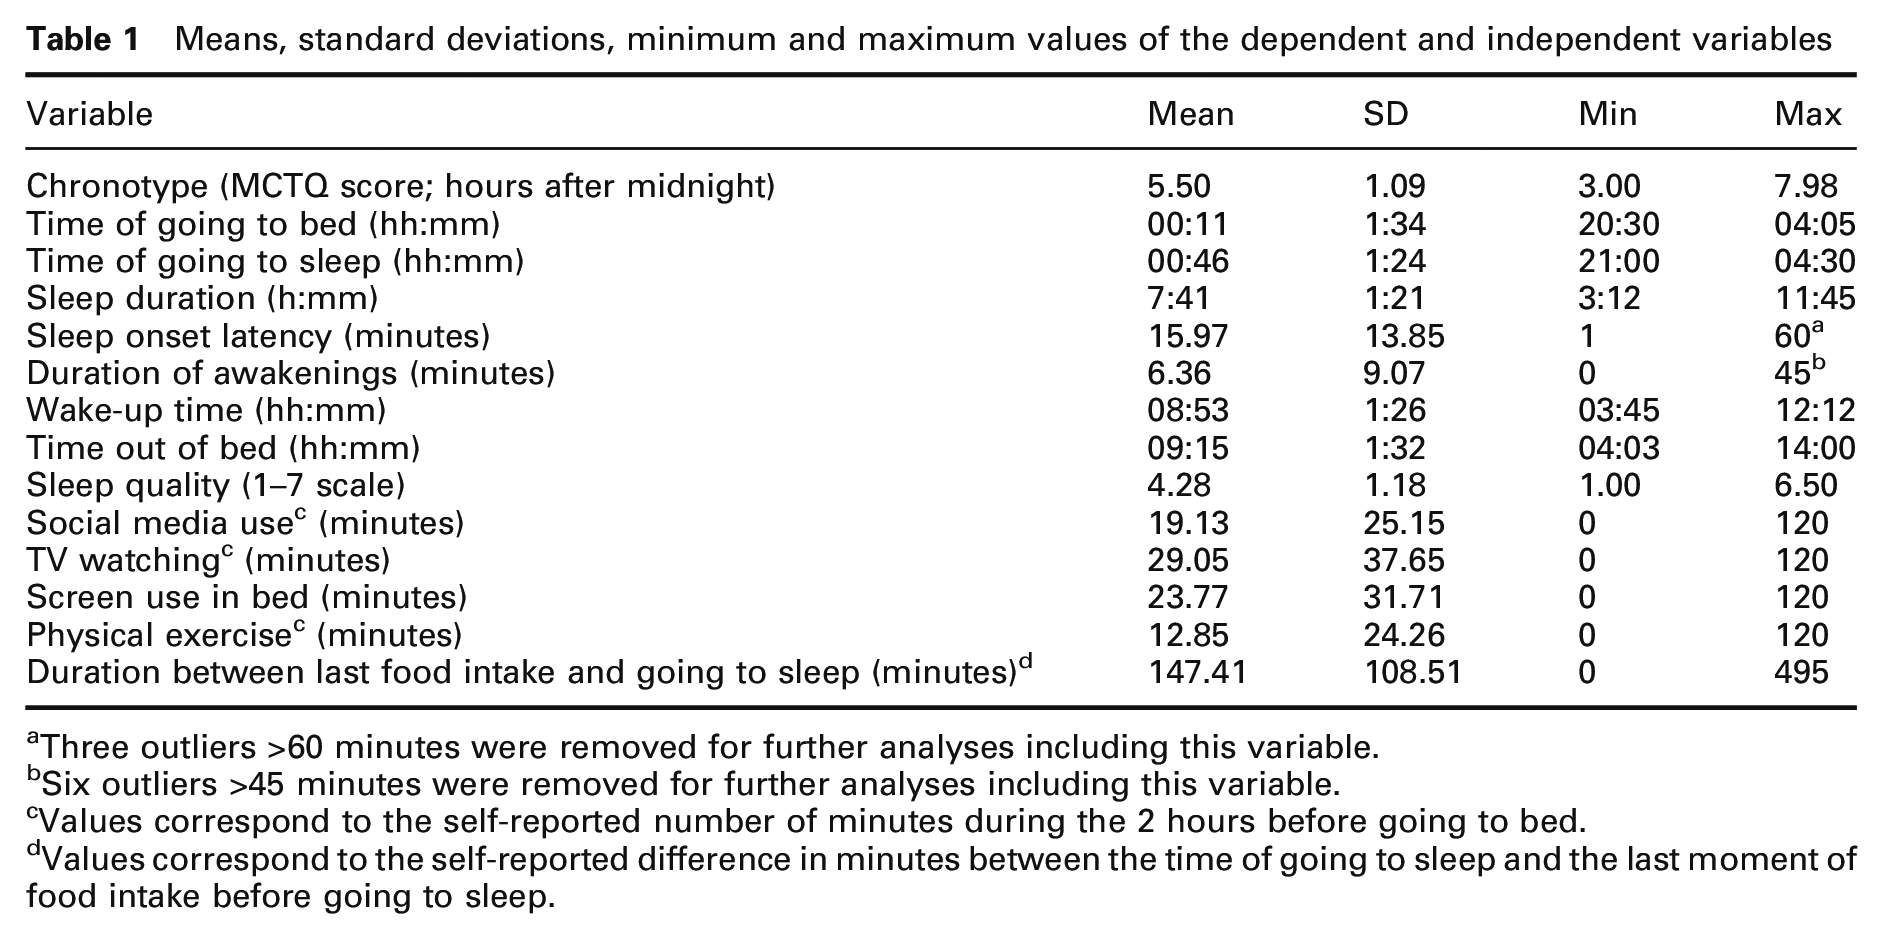
aThree outliers >60 minutes were removed for further analyses including this variable.
bSix outliers >45 minutes were removed for further analyses including this variable.
cValues correspond to the self-reported number of minutes during the 2 hours before going to bed.
dValues correspond to the self-reported difference in minutes between the time of going to sleep and the last moment of food intake before going to sleep.
3.2 Correlations between independent variables
Pearson’s correlations between the independent variables analysed in this study
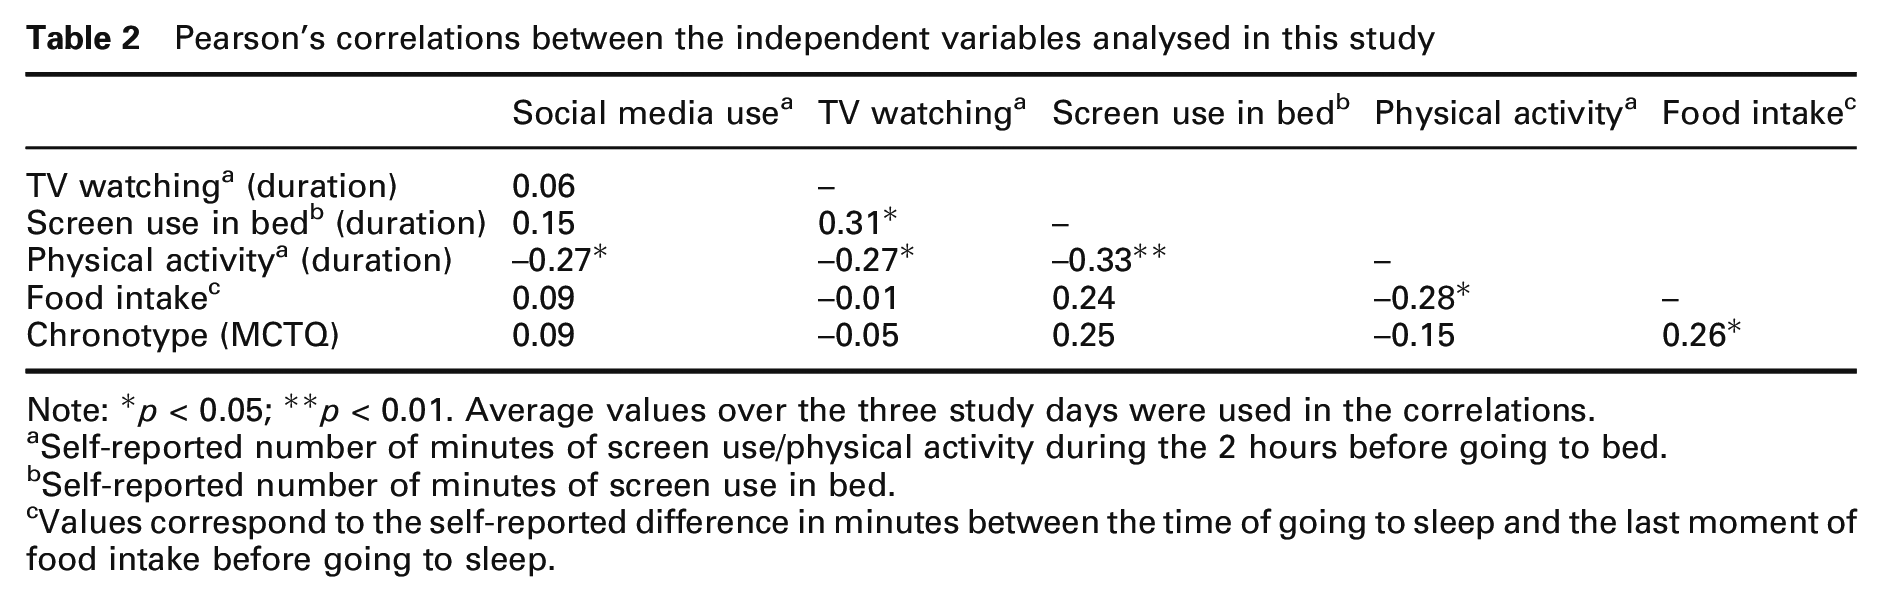
Note: *p < 0.05; **p < 0.01. Average values over the three study days were used in the correlations.
aSelf-reported number of minutes of screen use/physical activity during the 2 hours before going to bed.
bSelf-reported number of minutes of screen use in bed.
cValues correspond to the self-reported difference in minutes between the time of going to sleep and the last moment of food intake before going to sleep.
3.3 Relationships between screen use and self-reported sleep duration and quality
Linear mixed model analyses: key findings of relationships between pre-bedtime activities and sleep indicators
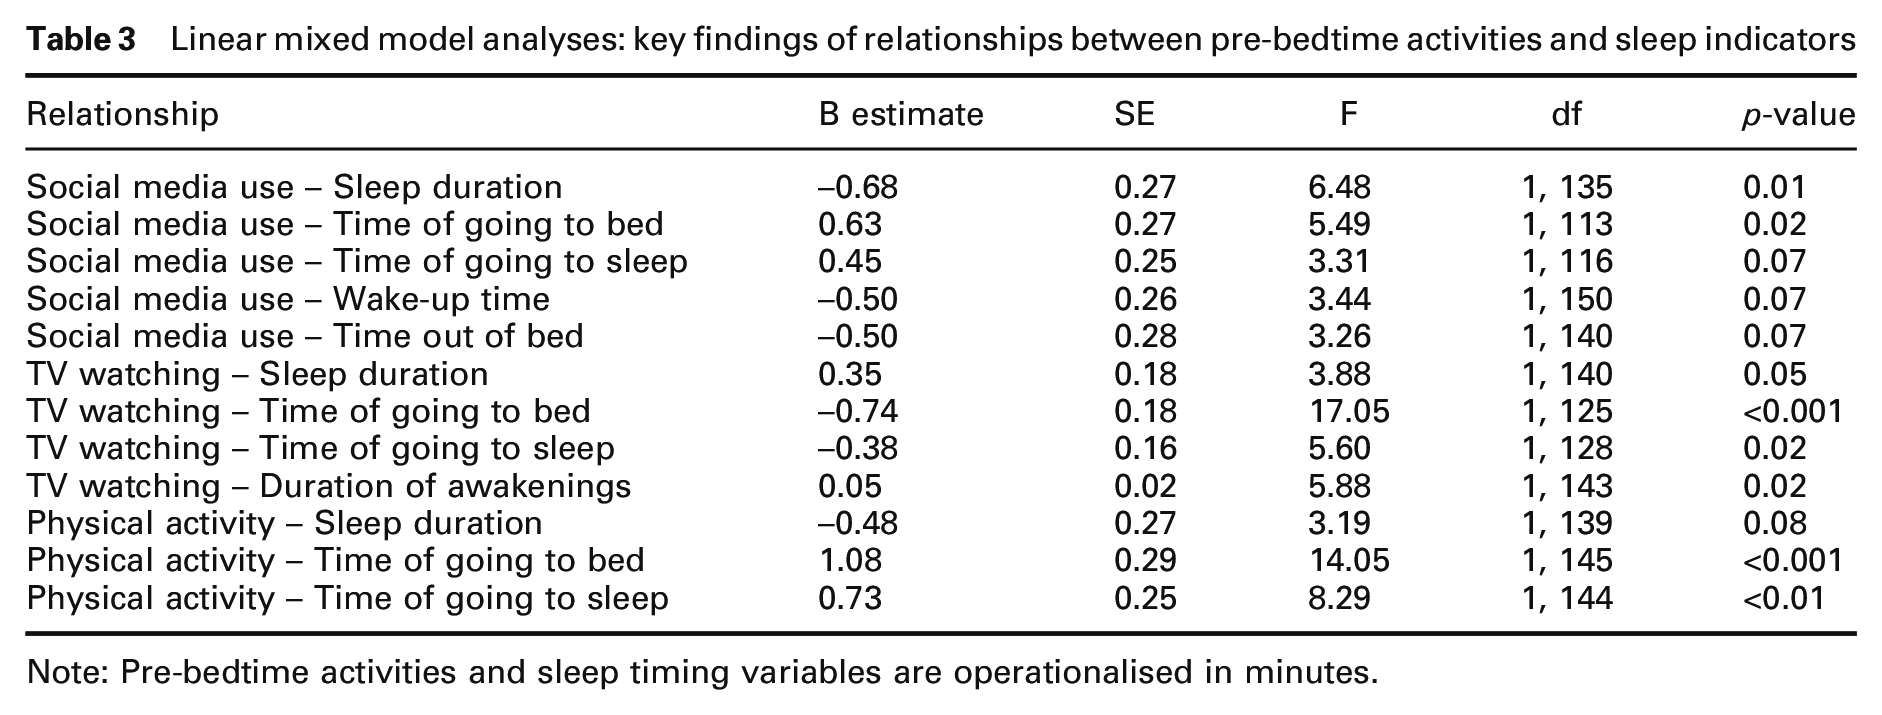
Note: Pre-bedtime activities and sleep timing variables are operationalised in minutes.
In contrast, results revealed that watching more TV during the 2 hours before bedtime was associated with a near-significant increase in self-reported sleep duration. That is, for every 10 minutes of watching TV during the 2 hours before going to bed, sleep duration increased with more than 3 minutes (95% CI = 0, 7). Explorative analyses indicated that for every 10 minutes of watching TV during the 2 hours before bedtime, time of going to go to bed was approximately 7 minutes earlier (95% CI = −11, −4), and time of going to sleep was almost 4 minutes earlier (95% CI = −7, −1). Findings further revealed that with every 10 minutes of pre-bedtime TV watching total time awake during the night slightly, but significantly, increased with approximately half a minute (95% CI = 0, 1). SOL, wake-up time and time out of bed were not significantly correlated with watching TV before bedtime.
Analyses revealed that watching TV and using social media before going to bed were not significantly associated with subjective sleep quality. Furthermore, total screen time in bed before going to sleep was not significantly related to self-reported sleep duration nor to subjective sleep quality.
3.4 Relationships between physical activity and self-reported sleep duration and quality
Results showed a slight, but non-significant, reduction in self-reported sleep duration of approximately 5 minutes (95% CI = −10, 1) for every 10 minutes of physical activity during the 2 hours before bedtime. This was mainly due to significantly later times of going to bed and times of going to sleep (see Table 3). For every 10 minutes of physical activity, time of going to go to bed was almost 11 minutes later (95% CI = 5, 17), and time of going to sleep was approximately 10 minutes later (95% CI = 2, 12). Physical activity before bedtime was not significantly associated with SOL, total time of awakenings, wake-up time and time out of bed. Physical activity before bedtime was also not significantly associated with subjective sleep quality.
3.5 Relationships between food intake and self-reported sleep duration and quality
There was no significant association between food intake (Y/N) during the 2 hours before going to bed and subjective sleep duration or sleep quality. Similarly, the number of minutes between the last time of food intake and the time of going to sleep was not significantly correlated with self-reported sleep duration or sleep quality.
4. Discussion
4.1 The current study
The increased use of light-emitting screens in the evening 1,2 has stimulated new research examining the potential negative consequences of pre-sleep screen activities on health and particularly sleep. Previous controlled laboratory studies showed inconclusive results regarding the influence of evening or night-time light-emitting screens use on melatonin suppression and other sleep-related indicators. 8–14,18–20 In addition, recent research suggests that the type of activity (active vs. passive) conducted on the screen may be an important contributing factor for subsequent sleep duration. 27,28 The findings of the current study revealed that, on average, every 10 minutes of self-reported social media use during the 2 hours before bedtime was associated with a significant decrease in self-reported sleep duration by approximately 7 minutes, while every 10 minutes of watching TV tended to be associated with an increase in self-reported sleep duration with approximately 3 minutes. No significant association was found between the amount of screen use in bed and self-reported sleep duration. Regarding the other pre-sleep behaviours, more physical activity during the 2 hours before bedtime was associated with a significantly delayed self-reported time of going to bed and time of going to sleep, which tended to reduce total sleep duration. There was no significant correlation between the last timing of food intake before going to sleep and self-reported sleep duration. Furthermore, subjective sleep quality was not significantly correlated with any of the investigated pre-sleep activities.
4.2 Pre-sleep light-emitting screen use
The results from the current study regarding light-emitting screen use are in line with those of van Kerkhof et al., 27 showing that more social media usage close to bedtime was associated with a significant decrease in self-reported sleep duration while watching more TV tended to increase self-reported sleep duration. In the current study, these associations were found to be mainly due to changes in the time of getting into bed and time of going to sleep, which were significantly delayed after more social media use and significantly advanced after watching more TV.
At this point, we can only speculate about the potential underlying mechanisms for the contrasting interrelations between pre-bedtime TV watching versus social media use on the one side and sleep duration on the other side. First, there may be differences in screen light exposure (at the eye) when watching TV or series (i.e. usually TV or laptop screens) compared to using social media (i.e. usually smartphone or laptop screens), depending on viewing distance and angle, and the brightness setting of the devices. 15,16 Previous research investigating the melatonin-suppressing effects of pre-bedtime laptop and TV screen use in the lower illuminance range (7–17 lux at the eye) revealed no melatonin-suppressing effects. 18,19 However, depending on individual sensitivity to light, illuminance values at the eye around 25 lux (or higher) may still substantially reduce melatonin levels compared to dim light. 44 Yet, it is still inconclusive whether potential light-induced melatonin suppression from typical evening screen use in real-life situations is sufficient to introduce sleep disturbances. For example, previous research found a rather weak correlation between melatonin suppression at night and subjective feelings of sleepiness. 45 Moreover, in real-life settings, where people usually have relatively brighter light exposure during the day, prior bright light exposure may help to attenuate the potential disruptive effects of evening exposure to light-emitting screens on sleep. 20–22
Another explanation for the influence of pre-bedtime screen use on sleep may relate to the type of screen activity and how much cognitive arousal it evokes. 24,25,27 Passively watching TV may create less pre-sleep cognitive arousal compared to more active social media usage. 24 This may result in earlier feelings of tiredness when watching TV compared to using social media. This hypothesis merits further investigation in future research focussing on pre-sleep cognitive arousal as a potential mediator between different screen activities and sleep indicators.
Watching TV, as opposed to using social media, may also encourage earlier bedtimes because it is a more confined activity with a clear ending. That is, after a TV show or movie has ended, the end of the activity is achieved and this may prompt someone to go to bed, especially when one is already feeling tired. Social media usage is usually not a confined activity and can continue as long as a next message and/or content in general appears and captures the attention of the user. Previously, researchers have defined this as the displacement hypothesis (i.e. pre-sleep activities displacing sleep time), 5,46 which may be more pronounced for using social media compared to watching TV before bedtime. This hypothesis is in line with findings from a recent study showing that young adults who were categorised as high bedtime procrastinators spend significantly more time on social media close to bedtime. 26 In line with this finding, previous research has demonstrated that social media usage may increase fear of missing out, which can subsequently lead to more late-night social media use as well as increased pre-sleep cognitive arousal. 47 Via this mechanism, social media usage may postpone bedtimes to a larger extent than watching TV. However, it should be noted that the current study did not differentiate between watching regular TV programs and watching streaming services such as Netflix (series). The latter likely has more potential to increase bedtime procrastination and it is of interest to further investigate how this activity compares to social media use before bedtime.
More social media use close to bedtime was not only related to a delayed time of going to bed, but also to an earlier time of waking up and getting out of bed. Although this is not necessarily undesirable, when combined with postponed bedtimes this may lead to sub-optimal sleep duration. In the current study, we did not ask participants about their reasons regarding their time going to bed, neither about their time of getting up. However, our data showed that in two-thirds of the cases participants set an alarm clock to wake up. There was no significant difference between setting an alarm clock (Yes/No) and amount of pre-sleep social media usage during the previous night. Further research is warranted to explore if and why people are more likely to wake up earlier (i.e. potentially before their alarm) when using social media close to bedtime.
The current study found no significant relationship between self-reported screen use in bed (i.e. before trying to go to sleep) and self-reported sleep duration. This finding seems surprising, as more screen use in bed, close to the sleep period, is expected to be more sleep disturbing (for instance due to hyperarousal and/or melatonin suppression) than screen use prior to getting into bed. However, in this study, the in-bed screen use variable did not discriminate between different types of screen activities which may have different relationships (i.e. positive or negative) with sleep duration. Interestingly, a previous study also reported that screen usage with relatively little diversity in media activities was associated with a reduction in sleep duration, while screen use with a greater diversity in the types of activities was related to an increase in sleep duration. 48 These findings suggest that certain types of pre-sleep screen activities may be more or less disruptive to sleep than others.
4.3 Pre-sleep physical activity and food intake
The findings of this study indicated that a somewhat (non-significant) shorter self-reported sleep duration was associated with more self-reported pre-sleep physical activity. Explorative analyses showed significant associations between more physical activity during the 2 hours before going to bed and a later time of going to bed and to sleep. Previous findings regarding the impact of physical activity close to bedtime on sleep indicators have been inconsistent. 33,39,40 However, a large meta-analysis revealed that vigorous exercise ending 1 hour or less before bedtime can impede SOL and total sleep duration. 40 The current findings did not confirm a potential relationship between physical activity close to bedtime and SOL. It should be noted that the current study did not distinguish between vigorous and moderate exercise, neither did it examine the amount of time elapsed between the last exercising bout and the time of going to sleep. It should further be noted that the increased physical activity close to bedtime might have delayed sleep time due to scheduled social activities or other obligations for which participants had to travel by bike or foot during the pre-sleep hours. Therefore, it would be useful for future studies to consider the context, intensity, and precise timing and duration of physical activity when investigating associations with sleep indicators.
In the current study, there was no significant correlation between the timing of the last food consumption before sleep and self-reported sleep duration and quality. Although previous research by Gill and Panda 32 demonstrated that shortening the time window of food intake can be beneficial for sleep quality, it is expected that in healthy day-active individuals non-photic time cues such as food intake and physical activity can have a potential, but usually limited role in sleep-wake regulation. Yet, in people with irregular and low-amplitude light-dark cycles (e.g. shift workers) non-photic cues may be used for sleep-wake regulation purposes. 34,35
4.4 Subjective sleep quality
Perceived sleep quality was not significantly associated with any of the investigated pre-sleep activities. The current findings suggest that the significant relationships between pre-sleep screen activities and sleep duration do not necessarily reflect simultaneous significant relationships with experienced sleep quality. It may be the case that subjective sleep quality, unlike sleep timing/duration, does not significantly correlate with pre-sleep activities on a day-to-day basis in a naturalistic setting. Future research could examine whether changing pre-sleep activities (e.g. abstaining from screen use during the hour before going to sleep) could influence subjective sleep quality either directly (i.e. during the same night), or after several nights.
4.5 Limitations and future research
An important limitation of the current study is that it only used self-reported parameters. Ideally, future studies should include objective measures of physical activity and sleep indicators (e.g. actigraphy). Overall, previous research revealed moderate to good agreement between daily sleep diaries and actigraphy for measuring total sleep duration, but slight overestimations have consistently been reported for subjective compared to objective measurements. 49–53 For social media use, mobile phone applications tracking the time spent on social media platforms may give a more objective estimation of this variable. However, using such a tracking application on participants’ personal smartphone should not conflict with ethical and privacy considerations. Lastly, it is recommended to objectively measure pre-bedtime light exposure in future studies using wearable sensors, so that the analyses regarding type of pre-sleep activity can be controlled for received light exposure. Importantly, this would also include exposure to other (non-screen related) ambient light sources which can impact sleep depending on the spectrum and illuminance used. 54–56
A second limitation of this study is that it only investigated associations between the variables and cannot infer causality. It merits to be noted that also reverse or bidirectional relationships may exist between pre-sleep (screen) activities and sleep duration. For example, individuals may reduce certain pre-sleep (screen) activities if they feel tired, for instance, due to insufficient or poor sleep during the preceding night. As a result, this may potentially lengthen sleep duration during the subsequent night. Future studies that use manipulations of pre-sleep activities in real-life conditions can help to further elucidate causal relationships between pre-sleep activities and sleep duration and/or quality.
Another interesting expansion for future research regarding screen use is to discriminate between simultaneous usage of multiple screens and single screen use. People may engage in multiple screen activities at the same time (i.e. watching TV while using social media on their laptop or phone). It is still largely unclear whether simultaneous use of multiple screens yield similar effects on sleep indicators compared to single screen use.
5. Conclusion
The current study revealed that more self-reported social media use prior to bedtime was associated with a significantly shorter self-reported sleep duration, while watching more TV tended to increase sleep duration. Self-reported physical activity and food intake before bedtime, and total screen time in bed were not significantly correlated with sleep duration. None of the investigated pre-sleep activities was significantly related to subjective sleep quality. The mixed findings in the scientific literature investigating the effects of pre-bedtime light-emitting screen use on sleep might be (at least partly) attributable to differences in screen activities across studies. Discriminating between various types of screen activities seems relevant for future research in this field and can help to develop pre-bedtime behavioural strategies that are more supportive for sleep, (school) performance and health.
Footnotes
Declaration of conflicting interests
The authors declared the following potential conflicts of interest with respect to the research, authorship, and/or publication of this article: LJM Schlangen has been an employee of Philips/Signify, the Netherlands, until July 2019. His current full-time position at the Eindhoven University of Technology is partially funded by Signify.
Funding
The authors received no financial support for the research, authorship, and/or publication of this article.